 Xinqi Ge
 Manyu Xu
 Tong Cheng
 Nan Hu2
 Pingping Sun
 Bing Lu
 Ziheng Wang
- 1Department of Clinical Biobank & Institute of Oncology, Affiliated Hospital of Nantong University, Medical School of Nantong University, Nantong, China
- 2Medical School of Nantong University, Nantong, China
- 3Department of Neurosurgery, Affiliated Hospital of Nantong University, Medical School of Nantong University, Nantong, China
- 4Centre for Precision Medicine Research and Training, Faculty of Health Sciences, University of Macau, Macau SAR, China
Background: TP53I13 is a protein coding tumor suppression gene encoded by the tumor protein p53. Overexpression of TP53I13 impedes tumor cell proliferation. Nevertheless, TP53I13 role and expression in the emergence and progression of glioma (low-grade glioma and glioblastoma) are yet to be identified. Thus, we aim to use comprehensive bioinformatics analyses to investigate TP53I13 and its prognostic value in gliomas.
Methods: Multiple databases were consulted to evaluate and assess the expression of TP53I13, such as the Cancer Genome Atlas (TCGA), the Chinese Glioma Genome Atlas (CGGA), GeneMANIA, and Gene Expression Profiling Interactive. TP53I13 expression was further explored using immunohistochemistry (IHC) and multiplex immunohistochemistry (mIHC). Through Gene Set Enrichment Analysis (GSEA), the biological functions of TP53I13 and metastatic processes associated with it were studied.
Results: The expression of TP53I13 was higher in tumor samples compared to normal samples. In samples retrieved from the TCGA and CGGA databases, high TP53I13 expression was associated with poor survival outcomes. The analysis of multivariate Cox showed that TP53I13 might be an independent prognostic marker of glioma. It was also found that increased expression of TP53I13 was significantly correlated with PRS type, status, 1p/19q codeletion status, IDH mutation status, chemotherapy, age, and tumor grade. According to CIBERSORT (Cell-type Identification by Estimating Relative Subsets of RNA Transcript), the expression of TP53I13 correlates with macrophages, neutrophils, and dendritic cells. GSEA shows a close correlation between TP53I13 and p53 signaling pathways, DNA replication, and the pentose phosphate pathway.
Conclusion: Our results reveal a close correlation between TP53I13 and gliomas. Further, TP53I13 expression could affect the survival outcomes in glioma patients. In addition, TP53I13 was an independent marker that was crucial in regulating the infiltration of immune cells into tumors. As a result of these findings, TP53I13 might represent a new biomarker of immune infiltration and prognosis in patients with gliomas.
Introduction
Gliomas are the most commonly occurring malignant adult brain tumors and include a diverse set of primary brain tumors like low-grade and high-grade gliomas (1–3). Glioblastomas account for 70~75% of all gliomas, while low-grade gliomas account for 20~25% of all gliomas (4, 5). Despite the low cases compared to glioblastomas, the low-grade gliomas can progress to glioblastomas and develop resistance to chemotherapy (6). Hence, low-grade gliomas could be lethal and malignant. Currently, multiple treatment strategies like chemotherapy, radiotherapy, and surgery are available that can improve the prognostic outcomes of glioma patients. However, the prognosis of gliomas is still grim, as the 1-year survival rate of glioma patients is inferior to 30%, and the 5-year progression-free survival (PFS) for World Health Organization (WHO) grade II and III gliomas (7, 8) is 50%. Various factors and mechanisms, including genetic and epigenetic alterations, contribute to the pathogenesis of glioma (9). Despite the efforts made to understand the mechanisms associated with glioma development, the molecular pathogenesis of gliomas remains unknown (10). Therefore, a comprehensive investigation of glioma pathogenesis and identifying critical biomarkers could be instrumental in accelerating and improving the diagnosis and treatment of gliomas.
A protein-coding gene called TP53I13 is suspected to be a tumor suppressor. TP53I13 overexpression is suggested to impede tumor cell growth. A report indicated that TP53I13 expression could be upregulated by Adriamycin-induced genotoxic stress and/or p53/TP53-dependent ultraviolet irradiation (11). Interestingly, upregulated level of TP53I13 helps to confirm that N4-Erucoyl spermidine could play a significant role in inhibiting hematological tumors (12). Therefore, an increase in TP53I13 expression could impede tumor growth in hematological cancers. Based on previous studies, it is likely that overexpression of TP53I13 in most normal tissues suppresses tumor formation. Therefore, it is compelling to postulate that a decrease in TP53I13 levels could reduce the protection against tumors.
Gliomas, however, lack a clear understanding of the role of TP53I13. For this reason, data from CGGA (http://www.cgga.org.cn) and TCGA (https://tcga-data.nci) databases were used to investigate the role of TP53I13 in gliomas. An analysis of bioinformatics revealed higher TP53I13 expression in tumor tissues. Correlation analysis between TP53I13 expression and patient survival revealed that TP53I13 overexpression was related to poor patient survival. This result suggests that a low TP53I13 level could indicate better survival outcomes. Therefore, we hypothesize that the occurrence and progression of glioma could be related to the high TP53I13 expression. As a result, we used publicly available databases, like TCGA and CGGA, to investigate the correlations between several clinical parameters and TP53I13 expression in this study. To further assess the fundamental mechanisms of TP53I13 in glioma, we evaluated the relationships between lymphocytes and TP53I13 expression in cells using TCGA, CGGA, and TIMER databases. In addition, multiplex immunohistochemistry (mIHC) was used to validate the results. A gene set enrichment analysis (GSEA), STRING, and GeneMANIA were used to investigate TP53I13 functions in gliomas. Based on the results, TP53I13 expression appears to be closely correlated with body metabolism and a number of important pathways. Accordingly, TP53I13 plays a significant role in the development of gliomas, and it can be used as a biomarker for glioma prognosis prediction.
Materials and methods
Data acquisition
From the TCGA and CGGA databases, clinical and transcriptomic data of glioma patients were retrieved. Glioma RNAseq data (mRNA_seq325 and mRNA_seq693) was retrieved from CGGA database. From the CGGA database, 1018 glioma samples were retrieved (Table 1), and 696 samples were retrieved from TCGA database (Table 2) for further analysis.
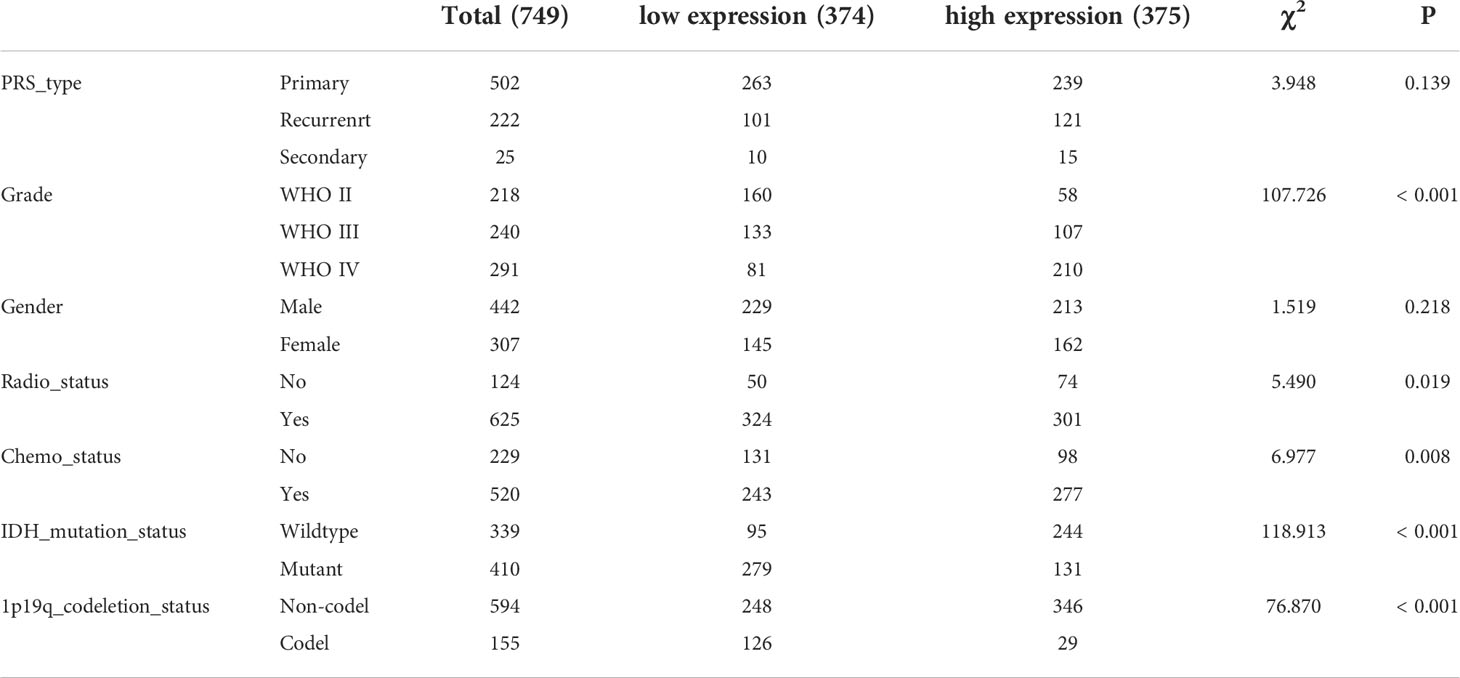
Table 1 Correlation between TP53I13 expression and different clinical factors based on CGGA.
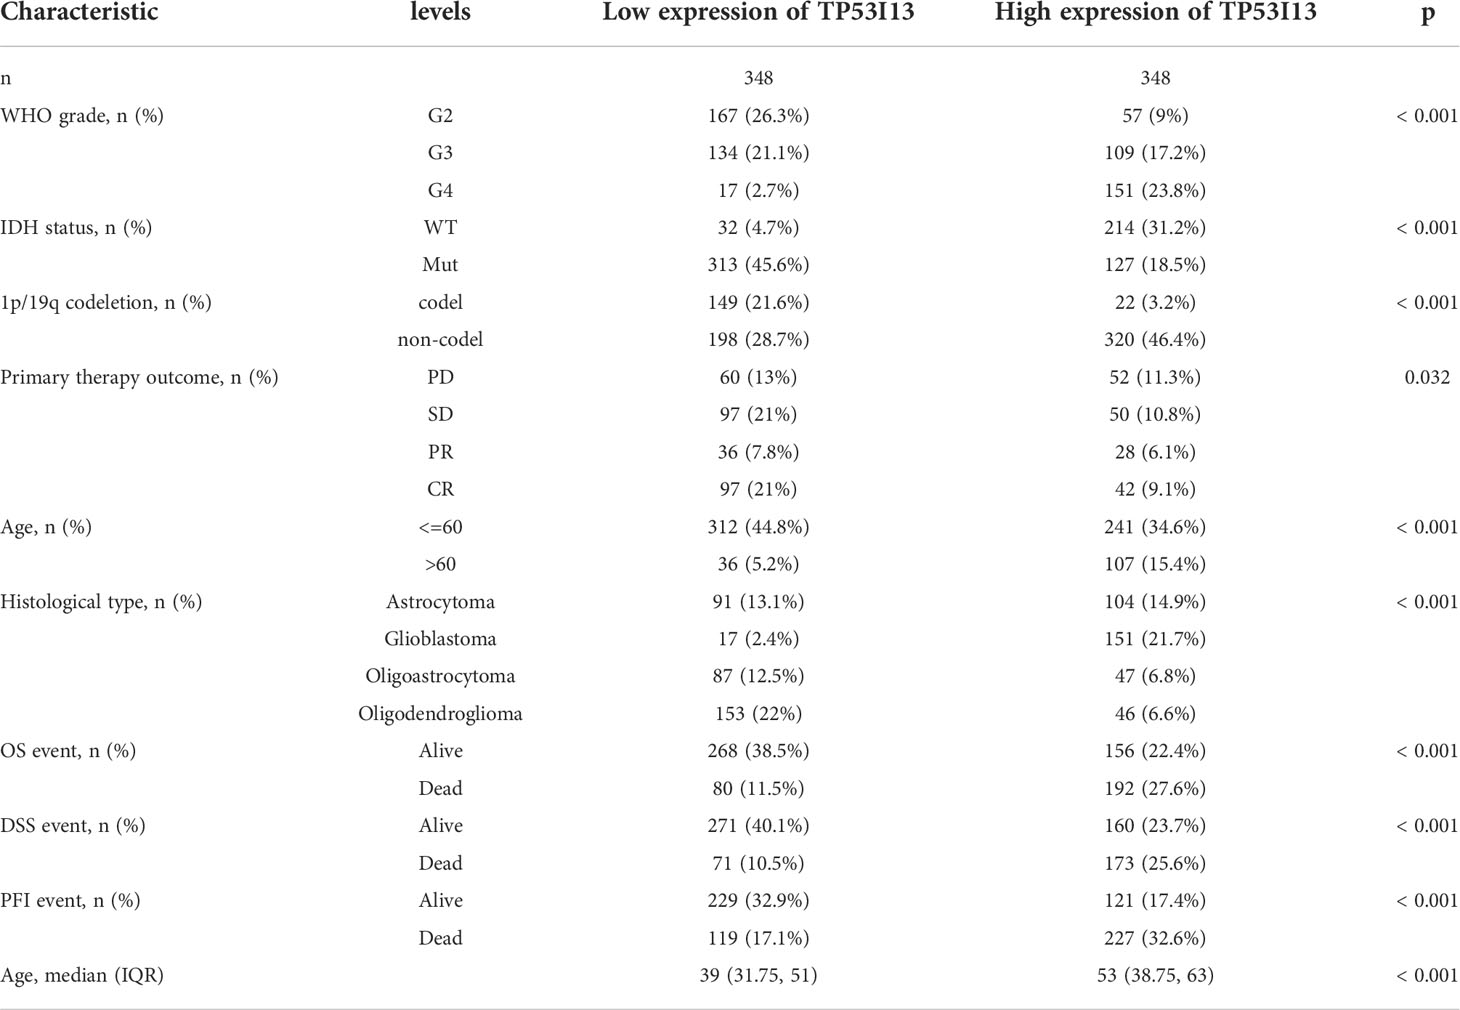
Table 2 The relationship between TP53I13 expression and different clinical factors based on TCGA.
Tissues from 183 glioma patients were collected from Nantong University Affiliated Hospital (Table 3). Samples with missing information were removed. To study the relationships between the TP53I13 expression and WHO grades, all tissues were divided into seven similar sets of tissue microarray chips (explained as tissue microarray chips 1~7, Supplementary Table 1). The independent prognostic value of TP53I13 was investigated on samples obtained from CGGA and Nantong University Affiliated Hospital (Supplementary Tables 2-3).
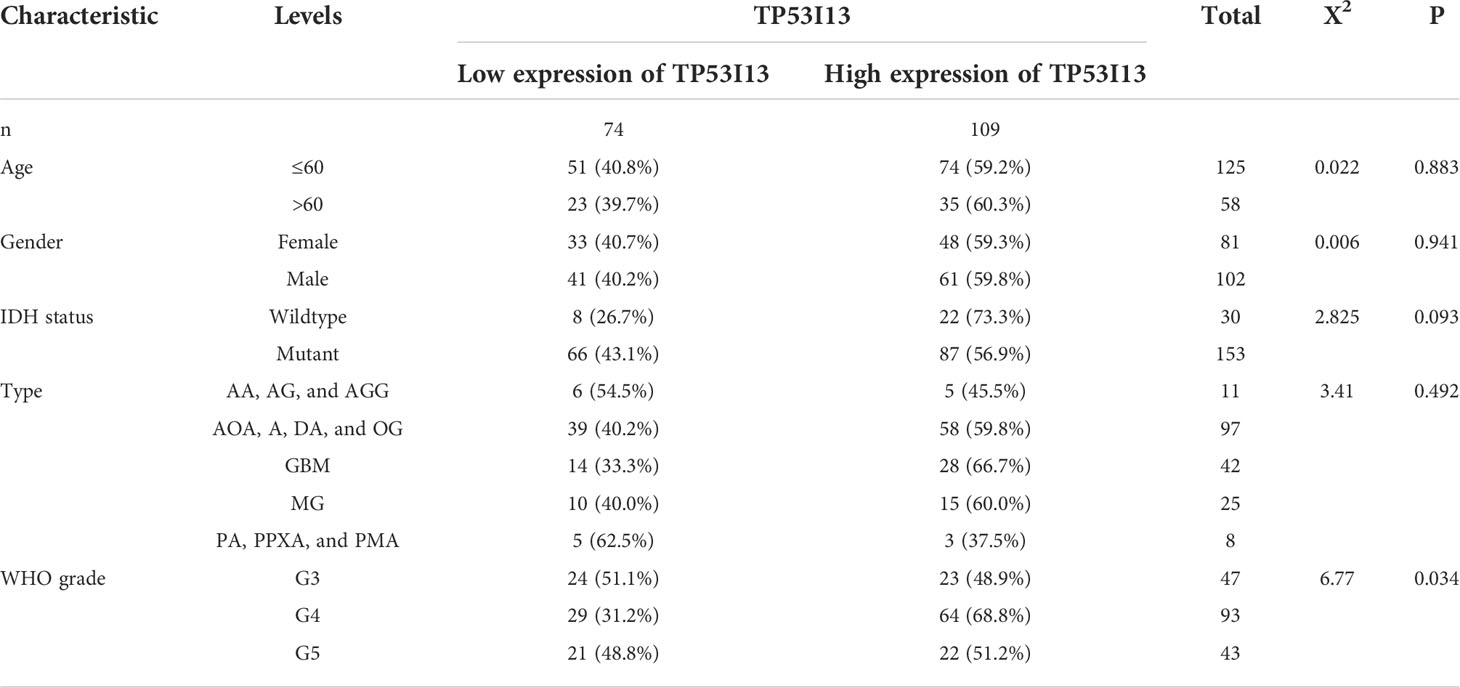
Table 3 MIHC analysis between TP53I13 expression level and different clinical characteristics based on samples from Nantong University Affiliated Hospital.
GEPIA
The Genotype-Tissue Expression (GTEx) high-throughput RNA sequencing data were analyzed and visualized using the Gene Expression Profiling Interactive Analysis (GEPIA) web-based bioinformatics tool (13, 14). TP53I13 expression levels in tumor and normal samples were analyzed using GEPIA. Patient survival analysis based on TP53I13 expression levels in glioma tissues was also provided by GEPIA.
Immunohistochemistry
For tissue microarrays, the tissues were dewaxed, and antigen retrieval was performed. After eliminating endogenous enzymes in the tissues with 3% peroxidase solution, 5% bovine serum albumin was incubated for 20 minutes at room temperature. An overnight incubation with primary antibody was performed on the tissues. Following the primary antibody booster incubation, the tissues were incubated with the secondary antibody booster for 30 minutes. 3,3’-Diaminobenzidine was used to detect the tissues after 30 minutes of incubation with secondary antibody. After dehydrating, sealing, and observing the tissues, hematoxylin was applied to counterstain the tissues. The immunohistochemical staining was carried out on tissues obtained from the biological sample bank of Affiliated Hospital of Nantong University.
Multiplex immunohistochemistry
mIHC employs chromogenic and fluorogenic methods, widely used in cancer immunology (15). mIHC was performed on tissue sections. The tissues were labeled with primary antibodies against TP53I13, CD68, CD163, CD66b, and S100A4, followed by incubation with suitable secondary antibodies. The details of all antibodies used are listed in Supplementary Table 4. The antigens were fixed by heating, followed by cooling, and tyramide signal amplification, which labeled the tissue section with fluorescent immunostains for each marker. For the evaluation and detection of the makers, an automated Vectra 3.0 quantitative pathology imaging system was utilized.
LinkedOmics analysis
LinkedOmics (http://linkedomics.org/) is a novel and unique tool for inclusive analysis of all 32 TCGA cancer-related datasets (16). The web-based database can be used to generate plots for single genes, and the outcomes are displayed in the form of scatter plots, heatmaps, or volcano plots (17). In this study, the LinkedOmics platform was used to explore genes that correlated with TP53I13 (both negatively and positively) to determine the molecular mechanism associated with TP53I13.
Protein-protein interaction analysis
An analysis of PPIs was carried out with the Search Tool for Retrieval of Interacting Genes (STRING) database (http://string-db.org). In order to identify hub genes, the PPI network model was visualized using Cytoscape software.
Gene set enrichment analysis
An in-depth analysis of TP53I13 biological functions was carried out using GSEA. C2.cp.kegg.v7.1.symbols.gmt was used for the Kyoto Encyclopedia of Genes and Genomes (KEGG) pathway enrichment analysis. C5.all.v7.4.symbols.gmt was selected for Gene Ontology enrichment analysis.
Single-cell analysis of TP53I13 expression levels in glioma
To further investigate the levels of TP53I13 expression in glioma patients, we retrieved the GSE138749 dataset from the single cell TIME (scTIME) database (http://sctime.sklehabc.com/unicellular/home) and the GSE148842 dataset from the Tumor Immune Single-cell Hub (TISCH) (http://tisch.comp-genomics.org/) database. ScTIME includes 49 datasets, including information on 39 cancers for two species, humans and mice. scTIME also provides a series of single-cell analysis modules, including immune cell composition, correlation analysis of immune cell types, signature points specific to immune cell types, cell-cell communication, etc. In TISCH, cell types are categorized at the single-cell level, and TME is exploited in a wide range of cancers. 10X genomics was used to examine the data.
Evaluation of Link between immune infiltration and TP53I13 expression
The data obtained from TCGA and CGGA databases were analyzed using CIBERSORT, quanTiseq, xCell, and TIMER. To investigate the correlation between TP53I13 expression and immune infiltration, especially lymphocytic infiltration, CIBERSORT was employed to identify numerous immune infiltrating lymphocytes strongly correlated with TP53I13 expression. To further validate the above analysis, we used quanTiseq, xCell, and TIMER. Infiltrating immune cells are identified by using the TIMER database (https://cistrome.shinyapps.io/timer/).
Cell culture and transfection
Glioma cell lines U87 and U251 were used as in vitro models for analysis. Cell invasion, cell migration, and quantitative real-time polymerase chain reaction (qRT-PCR) were performed on these cells. Three different small interfering RNA (siRNA) sequences targeting TP53I13 (siRNA 1-3) and NC (siRNA-NC) were designed using Invitrogen’s online software BLOCK-iTTM RNAi Designer and synthesized by Oligobio (OLIGOBIO, Beijing, China). Cells were transfected with Lipofectamine™ 3000 transfection reagent (Invitrogen, Carlsbad, USA). The siRNA sequence with the highest efficiency to interfere with the TP53I13 expression was selected for further analysis.
The siRNA target sequences are as follows:
TP53I13 siRNAs: TP53I13 si1: GGGAATCCCTGGTAGGGAGAGTAAT, TP53I13 si2 GGAATCCCTGGTAGGGAGAGTAATG, and TP53I13 si3 GGCTGTGTCTGTTCAAGTCAGGCTT.
Transwell assay
A transwell assay was used to test U-87’s and U-251’s migration and invasion abilities. Briefly, 5 × 10 (4) cells were seeded on chambers coated (for invasion) or uncoated with Matrigel (BD Biosciences, San Jose, CA) (for migration). Lower chambers were added DMEM medium containing serum and upper chambers were filled with serum-free medium. A 24 hour incubation was followed by the fixation of the cells with 4% paraformaldehyde and staining with 0.1% crystal violet. Cell counts were observed under light microscope.
Results
Relationship between TP53I13 expression and TME in glioma patients
TME includes various cells and extracellular components, which significantly affect the immunotherapeutic response and clinical outcomes (18, 19). Stremitzer et al. (2020) have identified a significant relationship between tumor immune microenvironment and patient survival (20). In this study, Expression Data (ESTIMATE: R package) and CIBERSORT were used to score the tumor purity, interstitial cells and immune cells of TCGA glioma samples. According to the “PAM” method, samples were divided into groups with low and high immunity levels. Low immune group members had significantly lower ESTIMATE, immune and stoma scores than high immune group members. As compared to the hypoimmune group, tumor purity was lower in the high immune group (P=0.001). Figures 1A, B shows this. A significant connection was observed between immune cells and the high-expression group, indicating a correlation between the high-expression group, tumor microenvironment, and tumor-infiltrating immune cells. The relationship between TP53I13 expression levels in high- and low-immunity groups was assessed, and high TP53I13 expression was observed in the high-immunity group compared to the low-immunity group, consistent with TME analysis of glioma data (Figure 1C). TP53I13 expression is related to the immune microenvironment of gliomas, as shown by the findings.
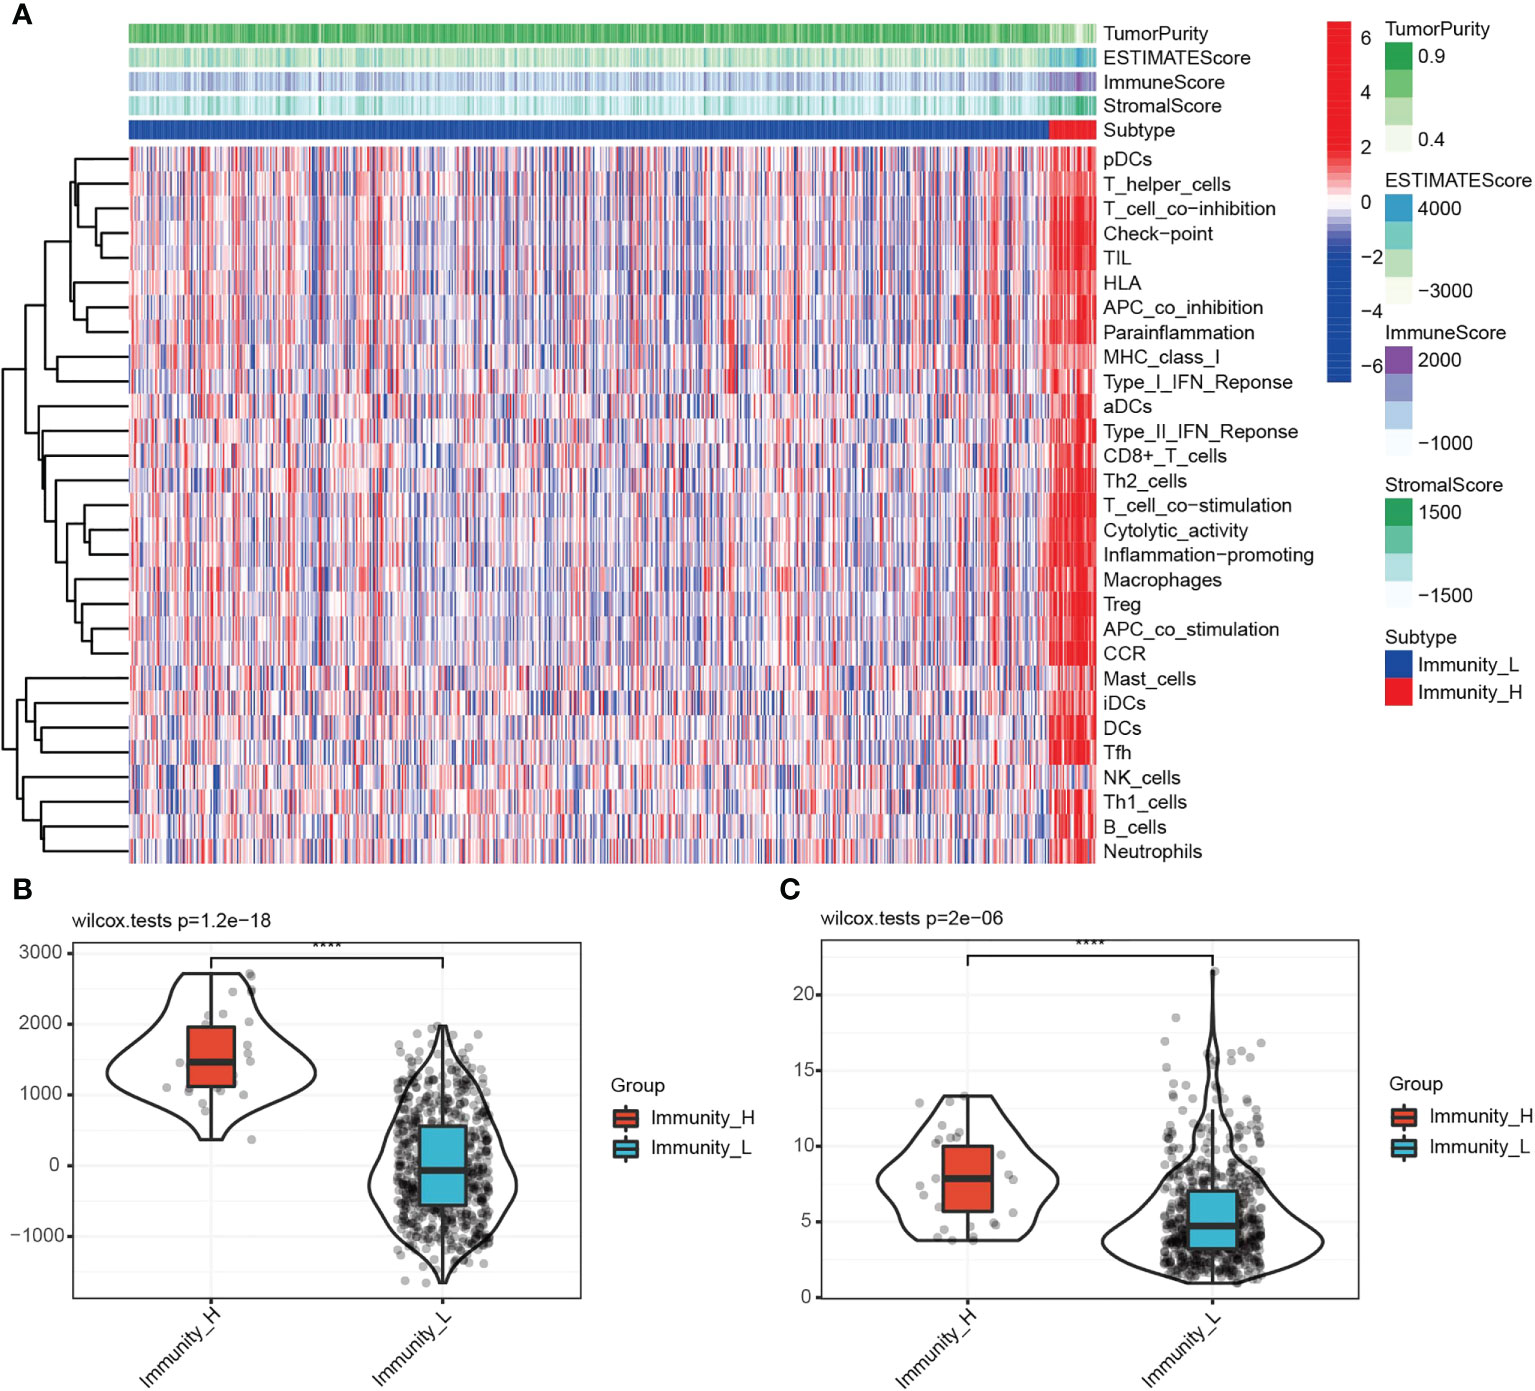
Figure 1 (A) Immune cell score, stromal cell score, combined scores of immune and stromal cells, and tumor purity in the high- and low-immunity groups. (B) The relationships between the immune score and different immunity groups. (C) The differences in TP53I13 expression in the high- and low-immunity groups.
TP53I13 expression in various tumor types
TP53I13 expression in various tumors and neighboring tissues were retrieved from GTEx and TCGA databases. On the other hand, tumor tissues expressed TP53I13 at a higher level than normal tissues. The expression of TP53I13 was detected in various cancer types such as glioblastoma tissues (Figure 2A), cholangiocarcinoma (CHOL), lymphoid neoplasm diffuse large B-cell lymphoma (DLBC), Kidney renal clear cell carcinoma (KIRC), skin cutaneous melanoma (SKCM), low-grade glioma (LGG), bladder urothelial carcinoma (BLCA), and thymoma (THYM). Survival analysis revealed overall survival (OS) was good in TP53I13 expressing tumors including Pancreatic ductal adenocarcinoma (PAAD; P = 5.9e-03) and Pheochromocytoma and paraganglioma (PCPG; P = 4.5e-02). On the contrary, poor survival was observed TP53I13 expressing tumors including like Uveal Melanoma (UVM; P = 3.6e-03), LGG (P = 1.9e-17), KIRC (P = 3.8e-06), kidney chromophobe (KICH; P = 1.5e-02), and glioblastoma (GBM; P = 2.6e-02) (Figure 2B).
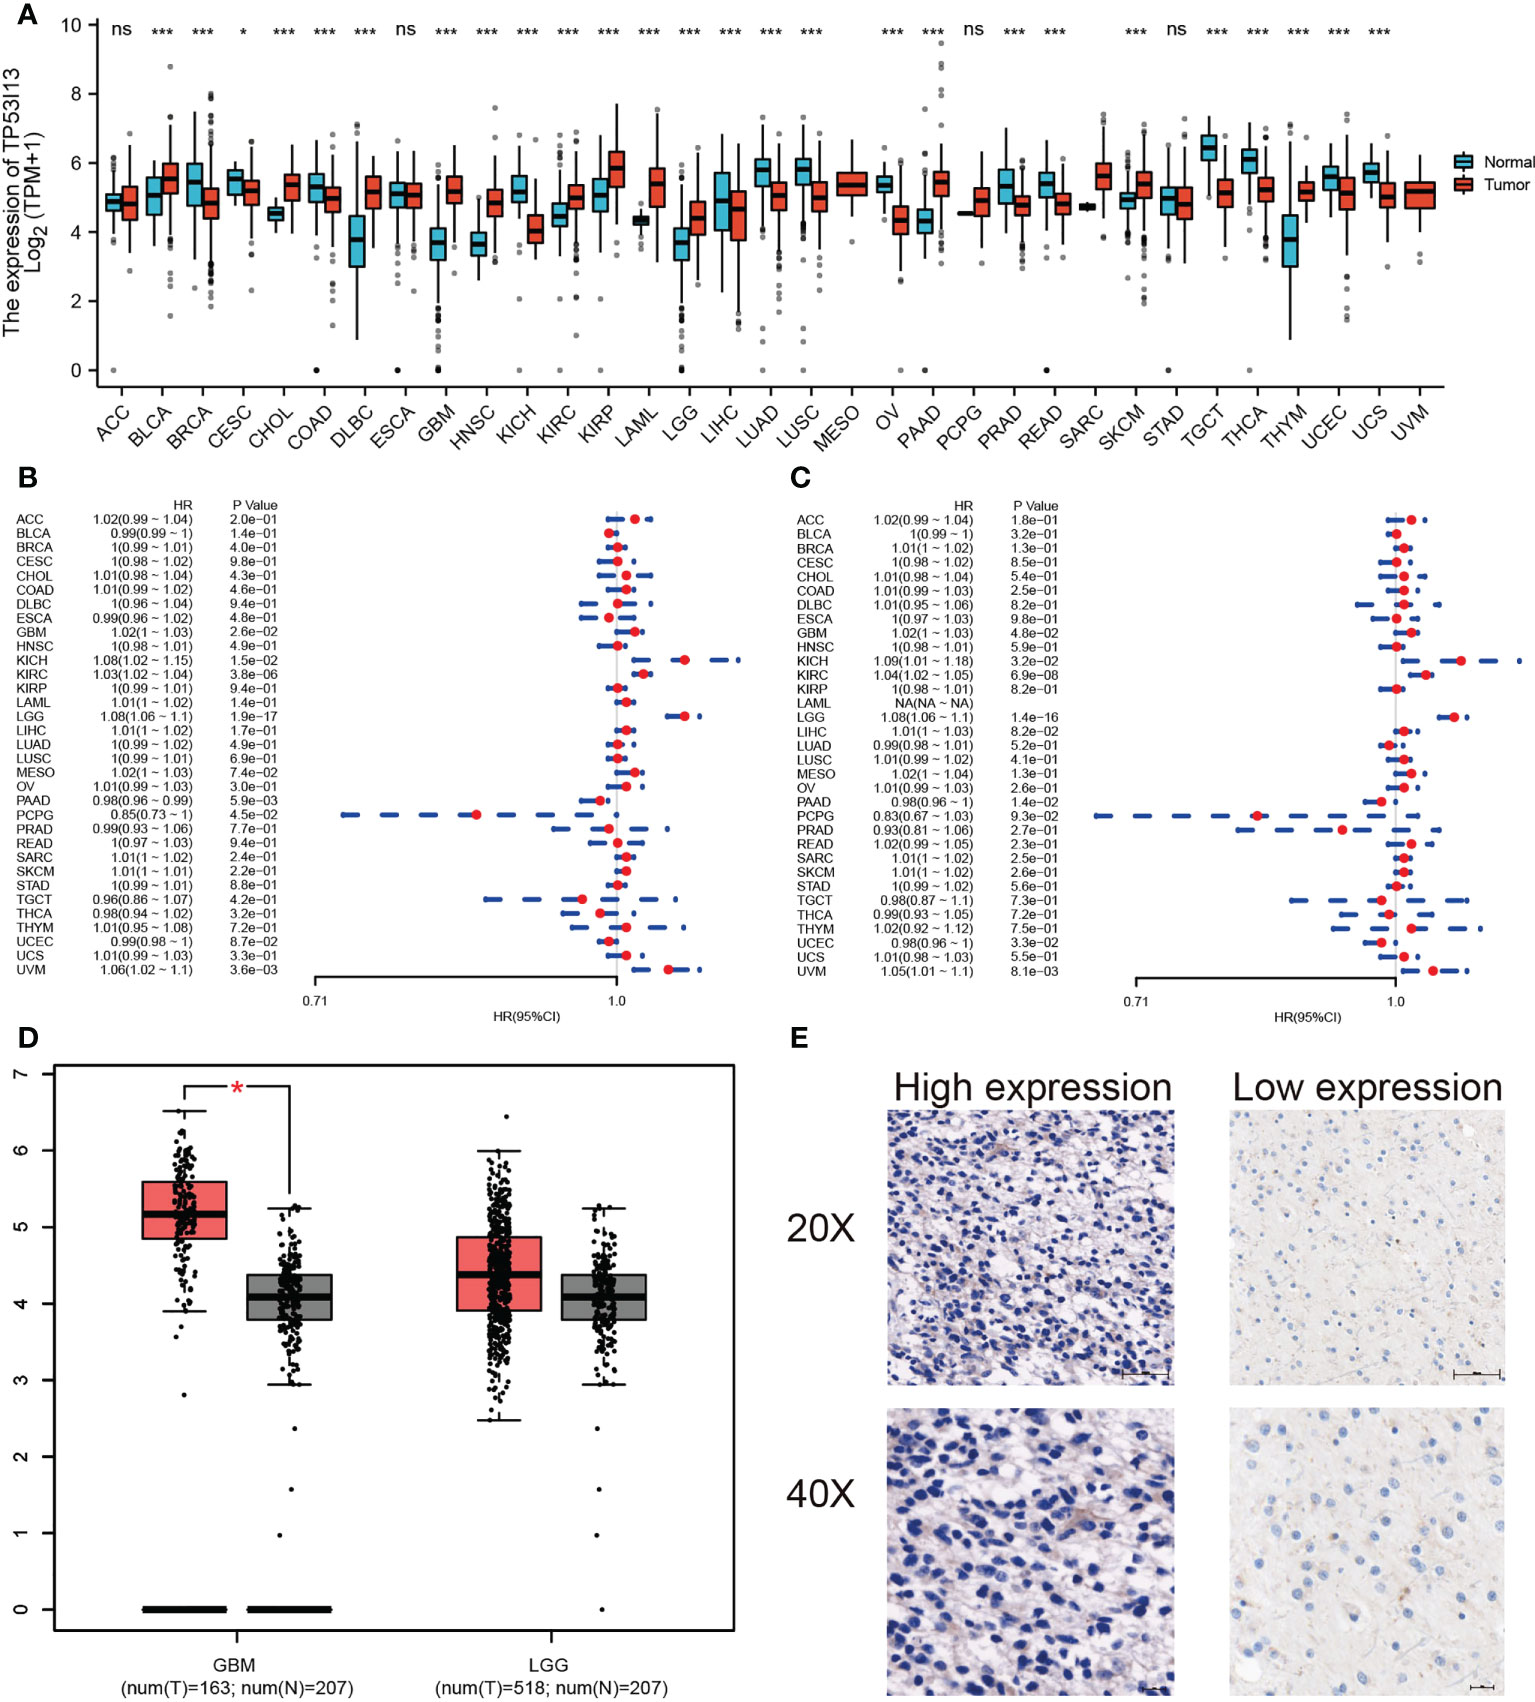
Figure 2 (A) Pan-cancer analysis of TP53I13 in different tumors based on GTEx and TCGA databases *, P<0.05; ***, P<0.001. (B) The hazard ratio for overall survival in 33 tumors expressing TP53I13. (C) The hazard ratio for disease-specific survival in 33 tumors expressing TP53I13. (D) TP53I13 expression based on the GEPIA database. (E) Representative immunohistochemistry (IHC) analysis shows high and low TP53I13 expression. ns, no significance.
TP53I13 expression in cancers like PAAD (P = 1.4e-02) and uterine corpus endometrial carcinoma (UCEC; P = 3.3e-02) had good disease-specific survival (DSS). TP53I13 expression in cancers like GBM (P = 4.8e-02), KICH (P = 3.2E-02), KIRC (P = 6.9e-08), LGG (P = 1.4e-16), and UVM (P = 8.1e-03) had poor DSS (Figure 2C). The intersection survival analysis of DSS and OS revealed that TP53I13 has prognostic value in GBM, KICH, KIRC, LGG, and UVM.
Prognostic value of TP53I13 expression in glioma
TP53I13 expression was assessed in various tumors. Gliomas like LGG and GBM exhibit significant expression of TP53I13. To learn more about TP53I13’s prognostic value in gliomas, we conducted our study. GEPIA was used to investigate TP53I13 expression, and the results reveal that TP53I13 expression was low in normal tissues compared to gliomas such as LGG and GBM (Figure 2D). Similar results were obtained using immunohistochemical analysis (Figure 2E). Further, TP53I13 expression was studied in tissue samples obtained from Nantong University Affiliated Hospital, and the results revealed that TP53I13 expression was higher in tumor tissues than in normal tissues (Supplementary Figure 1A). A TCGA and CGGA database containing glioma samples was examined for TP53I13 mRNA expression. As shown in Figures 3A, B, according to the TCGA and CGGA data, high levels of TP53I13 were associated with lower overall survival (OS). Similar results were obtained in glioma patient samples from Nantong University Affiliated Hospital, where high TP53I13 expression was associated with poor survival (Supplementary Figure 1B). TP53I13 was evaluated for its ability to predict one-, three-, and five-year survival using ROC curves. TCGA’s data on 1-, 3-, and 5-year survival rates for glioma patients showed AUCs of 0.806, 0.852, and 0.785, respectively (Figure 3C). One-, three-, and five-year survival rates for CGGA in glioma patients were 0.704, 0.706, and 0.639, respectively (Figure 3D). We evaluated TP53I13’s prognostic value in glioma patient samples retrieved from TCGA regarding 1-year survival, 3-year survival, and 5-year survival. AUCs for one-year, three-year, and five-year DSS rates for glioma patients were 0.799, 0.844, and 0.791, respectively (Figure 3E). One-, three-, and five-year PFI survival rates of glioma patients were 0.768, 0.786, and 0.783 respectively, according to the AUC (Figure 3F). Furthermore, prognostic variables were assessed with Cox regression analysis. Multivariate Cox analysis identified low PRS type, low grade, less age, high 1p/19q codeletion status, high chemotherapy, high IDH mutation level, and low TP53I13 expression as independent prognostic factors that predicted OS (Figure 3G). We also investigated the independent prognostic value of TP53I13 on 159 glioma samples obtained from the Affiliated Hospital of Nantong University. A combination of WHO grade, age, sex, and TP53I13 was an independent prognostic factor in glioma patients, based on the results of the study (Supplementary Figure 1C). In order to improve survival prediction mapping for glioma patients, we integrated TP53I13 expression levels with other prognostic factors (Figure 3H). The nomograms were also calibrated to determine their accuracy. Figure 3I show that the curves showed good consistency with the predicted results.
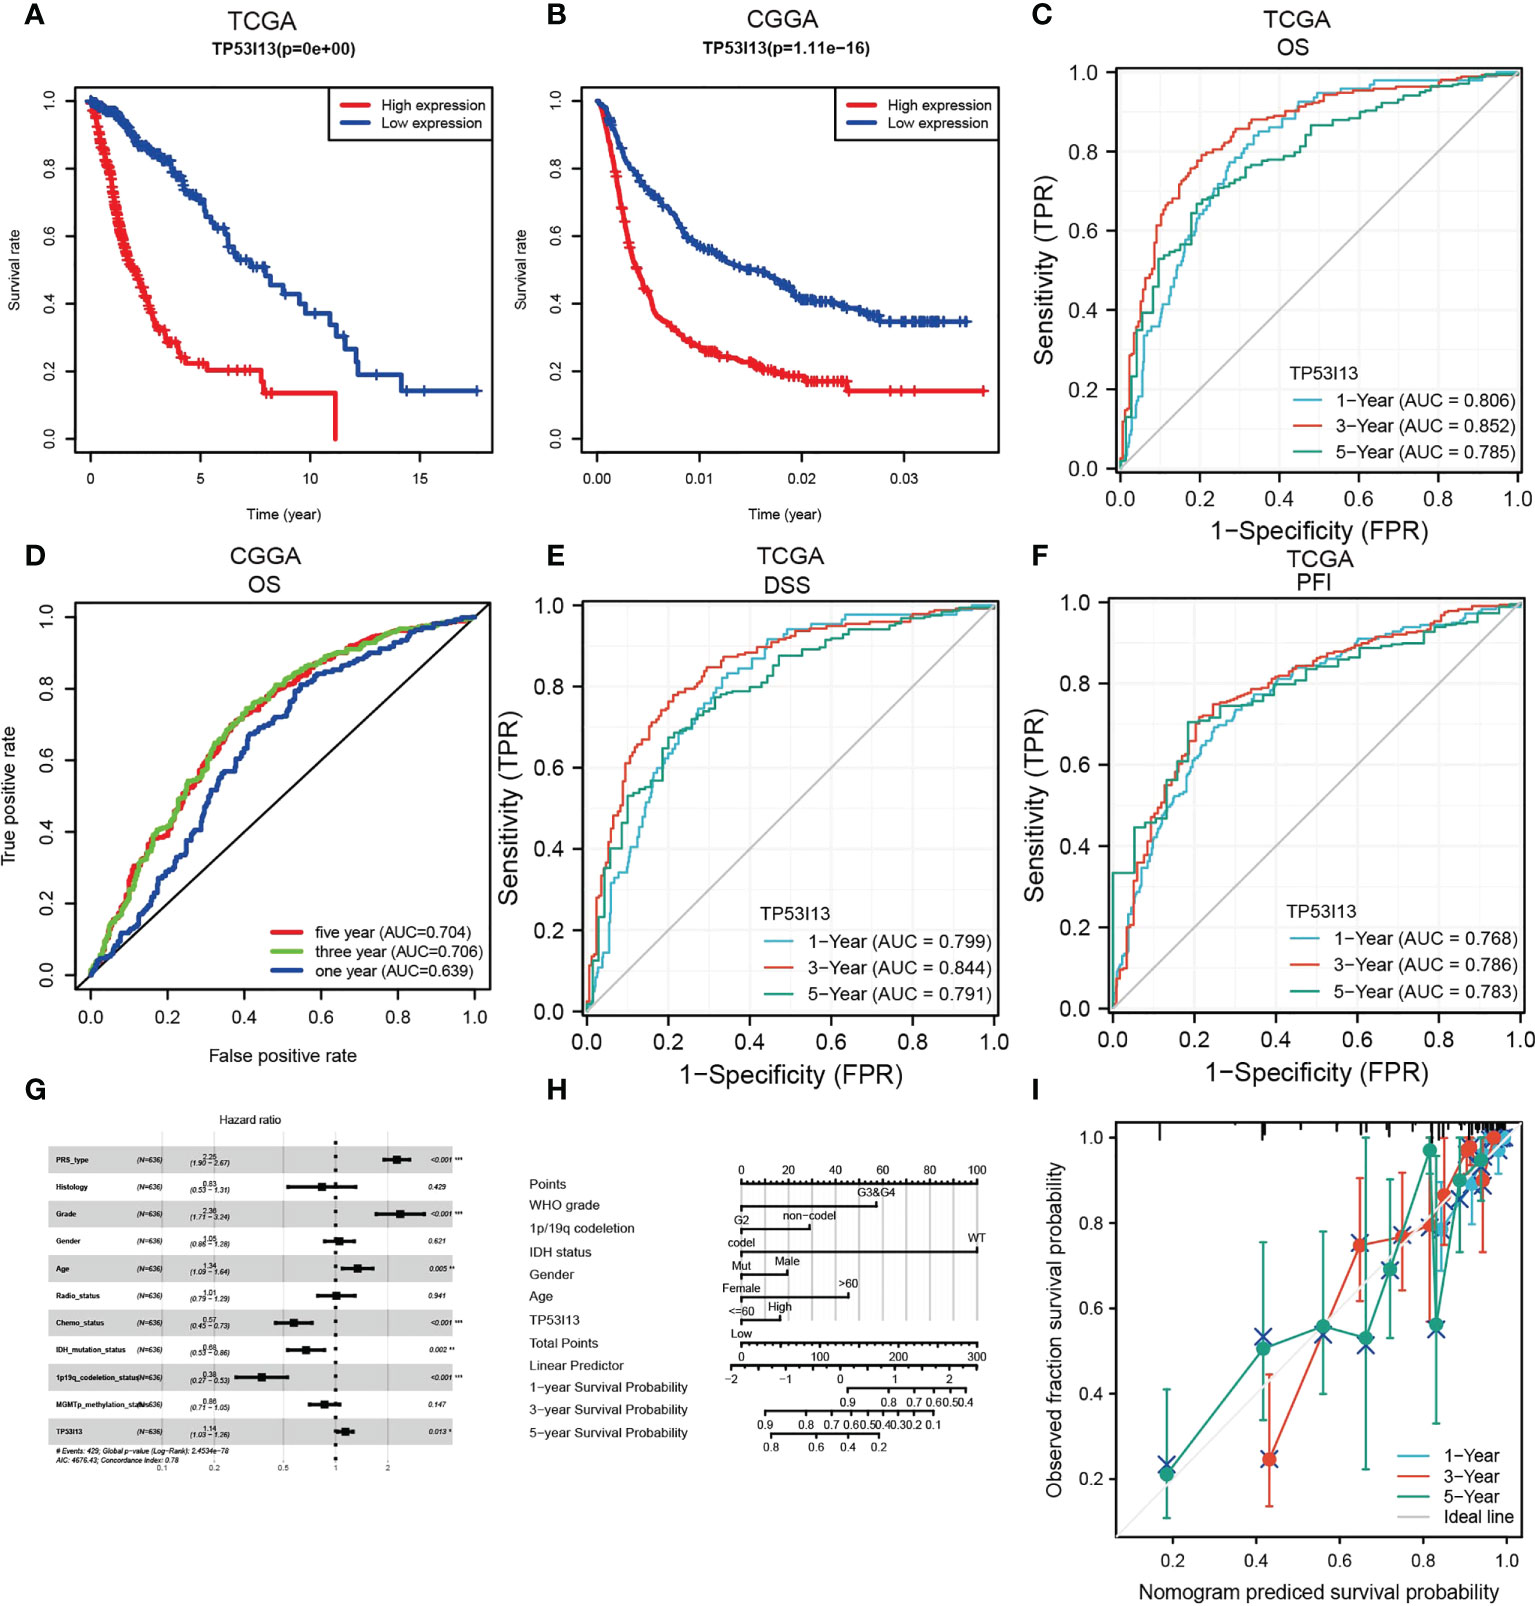
Figure 3 (A) Kaplan–Meier curve for overall survival (OS) of glioma patients with the TP53I13expression based on the TCGA database. (B) Kaplan–Meier curve of the OS of glioma patients with TP53I13 expression level based on the CGGA database. ROC curves for 1-, 3-, and 5-year OS analysis based on TP53I13 expression levels in glioma patient samples obtained from (C) TCGA (D) CGGA databases. (E) ROC curves for 1-, 3-, and 5-year DSS analysis of TP53I13 expression in glioma patient samples obtained from TCGA. (F) ROC curves for 1-, 3-, and 5-year PFI analysis of TP53I13 expression glioma patient samples obtained from TCGA. (G) Multivariate Cox regression analysis of the TP53I13 expression and clinical characteristics. (H) Nomogram for OS integrating TP53I13 expression level, WHO grade, 1p/19q codeletion status, IDH mutation status, sex, and age. (I) The calibration curve for predicting 1-, 3-, and 5-year OS in glioma patients.
TP53I13 expression in different subgroups of patients with glioma
We analyzed the CGGA and TCGA databases for relationships between TP53I13 expression and glioma subgroups. Additionally, the expression of TP53I13 was examined in patients with distinct WHO grades and codeletions of 1p/19q, as well as patients with IDH mutations. From the CGGA database, two datasets were analyzed, mRNAseq_325 and mRNAseq_693. According to CGGA and TCGA samples, TP53I13 expression increased as WHO grade increased (Figures 4A-C). Similar results were observed using IHC, where an increase in TP53I13 expression was observed with an increase in WHO grade (Figures 4D-F). Further, seven tissue microarrays were carried out using the same method under the same experimental conditions, which included tissue samples from all the glioma patients for further analysis. Higher tumor grades had a worse prognosis, and TP53I13 expression increased as the glioma progressed in all the glioma patients (Figure 4G). We further investigated the relationships between TP53I13, MKI67, and vimentin (VIM) expression levels. Figure 4H shows poor correlation betweenTP53I13 and MKI67 (Ki-67 proliferation index) (R = 0.300, P <0.001) but TP53I13 had a significant correlation with VIM (vimentin invasion index) (R = 0.720, P<0.001). (Figure 4I). The results reveal that enhanced TP53I13 expression was linked to malignant clinicopathological features in glioma patients.
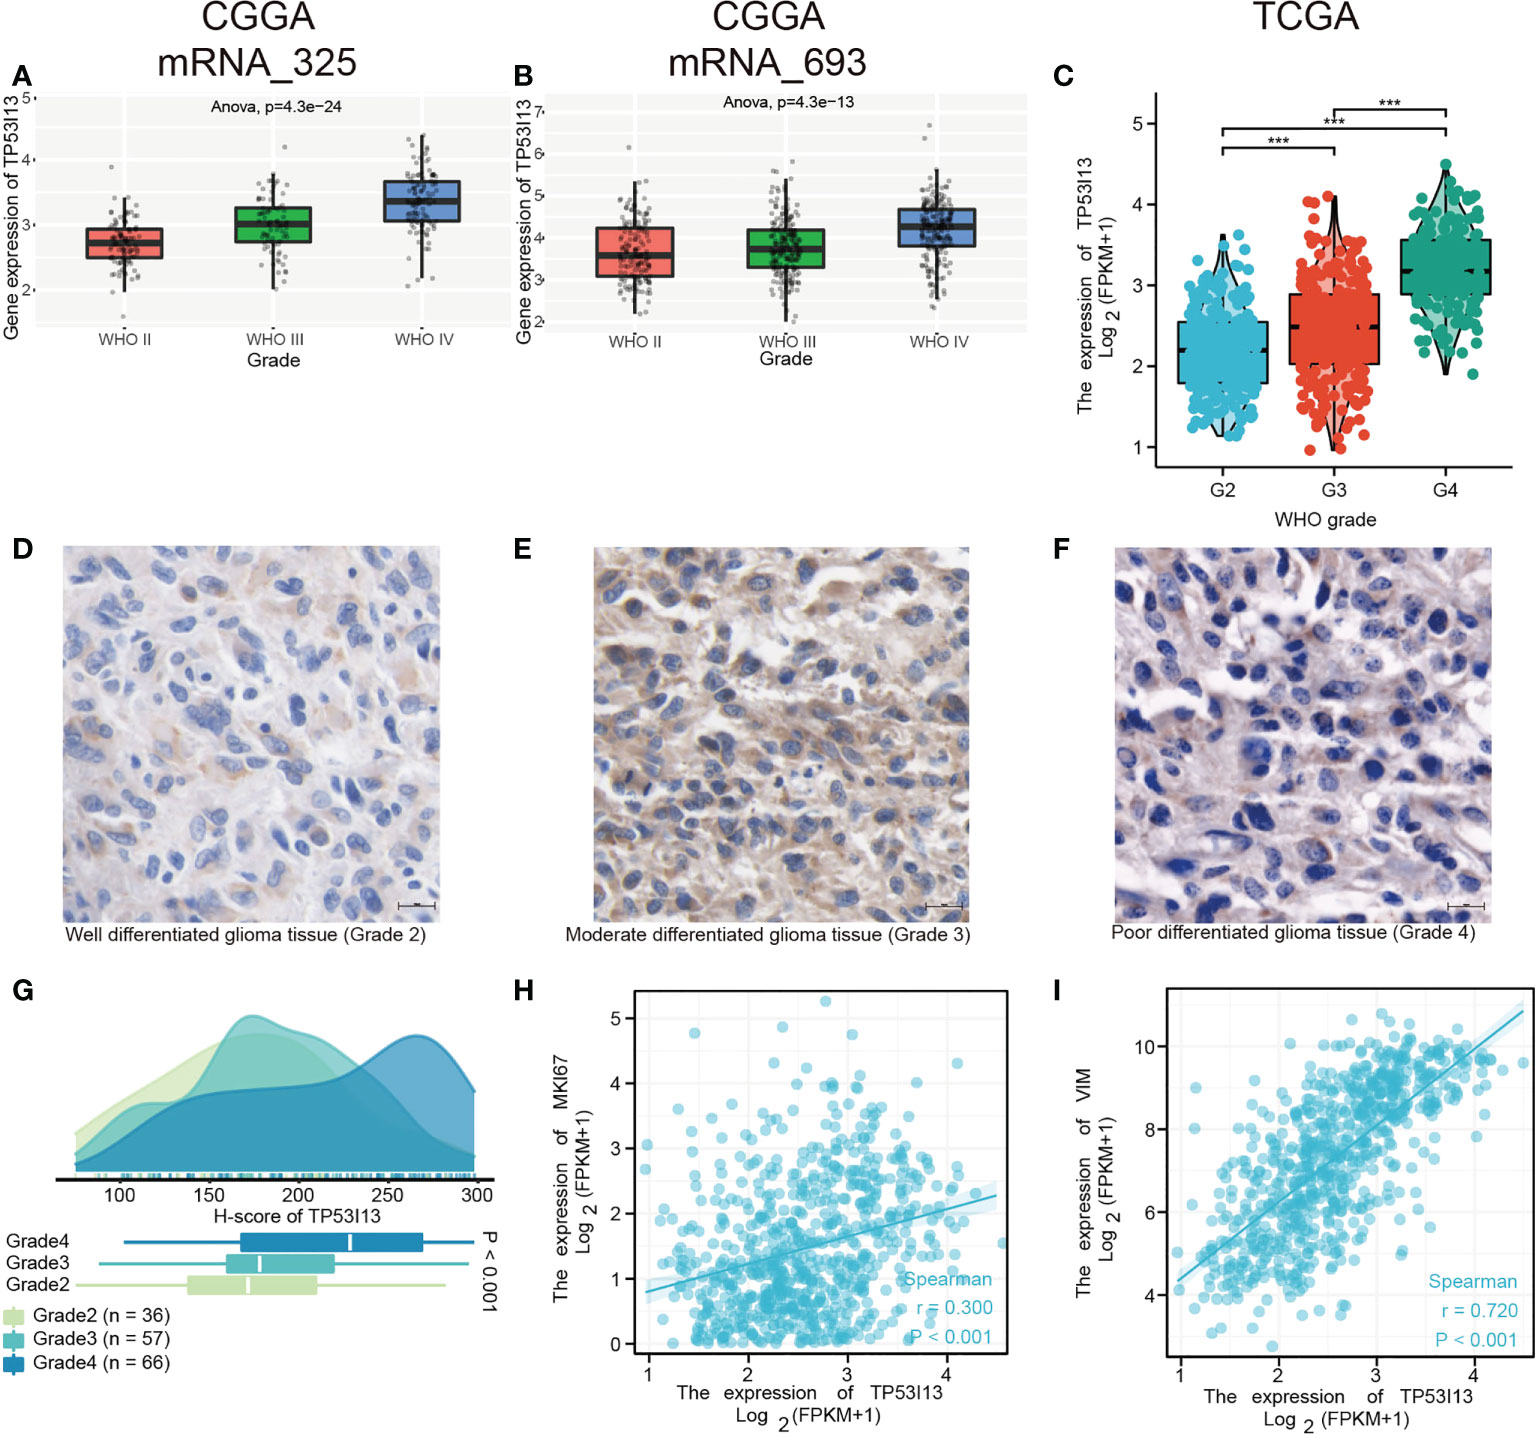
Figure 4 TP53I13 Expression in subgroups of glioma patients based on IDH mutation status, WHO grade, and 1p/19q codeletion status. Boxplot shows a correlation between TP53I13 expression and WHO grade based on (A) the CGGA mRNAseq_325 dataset, (B) the CGGA mRNAseq_693 dataset, and (C) the TCGA database. (D-F) IHC of TP53I13 in glioma tissues of different WHO grades. (G) Quantification of TP53I13 staining in glioma tissues of different WHO grades. (H) The relationship between TP53I13 and a proliferation marker (Ki-67). (I) The relationship between TP53I13 and invasion markers (vimentin).
According to CGGA and TCGA glioma patient samples, IDH wild-type patients expressed higher levels of TP53I13 than IDH mutant patients (Supplementary Figures 2A-C). TP53I13 expression was also reduced in patients with 1p/19q codeletions compared with patients without (Supplementary Figures 2D-F).
Multifactorial survival analysis of TP53I13 expression
Survival analysis between TP53I13 expression and IDH mutation (Figure 5A), chemotherapy (Figure 5B), 1p/19q codeletion status (Figure 5D), and radiotherapy (Figure 5C) was performed. As shown in Figure 5A, patients harboring IDH mutation expressed high TP53I13 levels (red and green) and had poor survival outcomes, further confirming that TP53I13 could be a potential prognostic biomarker for gliomas. As shown in Figure 5B, in glioma patients with high TP53I13 expression (red and green), poorer survival outcomes were observed similarly to IDH mutation status. As shown in Figure 5C, high TP53I13 expression (red and green) was related to a poor survival outcome. Taking these results together, it appears that glioma patients with low TP53I13 expression could have a higher survival rate. As shown in Figure 5D, the patients with 1p/19q codeletion expressed a high level of TP53I13 and had poor survival outcomes.
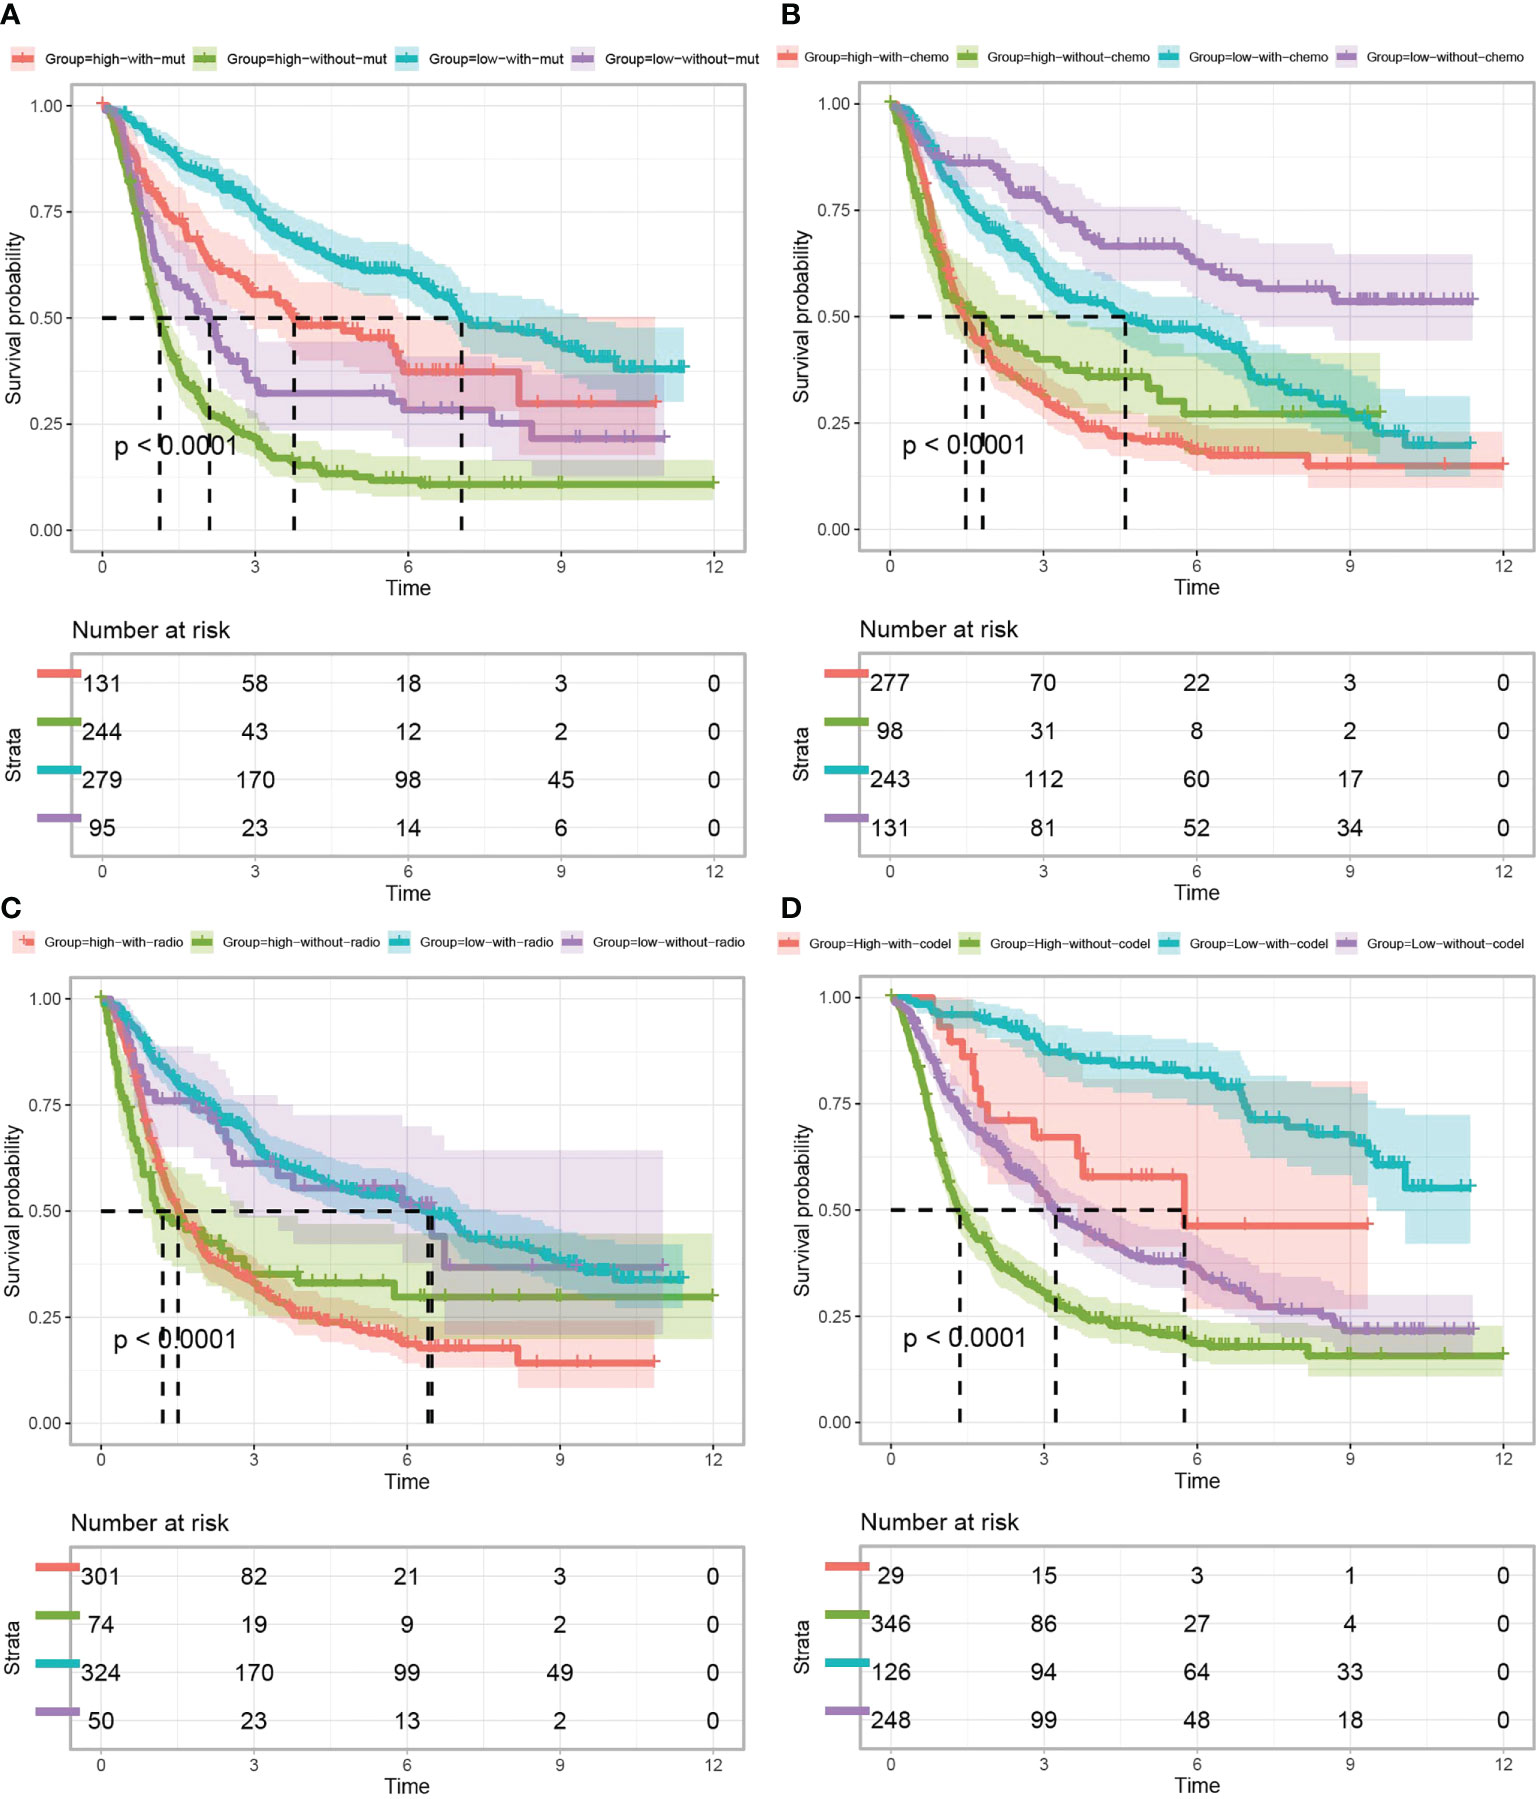
Figure 5 Kaplan–Meier curves of glioma patients (data obtained from CGGA) classified based on TP53I13 expression and (A) IDH mutation, (B) chemotherapy, (C) radiotherapy, and (D) 1p/19q codeletion status.
Prognostic value of TP53I13 in glioma patients
Further study of the potential prognostic value of TP53I13 in gliomas, a survival analysis including OS and DSS was conducted on patients divided based on their clinical characteristics. Overall survival (OS) analysis revealed significant correlation between high TP53I13 expression in females (P < 0.001) (Supplementary Figure 3G), males (P < 0.001) (Supplementary Figure 3H), patients without 1p/19 co-deletion (P < 0.001) (Supplementary Figure 3F), patients harboring IDH mutation (P = 0.028) (Supplementary Figure 3D), WHO grades 3 and 4 (P < 0.001), and WHO grade 2 (P = 0.038) (Supplementary Figure 3A), (Supplementary Figure 3B), and poor survival outcome. The results of the DSS analysis were consistent with the OS outcomes. Significant correlation was observed between high TP53I13 expression and WHO grade 2 (P = 0.031) (Supplementary Figure 4A), WHO grades 3 and 4 (P < 0.001) (Supplementary Figure 4B), patients harboring IDH mutation (P = 0.024) (Supplementary Figure 4D), patients without 1p/19 co-deletion (P < 0.001) (Supplementary Figure 4F), females (Supplementary Figure 4G), and male (Supplementary Figure 4H) and poor survival outcomes. Patients with TP53I13 show better prognosis than those with IDH mutations, WHO grades, or 1p/19q codeletion status. Therefore, these results suggest that TP53I13 can be used as a biomarker for predicting glioma and can predict survival outcomes in patients with glioma.
Investigating differentially expressed genes (DEmRNAs, DElncRNAs, and DEmiRNAs)
Based on the above results, glioma patients’ outcomes can be predicted using TP53I13 as a biomarker. In glioma samples, TP53I13 expression appears to be lower than in paracancerous or cancerous tissues. Therefore, we confirmed this conjecture by identifying the DEmRNAs, DElncRNAs, and DEmiRNAs in glioma tissues with high and low TP53I13 expression and adjacent normal tissue using samples from the TCGA database. The threshold for lncRNA was set as |log fold change [FC]| > 0.5, and P < 0.05 was set as a threshold for the miRNA and mRNA. DElncRNA, DEmRNA, and DEmiRNA distribution was shown on a volcano plot (Figures 6A-C). There are 15 genes with differential expression in glioma and normal tissues with high and low levels of TP53I13, as shown by a heatmap. (Figures 6D-F).
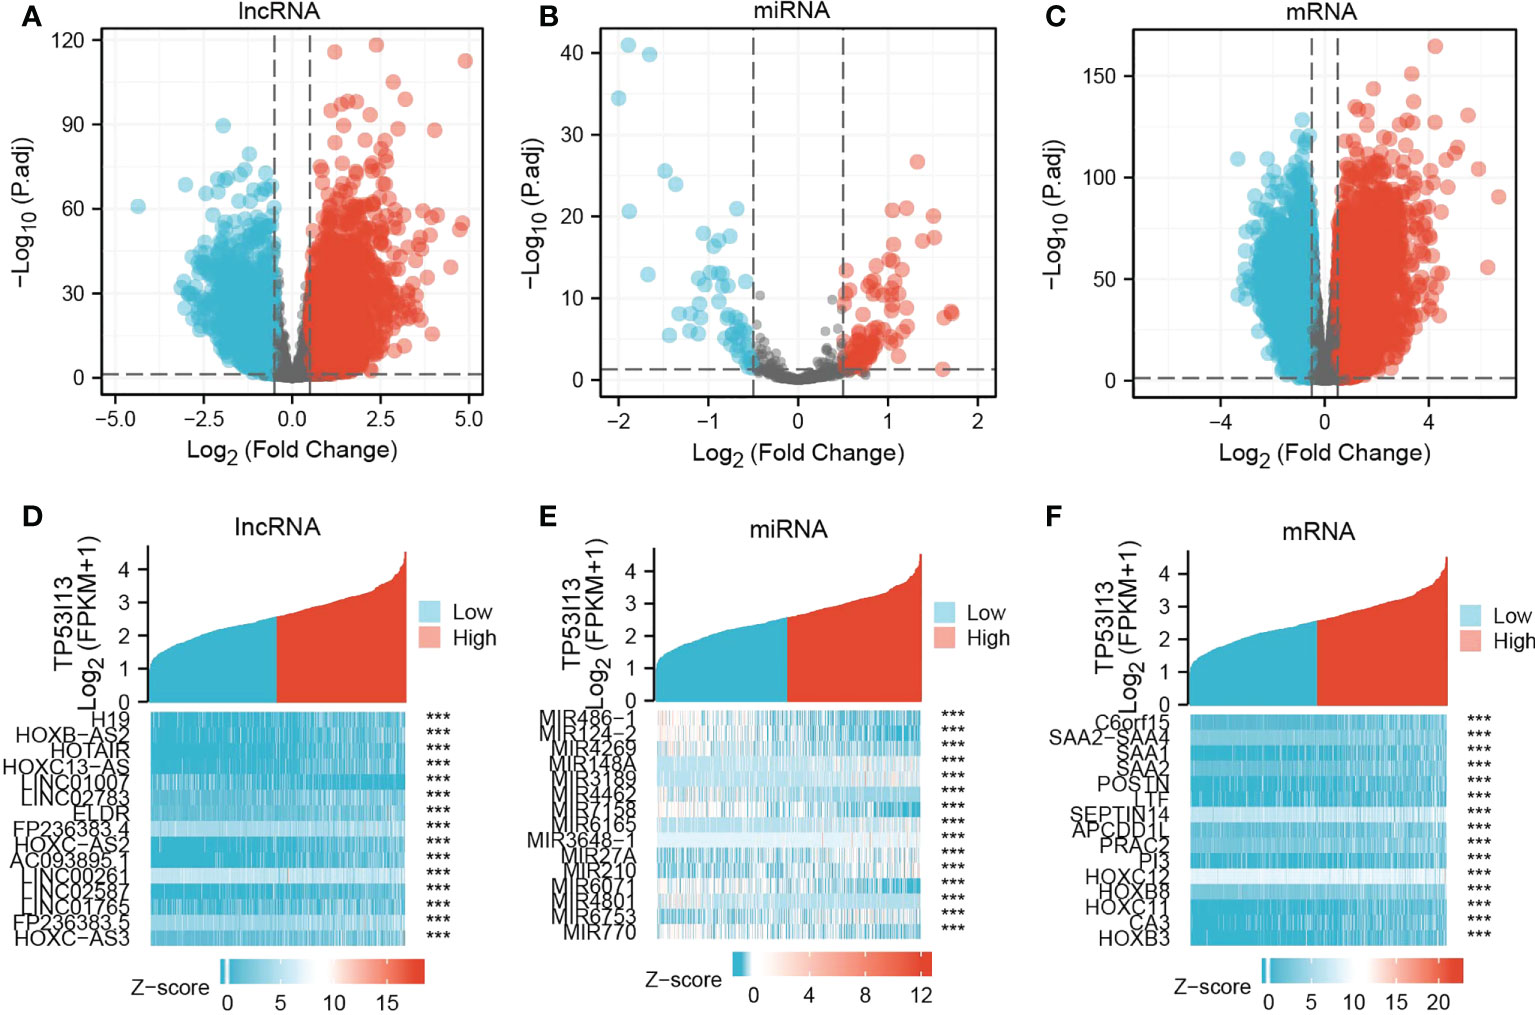
Figure 6 Volcano plots and heatmaps of DElncRNAs, DEmiRNAs, and DEmRNAs in glioma samples with low and high TP53I13 expression levels. The volcano plots illustrate the (A) DElncRNAs, (B) DEmiRNAs, and (C) DEmRNAs. Heatmaps of 15 significant Differentially expressed genes (DEGs) closely correlated with (D) DElncRNAs, (E) DEmiRNAs, and (F) DEmRNAs.
Molecular mechanism and biological function of TP53I13
In order to examine the molecular mechanism of TP53I13 in gliomas as well as its relationship to other genes involved in glioma, the mRNA sequence data retrieved from TCGA database was analyzed using the functional module of LinkedOmics. The volcano plot reveals genes co-expressed with TP53I13 using Pearson correlation (Supplementary Figure 5A). The genes negatively and positively linked to TP5313 are highlighted by dark green and dark red dots, respectively. As shown in Supplementary Figure 5B-C, the heatmap shows the top 50 differentially expressed genes genes that negatively and positively correlated with TP53I13 expression. STRING and GeneMANIA were used to investigate the function of the PPIs with TP53I13 levels in gliomas. Based on PPI network analysis, the top 20 genes that tightly correlated with TP53I13 were identified (Supplementary Figure 5D). Cytoscape was used to analyze the hub genes, and the results revealed a significant correlation between TP53I13 and TP53, TP53BP2, TP53I3, TP53INP1, GADD45B, UFL1, and PROSC (Supplementary Figure 5E). The results show that these top genes were associated with transcriptional dysregulation in cancers. Further, the top 20 TP53I13-interacting proteins were identified using GeneMANIA software, and the proteins tightly interconnected with AP1M2, AP1M1, TBX22, SPSB3, C19orf43, SMARCC22, FABP2, MAPK3, NAALADL1, FZD6, and SCRN2 (Supplementary Figure 5F).
TP53I13’s biological function was analyzed using KEGG and GO pathways enriched in the TCGA dataset. The pathways enriched by TP53I13 were body metabolism, negative regulation of excitatory synapse, cell cycle phase transition, negative regulation of synaptic transmission, regulation of integrin-mediated signaling pathway, protein processing, tumor necrosis factor-mediated signaling pathway, neurotransmitter receptor complex, nucleotide excision repair DNA gap filling, bladder cancer, cytosolic DNA sensing pathway, calcium signaling pathway, DNA replication, ERBB signaling pathway, GnRH signaling pathway, MAPK signaling pathway, p53 signaling pathway, pentose phosphate pathway, and WNT signaling pathway (Figures 7A, B).
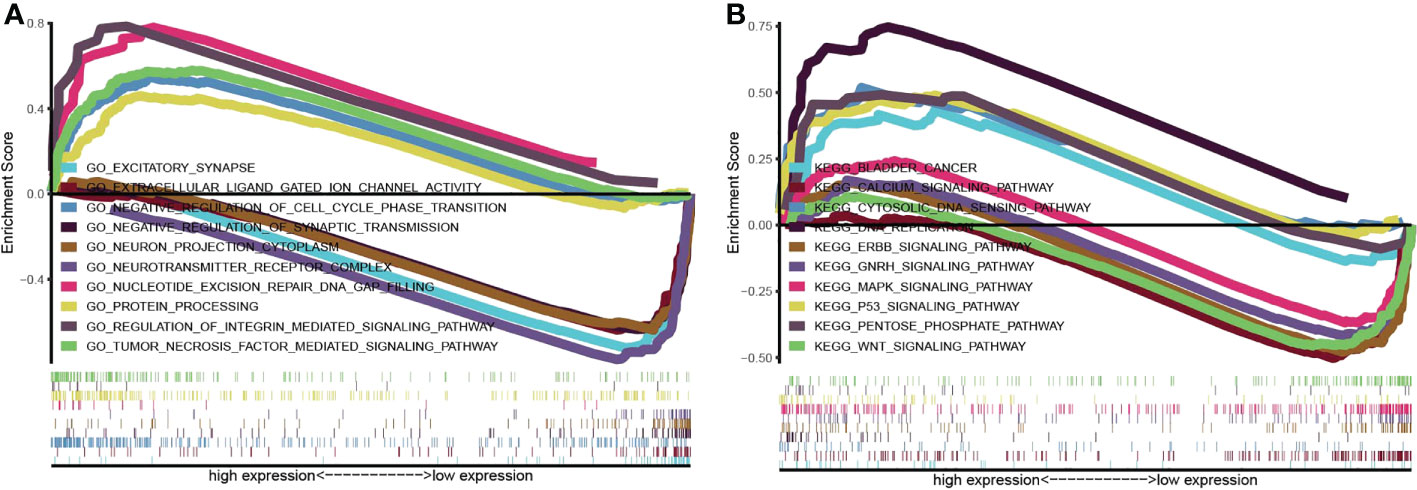
Figure 7 Gene set enrichment analysis was conducted to elucidate the biological function of TP53I13 in glioma. (A) Gene Ontology enrichment analysis. (B) Kyoto Encyclopedia of Genes and Genomes pathway enrichment analysis.
Analysis of TP53I13 mutation in gliomas
Tumor-specific mutations cause amino acid substitutions, which leads to mutated “neoantigens” and kill the tumor cells (21). A further examination of the relationship between TP53I13 mutations and the TME was conducted based on the median expression of TP53I13 between high- and low-immunity groups. In Figure 8A, the top 30 TP53I13 expression genes with significant mutations are shown. IDH1 was the top mutated gene in both low- and high-immunity groups and has been previously identified to be involved in tumorigenesis and cancer progression (22). Additionally, the study found that hyperimmune individuals showed more gene mutations than hypoimmune individuals, suggesting that glioma patients have more gene mutations, which are necessary for hyperimmune infiltration. An overview of the mutation profiles in glioma is shown in Figure 8B. As shown in Supplementary Figure 6A, we evaluated the connection between TP53I13 expression and copy number variations (CNVs) using TIMER. The results show that in GBM, the infiltration of DC and CD4+ T cells were lower with chromosome arm-level gain of TP53I13, while in LGG, infiltration of B cells and DC were higher with chromosome arm-level deletion of TP53I13. Different immunological subgroups’ TP53I13 expression was assessed, as seen in Supplementary Figures 6B, C. GBM cells expressed the highest level of TP53I13, while LGG cells expressed the highest level of TP53I13, indicating a better prognosis of glioma. Together these results suggest that TP53I13 expression altered immune activity in the TME.
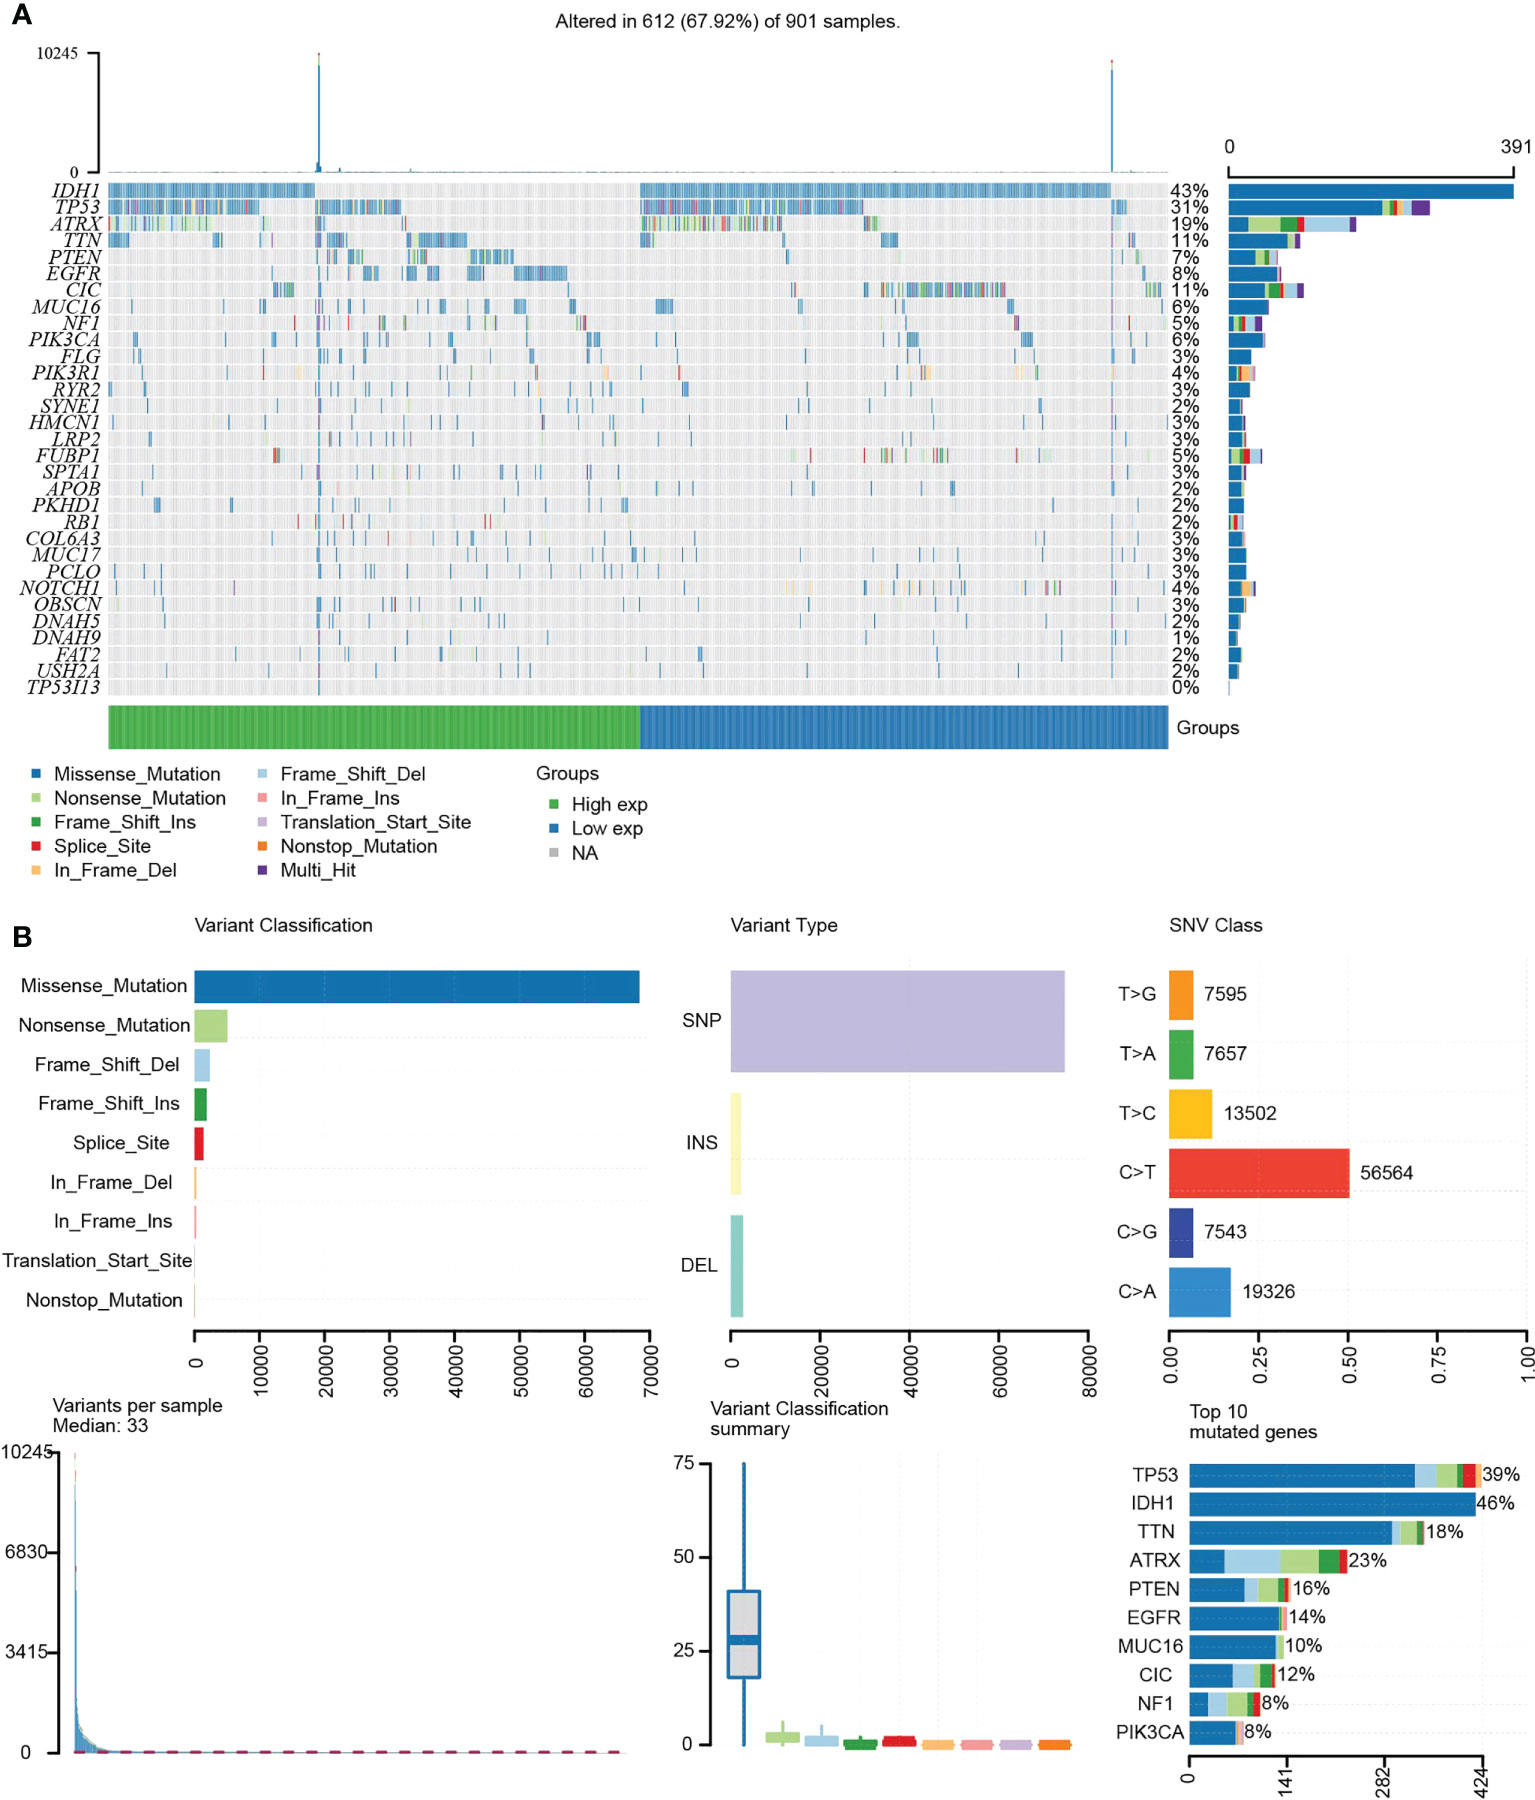
Figure 8 (A) Waterfall plot shows the mutation distribution of the top 30 commonly mutated genes. (B) The cohort summary diagram shows the variants distribution by variant type, classification, and SNV category. The bottom (left to right) showcases the mutation burden for each sample (variation classification type). The stacked bar chart reflects the top 10 mutated genes.
Analysis of TP53I13 expression in glioma at the single-cell level
For evaluating the link between the glioma patients and TP53I13 expression at the single-cell level, scTIME and TISCH databases were analyzed. Data retrieved from the scTIME database showed that TP53I13 levels were higher in macrophages than in other cells except those with clonal mutations (Supplementary Figure 6D). Similar results were obtained from the TISCH database. As shown in Supplementary Figure 6E, high TP53I13 expression was observed. Furthermore, TP53I13 was shown to be expressed at higher levels in AC-like malignant cells and malignant cells according to the TSICH database, which further emphasized the malignancy of glioma severity and the necessity to find a biomarker for glioma treatment.
Relationship between tumor immune infiltrating lymphocytes and TP53I13 expression
The proportion of 22 types of immune cells in glioma samples retrieved from CGGA and TCGA databases was sorted and analyzed by CIBERSORT to explore the relationship between TP53I13 expression and tumor immune microenvironment. Analysis conducted on samples retrieved from the TCGA database revealed a significant increase in the proportion of neutrophils, resting memory CD4+ T cells, regulatory T-cells (Tregs), and M2 macrophages in the high-immunity group of glioma patients (Figure 9A). From the CGGA database, regulatory CD8+ T cells, memory B cells, macrophages, plasma cells, and T cells were found to be significantly increased. As a result of the treatment, resting NK cells, resting mast cells, and resting monocytes were all significantly reduced, as were naive CD4+ T cells, resting memory CD4+ T cells, and resting activated mast cells. (Figure 9B).
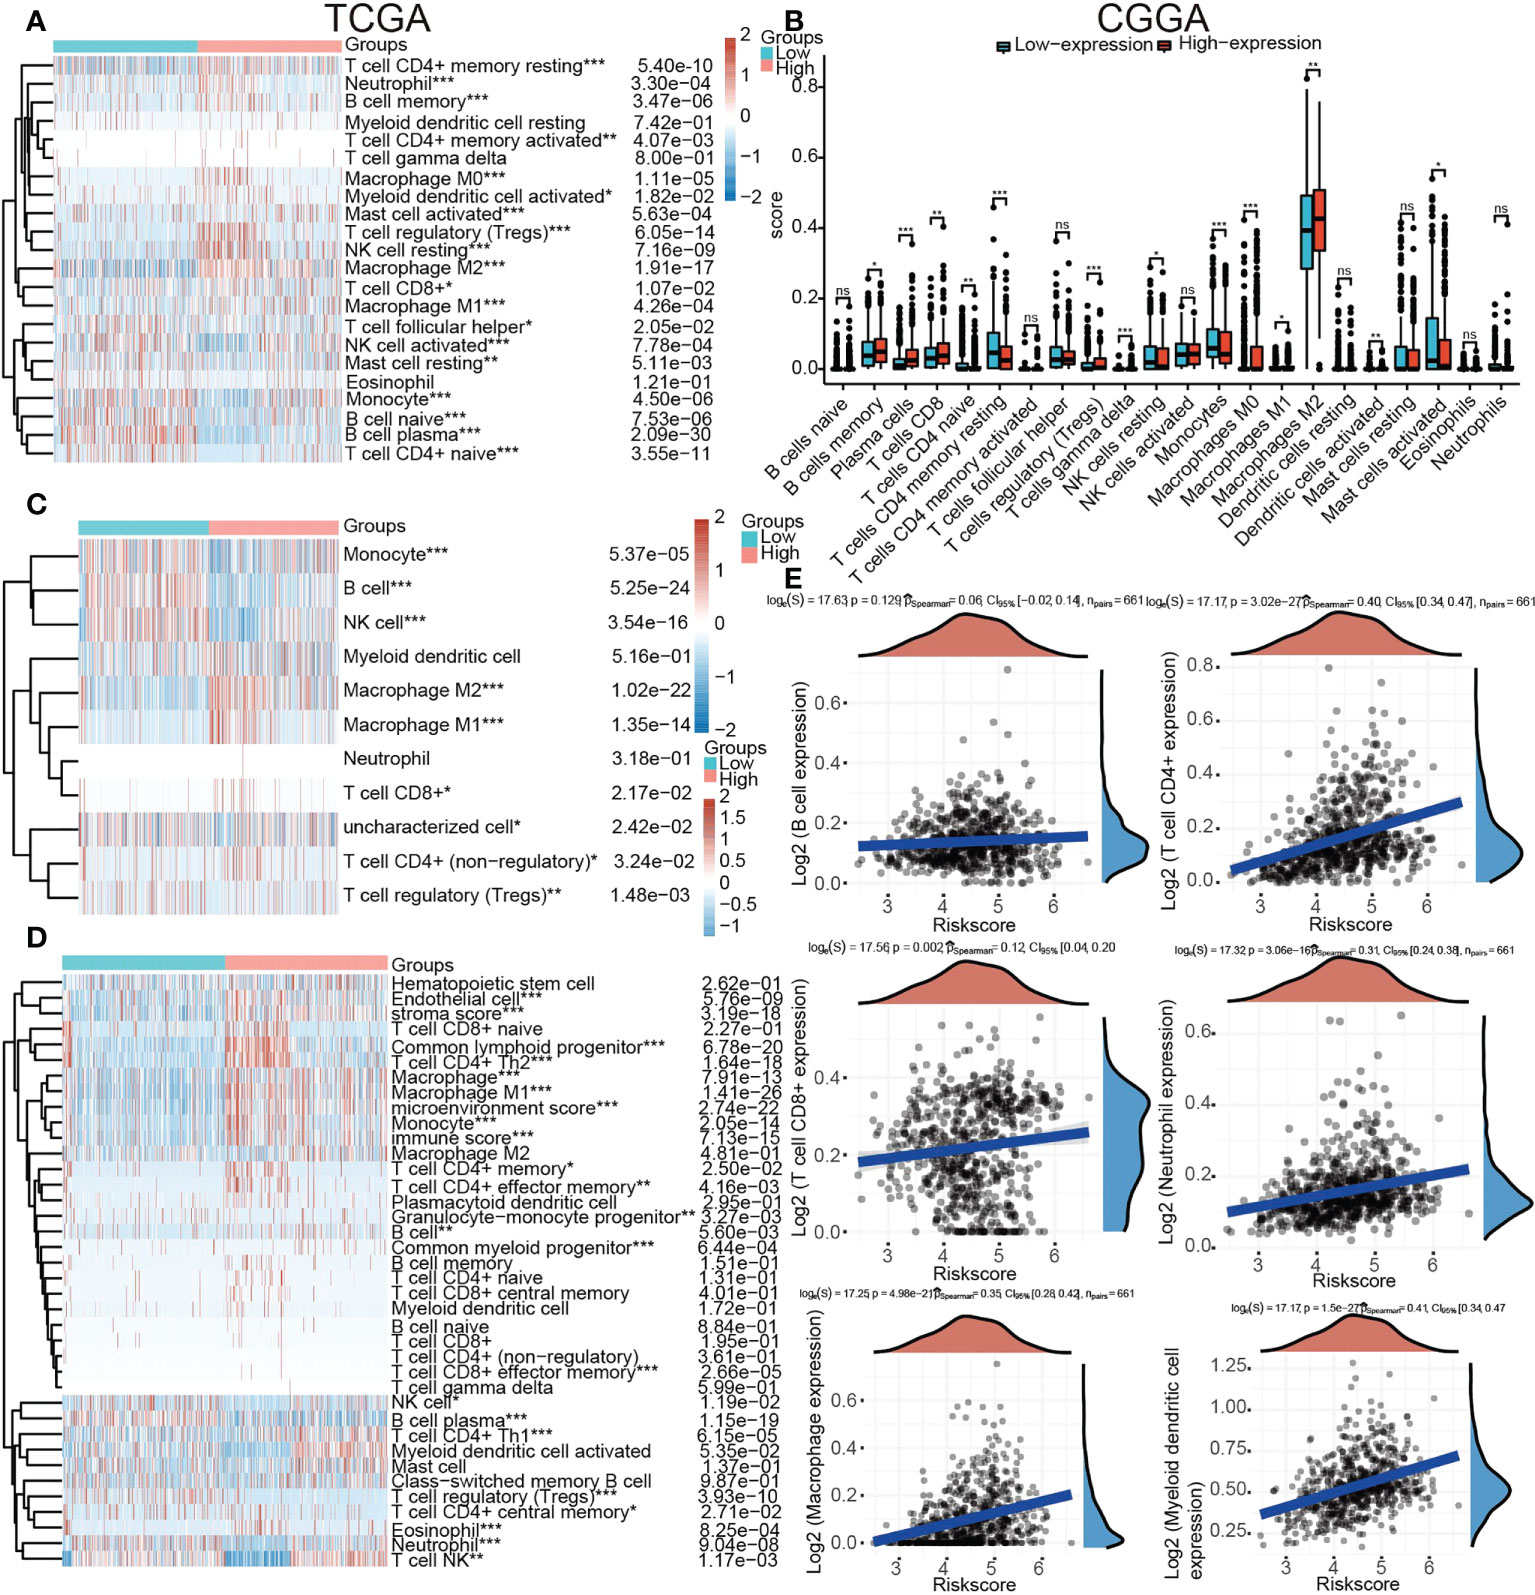
Figure 9 Relationships between TP53I13 expression and different tumor immune lymphocytes (A) using the CIBERSORT algorithm on samples obtained from TCGA database, (B) using the CIBERSORT algorithm on samples obtained from CGGA database, (C) using the quanTiseq algorithm on samples obtained from on TCGA database, (D) by using the xCell algorithm on samples obtained from on TCGA database, and (E) by using the TIMER algorithm on samples obtained from on TCGA database. *P < 0.05, **P < 0.01, ***P < 0.001.
An algorithmic approach combining quanTiseq, xCell, and TIMER was employed to determine whether TP53I13 expression correlates with tumor immune lymphocytes. In glioma patients who had high levels of TP53I13 expression, the levels of M2 macrophages increased significantly, according to the quanTiseq algorithm (Figure 9C). The analysis performed using the xCell algorithm shows that the levels of M1 and M2 macrophages, common lymphoid progenitors, CD4+ Th2 cells, and neutrophils decreased in the low-immunity group compared to the high-immunity group (Figure 9D). Further, high-immunity groups showed significant growth in myeloid dendritic cells, neutrophils, macrophages, and CD4+ T cells based on the TIMER algorithm. (Figure 9E). The mIHC results confirm the relationship between TP53I13 and macrophage markers such as (CD68 and CD163), neutrophils (CD66b), and fibroblasts (S100A4) (Figure 10A). Our results reveal a significant positive correlation between TP53I13 expression and macrophages, neutrophils, and fibroblasts. Together, these analyses show that the high levels of macrophages, neutrophils, and fibroblasts in the high-immunity group facilitate tumor migration and development. By comparing the median expression levels of TP53I13 in the samples, two groups were formed. According to the results, CD68+ expression in the low expression group of TP53I13 was lower than that in the high expression group of TP53I13 (Figure 10B). Further, in the TP53I13 low expression group, compared with the TP53I13 high expression group, the number of CD68+CD163+, S100A4, and CD68b+ cells decreased (Figures 10C-E). A high expression level of CD68+ and CD68+CD163+ led to a poor prognosis compared to a low expression level of CD68+ and CD68+CD163+ (Figures 10F, G). However, the prognostic value of CD66b+ was not remarkable (Figure 10H).
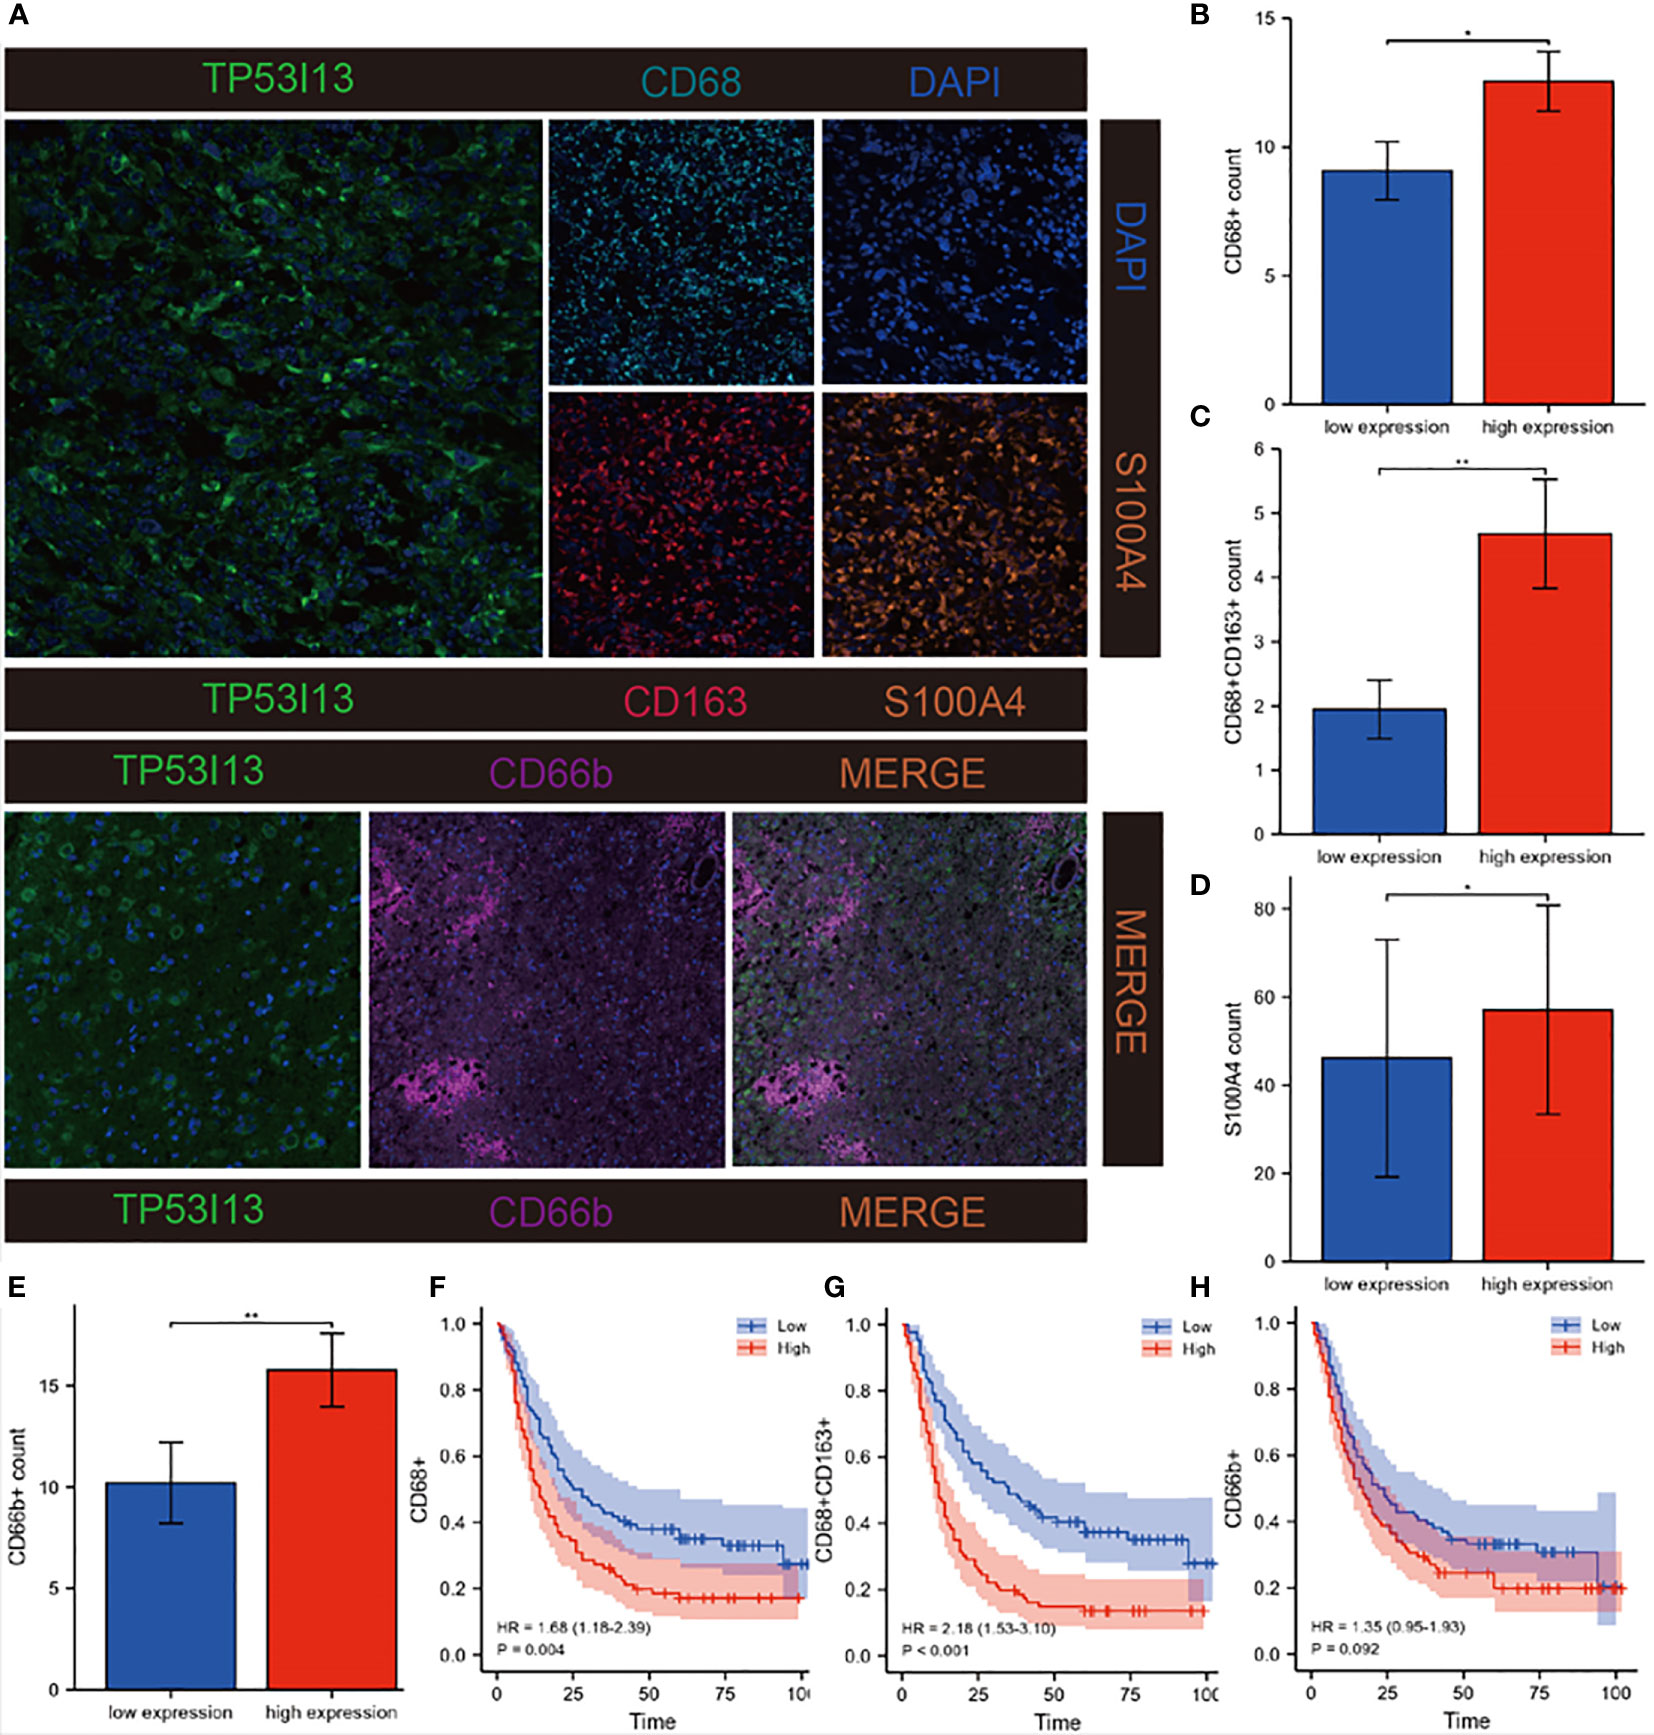
Figure 10 Investigation of correlations between TP53I13 and macrophages, neutrophils, and CAFs markers on samples from Nantong University Affiliated Hospital. (A) mIHC of TP53I13 and different macrophage markers (CD68, CD163), neutrophils marker (CD66b), and CAFs marker (S100A4). (B-E) The relationships between the TP53I13 expression and CD68+, CD68+CD163+, S100A4, and CD66b+. (F-H) Survival analysis of TP53I13 high- and low-expression and CD68+, CD68+CD163+, and CD66b+. *P < 0.05, **P < 0.01.
Further, we investigated the link between immune cell infiltration and the TP53I13 protein expression with radiotherapy status and tumor types in glioma patients using TIMER, CIBERSORT, quanTiseq, and the xCell algorithm. Regardless of the algorithm used, patients who underwent radiotherapy and expressed high TP53I13 levels had a high level of macrophages. It is interesting to note that radiotherapy has the lowest survival rate among patients with high expression levels of TP53I13, which may be associated with the increase in macrophage levels (Figure 5, Supplementary Figure 7).
According to a previous report, checkpoint blockade therapy induced immune cell infiltration in the TME (23). As a result, we explored different genes involved in immune checkpoints in relation to TP53I13 (Supplement Figure 8A). Results showed that major immune checkpoint genes, such as CD44 (R = 0.51), LGALS9 (R = 0.51), LAIR1 (R = 0.51), CD274 (R = 0.39) and TNFRSF14 (R=0.69), are directly related to TP53I13 expression. Immunohistochemical localization shows that TP53I13 significantly correlates with CD274 (Supplementary Figure 8B).
Finally, the AUC values of Siglec15, CTLA-4, PD-L1 and TP53I13 were compared, and the ROC curve was calculated to evaluate whether TP53I13 could predict the immune infiltration of glioma. The results showed that TP53I13 had higher predictive power than other markers (AUC = 0.822, 95%CI = 0.802-0.842) (Supplementary Figures 9A-D).
Knockdown of TP53I13 expression alters with cell migration and invasion, apoptosis, and cell cycle
To investigate the biological function of TP53I13, the U87 and U251 cells were transfected with siRNA-NC and TP53I13-specific siRNAs (si-1, si-2, and si-3). qRT-PCR results reveal that siRNA1 was the most effective in silencing the expression of TP53I13 after 48 h of treatment (Figure 11A). Cell migration and cell cycle were analyzed using the transwell assay and flow cytometry, respectively. TP53I13-siRNA1 transfected U87, and U251 cells showed diminished cell migration and invasion ability and increased apoptosis rate (Figures 11B-E). In cells knocked down for TP53I13, the percentage of S phase cells increased and the percentage of G2/M phase cells decreased (Figures 11F-I). Glioma cells with knockdown of TP53I13 expression exhibit reduced migration and invasion abilities and induce apoptosis.
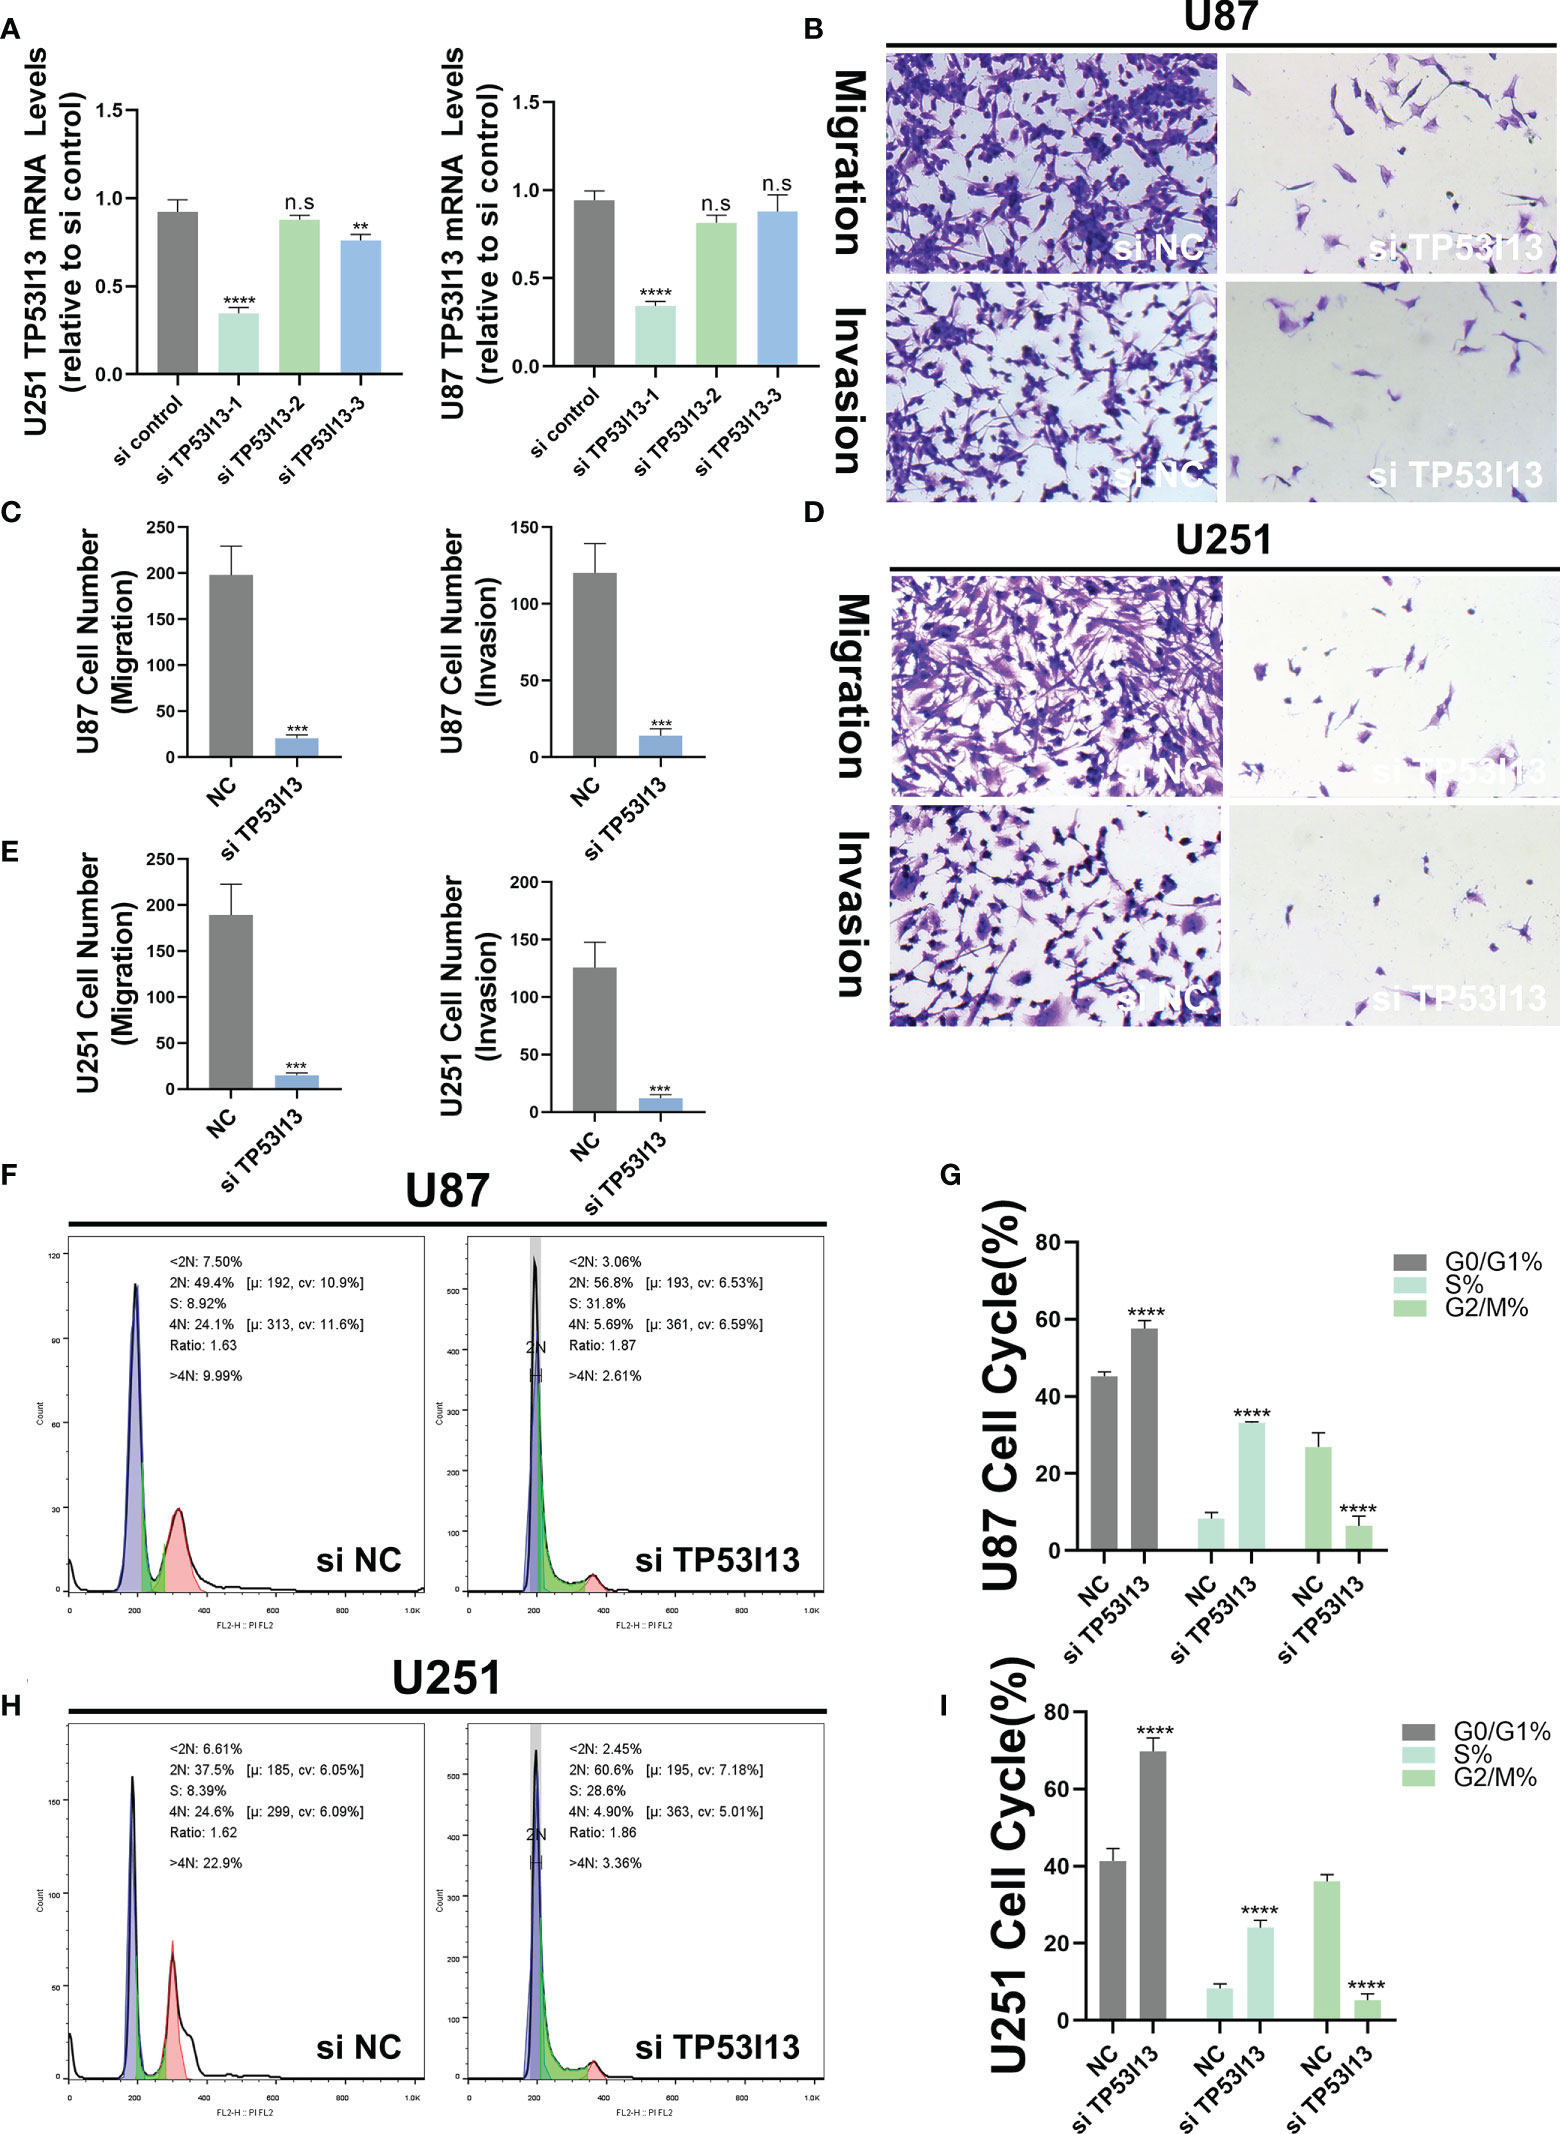
Figure 11 TP53I13 promotes glioma cell migration and invasion in vitro. (A) Validation of siRNA interference efficiency in knockdown of TP53I13 expression in U87 and U251 cells by RT-PCR (B-E) Transwell migration and invasion assay in the NC and TP53I13 knockdown cells, and quantitative analysis of cell numbers. (F-I) Flow cytometry was performed on the NC and TP53I13 knockdown cells to detect the cell cycle and to quantify the percentage of cells at different phases. **p ≤ 0.01, *** p ≤ 0.001 and ***p ≤ 0.0001. ns, no significance.
Discussion
Gliomas are classified as low- and high-grade by the World Health Organization (WHO). It is a lethal disease with a high CNV burden (24, 25). Moreover, it has been shown that focal lesions of the glioma (LGG or GBM) have a widespread influence, even in the hemisphere contralateral to the site of the lesion (26). The complicated pathogenesis of gliomas, the invasive behavior of this tumor, and the vigorous proliferative ability of the cells makes it challenging to treat gliomas (27, 28). Currently, few treatment choices are available for glioma patients, like surgery, radiation, and chemotherapy (29, 30). However, due to the low success rate, the outcomes of these therapies remain frustrating (31). Targeted immunotherapy is a novel treatment strategy for the treatment of glioma patients (32). Thus, identifying a new targeted therapeutic approach for treating glioma is the need of the hour.
When overexpressed, tumor protein p53 inducible protein 13 (TP53I13) plays a tumor suppressor role, thereby preventing tumor development. Genotoxic stressors, such as Adriamycin and/or UV irradiation, that increase the levels of TP53I13 in a p53/TP53-dependent manner (33). In a previous study, downregulation of TP53I13 was reported in adipose tissue in obese individuals, and its expression was reported in monocytes, macrophages, and adipocytes (34). In the presence of N4-Eru, elevated levels of TP53I13 serve as a tumor suppressor in T-cell acute lymphoblastic leukemia (ALL) cells (Jurkat cells) (12). During the early stages of AD, the methylation levels of TP53I13 are high (35). A significant role in the TME might be played by the upregulation of TP53I13 expression in cancer and infiltrating immune cells.
In our study, data on glioma patients were retrieved from the CGGC and TCGA databases. It has been shown that TP53I13 expression is higher in patients with gliomas. A significant correlation was found between TP53I13 expression and tumor grade, chemotherapy, co-delete of 1p and 19q, and IDH mutations. These results indicate that a high TP53I13 expression could be malignant to the cells. These results were further verified by immunohistochemistry and were consistent with bioinformatics analysis. Glioma patients’ TP53I13 levels were directly associated with prognosis in Multivariate Cox analysis. TP53I13 expression is also associated with a poor prognosis in glioma patients. Therefore, it would seem that TP53I13 could be a potential therapeutic target and prognostic biomarker for gliomas. Further, the mechanism associated with TP53I13 in glioma was investigated. It is likely that the levels of TP53I13 expression may vary in tumor and paracancerous groups; hence, we explored this conjecture by analyzing DElncRNAs, DEmRNAs, and DEmiRNAs in glioma samples. Further, the top 50 genes which negatively and positively correlated with TP53I13 were identified and analyzed to understand the molecular mechanisms associated with TP53I13. PPI analysis revealed that significant correlation betweenTP53 and TP53I13. A previous study reported that TP53 mutations and polymorphisms are frequently reported in glioma patients, which is the primary risk factor in gliomas (36). Studies have shown that knockdown of TP53-induced regulator of glycolysis and apoptosis (TIGAR) sensitizes glioma cells to hypoxia, irradiation, and temozolomide (37, 38). In mIDH1 mouse glioma model experiments, after TP53 and ATRX knockdown, glioma patients with IDH1-R132H exhibited increased DNA damage repair (DDR) activity and enhanced genomic stability (39). Therefore, a combination of DDR inhibitors and radiation might be an innovative therapeutic approach for treating glioma patients harboring IDH1-R132H mutation along with ATRX and TP53 inactivating mutations (39). Studies have shown that mutations in TP53 mutation are reported in 94% of glioma patients harboring IDH-mutation and patients without 1p/19q codeletion and is an important regulator of glioma progression (40, 41). Considering the close correlation between TP53I13 and TP53, it is likely that TP53I13 knockdown may increase sensitivity to radiation in glioma patients and decrease the progression of the disease. As a result of these results, TP53I13 may become a potential biomarker for the treatment of gliomas in the future.
In order to determine how TP53I13 functions biologically, GO and KEGG pathway enrichment analyses were performed. The results showed a correlation betweenTP53I13 and different signaling pathways, including cell cycle, DNA replication, protein processing, and body metabolism. High TP53I13 expression enriched pathways like ERBB, GNRH, MAPK, P53, and WNT signaling pathways, bladder cancer, tumor necrosis factor-mediated signaling pathway, embryonic development, and normal adult homeostasis (42). A study revealed that dysregulation of WNT signaling pathways is associated with the pathogenesis of various diseases (43). Therefore, high TP53I13 expression resulting in poor survival outcomes may be associated with these pathways. In order to better understand TP53I13’s role in the pathogenesis of gliomas, in vivo models need to be validated. There is evidence that immune infiltration and tumor microenvironment play a crucial role in cancer pathogenesis (44, 45). Therefore, CIBERSORT, quanTiseq, xCell, and TIMER were used to investigate the correlation between TP53I13 expression and various tumor-infiltrating immune cells. The results show a positive correlation between TP53I13 and macrophages. Macrophages are one of the most important immune cells and alter the tumor immune microenvironment by modulating the levels of angiogenic and immunosuppressive molecules (46, 47). Cytokines and chemokines secreted by macrophages are essential in regulating the immune response in complex tissue microenvironment (48). A study reports that glioma cells can activate macrophages, which further activates tumor cells (49). Additionally, macrophages account for 30–50% of the glioma TME and are found mainly in glioma cells (50). Further, macrophages aid in the growth of glioma cells, which could explain the increased malignancy and poor prognosis of high-grade glioma patients (51). In addition to macrophages, neutrophils also play a role in tumor metastasis (3). In addition, neutrophils express high Ki-67 levels, which is a marker for the degree of malignancy of the tumors. Using bioinformatics analysis and mIHC, we have identified a close relationship between TP53I13 and neutrophils. Further TP53I13 expression was higher in neutrophils, which suggests that TP53I13 may promote tumor metastasis via neutrophils. Mounting evidence has shown that cancer-associated fibroblasts (CAFs) produce a variety of cytokines or metabolic products with immunogenic functions that can promote tumor invasion and metastasis. CAF can also alter the tumor matrix, which forms a barrier for drug or therapeutic immune cell infiltration, thereby preventing the influx of drugs and immune cells into the tumor tissue, which reduces the tumor therapeutic effect (52). S100A4 is a CAF marker; hence, the correlation between TP53I13 and S100A4 was evaluated. The results show an increased TP53I13 expression in CAF, elevated TP53I13 expression in CAF may be associated with poor prognostic outcomes in glioma patients.
This study has enhanced the understanding of TP53I13 expression in glioma patients. However, the study had several limitations. First, the sample size is one of the limitations of our study. The number of samples used was few; hence, additional samples are required to validate our findings further. Second, TP53I13 functions and mechanisms in glioma need to be further explored.
Nevertheless, with a detailed bioinformatics analysis, we laid the groundwork for understanding TP53I13’s role in gliomas. Additionally, Nantong’s Affiliated Hospital provided 183 patient samples, confirming TP53I13’s prognostic value in predicting glioma outcomes. As a result, our research becomes even more valuable.
Conclusion
Finally, highTP53I13 expression was observed in glioma patients, resulting in poor prognosis and immune infiltration. In conclusion, our results suggest that TP53I13 may serve as a potential diagnostic and treatment biomarker for glioma patients.
Data availability statement
The datasets presented in this study can be found in online repositories. The names of the repository/repositories and accession number(s) can be found in the article/Supplementary Material.
Ethics statement
The experimental protocol was established, according to the ethical guidelines of the Helsinki Declaration. Ethical permissions were granted by the Ethics Committee at Affiliated Hospital of Nantong University (No. 2018-K020). Written informed consent was obtained from individual or guardian participants. The patients/participants provided their written informed consent to participate in this study.
Author contributions
XG, MX and TC performed most of the experiments, analyzed data, and wrote the manuscript. NH, PS and BL reviewed and edited the manuscript. ZW and JL is the guarantor of this work and has full access to all data in the study. The authors read and approved the final manuscript.
Funding
This work was supported by the Scientific Research Project of Jiangsu Provincine Health Commission [grant number H2017052], China. Postgraduate Research & Practice Innovation Program of Jiangsu Province (No. SJCX21_1463).
Acknowledgments
We acknowledge the Scientific Research Project of Jiangsu Provincine Health Commission [grant number H2017052] to support our study.
Conflict of interest
The authors declare that the research was conducted in the absence of any commercial or financial relationships that could be construed as a potential conflict of interest.
Publisher’s note
All claims expressed in this article are solely those of the authors and do not necessarily represent those of their affiliated organizations, or those of the publisher, the editors and the reviewers. Any product that may be evaluated in this article, or claim that may be made by its manufacturer, is not guaranteed or endorsed by the publisher.
Supplementary material
The Supplementary Material for this article can be found online at: https://www.frontiersin.org/articles/10.3389/fimmu.2022.974346/full#supplementary-material
Supplementary Figure 1 | (A) Correlations between tumor and normal samples based on samples from Nantong University Affiliated Hospital. (B) Survival analysis of glioma patients having low and high expression levels of TP53I13 based on samples from Nantong University Affiliated Hospital. (C) Univariate Cox analysis of TP53I13 expression and clinical characteristics based on 159 glioma patients from Nantong University Affiliated Hospital.
Supplementary Figure 2 | Boxplot shows relationships between TP53I13 expression and IDH mutation status based on (A) the CGGA mRNAseq_325 dataset, (B) the CGGA mRNAseq_693 dataset, and (C) the TCGA database. Boxplot shows relationships between TP53I13 expression and 1p/19q codeletion status based on (D) the CGGA mRNAseq_325 dataset, (E) the CGGA mRNAseq_693 dataset, and (F) the TCGA database.
Supplementary Figure 3 | Comparison of Kaplan–Meier survival curves for OS of the low and high expression levels of TP53I13 in glioma based on clinical characteristics. (A) WHO grade 2, (B) WHO grade 3 and 4, (C) IDH wild-type, (D) IDH mutation, (E) 1p/19q codeletion, (F) 1p/19q non-codeletion, (G) Female, (H) Male.
Supplementary Figure 4 | Comparison of Kaplan–Meier survival curves for DSS of TP53I13 high and low expression levels in glioma based on clinical characteristics. (A) WHO grade 2, (B) WHO grade 3 and 4, (C) IDH wildtype, (D) IDH mutation, (E) 1p/19q codeletion, (F) 1p/19q non-codeletion, (G) Female, (H) Male.
Supplementary Figure 5 | Differentially expressed genes correlated with TP53I13 expression. (A) Relationships between TP53I13 and differentially expressed genes in glioma by using Pearson correlation. (B) Heatmaps illustrate the top 50 genes closely and positively correlated with TP53I13 in glioma. (C) Heatmaps show the top 50 genes closely and negatively correlated with TP53I13 in glioma. (D) PPI network for 20 key genes that are strongly correlated with TP53I13. (E) PPI network of TP53I13 analyzed by GeneMANIA. (F) Analysis of TP53I13-correlated proteins based on the PPI network by using the Cytoscape tool.
Supplementary Figure 6 | (A) TP53I13 copy number variation (CNV) influences infiltrating of neutrophils, dendritic cells, and CD4+ T cells in GBM and B cells and dendritic cells in LGG. The expression TP53I13 in different immune cell subtypes in (B) GBM and (C) LGG. C1: wound healing; C2: IFN-gamma dominant; C3: inflammatory; C4: lymphocyte depleted; C5: immunologically quiet; C6: TGF-b dominant. Single-cell analysis of TP53I13 expression in glioma based on the (D) scTIME database and (E) the TISCH database.
Supplementary Figure 7 | Relationship between the high and low TP53I13 expression and radiotherapy using (A) TIMER, (B) CIBERSORT, (C) quanTiseq, and (D) the xCell algorithm. G1: low TP53I13 expression without radiotherapy; G2: low TP53I13 expression with radiotherapy; G3: high TP53I13 expression level without radiotherapy; G4: high TP53I13 expression with radiotherapy.
Supplementary Figure 8 | (A) Relationship between TP53I13 and different immune checkpoint genes. (B) IHC was used to study the correlations between TP53I13 and CD274
Supplementary Figure 9 | Comparisons of predictive power for glioma infiltration between (A) TP53I13 and common markers, such as (B) PD-L1, (C) CTLA-4, and (D) Siglec15.
Supplementary Table 4 | The antibodies used in this study.
References
1. Jonsson P, Lin AL, Young RJ, DiStefano NM, Hyman DM, Li BT, et al. Genomic correlates of disease progression and treatment response in prospectively characterized gliomas. Clin Cancer Res (2019) 25(18):5537–47. doi: 10.1158/1078-0432.CCR-19-0032
2. Yuan J, Levitin HM, Frattini V, Bush EC, Boyett DM, Samanamud J, et al. Single-cell transcriptome analysis of lineage diversity in high-grade glioma. Genome Med (2018) 10(1):57–7. doi: 10.1186/s13073-018-0567-9
3. Szczerba BM, Castro-Giner F, Vetter M, Krol I, Gkountela S, Landin J, et al. Neutrophils escort circulating tumour cells to enable cell cycle progression. Nature (2019) 566(7745):553–7. doi: 10.1038/s41586-019-0915-y
4. Molinaro AM, Taylor JW, Wiencke JK, Wrensch MR. Genetic and molecular epidemiology of adult diffuse glioma. Nat Rev Neurol (2019) 15(7):405–17. doi: 10.1038/s41582-019-0220-2
5. Bosma I, Douw L, Bartolomei F, Heimans JJ, van Dijk BW, Postma TJ, et al. Synchronized brain activity and neurocognitive function in patients with low-grade glioma: A magnetoencephalography study. Neuro Oncol (2008) 10(5):734–44. doi: 10.1215/15228517-2008-034
6. Tu Z, Wu L, Wang P, Hu Q, Tao C, Li K, et al. N6-Methylandenosine-Related lncRNAs are potential biomarkers for predicting the overall survival of lower-grade glioma patients. Front Cell Dev Biol (2020) 8:642. doi: 10.3389/fcell.2020.00642
7. Choi KS, Choi SH, Jeong B. Prediction of IDH genotype in gliomas with dynamic susceptibility contrast perfusion MR imaging using an explainable recurrent neural network. Neuro Oncol (2019) 21(9):1197–209. doi: 10.1093/neuonc/noz095
8. Fang B, Li G, Xu C, Hui Y, Li G. MicroRNA miR-1249 downregulates adenomatous polyposis coli 2 expression and promotes glioma cells proliferation. Am J Transl Res (2018) 10(5):1324–36.
9. Xue J, Gao H-X, Sang W, Cui W-L, Liu M, Zhao Y, et al. Identification of core differentially methylated genes in glioma. Oncol Lett (2019) 18(6):6033–45. doi: 10.3892/ol.2019.10955
10. Li L, Song S, Fang X, Cao D. Role of ATF3 as a prognostic biomarker and correlation of ATF3 expression with macrophage infiltration in hepatocellular carcinoma. BMC Med Genomics (2021) 14(1):8. doi: 10.1186/s12920-020-00852-4
11. Snezhkina AV, Lukyanova EN, Kalinin DV, Pokrovsky AV, Dmitriev AA, Koroban NV, et al. Exome analysis of carotid body tumor. BMC Med Genomics (2018) 11(Suppl 1):17. doi: 10.1186/s12920-018-0327-0
12. Razvi SS, Choudhry H, Hasan MN, Hassan MA, Moselhy SS, Abualnaja KO, et al. Identification of deregulated signaling pathways in jurkat cells in response to a novel acylspermidine analogue-N(4)-Erucoyl spermidine. Epigenet Insights (2018) 11:2516865718814543. doi: 10.1177/2516865718814543
13. Alonso-de Vega I, Paz-Cabrera MC, Rother MB, Wiegant WW, Checa-Rodríguez C, Hernández-Fernaud JR, et al. PHF2 regulates homology-directed DNA repair by controlling the resection of DNA double strand breaks. Nucleic Acids Res (2020) 48(9):4915–27. doi: 10.1093/nar/gkaa196
14. Zhang Y, Wang Z, Ma J, Huo J, Li Y, Wang Y, et al. Bioinformatics identification of the expression and clinical significance of E2F family in endometrial cancer. Front Genet (2020) 11:557188. doi: 10.3389/fgene.2020.557188
15. Nussbaum YI, Manjunath Y, Suvilesh KN, Warren WC, Shyu C-R, Kaifi JT, et al. Current and prospective methods for assessing anti-tumor immunity in colorectal cancer. Int J Mol Sci (2021) 22(9):4802. doi: 10.3390/ijms22094802
16. Li Y, Li P, Wang N. Effect of let-7c on the PI3K/Akt/FoxO signaling pathway in hepatocellular carcinoma. Oncol Lett (2021) 21(2):96–6. doi: 10.3892/ol.2020.12357
17. Jiang J, Liu B, Liu R, Yang W. Overexpression of taspase 1 predicts poor prognosis in patients with hepatocellular carcinoma. Cancer Manag Res (2021) 13:2517–37. doi: 10.2147/cmar.S296069
18. Song G, Shi Y, Zhang M, Goswami S, Afridi S, Meng L, et al. Global immune characterization of HBV/HCV-related hepatocellular carcinoma identifies macrophage and T-cell subsets associated with disease progression. Cell Discovery (2020) 6(1):90–0. doi: 10.1038/s41421-020-00214-5
19. Zeng X, Liu G, Pan Y, Li Y. Development and validation of immune inflammation-based index for predicting the clinical outcome in patients with nasopharyngeal carcinoma. J Cell Mol Med (2020) 24(15):8326–49. doi: 10.1111/jcmm.15097
20. Haas G, Fan S, Ghadimi M, De Oliveira T, Conradi L-C. Different forms of tumor vascularization and their clinical implications focusing on vessel Co-option in colorectal cancer liver metastases. Front Cell Dev Biol (2021) 9:612774. doi: 10.3389/fcell.2021.612774
21. Mauriello A, Zeuli R, Cavalluzzo B, Petrizzo A, Tornesello ML, Buonaguro FM, et al. High somatic mutation and neoantigen burden do not correlate with decreased progression-free survival in HCC patients not undergoing immunotherapy. Cancers (Basel) (2019) 11(12):1824. doi: 10.3390/cancers11121824
22. Sheng Z, Yu J, Deng K, Andrade-Barazarte H, Zemmar A, Li S, et al. Characterizing the genomic landscape of brain glioma with circulating tumor DNA from tumor In situ fluid. Front Oncol (2021) 11:584988. doi: 10.3389/fonc.2021.584988
23. Zhou J, Li X, Zhang M, Gong J, Li Q, Shan B, et al. The aberrant expression of rhythm genes affects the genome instability and regulates the cancer immunity in pan-cancer. Cancer Med Mar (2020) 9(5):1818–29. doi: 10.1002/cam4.2834
24. Truitt G, Gittleman H, Leece R, Ostrom QT, Kruchko C, Armstrong TS, et al. Partnership for defining the impact of 12 selected rare CNS tumors: a report from the CBTRUS and the NCI-CONNECT. J Neurooncol (2019) 144(1):53–63. doi: 10.1007/s11060-019-03215-x
25. Boyé K, Pujol N D, Alves I, Chen Y-P, Daubon T, Lee Y-Z, et al. The role of CXCR3/LRP1 cross-talk in the invasion of primary brain tumors. Nat Commun (2017) 8(1):1571–1. doi: 10.1038/s41467-017-01686-y
26. De Baene W, Jansma MJ, Schouwenaars IT, Rutten G-JM, Sitskoorn MM. Task-evoked reconfiguration of the fronto-parietal network is associated with cognitive performance in brain tumor patients. Brain Imaging Behav (2020) 14(6):2351–66. doi: 10.1007/s11682-019-00189-2
27. Everson RG, Antonios JP, Lisiero DN, Soto H, Scharnweber R, Garrett MC, et al. Efficacy of systemic adoptive transfer immunotherapy targeting NY-ESO-1 for glioblastoma. Neuro Oncol (2016) 18(3):368–78. doi: 10.1093/neuonc/nov153
28. Zang L, Kondengaden SM, Che F, Wang L, Heng X. Potential epigenetic-based therapeutic targets for glioma. Front Mol Neurosci (2018) 11:408. doi: 10.3389/fnmol.2018.00408
29. Chen Z, Wei X, Shen L, Zhu H, Zheng X. 20(S)-ginsenoside-Rg3 reverses temozolomide resistance and restrains epithelial-mesenchymal transition progression in glioblastoma. Cancer Sci (2019) 110(1):389–400. doi: 10.1111/cas.13881
30. Wang Y, Wild AT, Turcan S, Wu WH, Sigel C, Klimstra DS, et al. Targeting therapeutic vulnerabilities with PARP inhibition and radiation in IDH-mutant gliomas and cholangiocarcinomas. Sci Adv (2020) 6(17):eaaz3221–eaaz3221. doi: 10.1126/sciadv.aaz3221
31. Hu T, Xi J. Identification of COX5B as a novel biomarker in high-grade glioma patients. Onco Targets Ther (2017) 10:5463–70. doi: 10.2147/OTT.S139243
32. Liao Z-Q, Ye M, Yu P-G, Xiao C, Lin F-Y. Glioma-associated oncogene Homolog1 (Gli1)-Aquaporin1 pathway promotes glioma cell metastasis. BMB Rep (2016) 49(7):394–9. doi: 10.5483/bmbrep.2016.49.7.011
33. Hata T, Ogawa T, Yokoyama TA, Fukushige S, Horii A, Furukawa T. DSCP1, a novel TP53-inducible gene, is upregulated by strong genotoxic stresses and its overexpression inhibits tumor cell growth in vitro. Int J Oncol (2004) 24(3):513–20. doi: 10.3892/ijo.24.3.513
34. Liu Y, Ferguson JF, Xue C, Ballantyne RL, Silverman IM, Gosai SJ, et al. Tissue-specific RNA-seq in human evoked inflammation identifies blood and adipose LincRNA signatures of cardiometabolic diseases. Arterioscler Thromb Vasc Biol (2014) 34(4):902–12. doi: 10.1161/atvbaha.113.303123
35. Blanco-Luquin I, Acha B, Urdánoz-Casado A, Sánchez-Ruiz De Gordoa J, Vicuña-Urriza J, Roldán M, et al. Early epigenetic changes of alzheimer's disease in the human hippocampus. Epigenetics (2020) 15(10):1083–92. doi: 10.1080/15592294.2020.1748917
36. Wang X, Sun C-L, Hageman L, Smith K, Singh P, Desai S, et al. Clinical and genetic risk prediction of subsequent CNS tumors in survivors of childhood cancer: A report from the COG ALTE03N1 study. J Clin Oncol Off J Am Soc Clin Oncol (2017) 35(32):3688–96. doi: 10.1200/JCO.2017.74.7444
37. Maurer GD, Heller S, Wanka C, Rieger J, Steinbach JP. Knockdown of the TP53-induced glycolysis and apoptosis regulator (TIGAR) sensitizes glioma cells to hypoxia, irradiation and temozolomide. Int J Mol Sci (2019) 20(5):1061. doi: 10.3390/ijms20051061
38. Zhang Y, Chen F, Tai G, Wang J, Shang J, Zhang B, et al. TIGAR knockdown radiosensitizes TrxR1-overexpressing glioma in vitro and in vivo via inhibiting Trx1 nuclear transport. Sci Rep (2017) 7:42928–8. doi: 10.1038/srep42928
39. Núñez FJ, Mendez FM, Kadiyala P, Alghamri MS, Savelieff MG, Garcia-Fabiani MB, et al. IDH1-R132H acts as a tumor suppressor in glioma via epigenetic up-regulation of the DNA damage response. Sci Transl Med (2019) 11(479):eaaq1427. doi: 10.1126/scitranslmed.aaq1427
40. Lin X, Jiang T, Bai J, Li J, Wang T, Xiao J, et al. Characterization of transcriptome transition associates long noncoding RNAs with glioma progression. Mol Ther Nucleic Acids (2018) 13:620–32. doi: 10.1016/j.omtn.2018.10.009
41. Datta I, Noushmehr H, Brodie C, Poisson LM. Expression and regulatory roles of lncRNAs in G-CIMP-low vs G-CIMP-high glioma: an in-silico analysis. J Transl Med (2021) 19(1):182–2. doi: 10.1186/s12967-021-02844-z
42. Bai R, Wu D, Shi Z, Hu W, Li J, Chen Y, et al. Pan-cancer analyses demonstrate that ANKRD6 is associated with a poor prognosis and correlates with M2 macrophage infiltration in colon cancer. Chin J Cancer Res (2021) 33(1):93–102. doi: 10.21147/j.issn.1000-9604.2021.01.10
43. Nusse R, Clevers H. Wnt/β-catenin signaling, disease, and emerging therapeutic modalities. Cell (2017) 169(6):985–99. doi: 10.1016/j.cell.2017.05.016
44. Sharma P, Hu-Lieskovan S, Wargo JA, Ribas A. Primary, adaptive, and acquired resistance to cancer immunotherapy. Cell (2017) 168(4):707–23. doi: 10.1016/j.cell.2017.01.017
45. Zhu J, Petit PF, Van den Eynde BJ. Apoptosis of tumor-infiltrating T lymphocytes: A new immune checkpoint mechanism. Cancer Immunol Immunother (2019) 68(5):835–47. doi: 10.1007/s00262-018-2269-y
46. Sato J, Kitano S, Motoi N, Ino Y, Yamamoto N, Watanabe S, et al. CD20(+) tumor-infiltrating immune cells and CD204(+) M2 macrophages are associated with prognosis in thymic carcinoma. Cancer Sci (2020) 111(6):1921–32. doi: 10.1111/cas.14409
47. Yuan Y, Jiang Y, Wang B, Guo Y, Gong P, Xiang L. Deficiency of calcitonin gene-related peptide affects macrophage polarization in osseointegration. Front Physiol (2020) 11:733. doi: 10.3389/fphys.2020.00733
48. Muñoz-Rojas AR, Kelsey I, Pappalardo JL, Chen M, Miller-Jensen K. Co-Stimulation with opposing macrophage polarization cues leads to orthogonal secretion programs in individual cells. Nat Commun (2021) 12(1):301–1. doi: 10.1038/s41467-020-20540-2
49. Komohara Y, Horlad H, Ohnishi K, Fujiwara Y, Bai B, Nakagawa T, et al. Importance of direct macrophage-tumor cell interaction on progression of human glioma. Cancer Sci (2012) 103(12):2165–72. doi: 10.1111/cas.12015
50. Zhang M, Wang X, Chen X, Zhang Q, Hong J. Novel immune-related gene signature for risk stratification and prognosis of survival in lower-grade glioma. Front Genet (2020) 11:363. doi: 10.3389/fgene.2020.00363
51. Xu S, Tang L, Liu Z, Yang K, Cheng Q. Bioinformatic analyses identify a prognostic autophagy-related long non-coding RNA signature associated with immune microenvironment in diffuse gliomas. Front Cell Dev Biol (2021) 9:694633. doi: 10.3389/fcell.2021.694633
Keywords: TP53I13, TCGA, CGGA, CIBERSORT, IHC, immune infiltration, TME
Citation: Ge X, Xu M, Cheng T, Hu N, Sun P, Lu B, Wang Z and Li J (2022) TP53I13 promotes metastasis in glioma via macrophages, neutrophils, and fibroblasts and is a potential prognostic biomarker. Front. Immunol. 13:974346. doi: 10.3389/fimmu.2022.974346
Received: 21 June 2022; Accepted: 20 September 2022;
Published: 07 October 2022.
Edited by:
Jinghua Pan, Jinan University, ChinaReviewed by:
Yumin Wang, First Affiliated Hospital of Wenzhou Medical University, ChinaGang Ji, Fourth Military Medical University, China
Copyright © 2022 Ge, Xu, Cheng, Hu, Sun, Lu, Wang and Li. This is an open-access article distributed under the terms of the Creative Commons Attribution License (CC BY). The use, distribution or reproduction in other forums is permitted, provided the original author(s) and the copyright owner(s) are credited and that the original publication in this journal is cited, in accordance with accepted academic practice. No use, distribution or reproduction is permitted which does not comply with these terms.
*Correspondence: Jian Li, NTIxMDExNEBudHUuZWR1LmNu; Ziheng Wang, d2FuZy56aWhlbmdAY29ubmVjdC51bS5lZHUubW8=
†These authors share first authorship