
95% of researchers rate our articles as excellent or good
Learn more about the work of our research integrity team to safeguard the quality of each article we publish.
Find out more
ORIGINAL RESEARCH article
Front. Immunol. , 21 November 2022
Sec. T Cell Biology
Volume 13 - 2022 | https://doi.org/10.3389/fimmu.2022.1043827
This article is part of the Research Topic T Cell Immunopathology in Hepatic Diseases View all 5 articles
Background: Accumulating evidence shows that immunogenic cell death (ICD) enhances immunotherapy effectiveness. In this study, we aimed to develop a prognostic model combining ICD, immunity, and long non-coding RNA biomarkers for predicting hepatocellular carcinoma (HCC) outcomes.
Methods: Immune- and immunogenic cell death-related lncRNAs (IICDLs) were identified from The Cancer Genome Atlas and Ensembl databases. IICDLs were extracted based on the results of differential expression and univariate Cox analyses and used to generate molecular subtypes using ConsensusClusterPlus. We created a prognostic signature based on IICDLs and a nomogram based on risk scores. Clinical characteristics, immune landscapes, immune checkpoint blocking (ICB) responses, stemness, and chemotherapy responses were also analyzed for different molecular subtypes and risk groups.
Result: A total of 81 IICDLs were identified, 20 of which were significantly associated with overall survival (OS) in patients with HCC. Cluster analysis divided patients with HCC into two distinct molecular subtypes (C1 and C2), with patients in C1 having a shorter survival time than those in C2. Four IICDLs (TMEM220-AS1, LINC02362, LINC01554, and LINC02499) were selected to develop a prognostic model that was an independent prognostic factor of HCC outcomes. C1 and the high-risk group had worse OS (hazard ratio > 1.5, p < 0.01), higher T stage (p < 0.05), higher clinical stage (p < 0.05), higher pathological grade (p < 0.05), low immune cell infiltration (CD4+ T cells, B cells, macrophages, neutrophils, and myeloid dendritic cells), low immune checkpoint gene expression, poor response to ICB therapy, and high stemness. Different molecular subtypes and risk groups showed significantly different responses to several chemotherapy drugs, such as doxorubicin (p < 0.001), 5-fluorouracil (p < 0.001), gemcitabine (p < 0.001), and sorafenib (p < 0.01).
Conclusion: Our study identified molecular subtypes and a prognostic signature based on IICDLs that could help predict the clinical prognosis and treatment response in patients with HCC.
Liver cancer is the second most common cause of cancer-related deaths worldwide (1), with hepatocellular carcinoma (HCC) being the most common histological type (2). Despite advancements in HCC treatment, the 5-year survival rate of patients with HCC remains less than 30% owing to complex etiology and high degree of heterogeneity (3). A novel prognostic indicator is, thus, required to accurately predict prognosis and guide appropriate treatment for patients with HCC.
Long non-coding RNAs (lncRNA) are RNA transcripts that are longer than 200 nucleotides; however, they do not encode proteins (4). LncRNAs are appealing biomarkers for cancer diagnosis and prognosis because of various reasons. First, lncRNA expression varies greatly across disease stages, diseases, and tissues; thus, it can better represent disease features (5). Second, lncRNA can regulate gene transcription, post-transcriptional modification, and epigenetic expression (6, 7), which correlates more closely with tumor progression.
Numerous studies have examined the clinical relevance of lncRNA within tumors, including HCC (8). LncRNA has been recently revealed to regulate the expression of genes encoding anticancer immunity proteins (9). Tumor immune cell infiltration also depends on lncRNA (10). For example, NRON sequesters phosphorylated NFAT in the cytoplasm and maintains T cell resting states (11). Antisense lncRNA SATB2-AS1 regulates the expression of SATB2, inducing the expression of TH1 chemokines CXCL9 and CXCL10 and initiating the transport of effector T cells (12). Moreover, GAS5 plays a crucial role in the growth arrest of T cells and non-transformed lymphocytes (13), and FENDRR promotes inflammatory and antitumor immunity by controlling tumor cell immunogenicity and proliferation (14). In patients with cancer, LIMIT correlates with MHC-I, tumor-infiltrating T cells, and checkpoint blockade response (15).
Immunotherapy has received increasing research attention in recent years. Immune checkpoint inhibitors yielded promising results in several clinical trials for HCC (16–18). They work primarily to prevent the activation or effects of T cells (19). An immune checkpoint inhibitor, nivolumab (anti-PD-1), was the first FDA-approved treatment for HCC. It reduces the number of unresponsive T cells while increasing CD38-expressing activated T cell counts (20). In 20% of HCC patients, pembrolizumab has shown efficacy in rejuvenating exhausted T cells and restoring their antitumor functions by inhibiting the PD-1 pathway (21, 22). Similarly, ipilimumab targets CTLA4 receptors and blocks their interaction with CD80/86, thereby allowing T cells to release suppressive signaling and become cytotoxic (23). Increasing evidence shows that cancer antigens released by immunogenic cell death (ICD) can boost cytotoxic T cell responses, potentially improving immunotherapy (24–28).
ICD is a form of cell death that elicits an immune response against the antigens of dead or dying cells, mostly cancerous cells (29, 30). ICD may activate danger-signaling pathways mediated by surface calreticulin/heat-shock proteins, secreted ATP, or HMGB1 (31–33). Extensive preclinical studies have identified ICD as a significant predictor of solid antitumor immunity (34, 35). ICD for biomarker discovery offers considerable advantages because it allows simultaneous integration of several immune-related pathways, such as those of danger signaling and effector T cell infiltration/activity (36, 37). The induction of ICD may become a more effective approach in cancer immunotherapy since it allows the eradication of tumors that had previously escaped the immune system (38).
As a single or combined agents with chemotherapy that induces ICD, TLR7 agonists have been used as anticancer immunotherapeutic agents (39, 40). Chemotherapy-induced ICD can convert malignant cells into vaccines and increase T cell priming, thereby facilitating T cell-mediated destruction of residual cancer cells (41, 42). Moreover, conventional NIR-PIT induces ICD that drives naive T cells to differentiate into effectors by maturing dendritic cells (43, 44). Thus, ICD plays a crucial role in triggering anticancer immune responses, particularly T cell response. Further research into the interactions between ICD and immunity may provide new insights into tumor immunotherapy.
In this study, molecular subtypes and a lncRNA prognostic risk model combining ICD and immunity were constructed to predict the immune microenvironment, prognosis, and response to immunotherapy and chemotherapy in HCC. Our findings pave the development of treatment strategies that will benefit HCC patients.
The Cancer Genome Atlas (TCGA) (https://portal.gdc.cancer.gov/) database was used to download RNA sequencing (RNA-seq) data and clinical information. Additionally, we downloaded gene transfer format files from Ensembl (http://asia.ensembl.org) to identify the lncRNAs from mRNAs. The limma package (v3.40.2) (45) was used to identify differentially expressed lncRNAs between normal and tumor tissues with p < 0.05 and |log2 fold change (FC)| > 1. Next, we downloaded a list of immune-related genes (IRGs) from the ImmPort database (http://www.immport.org ), which were used in co-expression analysis to identify immune-related lncRNAs (irlncRNAs). Immunogenic cell death-related lncRNAs (icdrlncRNAs) were identified using co-expression analysis of 33 recognized ICD-related genes (ICDRGs) extracted from a large-scale meta-analysis (46). Immune-related and immunogenic cell death-related lncRNAs (IICDLs) were generated from the intersection of two DElncRNA datasets. Thereafter, Spearman’s correlation analysis was used to describe gene–gene correlation. Gene intersection analysis was performed using the ggplot2 package (v3.3.3).
A univariate Cox regression analysis was used to screen for prognosis-related IICDLs. A cluster analysis was performed using the package ConsensusClusterPlus (v1.54.0) to identify IICDLs related to molecular subtypes. Heat map clustering was performed using the pheatmap package (v1.0.12). Kaplan–Meier (KM) analysis was used to compare the prognosis of both clusters. Stack graphs were used to visualize the correlation between clusters and clinical parameters, and chi-square tests were used to analyze them. Visualization was performed using the ggplot2 package (v3.3.3).
The limma package was used to analyze the differential expression of mRNA between clusters 1 and 2. The threshold for differential mRNA expression was defined as p < 0.05 and |log2 FC| > 0.2. To analyze the biological functions of potential mRNAs, the ClusterProfiler package (v1.54.0) was used to perform Gene Ontology (GO) and Kyoto Encyclopedia of Genes and Genomes (KEGG) analyses. The ggplot2 package (v3.3.3) was used for visualization.
We used the prognostic IICDLs to construct a prognostic model using LASSO Cox regression analysis via the glmnet package (v4.1-2). Based on the regression coefficient (β) derived from the multivariate Cox regression analysis, the following formula was used to construct a prognostic signature: risk score = (βlncRNA1* expression level of lncRNA1) + (βlncRNA2* expression level of lncRNA2) + … + (βlncRNAn* expression level of lncRNAn). Each patient was assigned a risk score using this formula in TCGA-HCC cohorts. Patients were categorized based on the median risk score into low- and high-risk subgroups, and overall survival (OS) times were compared between the two groups using KM analysis. A time-related receiver operating characteristic (ROC) analysis was performed using the timeROC package (v0.3) to evaluate the prognostic ability of the risk model.
Both univariate and multivariate Cox regression analyses were performed to test whether the prognostic models are independent of conventional clinical characteristics. A nomogram was developed based on all independent prognostic factors to assess the 1-, 3-, and 5-year survival of patients with HCC (47). Calibration plots were constructed as part of an internal validation process to ensure the predictive accuracy of the nomogram. Nomogram performance was also evaluated using time-dependent ROC analysis. Decision curve analysis (DCA) was performed to determine the clinical net benefit (48).
Data on the somatic mutations in the HCC samples were obtained from TCGA GDC Data Portal in a mutation annotation format. The Maftools package (v2.6.05) was used to visualize and summarize the mutated genes using waterfall plots.
TIMER (https://cistrome.shinyapps.io/timer/) is a web-based resource for estimating the abundance of tumor-infiltrating immune cells (B cells, CD4 and CD8 T cells, neutrophils, macrophages, and dendritic cells) (49). TIMER deduces the abundance of TIICs by deconvolution, Monte Carlo simulations, orthogonal estimates TIMER deduces the abundance of tumor-infiltrating immune cells from gene expression profiles based on a deconvolution method validated by Monte Carlo simulations, orthogonal estimates from DNA methylation-based inferences, and pathological assessments. The abundance of immune cells in each tumor sample was analyzed using TIMER. Eight common immune checkpoint genes (ICGs; SIGLEC15, TIGIT, CD274, HAVCR2, PDCD1, CTLA4, LAG3, and PDCD1LG2) were compared across molecular subtypes and risk groups. Higher Tumor Immune Dysfunction and Exclusion (TIDE) scores were associated with a shorter survival and poorer immune checkpoint blocking (ICB) treatment response. Using the TIDE database, we calculated the TIDE scores for molecular subtypes and risk groups in TCGA. Microsatellite instability (MSI) may be a predictive biomarker of immunity to immune checkpoint inhibitors (50). Therefore, the MSI score was calculated for each sample in TCGA-HCC cohorts to compare the high- and low-risk patients.
The stemness of cancer cells has recently been recognized as a valuable predictive or prognostic factor (51–53). Thus, we used one-class logistic regression (OCLR) to compare stemness for clusters and risks in TCGA (54). Based on the half-maximal inhibitory concentration (IC50) of commonly used chemotherapeutics, including doxorubicin (55), 5-fluorouracil (56), gemcitabine (57), and sorafenib (58), we investigated the molecular subtypes and risk groups associated with them.
The Cancer Cell Line Encyclopedia (CCLE) (https://portals.broadinstitute.org/ccle) database was used to obtain the cell line IICDL expression matrix of tumors. IICDL expression in the HCC tissues and healthy liver tissues was analyzed in TCGA (https://portal.gdc.cancer.gov/), lnCAR (http://lncar.renlab.org/ ), and Gene Expression Profiling Interactive Analysis (GEPIA) (http://gepia.cancer-pku.cn/) databases.
The Student’s t-test was used to compare gene expression between tumor and adjacent non-tumor tissue, and the Mann-Whitney U test was used to evaluate proportional differences. K-M analysis was performed to compare the OS between the risk groups and the subtypes via the log-rank test. A multivariate and univariate Cox regression analysis was used for the independent prognosis analysis. Wilcox test was used to compare immune scores between two groups. Statistical analyses were conducted using the R (v4.0.3) software. A significance level of 0.05 was used for all tests. We did not adjust P values for multiple testing (59, 60).
Figure 1 shows the flow diagram of this study. TCGA database, which contains 50 standard samples and 371 tumor samples, was used to obtain the HCC RNA-seq data. Based on the Ensembl gene annotation file, 16,013 lncRNA RNA-seq were obtained, and 147 differentially expressed lncRNAs (DElncRNAs) were initially identified, 25 of which were upregulated and 122 downregulated (Figure 2A). There were 143 differentially expressed irlncRNAs (DEirlncRNAs), 24 of which were upregulated and 119 downregulated (Figure 2B). Moreover, of the 81 differentially expressed icdrlncRNAs (DEicdrlncRNAs), 16 were upregulated and 65 were downregulated (Figure 2C). The intersection of these two DElncRNA datasets was defined as IICDLs, comprising 81 lncRNAs (Figure 2D).
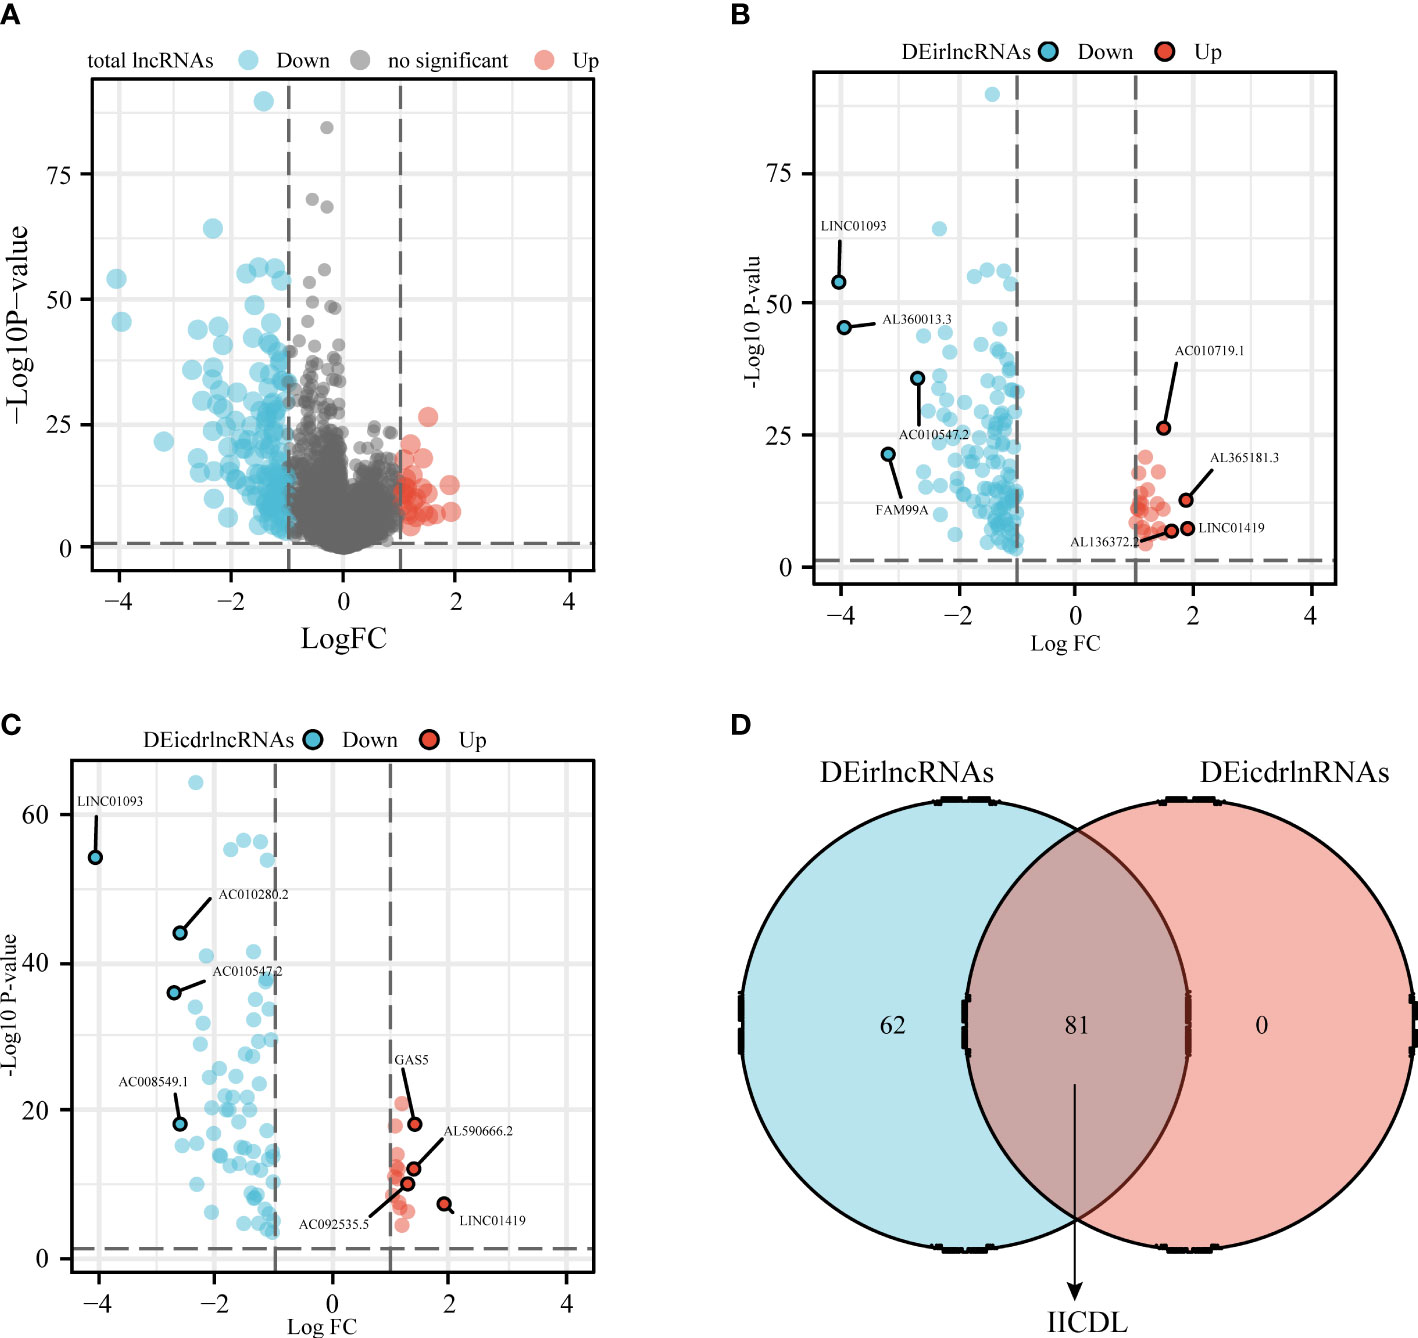
Figure 2 Identification of differentially expressed IICDLs in TCGA (A) Identification of differentially expressed lncRNAs in TCGA-HCC cohort. Volcano diagram showing DEirlncRNAs (B) and DEicdrlncRNAs (C). (D) Intersection of the two sets of differentially expressed lncRNAs. DEirlncRNAs: differentially expressed immune-related lncRNAs; DEicdrlncRNAs, differentially expressed immunogenic cell death-related lncRNAs; IICDLs, immune-related and immunogenic cell death-related lncRNAs; TCGA, The Cancer Genome Atlas.
The univariate Cox analysis revealed 20 IICDLs associated with prognosis, with AL606489.1 and AC0794666.1 acting as protective factors and the remaining 18 acting as risk factors (Figure 3A). According to correlation analysis, most genes were related to one another (Figure 3B). Cluster analysis was performed on the 20 prognosis-related IICDLs. Patients with HCC clustered into two subgroups showed the best cluster effect, with good subgroup internal consistency and stability (Figures 3C–F). Heatmaps showed that the two clusters significantly differed in gene expression of IICDLs (Figure 3G). Cluster 2 had a better prognosis than Cluster 1 according to the survival analysis (Figure 3H). In Cluster 2, prognosis was significantly associated with male sex (p < 0.05), better T stage (p < 0.05), early clinical stage (p < 0.01), and early pathological grade (p < 0.05) (Figures 4A–F).
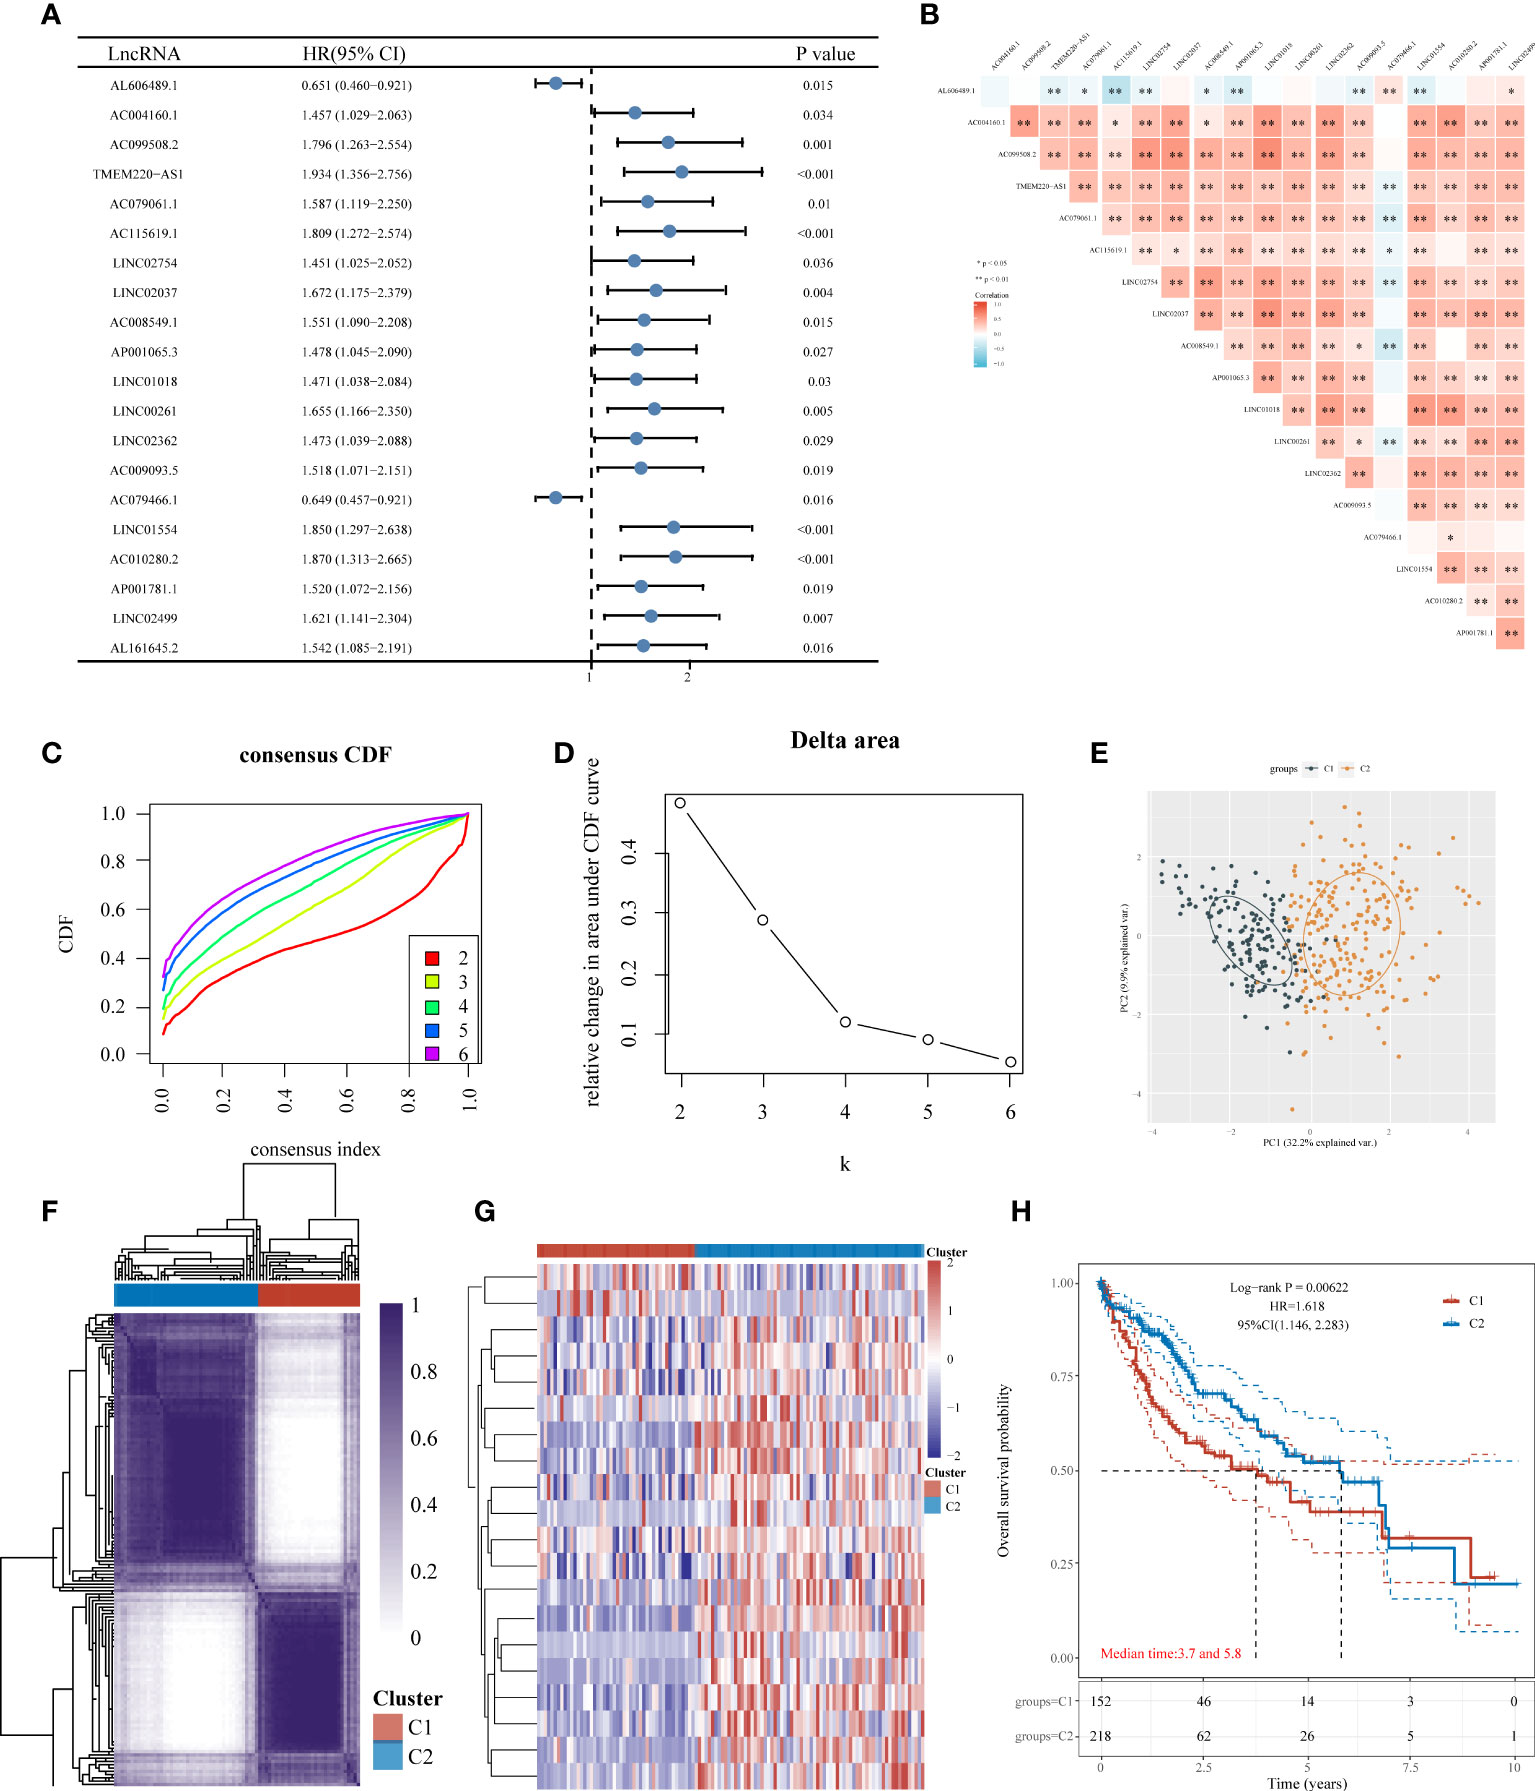
Figure 3 Consensus clustering of HCC molecular subgroups based on IICDLs. (A) Forest plot of 20 prognostic IICDLs using univariate Cox analysis. (B) Correlations between the 20 genes. CDF curve (C), delta area curve (D), PCA plot (E), and heat map (F) of consensus clustering. (G) Heat map of IICDL expression in different subtypes. (H) KM survival curve of various subgroups in TCGA data sets. CDF, cumulative distribution function; PCA, principal component analysis; KM, Kaplan–Meier. (*P < 0.05; **P < 0.01).
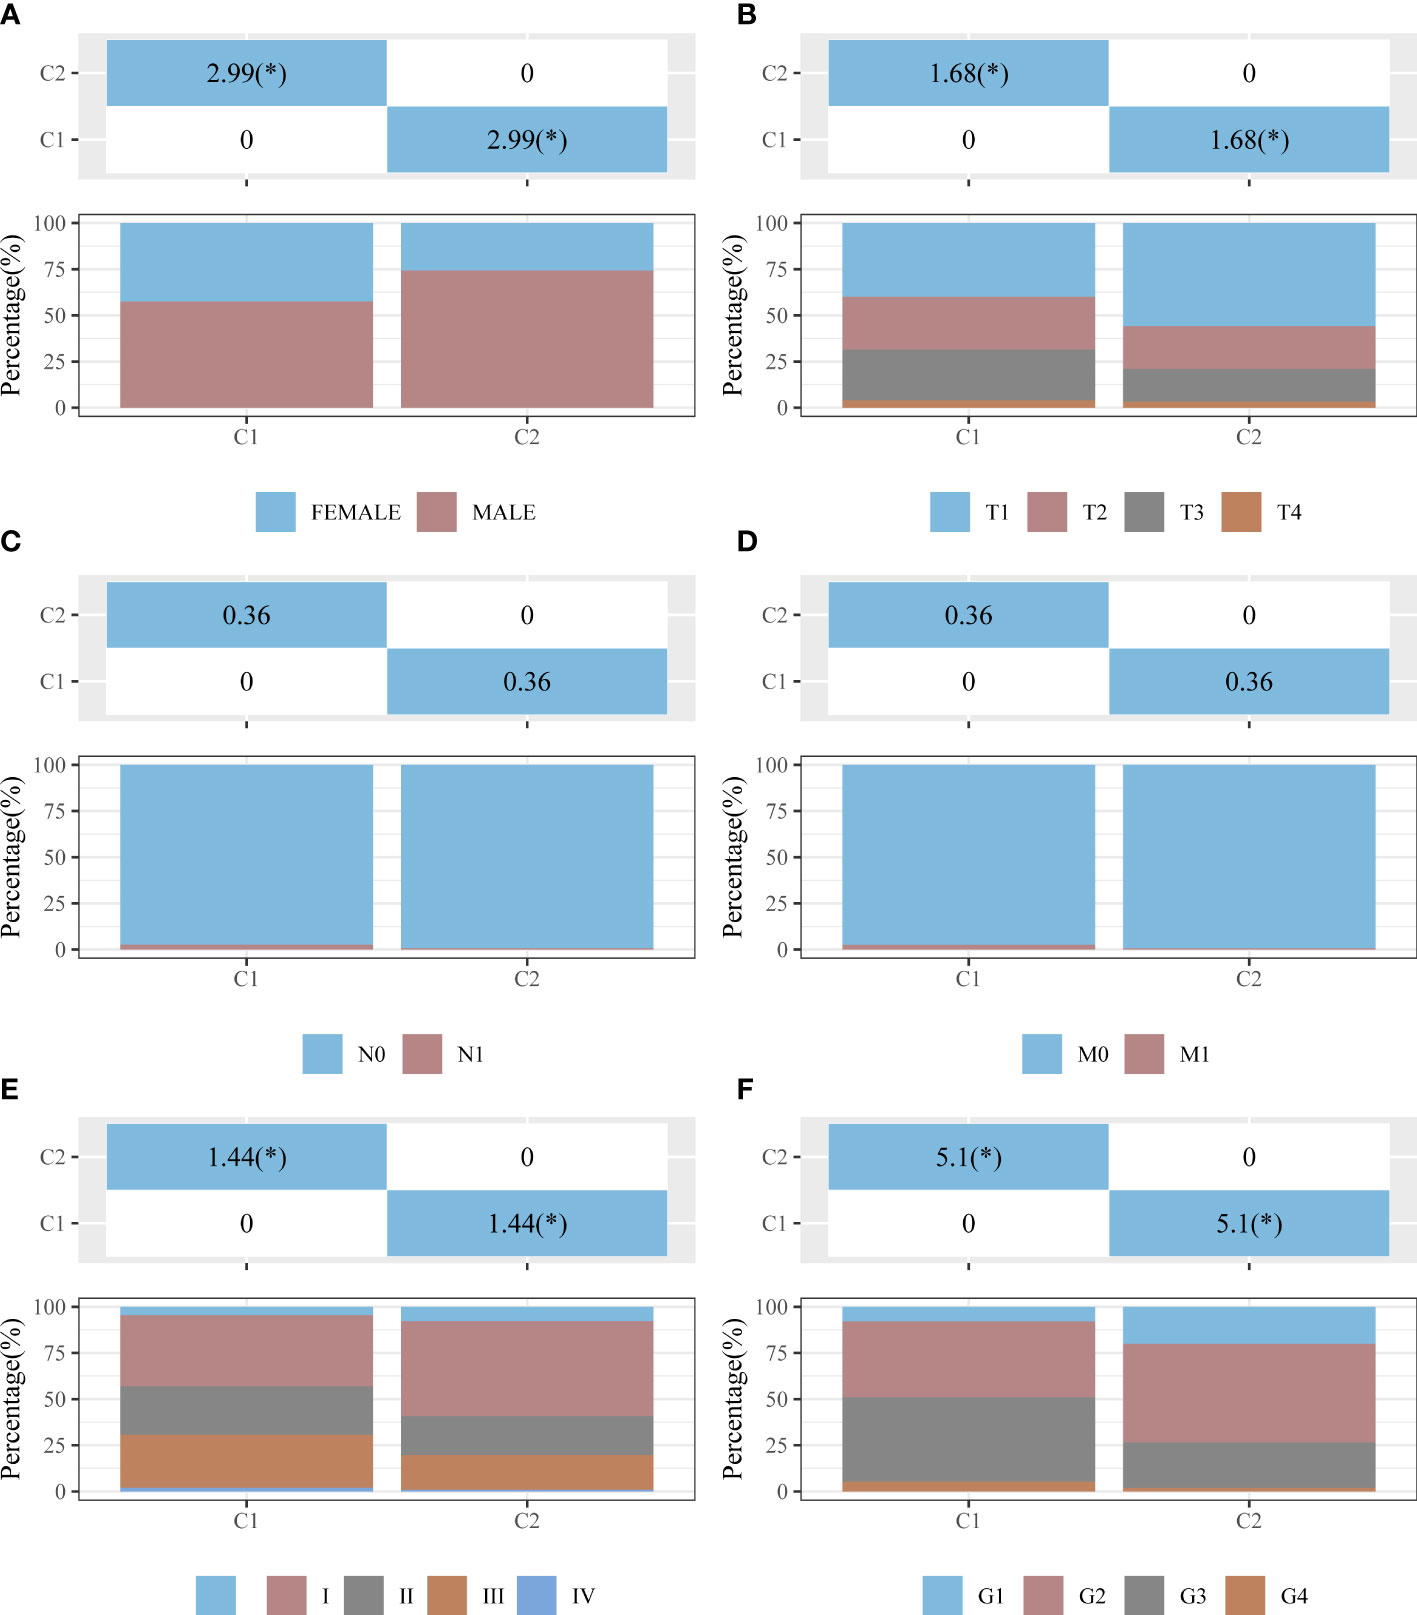
Figure 4 Distribution of clinical characteristics between clusters C1 and C2. Distributions in terms of sex (A), T stage (B), N stage (C), M stage (D), clinical stage (E), and pathological grade (F) of clusters C1 and C2. The horizontal axis represents a group of samples, whereas the vertical axis represents the percentage of clinical information contained in the corresponding grouped samples. In the table, the p-value (−log10) of clinical feature significance is shown (based on chi-square test). *p < 0.05.
We also analyzed differentially expressed genes in C1 and C2. Compared to C2, C1 had 1757 downregulated genes and 7901 upregulated genes (Figures 5A, B). Among 1794 IRGs, C1 had 569 upregulated genes (e.g., S100P), 713 downregulated genes (e.g., AQP9), and 512 unregulated genes (e.g., SLP1) in comparison to C2 (Figure 5C). Among 33 ICDRGs, C1 had 20 upregulated genes (e.g., BAX), one downregulated gene (FOXP3), and 12 unregulated genes (e.g., PIK3CA) in comparison to C2 (Figure 5D).
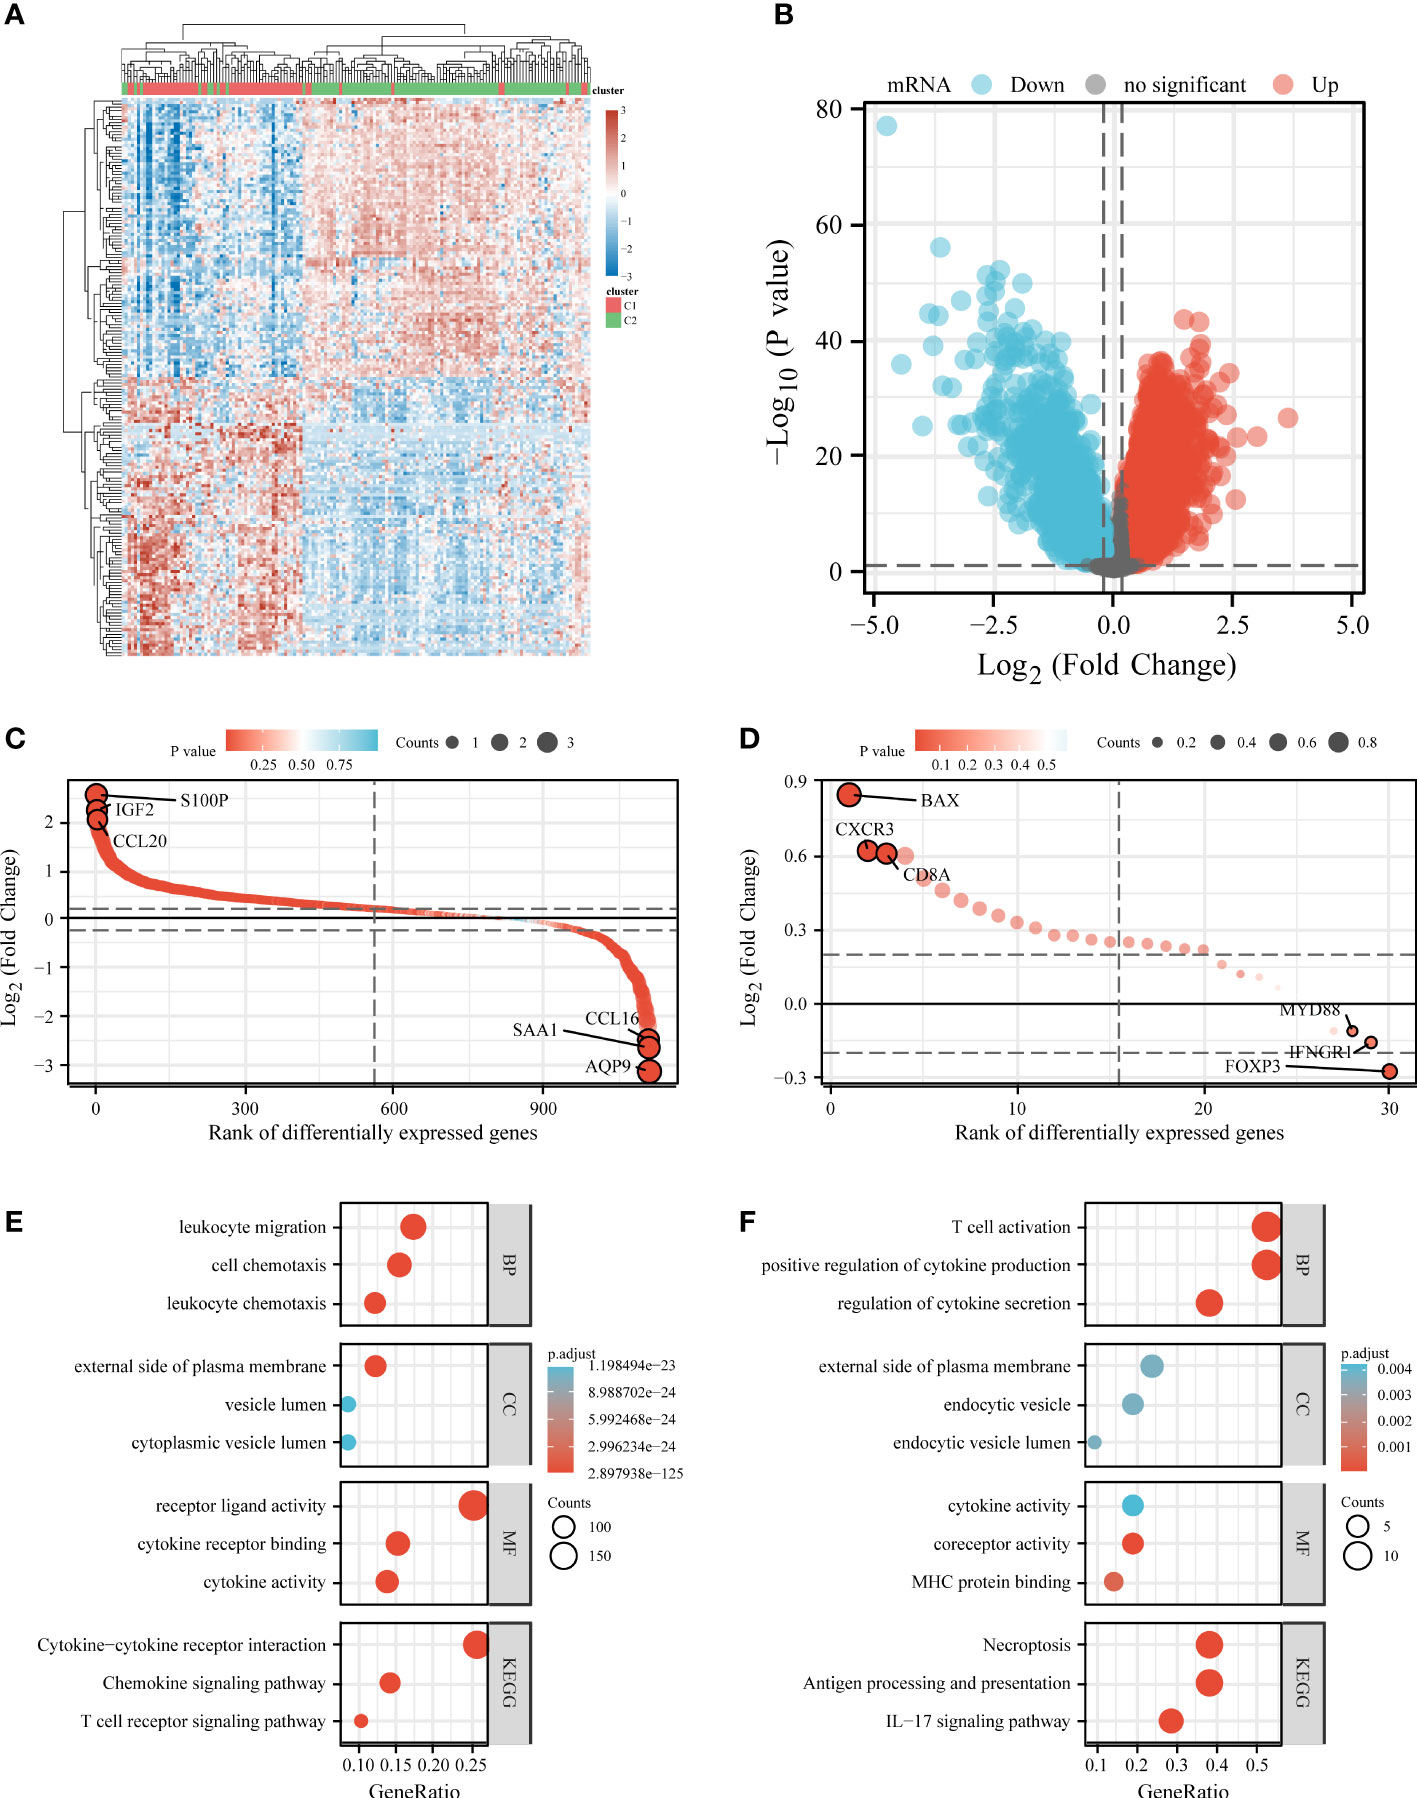
Figure 5 Differential expression and enrichment analysis of C1 and C2. Heat map (A) and volcano plot (B) showing differential gene expression between C1 and C2. Rank order plot showing differential expression of IRGs (C) and ICDRGs (D) in C1 and C2. KEGG and GO analysis of differentially expressed IRGs (E) and ICDRGs (F). IRGs, immune-related genes; ICDRGs, immunogenic cell death-related genes.
KEGG and GO analyses were performed based on differentially expressed IRGs and ICDRGs. KEGG analysis revealed that the differentially expressed ICDRGs were mainly involved in the IL-17 signaling pathway, necroptosis, and antigen processing and presentation (Figure 5E), whereas the differentially expressed IRGs were involved primarily in the cytokine–cytokine receptor interaction, chemokine signaling pathway, and T cell receptor signaling pathway (Figure 5F). GO analysis suggested that the differentially expressed ICDRGs were mainly involved in T cell activation, endocytic vesicle, and MHC protein binding (Figure 5E), whereas the differentially expressed IRGs were primarily involved in leukocyte migration, the external side of the plasma membrane, and cytokine receptor binding (Figure 5F).
We used the TIMER algorithm, the only method that considers tissue specificity when estimating immune cell populations (61), to determine whether there was a difference in immune infiltration between the two clusters. We found significant differences in the CD4+ T cells (p < 0.001), neutrophils (p < 0.001), macrophages (p < 0.001), B cells (p < 0.001), and myeloid dendritic cells (p < 0.001), suggesting that C2 exhibited stronger immunosuppression than C1 (Figure 6A). The presence of stromal and immune cells in tumor tissues is indicated by stromal and immune scores; the interaction of cancer cells and tumor stroma affects cancer development, facilitates metastasis, and evades immune surveillance. Therefore, we further investigated the immune and stroma score differences between C1 and C2, revealing that C1 had a higher immune score and a lower stroma score than C2 (Figures 6B, C). Additionally, we used the ggplot2 package (v3.3.3) to analyze the ICGs in C2 and C1 and found that CTLA4, HAVCR2, LAG3, PDCD1, and TIGIT were downregulated (Figure 6D, p < 0.001). TIDE scores for C1 were significantly higher than those for C2 (p < 0.0001), indicating that C2 might achieve greater clinical benefit with ICBs (Figure 6E).
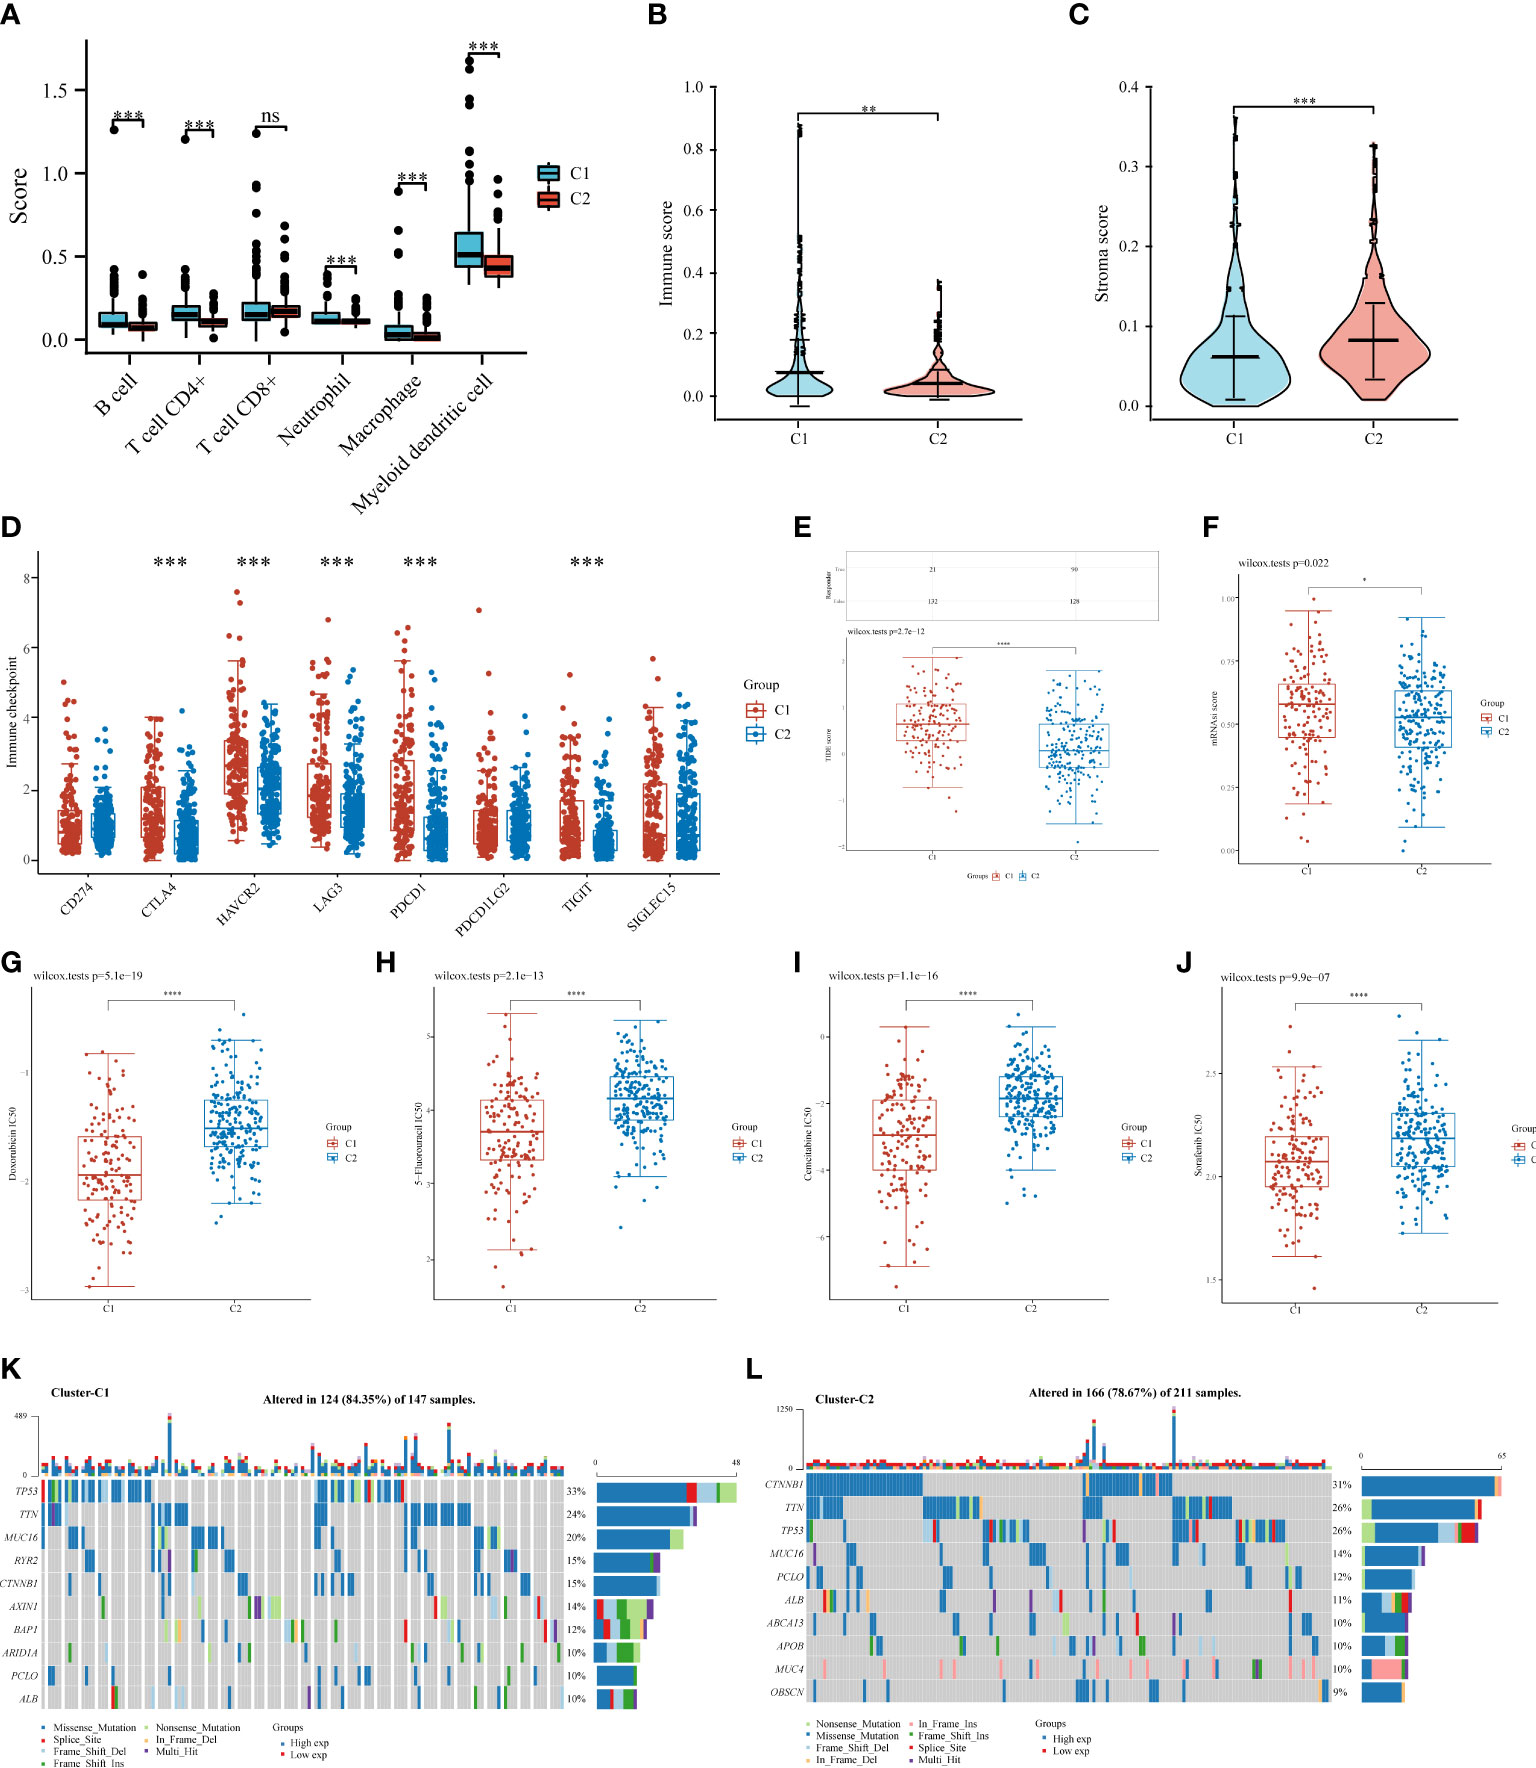
Figure 6 Comparisons of immune status, stemness, ICB response, and chemotherapy response between C1 and C2. Box plots present differential immune infiltration (A), immune score (B), stroma score (C), immune checkpoint gene expression (D), TIDE score (E), mRNAsi score (F), doxorubicin IC50 (G), 5-fluorouracil IC50 (H), gemcitabine IC50 (I), and sorafenib IC50 (J). Oncoprint visualization of the top 10 most commonly mutated genes in C1 (K) and C2 (L). mRNAsi, mRNA expression-based stemness index. (*P < 0.05; **P < 0.01; ***P < 0.001; ****P < 0.0001; ns, not significant).
Stemness, a molecular marker associated with stem cells, has emerged as a valuable predictor or prognostic factor (51–53). A higher stemness in C1 was noted (Figure 6F), suggesting a poorer prognosis for patients in C1. Notably, tumor stemness considerably contributes to cancer chemotherapy resistance (62). Therefore, we assessed whether C1 and C2 responded differently in recommending chemotherapeutic drugs for the treatment of HCC, such as doxorubicin (55), 5-fluorouracil (56), gemcitabine (57), and sorafenib (58). C1 was associated with lower IC50 levels for doxorubicin (p < 0.0001), 5-fluorouracil (p < 0.0001), gemcitabine (p < 0.0001), and sorafenib (p < 0.0001) (Figures 6G–J), suggesting that chemotherapy may have more beneficial on C1 than on C2. Additionally, we analyzed somatic mutations in C1 and C2 and found that C1 had a high frequency of TP53 (33%), TTN (24%), and MUC6 (20%) (Figure 6K), whereas C2 had a high frequency of CTNNB1 (31%), TTN (26%), and TP53 (26%) (Figure 6L).
We then built a prognostic model based on 20 prognosis-related IICDLs. Four IICDLs were tested and chosen for the prediction model based on the results of the LASSO regression analysis (Figures 7A, B). Risk score models were calculated based on the following algorithm: risk score = (−0.2854) * TMEM220-AS1 + (−0.0614) * LINC02362 + (−0.0418) * LINC01554 + (−0.0114) * LINC02499. Patients with HCC were divided into two groups based on their risk scores. Figure 7C shows the distribution of risk scores, survival status, and gene expression for these four genes. The KM curves showed that the OS for high-risk patients was significantly worse than that for low-risk patients (p < 0.0001, HR = 2.215) (Figure 7D).
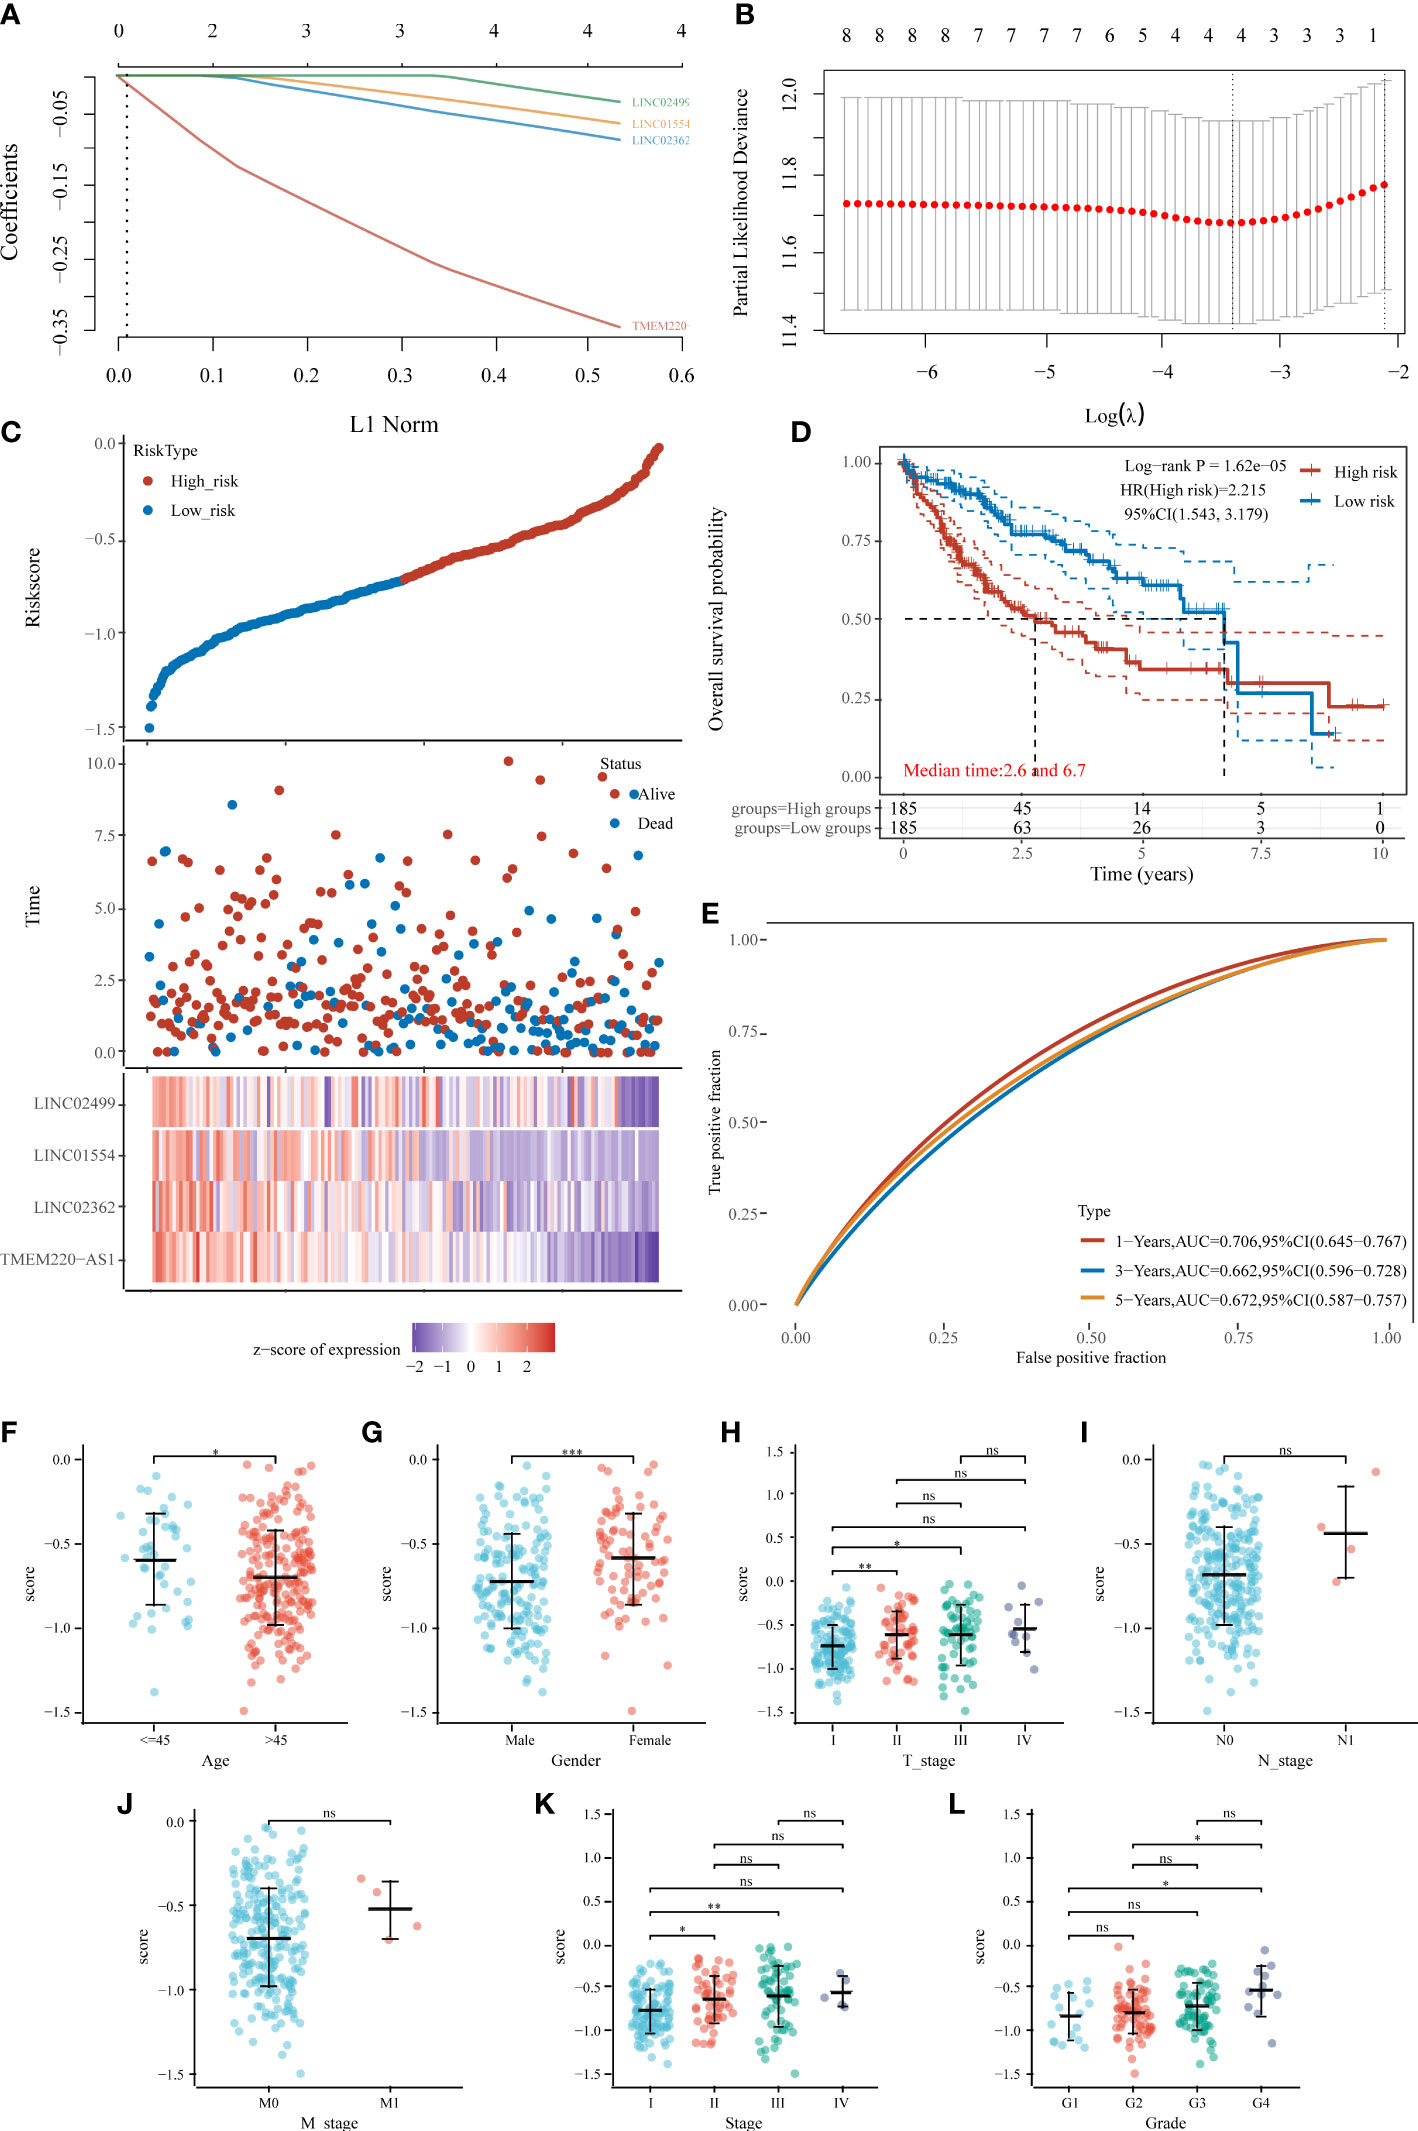
Figure 7 Prognostic model of HCC based on 20 IICDLs. (A) LASSO coefficient profiles of the four IICDLs. (B) A plot of the error rates from ten-fold cross-validation. (C) An overview of the risk score distribution, survival status of each patient, and a heat map of four IICDLs. (D) KM survival curve illustrating the predictive value of the risk model. (E) ROC curve of the predictive value of the risk model. Correlations between risk score and age (F), sex (G), T stage (H), N stage (I), M stage (J), clinical stage (K), and grade (L). (*P < 0.05; **P < 0.01; ***P < 0.001; ns, not significant).
The area under curves (AUCs) of time-dependent ROC curves for 1-, 3-, and 5-year OS were 0.706, 0.662, and 0.672, respectively (Figure 7E), indicating a good predictive performance. The AUCs of the IICDL-based prognostic model were 0.75, 0.77, and 0.77 for the 1-, 3-and 5-year survival times, respectively.
Furthermore, we identified the differences in risk scores between subgroups based on different clinical pathological factors. The risk score was significantly associated with age (p < 0.05), sex (p < 0.001), T stage (p < 0.05), clinical stage (p < 0.05), and pathological grade (p < 0.05) (Figures 7F–L).
We performed univariate and multivariate Cox regression analyses to determine whether other traditional clinical characteristics affected the prognostic model. The TNM stage (p < 0.001, HR = 2.535) and risk score (p < 0.001, HR = 4.6) were independent prognostic factors for OS (Figures 8A, B). A predictive nomogram was built to assist in the accurate prediction of clinical outcomes (Figure 8C). The predicted OS outcomes matched the actual observations more closely, according to the calibration plot for the internal validation of the nomogram (Figure 8D). Additionally, the predictive accuracy of the nomogram and individual prognostic factors were compared using time-dependent ROC curves. The AUCs of the nomogram at 1-, 3-, and 5-year OS were 0.674, 0.716, and 0.721, respectively, which were better than those of the models with only one independent factor (Figures 8E–G). DCA was used to determine the clinical relevance of these models, with the combined model predicting outcomes with the highest accuracy (Figures 8H–J).
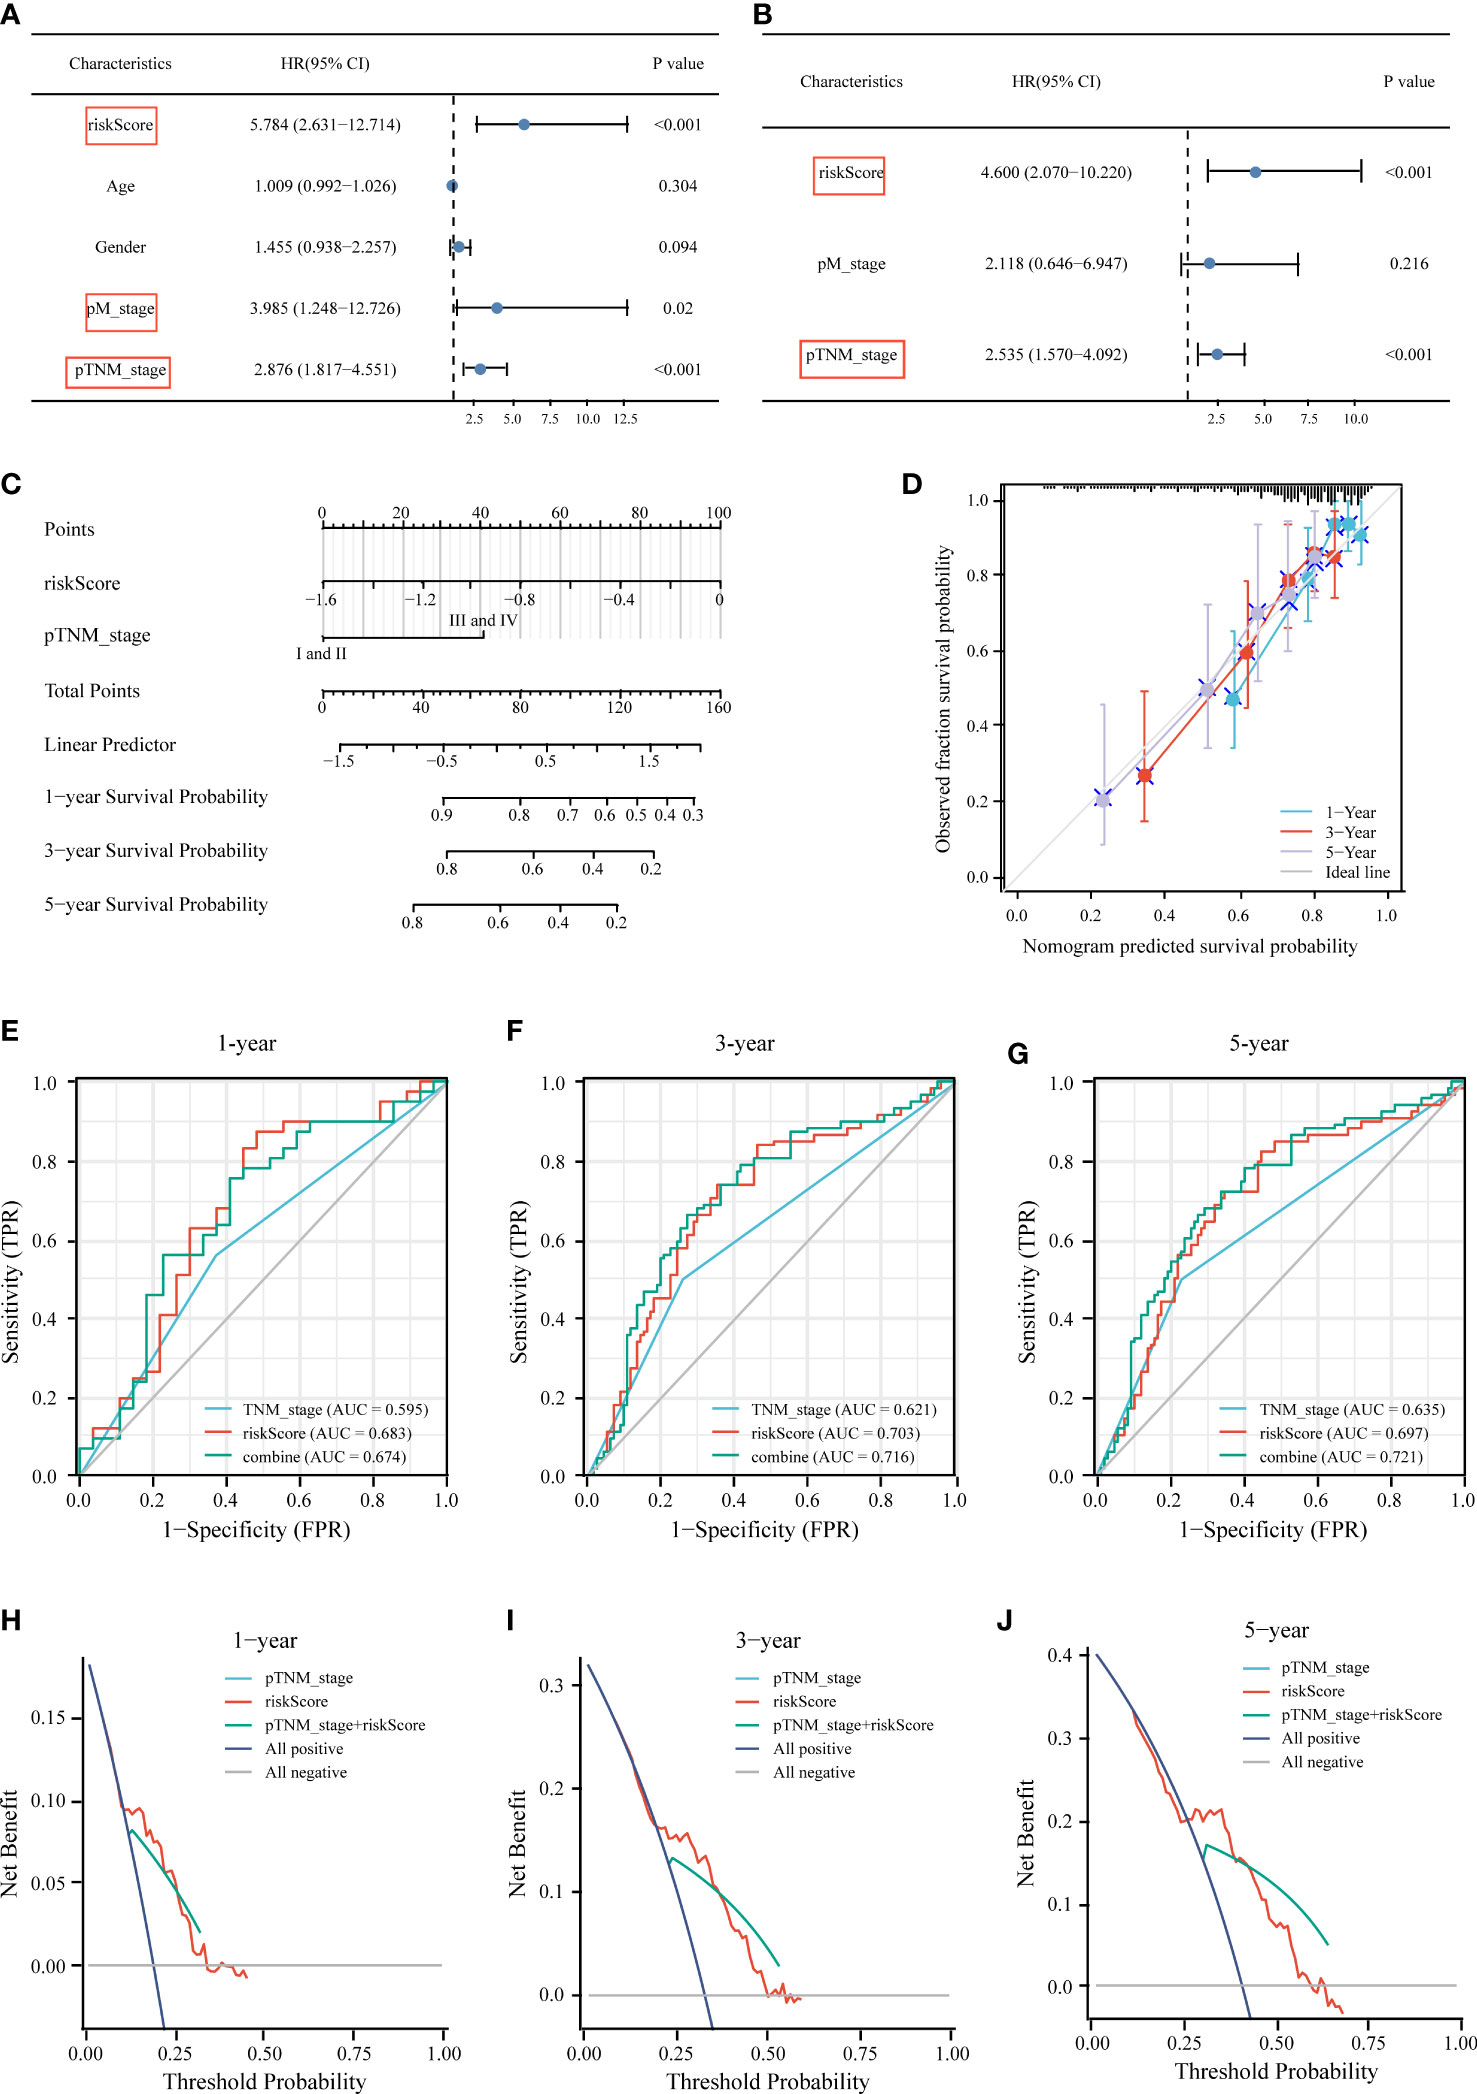
Figure 8 Construction of the nomogram for predicting OS of HCC patients in TCGA cohort. Univariate (A) and multivariate (B) forest plots of the risk score model and clinicopathological characteristics associated with overall survival. (C) The nomogram was constructed based on two independent prognostic factors. (D) Calibration plot for internal validation of the nomogram. Time‐dependent ROC (E–G) and DCA curves (H–J) of the TNM stage model, risk score model, and the combined model for 1‐, 3‐ and 5‐year OS prediction.
Previous research has linked different clusters to immune status, ICB response, stemness, and chemotherapy response. Accordingly, we aimed to determine whether there were any significant differences between the high-risk and low-risk groups. The TIMER algorithm was applied to investigate the relationship between the tumor immune microenvironment and the signature. The high-risk group had more extensive infiltration of immune cells, including B cells (p < 0.0001), CD4+ T cells (p < 0.0001), neutrophils (p < 0.0001), macrophages (p < 0.0001), and myeloid dendritic cells (p < 0.0001), than that in the low-risk group (Figure 9A). We also compared the immune, stroma, and MSI scores between the risk groups and found that high-risk patients had lower immune and stroma scores (Figures 9B–D) and expressed high levels of five immune checkpoint inhibitors (CTLA4, HAVCR2, LAG3, PDCD1, and TIGIT) (Figure 9E). A higher TIDE score was obtained in the high-risk group (Figure 9F). The OCLR algorithm indicated a higher stemness in the high-risk group (Figure 9G).
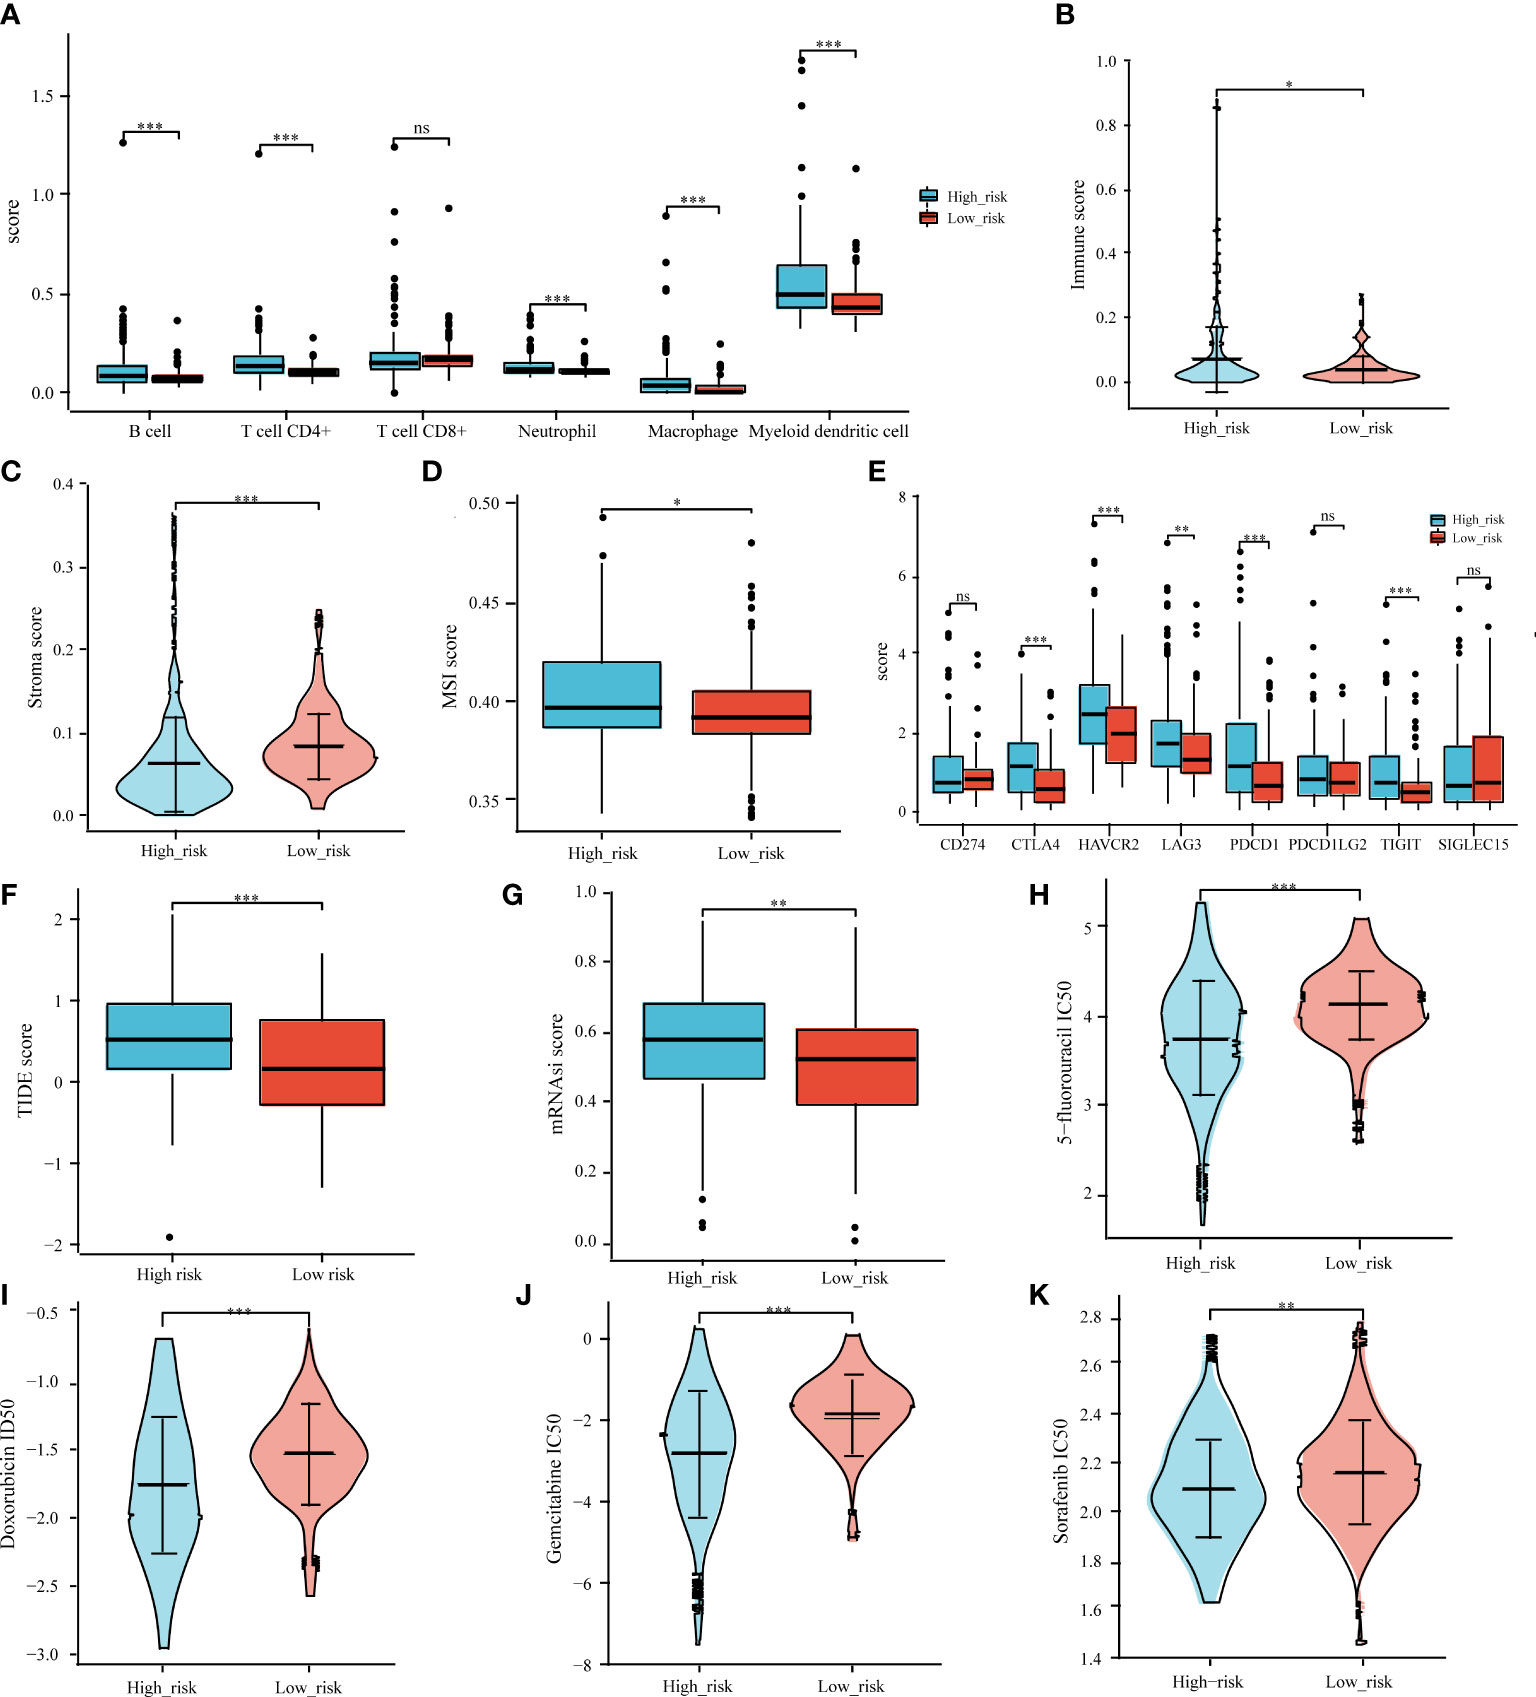
Figure 9 Correlation analysis of prognostic signature and tumor immune cell infiltration, immune checkpoint inhibitors, ICB response, MSI, tumor stemness, and common chemotherapeutic agents. Associations between the IICDL signature and tumor immune cell infiltration (A), immune score (B), stroma score (C), MSI score (D), immune checkpoint inhibitors (E), TIDE score (F), mRNAsi score (G), and IC50 of chemotherapeutic drugs (H–K). (*P < 0.05; **P < 0.01; ***P < 0.001; ns, not significant).
We also investigated whether the high-risk and low-risk groups responded differently to doxorubicin, 5-fluorouracil, gemcitabine, and sorafenib. The high-risk group had lower IC50 levels for doxorubicin (p < 0.001), 5-fluorouracil (p < 0.001), gemcitabine (p < 0.001), and sorafenib (p < 0.01) (Figures 9H–K), indicating that chemotherapy may have a greater impact on high-risk patients.
To verify IICDL expression, we collected data from HCC patients and cell lines. TCGA data revealed a significant decrease in the expression levels of TMEM220-AS1, LINC02362, LINC01554, and LINC02499 in HCC samples. (Figure 10A). According to the GEPIA database analysis, LINC01554 and TMEM220-AS1 were downregulated in HCC (Figure 10B). CCLE data indicated that LINC02499, TMEM220-AS1, and LINC01554 were expressed at low levels in most HCC cell lines (Figure 10C). The lnCAR database further confirmed these results. TMEM220-AS1, LINC02362, LINC01554, and LINC02499 were significantly downregulated in HCC tissues compared to that in the healthy liver tissues (p < 0.0001) (Figures 10D–G). Finally, the effect of single genes on HCC prognosis was analyzed using multivariate Cox regression analysis. The results suggest that LINC01554 and LINC02499 could be used as independent risk factors for determining HCC patient prognosis (Figure 10H).
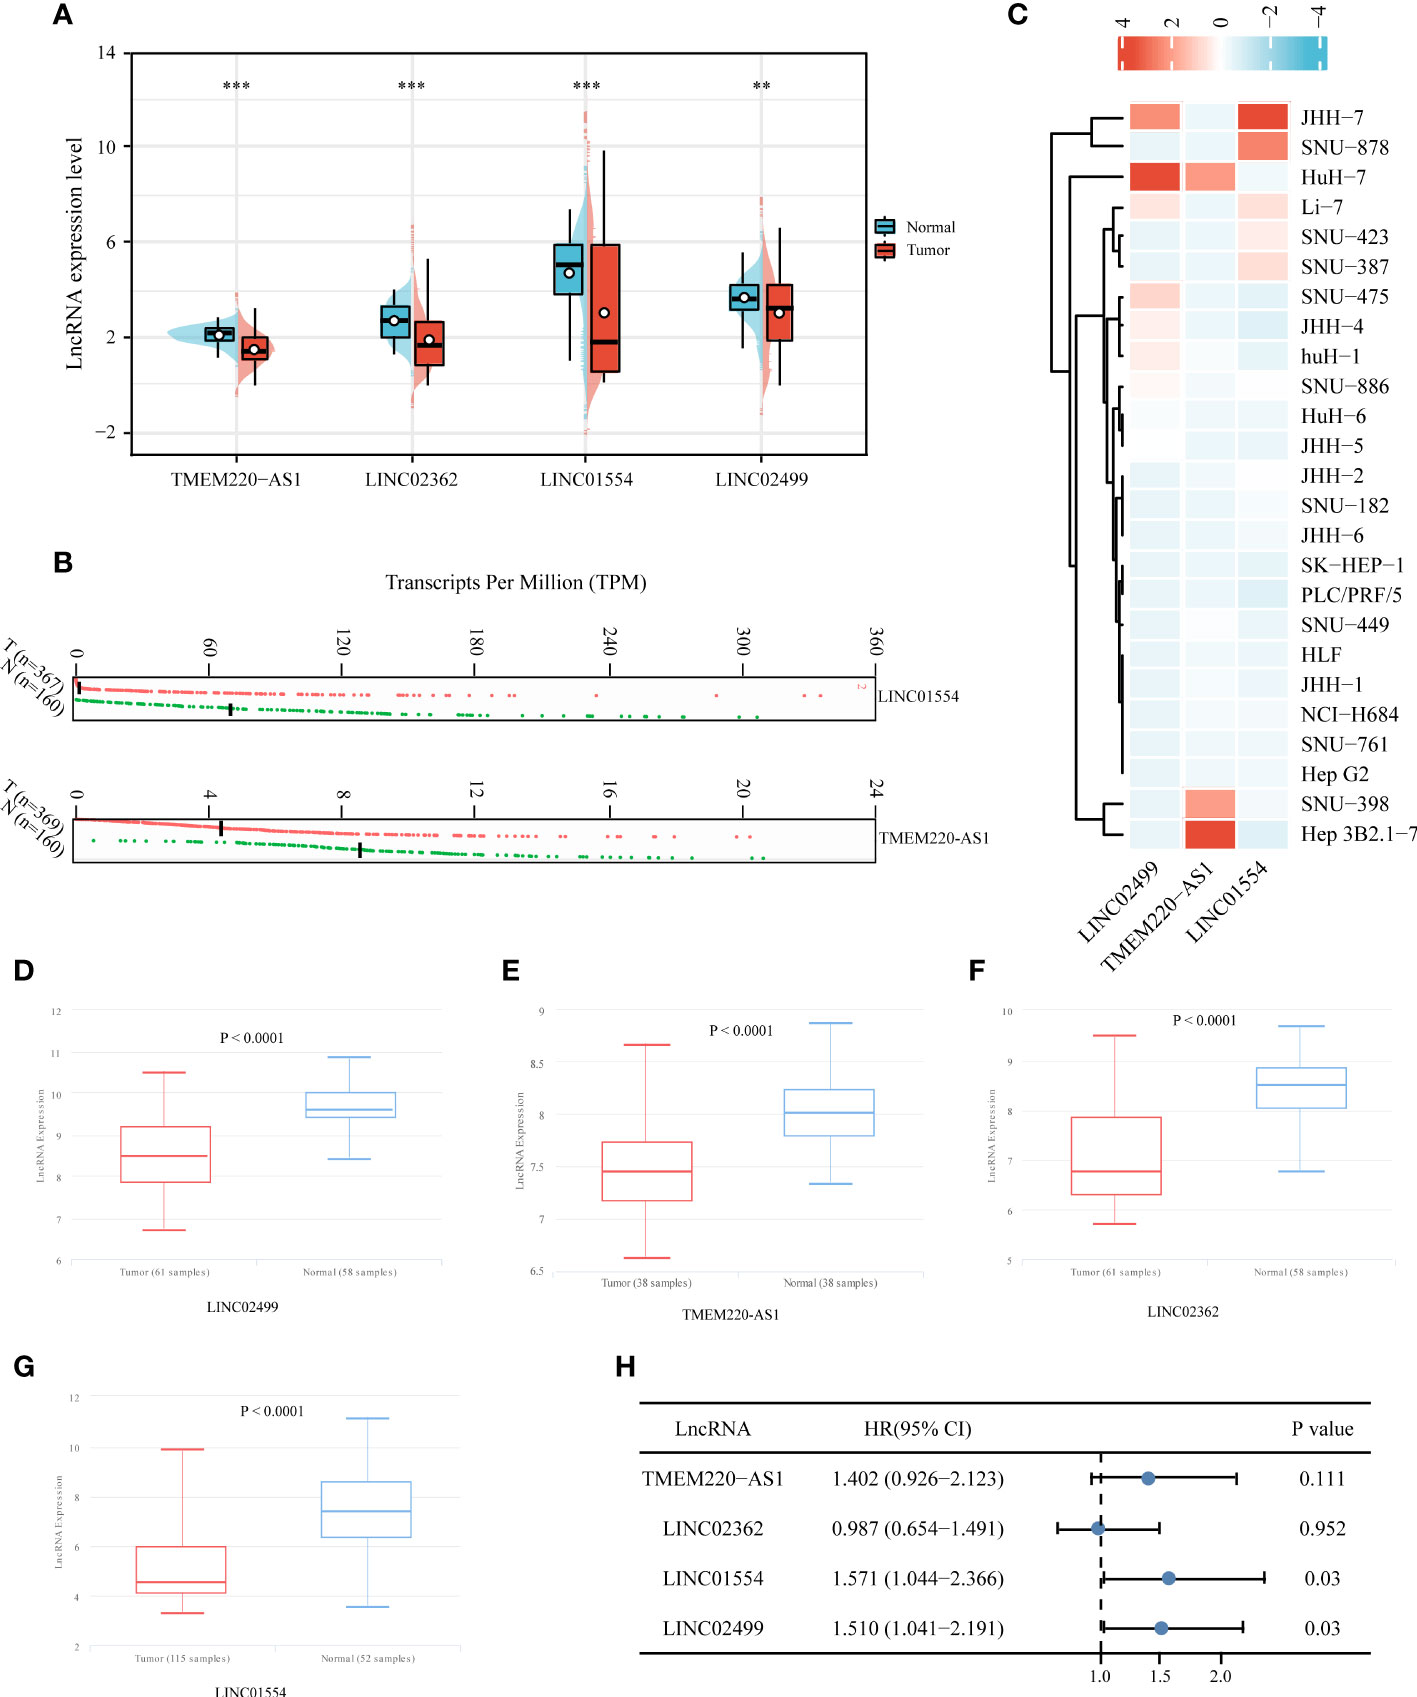
Figure 10 Expression validation and independent prognostic analysis of four IICDLs. IICDL expression in HCC tumor tissues and healthy tissues according to TCGA (A) and GEPIA (B) databases. (C) IICDL expression in HCC cell lines according to the CCLE database. (D–G) IICDL expression in HCC tumor tissues and normal tissues according to the lnCAR database. (H) Multivariate Cox regression analysis of the four IICDLs for prognosis prediction of patients with HCC. (**P < 0.01; ***P < 0.001; ns, not significant).
This study revealed an IICDL-related signature comprising four lncRNAs that could predict clinical outcomes and treatment responses in patients with HCC. Our proposed model predicted the survival of patients with HCC accurately.
Various types of immunotherapies and new chemotherapy modalities rely on tumor immunogenicity for their success (63). Surprisingly, certain types of stress can cause specific cells to initiate a proinflammatory process, increasing T cell activation, a process known as ICD. ICD has been identified to trigger adaptive immune responses by releasing danger-associated molecular patterns, which play an immunogenic role when they reach the tumor microenvironment (TME) (64). Hence, we speculated that patients with HCC may benefit from ICD occurring in the TME and that an ICD/immune lncRNA model would be an accurate predictor of patient prognosis and medication response.
As a first step, DEirlncRNAs and DEidcrlncRNAs were identified from TCGA data. Intersections of the two lncRNA sets were referred to as IICDLs. Of the 81 IICDLs, 20 were significantly associated with prognosis of patients with HCC, namely, AL606489.1, AC004160.1, AC099508.2, TMEM220-AS1, AC079061.1, AC115619.1, LINC02754, LINC02037, AC008549.1, AP001065.3, LINC01018, LINC00261, LINC02362, AC009093.5, AC079466.1, LINC01554, AC010280.2, AP001781.1, LINC02499, and AL161645.2. Among them, AC079466.1 (65), LINC01554 (66), LINC00261 (67–69), LINC02499 (70–73), and AC008549.1 (74) were closely correlated with the prognosis of patients with HCC. In addition, patients with HCC had low levels of TMEM220-AS1, a protein that inhibits malignant behavior by increasing TMEM220 expression and inactivating Wnt/β-catenin (75). Another study found that TMEM220-AS1 promoted metastasis and proliferation in HCC through the microRNA(miR)-484/MAGI1 axis (76). Further, TMEM220-AS1 was found to be upregulated in gliomas and positively correlated with their progression (77). LINC01554 has been identified as a significant lncRNA involved in the pathogenesis of esophageal cancer and nonalcoholic fatty liver disease (78, 79). Additionally, LINC01554 inhibits the glycolytic action of cells in hepatocellular carcinoma, suppressing tumor growth (67). LINC01018 was poorly expressed in HCC; however, sponging miR-182-5p conferred a novel tumor suppressor role (80). LINC02362 suppressed HCC growth by modulating miR-516b-5p and SOSC2 (81). LINC02499 inhibits the proliferation, migration, and invasion of hepatocellular carcinoma cells (70). These results are consistent with those of ours.
Precision medicine is emerging as a powerful clinical strategy in oncology, with the goal of improving clinical outcomes and patient progression (82). Genotyping patients and targeting therapies are key components of precision medicine. Consequently, we divided patients with HCC into two clusters, C1 and C2, according to the 20 IICDLs. There were significant differences between HCC patients in C1 and C2 in terms of prognosis, clinical stage, histopathological grade, and ICG expression. Specifically, patients in C2 had a higher immune score, higher ICB response, and lower stemness score than those in C1. Furthermore, patients in C1 and C2 responded differently to doxorubicin, 5-fluorouracil, gemcitabine, and sorafenib. Notably, these findings are consistent with those of a previous study, reporting that HCC patients with high immune infiltration and ICB response had a longer OS (83).
Four IICDLs (TMEM220-AS1, LINC02362, LINC01554, LINC02499) were identified and used to develop prognostic models for HCC patients using LASSO Cox analysis. Patients with HCC were divided into high- and low-risk groups based on risk scores for OS. We found that the high-risk group of HCC patients had a worse prognosis than the low-risk group. The four-lncRNA signature had an independent effect on HCC prognosis, and the model had a better predictive performance. Previous studies have reported similar results. Hong et al. developed an immune-related lncRNA signature to predict the prognosis of HCC patients (84). Another prognostic signature based on immune- and ferroptosis-related lncRNAs could predict the prognosis and immune infiltration of HCC (78). In addition, cuproptosis-related lncRNA signatures predicted the patient outcomes and response to ICB therapy (79). Our study also examined the correlation between prognostic risk scores and HCC patient characteristics. The risk score increased along with the T stage, clinical stage, and pathological grade. Overall, the prognostic values of the IICDL signature in our study for patients with HCC were consistent with the results of previous studies.
We also compared the immune score, ICGs, TIDE score, mRNAsi score, and chemotherapy response between the high- and low-risk groups. The high-risk group had low immune cell infiltration, low ICG expression, poor response to ICB therapy, and high stemness. The high-risk and low-risk groups showed significantly different reactions to several chemotherapy drugs (doxorubicin, 5-fluorouracil, gemcitabine, and sorafenib). Interestingly, low macrophage (85) and NK cell (86) infiltration predicted a poor prognosis in patients with HCC. High levels of ICGs, such as CTLA4 (87) and LAG3 (88), had a negative impact on the prognosis of HCC patients. HCC patients with high stemness genes tend to have more aggressive tumor growth with poor prognoses (89). Taken together, these findings were consistent with ours.
According to the molecular subtypes and prognostic signatures constructed from prognostic IICDLs, personalized treatment should depend on molecular subtypes and risk groups. Using the TIDE algorithm, for instance, patients in the low-risk group and with the C2 molecular subtype might benefit more from immunotherapy. High-risk group and C1 were suggestive of a large number of immune cells (B cells, CD4+ T cells, neutrophils, macrophages, and myeloid dendritic cells) and a higher expression of ICGs (PD-L1, CTLA-4, TIGIT, HAVCR2, LAG3, PDCD1LG2, and SIGLEC15), indicating that the high-risk group and C1 exhibit resistance to immunotherapy. This probably explains the poor prognosis of patients with HCC in the high-risk group and with the C2 molecular subtype. In fact, overexpression of the PD-L1 surface molecule inhibited T cell responses by engaging PD-1 on the surrounding T lymphocytes, thereby promoting the progression and diffusion of cancer (90, 91). PD-L1 is also expressed by macrophages and interacts with PD-1 on cytotoxic T cells, contributing to the escape of tumor cells from the immune system (92, 93). The overexpression of CTLA-4/TIGIT on T lymphocytes and NK cells also plays an important role in immune escape (94, 95). A recent study found that SIGLEC15 glycosylation promoted tumor growth and immune escape (96). These findings suggest that the molecular subtypes and prognostic signatures we identified may be useful for the implementation of future immunotherapy strategies.
This study had some limitations. First, our signature was not verified in another database. LncRNAs obtained from TCGA may differ from those in other databases owing to differences in chip technology and recording method. Our search of the ICGC database did not yield any corresponding expression of the IICDLs. Second, although we validated IICDL expression in the GEPIA, CCLE, and lnCAR databases, in vitro experiments may provide more convincing results. Since fresh tissue samples are required for detecting lncRNA expression, it was impossible to collect sufficient survival time within a short period. Our follow-up research will focus on the analysis of bioinformatic and clinical data.
Overall, we identified molecular subtypes based on IICDLs in HCC and constructed a prognostic signature using IICDLs. Different molecular subtypes and risk groups were also analyzed for clinical characteristics, immune landscapes, ICB responses, stemness, and chemotherapy responses. In the future, the proposed signature may provide clinical evidence to support decisions regarding HCC patient treatment and prognosis.
The raw data supporting the conclusions of this article will be made available by the authors, without undue reservation.
ZL, WG, and JL conceived and designed the study. MH and YG collected the data, performed bioinformatics analysis, and wrote the initial draft of the manuscript. MH, WG, and YL analyzed the data and generated the figures. ZL conceptualized and revised the manuscript. All authors contributed to the article and approved the submitted version.
This work was supported by the Natural Science Fund of Shandong Province (No. ZR202010220061), and Medical Discipline Construction Project of Pudong Health Committee of Shanghai (No. PWYst2021-18).
All authors are to be commended for their collaboration.
The authors declare that the research was conducted in the absence of any commercial or financial relationships that could be construed as a potential conflict of interest.
All claims expressed in this article are solely those of the authors and do not necessarily represent those of their affiliated organizations, or those of the publisher, the editors and the reviewers. Any product that may be evaluated in this article, or claim that may be made by its manufacturer, is not guaranteed or endorsed by the publisher.
The Supplementary Material for this article can be found online at: https://www.frontiersin.org/articles/10.3389/fimmu.2022.1043827/full#supplementary-material
1. Ferlay J, Soerjomataram I, Dikshit R, Eser S, Mathers C, Rebelo M, et al. Cancer incidence and mortality worldwide: sources, methods and major patterns in GLOBOCAN 2012. Int J cancer. (2015) 136(5):E359–86. doi: 10.1002/ijc.29210
2. El-Serag HB. Epidemiology of viral hepatitis and hepatocellular carcinoma. Gastroenterology (2012) 142(6):1264–73.e1. doi: 10.1053/j.gastro.2011.12.061
3. Bruix J, Gores GJ, Mazzaferro V. Hepatocellular carcinoma: clinical frontiers and perspectives. Gut (2014) 63(5):844–55. doi: 10.1136/gutjnl-2013-306627
4. Butchart LC, Fox A, Shavlakadze T, Grounds MD. The long and short of non-coding RNAs during post-natal growth and differentiation of skeletal muscles: Focus on lncRNA and miRNAs. Differentiation; Res Biol diversity. (2016) 92(5):237–48. doi: 10.1016/j.diff.2016.05.003
5. Yan X, Hu Z, Feng Y, Hu X, Yuan J, Zhao SD, et al. Comprehensive genomic characterization of long non-coding RNAs across human cancers. Cancer Cell (2015) 28(4):529–40. doi: 10.1016/j.ccell.2015.09.006
6. Ulitsky I, Bartel DP. lincRNAs: genomics, evolution, and mechanisms. Cell (2013) 154(1):26–46. doi: 10.1016/j.cell.2013.06.020
7. Fatica A, Bozzoni I. Long non-coding RNAs: new players in cell differentiation and development. Nat Rev Genet (2014) 15(1):7–21. doi: 10.1038/nrg3606
8. Lanzafame M, Bianco G, Terracciano LM, Ng CKY, Piscuoglio S. The role of long non-coding RNAs in hepatocarcinogenesis. Int J Mol Sci (2018) 19(3):1–25. doi: 10.3390/ijms19030682
9. Denaro N, Merlano MC, Lo Nigro C. Long noncoding RNAs as regulators of cancer immunity. Mol Oncol (2019) 13(1):61–73. doi: 10.1002/1878-0261.12413
10. Chen YG, Satpathy AT, Chang HY. Gene regulation in the immune system by long noncoding RNAs. Nat Immunol (2017) 18(9):962–72. doi: 10.1038/ni.3771
11. Sharma S, Findlay GM, Bandukwala HS, Oberdoerffer S, Baust B, Li Z, et al. Dephosphorylation of the nuclear factor of activated T cells (NFAT) transcription factor is regulated by an RNA-protein scaffold complex. Proc Natl Acad Sci United States America. (2011) 108(28):11381–6. doi: 10.1073/pnas.1019711108
12. Xu M, Xu X, Pan B, Chen X, Lin K, Zeng K, et al. LncRNA SATB2-AS1 inhibits tumor metastasis and affects the tumor immune cell microenvironment in colorectal cancer by regulating SATB2. Mol cancer. (2019) 18(1):135. doi: 10.1186/s12943-019-1063-6
13. Mourtada-Maarabouni M, Hedge VL, Kirkham L, Farzaneh F, Williams GT. Growth arrest in human T-cells is controlled by the non-coding RNA growth-arrest-specific transcript 5 (GAS5). J Cell Sci (2008) 121(Pt 7):939–46. doi: 10.1242/jcs.024646
14. Munteanu MC, Sethuraman SN, Singh MP, Malayer J, Ranjan A. LncRNA FENDRR expression correlates with tumor immunogenicity. Genes (2021) 12(6):1–9. doi: 10.3390/genes12060897
15. Li G, Kryczek I, Nam J, Li X, Li S, Li J, et al. LIMIT is an immunogenic lncRNA in cancer immunity and immunotherapy. Nat Cell Biol (2021) 23(5):526–37. doi: 10.1038/s41556-021-00672-3
16. Duffy AG, Ulahannan SV, Makorova-Rusher O, Rahma O, Wedemeyer H, Pratt D, et al. Tremelimumab in combination with ablation in patients with advanced hepatocellular carcinoma. J hepatology. (2017) 66(3):545–51. doi: 10.1016/j.jhep.2016.10.029
17. Sangro B, Gomez-Martin C, de la Mata M, Iñarrairaegui M, Garralda E, Barrera P, et al. A clinical trial of CTLA-4 blockade with tremelimumab in patients with hepatocellular carcinoma and chronic hepatitis c. J hepatology. (2013) 59(1):81–8. doi: 10.1016/j.jhep.2013.02.022
18. El-Khoueiry AB, Sangro B, Yau T, Crocenzi TS, Kudo M, Hsu C, et al. Nivolumab in patients with advanced hepatocellular carcinoma (CheckMate 040): an open-label, non-comparative, phase 1/2 dose escalation and expansion trial. Lancet (London England). (2017) 389(10088):2492–502. doi: 10.1016/s0140-6736(17)31046-2
19. Focaccetti C, Izzi V, Benvenuto M, Fazi S, Ciuffa S, Giganti MG, et al. Polyphenols as immunomodulatory compounds in the tumor microenvironment: Friends or foes? Int J Mol Sci (2019) 20(7):1–35. doi: 10.3390/ijms20071714
20. Di Blasi D, Boldanova T, Mori L, Terracciano L, Heim MH, De Libero G. Unique T-cell populations define immune-inflamed hepatocellular carcinoma. Cell Mol Gastroenterol Hepatol (2020) 9(2):195–218. doi: 10.1016/j.jcmgh.2019.08.004
21. Kunimasa K, Isei T, Nakamura H, Kimura M, Inoue T, Tamiya M, et al. Proliferative CD8(+) PD-1(+) T-cell infiltration in a pembrolizumab-induced cutaneous adverse reaction. Investigational New Drugs (2018) 36(6):1138–42. doi: 10.1007/s10637-018-0628-3
22. Waidmann O. Recent developments with immunotherapy for hepatocellular carcinoma. Expert Opin Biol Ther (2018) 18(8):905–10. doi: 10.1080/14712598.2018.1499722
23. Hodi FS, O'Day SJ, McDermott DF, Weber RW, Sosman JA, Haanen JB, et al. Improved survival with ipilimumab in patients with metastatic melanoma. New Engl J Med (2010) 363(8):711–23. doi: 10.1056/NEJMoa1003466
24. Zitvogel L, Apetoh L, Ghiringhelli F, Kroemer G. Immunological aspects of cancer chemotherapy. Nat Rev Immunol (2008) 8(1):59–73. doi: 10.1038/nri2216
25. Kamrava M, Bernstein MB, Camphausen K, Hodge JW. Combining radiation, immunotherapy, and antiangiogenesis agents in the management of cancer: the three musketeers or just another quixotic combination? Mol Biosyst (2009) 5(11):1262–70. doi: 10.1039/b911313b
26. Armand P, Nagler A, Weller EA, Devine SM, Avigan DE, Chen YB, et al. Disabling immune tolerance by programmed death-1 blockade with pidilizumab after autologous hematopoietic stem-cell transplantation for diffuse large b-cell lymphoma: results of an international phase II trial. J Clin Oncol (2013) 31(33):4199–206. doi: 10.1200/jco.2012.48.3685
27. Apetoh L, Ghiringhelli F, Tesniere A, Obeid M, Ortiz C, Criollo A, et al. Toll-like receptor 4-dependent contribution of the immune system to anticancer chemotherapy and radiotherapy. Nat Med (2007) 13(9):1050–9. doi: 10.1038/nm1622
28. Kepp O, Tesniere A, Zitvogel L, Kroemer G. The immunogenicity of tumor cell death. Curr Opin Oncol (2009) 21(1):71–6. doi: 10.1097/CCO.0b013e32831bc375
29. Kroemer G, Galluzzi L, Kepp O, Zitvogel L. Immunogenic cell death in cancer therapy. Annu Rev Immunol (2013) 31:51–72. doi: 10.1146/annurev-immunol-032712-100008
30. Galluzzi L, Buqué A, Kepp O, Zitvogel L, Kroemer G. Immunogenic cell death in cancer and infectious disease. Nat Rev Immunol (2017) 17(2):97–111. doi: 10.1038/nri.2016.107
31. Garg AD, Krysko DV, Verfaillie T, Kaczmarek A, Ferreira GB, Marysael T, et al. A novel pathway combining calreticulin exposure and ATP secretion in immunogenic cancer cell death. EMBO J (2012) 31(5):1062–79. doi: 10.1038/emboj.2011.497
32. Panaretakis T, Kepp O, Brockmeier U, Tesniere A, Bjorklund AC, Chapman DC, et al. Mechanisms of pre-apoptotic calreticulin exposure in immunogenic cell death. EMBO J (2009) 28(5):578–90. doi: 10.1038/emboj.2009.1
33. Garg AD, Dudek AM, Agostinis P. Calreticulin surface exposure is abrogated in cells lacking, chaperone-mediated autophagy-essential gene, LAMP2A. Cell Death disease. (2013) 4(10):e826. doi: 10.1038/cddis.2013.372
34. Kepp O, Senovilla L, Vitale I, Vacchelli E, Adjemian S, Agostinis P, et al. Consensus guidelines for the detection of immunogenic cell death. Oncoimmunology (2014) 3(9):e955691. doi: 10.4161/21624011.2014.955691
35. Dudek-Perić AM, Ferreira GB, Muchowicz A, Wouters J, Prada N, Martin S, et al. Antitumor immunity triggered by melphalan is potentiated by melanoma cell surface-associated calreticulin. Cancer Res (2015) 75(8):1603–14. doi: 10.1158/0008-5472.Can-14-2089
36. Garg AD, Martin S, Golab J, Agostinis P. Danger signalling during cancer cell death: origins, plasticity and regulation. Cell Death differentiation. (2014) 21(1):26–38. doi: 10.1038/cdd.2013.48
37. Krysko DV, Garg AD, Kaczmarek A, Krysko O, Agostinis P, Vandenabeele P. Immunogenic cell death and DAMPs in cancer therapy. Nat Rev Cancer. (2012) 12(12):860–75. doi: 10.1038/nrc3380
38. Galluzzi L, Senovilla L, Zitvogel L, Kroemer G. The secret ally: immunostimulation by anticancer drugs. Nat Rev Drug discovery. (2012) 11(3):215–33. doi: 10.1038/nrd3626
39. Zhu J, He S, Du J, Wang Z, Li W, Chen X, et al. Local administration of a novel toll-like receptor 7 agonist in combination with doxorubicin induces durable tumouricidal effects in a murine model of T cell lymphoma. J Hematol Oncol (2015) 8:21. doi: 10.1186/s13045-015-0121-9
40. Gao D, Li W, Wang W, Cai Y, Wang Y, Luo X, et al. Synergy of purine-scaffold TLR7 agonist with doxorubicin on systemic inhibition of lymphoma in mouse model. J Cancer. (2017) 8(16):3183–9. doi: 10.7150/jca.20015
41. Casares N, Pequignot MO, Tesniere A, Ghiringhelli F, Roux S, Chaput N, et al. Caspase-dependent immunogenicity of doxorubicin-induced tumor cell death. J Exp Med (2005) 202(12):1691–701. doi: 10.1084/jem.20050915
42. Garg AD, More S, Rufo N, Mece O, Sassano ML, Agostinis P, et al. Trial watch: Immunogenic cell death induction by anticancer chemotherapeutics. Oncoimmunology (2017) 6(12):e1386829. doi: 10.1080/2162402x.2017.1386829
43. Ogawa M, Tomita Y, Nakamura Y, Lee MJ, Lee S, Tomita S, et al. Immunogenic cancer cell death selectively induced by near infrared photoimmunotherapy initiates host tumor immunity. Oncotarget (2017) 8(6):10425–36. doi: 10.18632/oncotarget.14425
44. Nagaya T, Friedman J, Maruoka Y, Ogata F, Okuyama S, Clavijo PE, et al. Host immunity following near-infrared photoimmunotherapy is enhanced with PD-1 checkpoint blockade to eradicate established antigenic tumors. Cancer Immunol Res (2019) 7(3):401–13. doi: 10.1158/2326-6066.Cir-18-0546
45. Ritchie ME, Phipson B, Wu D, Hu Y, Law CW, Shi W, et al. Limma powers differential expression analyses for RNA-sequencing and microarray studies. Nucleic Acids Res (2015) 43(7):e47. doi: 10.1093/nar/gkv007
46. Garg AD, De Ruysscher D, Agostinis P. Immunological metagene signatures derived from immunogenic cancer cell death associate with improved survival of patients with lung, breast or ovarian malignancies: A large-scale meta-analysis. Oncoimmunology (2016) 5(2):e1069938. doi: 10.1080/2162402x.2015.1069938
47. Iasonos A, Schrag D, Raj GV, Panageas KS. How to build and interpret a nomogram for cancer prognosis. J Clin Oncol (2008) 26(8):1364–70. doi: 10.1200/jco.2007.12.9791
48. Vickers AJ, Cronin AM, Elkin EB, Gonen M. Extensions to decision curve analysis, a novel method for evaluating diagnostic tests, prediction models and molecular markers. BMC Med Inf decision making. (2008) 8:53. doi: 10.1186/1472-6947-8-53
49. Li B, Severson E, Pignon JC, Zhao H, Li T, Novak J, et al. Comprehensive analyses of tumor immunity: implications for cancer immunotherapy. Genome Biol (2016) 17(1):174. doi: 10.1186/s13059-016-1028-7
50. Cohen R, Hain E, Buhard O, Guilloux A, Bardier A, Kaci R, et al. Association of primary resistance to immune checkpoint inhibitors in metastatic colorectal cancer with misdiagnosis of microsatellite instability or mismatch repair deficiency status. JAMA Oncol (2019) 5(4):551–5. doi: 10.1001/jamaoncol.2018.4942
51. Ben-Porath I, Thomson MW, Carey VJ, Ge R, Bell GW, Regev A, et al. An embryonic stem cell-like gene expression signature in poorly differentiated aggressive human tumors. Nat Genet (2008) 40(5):499–507. doi: 10.1038/ng.127
52. Wong DJ, Liu H, Ridky TW, Cassarino D, Segal E, Chang HY. Module map of stem cell genes guides creation of epithelial cancer stem cells. Cell Stem Cell (2008) 2(4):333–44. doi: 10.1016/j.stem.2008.02.009
53. Bhattacharya B, Miura T, Brandenberger R, Mejido J, Luo Y, Yang AX, et al. Gene expression in human embryonic stem cell lines: unique molecular signature. Blood (2004) 103(8):2956–64. doi: 10.1182/blood-2003-09-3314
54. Malta TM, Sokolov A, Gentles AJ, Burzykowski T, Poisson L, Weinstein JN, et al. Machine learning identifies stemness features associated with oncogenic dedifferentiation. Cell (2018) 173(2):338–54.e15. doi: 10.1016/j.cell.2018.03.034
55. Nerenstone S, Friedman M. Medical treatment of hepatocellular carcinoma. Gastroenterol Clinics North America. (1987) 16(4):603–12. doi: 10.1016/S0889-8553(21)00333-2
56. Le Grazie M, Biagini MR, Tarocchi M, Polvani S, Galli A. Chemotherapy for hepatocellular carcinoma: The present and the future. World J hepatology. (2017) 9(21):907–20. doi: 10.4254/wjh.v9.i21.907
57. Zaanan A, Williet N, Hebbar M, Dabakuyo TS, Fartoux L, Mansourbakht T, et al. Gemcitabine plus oxaliplatin in advanced hepatocellular carcinoma: a large multicenter AGEO study. J hepatology. (2013) 58(1):81–8. doi: 10.1016/j.jhep.2012.09.006
58. Chen KW, Ou TM, Hsu CW, Horng CT, Lee CC, Tsai YY, et al. Current systemic treatment of hepatocellular carcinoma: A review of the literature. World J hepatology. (2015) 7(10):1412–20. doi: 10.4254/wjh.v7.i10.1412
59. O'Brien PC. The appropriateness of analysis of variance and multiple-comparison procedures. Biometrics (1983) 39(3):787–94. doi: 10.2307/2531110
60. Perneger TV. What's wrong with bonferroni adjustments. BMJ (Clinical Res ed). (1998) 316(7139):1236–8. doi: 10.1136/bmj.316.7139.1236
61. Li T, Fu J, Zeng Z, Cohen D, Li J, Chen Q, et al. TIMER2.0 for analysis of tumor-infiltrating immune cells. Nucleic Acids Res (2020) 48(W1):W509–w14. doi: 10.1093/nar/gkaa407
62. Dean M, Fojo T, Bates S. Tumour stem cells and drug resistance. Nat Rev Cancer. (2005) 5(4):275–84. doi: 10.1038/nrc1590
63. Acebes-Fernández V, Landeria-Viñuela A, Juanes-Velasco P, Hernández AP, Otazo-Perez A, Manzano-Román R, et al. Nanomedicine and onco-immunotherapy: From the bench to bedside to biomarkers. Nanomaterials (Basel Switzerland) (2020) 10(7):1–72. doi: 10.3390/nano10071274
64. Land WG. The role of damage-associated molecular patterns (DAMPs) in human diseases: Part II: DAMPs as diagnostics, prognostics and therapeutics in clinical medicine. Sultan Qaboos Univ Med J (2015) 15(2):e157–70.
65. Li W, Chen QF, Huang T, Wu P, Shen L, Huang ZL. Identification and validation of a prognostic lncRNA signature for hepatocellular carcinoma. Front Oncol (2020) 10:780. doi: 10.3389/fonc.2020.00780
66. Zheng YL, Li L, Jia YX, Zhang BZ, Li JC, Zhu YH, et al. LINC01554-mediated glucose metabolism reprogramming suppresses tumorigenicity in hepatocellular carcinoma via downregulating PKM2 expression and inhibiting Akt/mTOR signaling pathway. Theranostics (2019) 9(3):796–810. doi: 10.7150/thno.28992
67. Niu JZ, Liang XC, Xu ZW, Li ZH, Li J, Meng Y, et al. Long non-coding RNA Linc00261 as a novel potential diagnostic and prognostic biomarker for gallbladder cancer. Trans Cancer Res (2020) 9(10):6078–85. doi: 10.21037/tcr-20-1091
68. Liu Z, Pu Y, Bao Y, He S. Investigation of potential molecular biomarkers for diagnosis and prognosis of AFP-negative HCC. Int J Gen Med (2021) 14:4369–80. doi: 10.2147/ijgm.S323868
69. Sui J, Miao Y, Han J, Nan H, Shen B, Zhang X, et al. Systematic analyses of a novel lncRNA-associated signature as the prognostic biomarker for hepatocellular carcinoma. Cancer Med (2018) 7(7):3240–56. doi: 10.1002/cam4.1541
70. Ma X, Mo M, Tan HJJ, Tan C, Zeng X, Zhang G, et al. LINC02499, a novel liver-specific long non-coding RNA with potential diagnostic and prognostic value, inhibits hepatocellular carcinoma cell proliferation, migration, and invasion. Hepatol Res (2020) 50(6):726–40. doi: 10.1111/hepr.13491
71. Ma X, Mo M, Juan H, Tan J, Tan C, Zeng X, et al. LINC02499, a novel liver-specific long non-coding RNA with potential diagnostic and prognostic value, inhibits hepatocellular carcinoma cell proliferation, migration, and invasion. Hepatol Res (2020) 50:726740. doi: 10.1111/hepr.13604
72. Huang K, Lu Z, Li L, Peng G, Zhou W, Ye Q. Construction of a ceRNA network and a genomic-clinicopathologic nomogram to predict survival for HBV-related HCC. Hum Cell (2021) 34(6):1830–42. doi: 10.1007/s13577-021-00607-y
73. Zhang DD, Shi Y, Liu JB, Yang XL, Xin R, Wang HM, et al. Construction of a myc-associated ceRNA network reveals a prognostic signature in hepatocellular carcinoma. Mol Ther Nucleic Acids (2021) 24:1033–50. doi: 10.1016/j.omtn.2021.04.019
74. Wang T, Yang Y, Sun T, Qiu H, Wang J, Ding C, et al. The pyroptosis-related long noncoding RNA signature predicts prognosis and indicates immunotherapeutic efficiency in hepatocellular carcinoma. Front Cell Dev Biol (2022) 10:779269. doi: 10.3389/fcell.2022.779269
75. Liu Y, Liu R, Zhao J, Zeng Z, Shi Z, Lu Q, et al. LncRNA TMEM220-AS1 suppresses hepatocellular carcinoma cell proliferation and invasion by regulating the TMEM220/β-catenin axis. J Cancer. (2021) 12(22):6805–13. doi: 10.7150/jca.63351
76. Cao C, Li J, Li G, Hu G, Deng Z, Huang B, et al. Long non-coding RNA TMEM220-AS1 suppressed hepatocellular carcinoma by regulating the miR-484/MAGI1 axis as a competing endogenous RNA. Front Cell Dev Biol (2021) 9:681529. doi: 10.3389/fcell.2021.681529
77. Chen F, Peng X, Teng Z, Long H, Wu H. Identification of prognostic LncRNAs subtypes predicts prognosis and immune microenvironment for glioma. Evidence-Based complementary Altern Med eCAM. (2022) 2022:3709823. doi: 10.1155/2022/3709823
78. Li X, Zhou L, Lu T, Zhang L, Li Y, Xu J, et al. Constructing an immune- and ferroptosis-related lncRNA signature to predict the immune landscape of human bladder cancer. J Clin Lab analysis. (2022) 36(5):e24389. doi: 10.1002/jcla.24389
79. Zhang G, Sun J, Zhang X. A novel cuproptosis-related LncRNA signature to predict prognosis in hepatocellular carcinoma. Sci Rep (2022) 12(1):11325. doi: 10.1038/s41598-022-15251-1
80. Wang S, Xu M, Sun Z, Yu X, Deng Y, Chang H. LINC01018 confers a novel tumor suppressor role in hepatocellular carcinoma through sponging microRNA-182-5p. Am J Physiol Gastrointestinal liver Physiol (2019) 317(2):G116–g26. doi: 10.1152/ajpgi.00005.2019
81. Li D, Zhou T, Li Y, Xu Y, Cheng X, Chen J, et al. LINC02362 attenuates hepatocellular carcinoma progression through the miR-516b-5p/SOSC2 axis. Aging (2022) 14(1):368–88. doi: 10.18632/aging.203813
82. Mathai RA, Vidya RVS, Reddy BS, Thomas L, Udupa K, Kolesar J, et al. Potential utility of liquid biopsy as a diagnostic and prognostic tool for the assessment of solid tumors: Implications in the precision oncology. J Clin Med (2019) 8(3):1–17. doi: 10.3390/jcm8030373
83. Jiang P, Yang F, Zou C, Bao T, Wu M, Yang D, et al. The construction and analysis of a ferroptosis-related gene prognostic signature for pancreatic cancer. Aging (2021) 13(7):10396–414. doi: 10.18632/aging.202801
84. Hong W, Liang L, Gu Y, Qi Z, Qiu H, Yang X, et al. Immune-related lncRNA to construct novel signature and predict the immune landscape of human hepatocellular carcinoma. Mol Ther Nucleic Acids (2020) 22:937–47. doi: 10.1016/j.omtn.2020.10.002
85. Ding T, Xu J, Wang F, Shi M, Zhang Y, Li SP, et al. High tumor-infiltrating macrophage density predicts poor prognosis in patients with primary hepatocellular carcinoma after resection. Hum pathology. (2009) 40(3):381–9. doi: 10.1016/j.humpath.2008.08.011
86. Hoechst B, Voigtlaender T, Ormandy L, Gamrekelashvili J, Zhao F, Wedemeyer H, et al. Myeloid derived suppressor cells inhibit natural killer cells in patients with hepatocellular carcinoma via the NKp30 receptor. Hepatol (Baltimore Md). (2009) 50(3):799–807. doi: 10.1002/hep.23054
87. Wang L, Li N, Fan X, Wang X, Zhang X, Zhang K, et al. Circulating CTLA-4 levels and CTLA4 polymorphisms associate with disease condition and progression and hepatocellular carcinoma patients' survival in chronic hepatitis b virus infection. Int Immunopharmacol (2020) 82:106377. doi: 10.1016/j.intimp.2020.106377
88. Tian J, Liu Y, Zhang TL, Xiao YN, Guo CY, Xie YH, et al. Clinical significance of LAG-3 on microvessel density in primary hepatocellular carcinoma. Indian J Pathol Microbiol (2022) 65(3):581–8. doi: 10.4103/ijpm.ijpm_620_21
89. Yamashita T, Wang XW. Cancer stem cells in the development of liver cancer. J Clin Invest (2013) 123(5):1911–8. doi: 10.1172/jci66024
90. Flies DB, Sandler BJ, Sznol M, Chen L. Blockade of the B7-H1/PD-1 pathway for cancer immunotherapy. Yale J Biol Med (2011) 84(4):409–21.
91. Wang S, Chen L. Immunobiology of cancer therapies targeting CD137 and B7-H1/PD-1 cosignal pathways. Curr topics Microbiol Immunol (2011) 344:245–67. doi: 10.1007/82_2010_81
92. Kuang DM, Zhao Q, Peng C, Xu J, Zhang JP, Wu C, et al. Activated monocytes in peritumoral stroma of hepatocellular carcinoma foster immune privilege and disease progression through PD-L1. J Exp Med (2009) 206(6):1327–37. doi: 10.1084/jem.20082173
93. Wu K, Kryczek I, Chen L, Zou W, Welling TH. Kupffer cell suppression of CD8+ T cells in human hepatocellular carcinoma is mediated by B7-H1/programmed death-1 interactions. Cancer Res (2009) 69(20):8067–75. doi: 10.1158/0008-5472.Can-09-0901
94. Bao S, Jiang X, Jin S, Tu P, Lu J. TGF-β1 induces immune escape by enhancing PD-1 and CTLA-4 expression on T lymphocytes in hepatocellular carcinoma. Front Oncol (2021) 11:694145. doi: 10.3389/fonc.2021.694145
95. Meng F, Li L, Lu F, Yue J, Liu Z, Zhang W, et al. Overexpression of TIGIT in NK and T cells contributes to tumor immune escape in myelodysplastic syndromes. Front Oncol (2020) 10:1595. doi: 10.3389/fonc.2020.01595
Keywords: hepatocellular carcinoma, lncRNAs, immunogenic cell death, biomarkers, clinical prognosis
Citation: He M, Gu W, Gao Y, Liu Y, Liu J and Li Z (2022) Molecular subtypes and a prognostic model for hepatocellular carcinoma based on immune- and immunogenic cell death-related lncRNAs. Front. Immunol. 13:1043827. doi: 10.3389/fimmu.2022.1043827
Received: 14 September 2022; Accepted: 04 November 2022;
Published: 21 November 2022.
Edited by:
Gaoqian Feng, Burnet Institute, AustraliaCopyright © 2022 He, Gu, Gao, Liu, Liu and Li. This is an open-access article distributed under the terms of the Creative Commons Attribution License (CC BY). The use, distribution or reproduction in other forums is permitted, provided the original author(s) and the copyright owner(s) are credited and that the original publication in this journal is cited, in accordance with accepted academic practice. No use, distribution or reproduction is permitted which does not comply with these terms.
*Correspondence: Jie Liu, bGo2OTEwMTJAMTI2LmNvbQ==; Zengjun Li, empsaUBzZGZtdS5lZHUuY24=
†These authors have contributed equally to this work
Disclaimer: All claims expressed in this article are solely those of the authors and do not necessarily represent those of their affiliated organizations, or those of the publisher, the editors and the reviewers. Any product that may be evaluated in this article or claim that may be made by its manufacturer is not guaranteed or endorsed by the publisher.
Research integrity at Frontiers

Learn more about the work of our research integrity team to safeguard the quality of each article we publish.