
94% of researchers rate our articles as excellent or good
Learn more about the work of our research integrity team to safeguard the quality of each article we publish.
Find out more
ORIGINAL RESEARCH article
Front. Hortic., 01 November 2023
Sec. Breeding and Genetics
Volume 2 - 2023 | https://doi.org/10.3389/fhort.2023.1290521
This article is part of the Research TopicHarnessing The Potential of De Novo Domestication For Sustainable Healthy DietsView all 5 articles
 Prince Emmanuel Norman1,2,3*
 Asrat Asfaw2
 Paterne Angelot Agre2
 Agyemang Danquah3
 Pangirayi Bernard Tongoona3
 Eric Yirenkyi Danquah3
 Robert Asiedu2
Phenotypic and genotypic profiling helps identify genotypes with suitable and complementary traits for genetic improvement in crops. A total of 32 traits were assessed in 36 genotypes of white Guinea yam established in a 6 × 6 triple lattice design. The objective was to evaluate an array of plant traits that define the genetic merits of breeding lines for yam improvement. Different analytical tools were used to identify and prioritize relevant traits defining the genetic merits of breeding lines in the yam improvement program. Out of the 32 traits measured, the linear combination of 14 traits that minimize within-group variance and maximize between-group variance for discriminating the genetic values of yam breeding lines were identified. When best linear unbiased prediction with genomic relationship matrix (GBLUP) was used, the accuracies of genomic breeding values were higher (r=0.87 to 0.97) for the seven traits (dry matter content, intensity of flesh oxidization of shredded tuber, pasting temperature, pasting time, tuber flesh colour, yam mosaic virus and fresh tuber yield) with high broad-sense heritability values (H2m>0.6). While, for the remaining seven traits with low (H2m<0.3) to medium (H2m=0.3 to 0.54) broad-sense heritability values, the accuracies of genomic estimated breeding values (GEBV) were low (r<0.4) to medium (r=0.4-0.8). The genotype–trait (GT) biplot display revealed superior clones with desirable genetic values for the key traits. These results are relevant for parental selection aimed at improving key agronomic traits in white Guinea yam.
Yam (Dioscorea spp.) is among the extensively cultivated root and tuber crops in the tropical and subtropical regions of Africa, Asia, America, the Pacific, and the Caribbean (Coursey, 1976). The global yam production is estimated at 73 million tons, with West Africa contributing more than 93% (FAOSTAT, 2019; Aighewi et al., 2020). In West Africa, yam is a highly preferred staple and cash crop, contributing more than 15 percent of the daily per capita calorie intake and 32 percent farm income for over 300 million people (Price et al., 2017). It is a food of choice in the yam-belt of West and Central Africa, where it exhibits a deep-rooted connection with the people’s social and cultural facets (Obidiegwu and Akpabio, 2017).
Among the cultivated yam species, white Guinea yam (D. rotundata Poir) indigenous to West Africa is the most important and widely planted crop (Tamiru et al., 2017). It has an immense but underutilized yield potential. The yield gap on farmer fields is enormous, with an achieved yield estimated as 20 percent of the attainable yield potential of 40 to 50 tons per ha (Bassey and Akpan, 2015). Achieving high and stable tuber yield with acceptable end-use quality is the primary target of the yam growers. Crop cultivar is among the factors that account for yield differences among farmer’s fields. Genetic improvement through breeding can unleash the yam yield potential and increase sustainable production by ensuring stable yields and marketable quality. A better understanding of the genetic values of breeding lines used in crop improvement programs is essential to address the yield gaps and resilience to biotic and abiotic stress.
Profiling of breeding lines involves genetic analysis of the existing divergence among genotypes and determining functional relationships in the traits that constitute the genotypes. Trait profiles of genotypes are utilized in many studies such as multiple QTL mapping (Bink et al., 2002), association mapping (Baldwin et al., 2011), the heritability of disease resistance (Song et al., 2005), and determination of genetic estimates, breeding values and relationships (Gjedrem, 2010). Trait profiling also helps in the selection process to match the selection decisions to the end-users needs. Over the years, the yam breeding goals have been refocused and restructured to target increased adoption of future releases of elite yam genotypes with correct product profiles and high market penetration potential (Darkwa et al., 2020a). The breeding targets have transformed from undifferentiated products to a differentiated product concept where the client/customer needs are profiled and translated to product specifications. The product concept involves breeding for the desired traits demanded by the target clients (producers, processors, marketers, and consumers) (Darkwa et al., 2020a). Thus, a good understanding of the genetic profile of traits in yams could help yam breeders employ a suitable breeding strategy to develop superior cultivars that drive breeding program success (Arnau et al., 2017; Norman et al., 2018).
Various molecular and phenotypic methods have been used to dissect trait profile of breeding lines in yam improvement programs (Asiedu and Sartie, 2010; Nemorin et al., 2013; Girma et al., 2014; Souza, 2015; Arnau et al., 2017; Tamiru et al., 2017; Agre et al., 2019; Darkwa et al., 2020b). Identifying suitable parents and heterotic groups in the breeding population helps breeders select the population improvement strategy and make short-term variety release. Moreover, understanding the genetic variability in yam breeder’s collection is necessary to utilize trait variants within the available gene pool to obtain desired genetic gains. This study aimed to assess the genetic and phenotypic trait values of yam breeding lines for yam improvement.
This study was conducted at the experimental site of the International Institute of Tropical Agriculture (IITA), Ibadan, Nigeria (07°29.299’’N, 003°53.186’’E and 224 m altitude) during the 2017/2018 cropping season. The site represents a forest savannah transition zone with total rainfall of 1305.55 mm, a mean minimum and maximum air temperature of 22.7°C and 30.4°C, and a mean minimum and maximum relative humidity of 54.8% and 92.4%, respectively. Soil samples of the trial site were collected and analyzed to determine the soil’s inherent fertility that supports the growth and development of the studied clones using the procedures described by ISRIC/FAO (2002). The attributes of the soil at the trial site were: slightly acidic with pH=6.2, organic carbon (0.43%), nitrogen, N (0.005%), phosphorous, P (37.07 ppm) and potassium, K (0.758 Cmol/kg).
Thirty-six white yam genotypes were used for the trial laid out in a 6 × 6 triple lattice design. The pedigree details of the breeding lines used for the present study are presented in Table 1. Healthy tubers were cut into setts of 0.2 kg each, pre-treated in a mixture of 0.07 kg Mancozeb, 75 mL Chlorpyrifos and 10 L tap water for 5 min and dried for 20 h under shade. The treated setts were planted in early May 2017 in holes made on the crest of ridges spaced 1 m × 1 m between and within rows giving a population of 10,000 plants ha-1. Weeding was done manually using hoes.
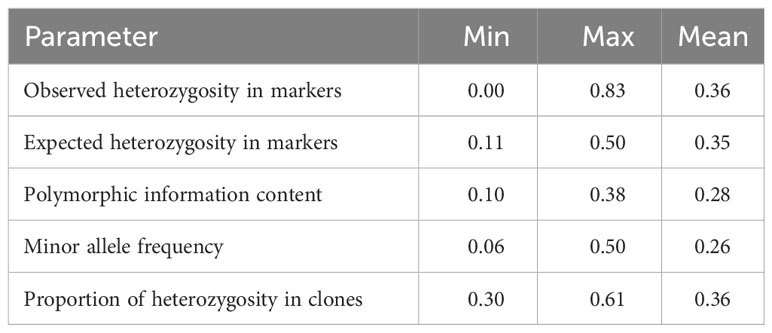
Table 1 Population genetics parameters in markers and genotypes.
A total of 39 agro-morphological traits comprising 32 variables and seven covariates were collected based on protocols described by Asfaw (2016) with slight modifications (Table 2). Virus disease severity scores were collected using the 1-5 disease rating scale; where 1=no visible symptom of the disease; 2=mild; 3=low; 4=intermediate; 5=high on 8 plants per plot at 60, 75, 90, 105, 120, 135, 150, 165 and 180 days after planting (DAP). The disease severity score values for yam mosaic virus were converted to percentages and then used to estimate the area under disease progress curve (AUDPC) values as described by Forbes et al. (2014):
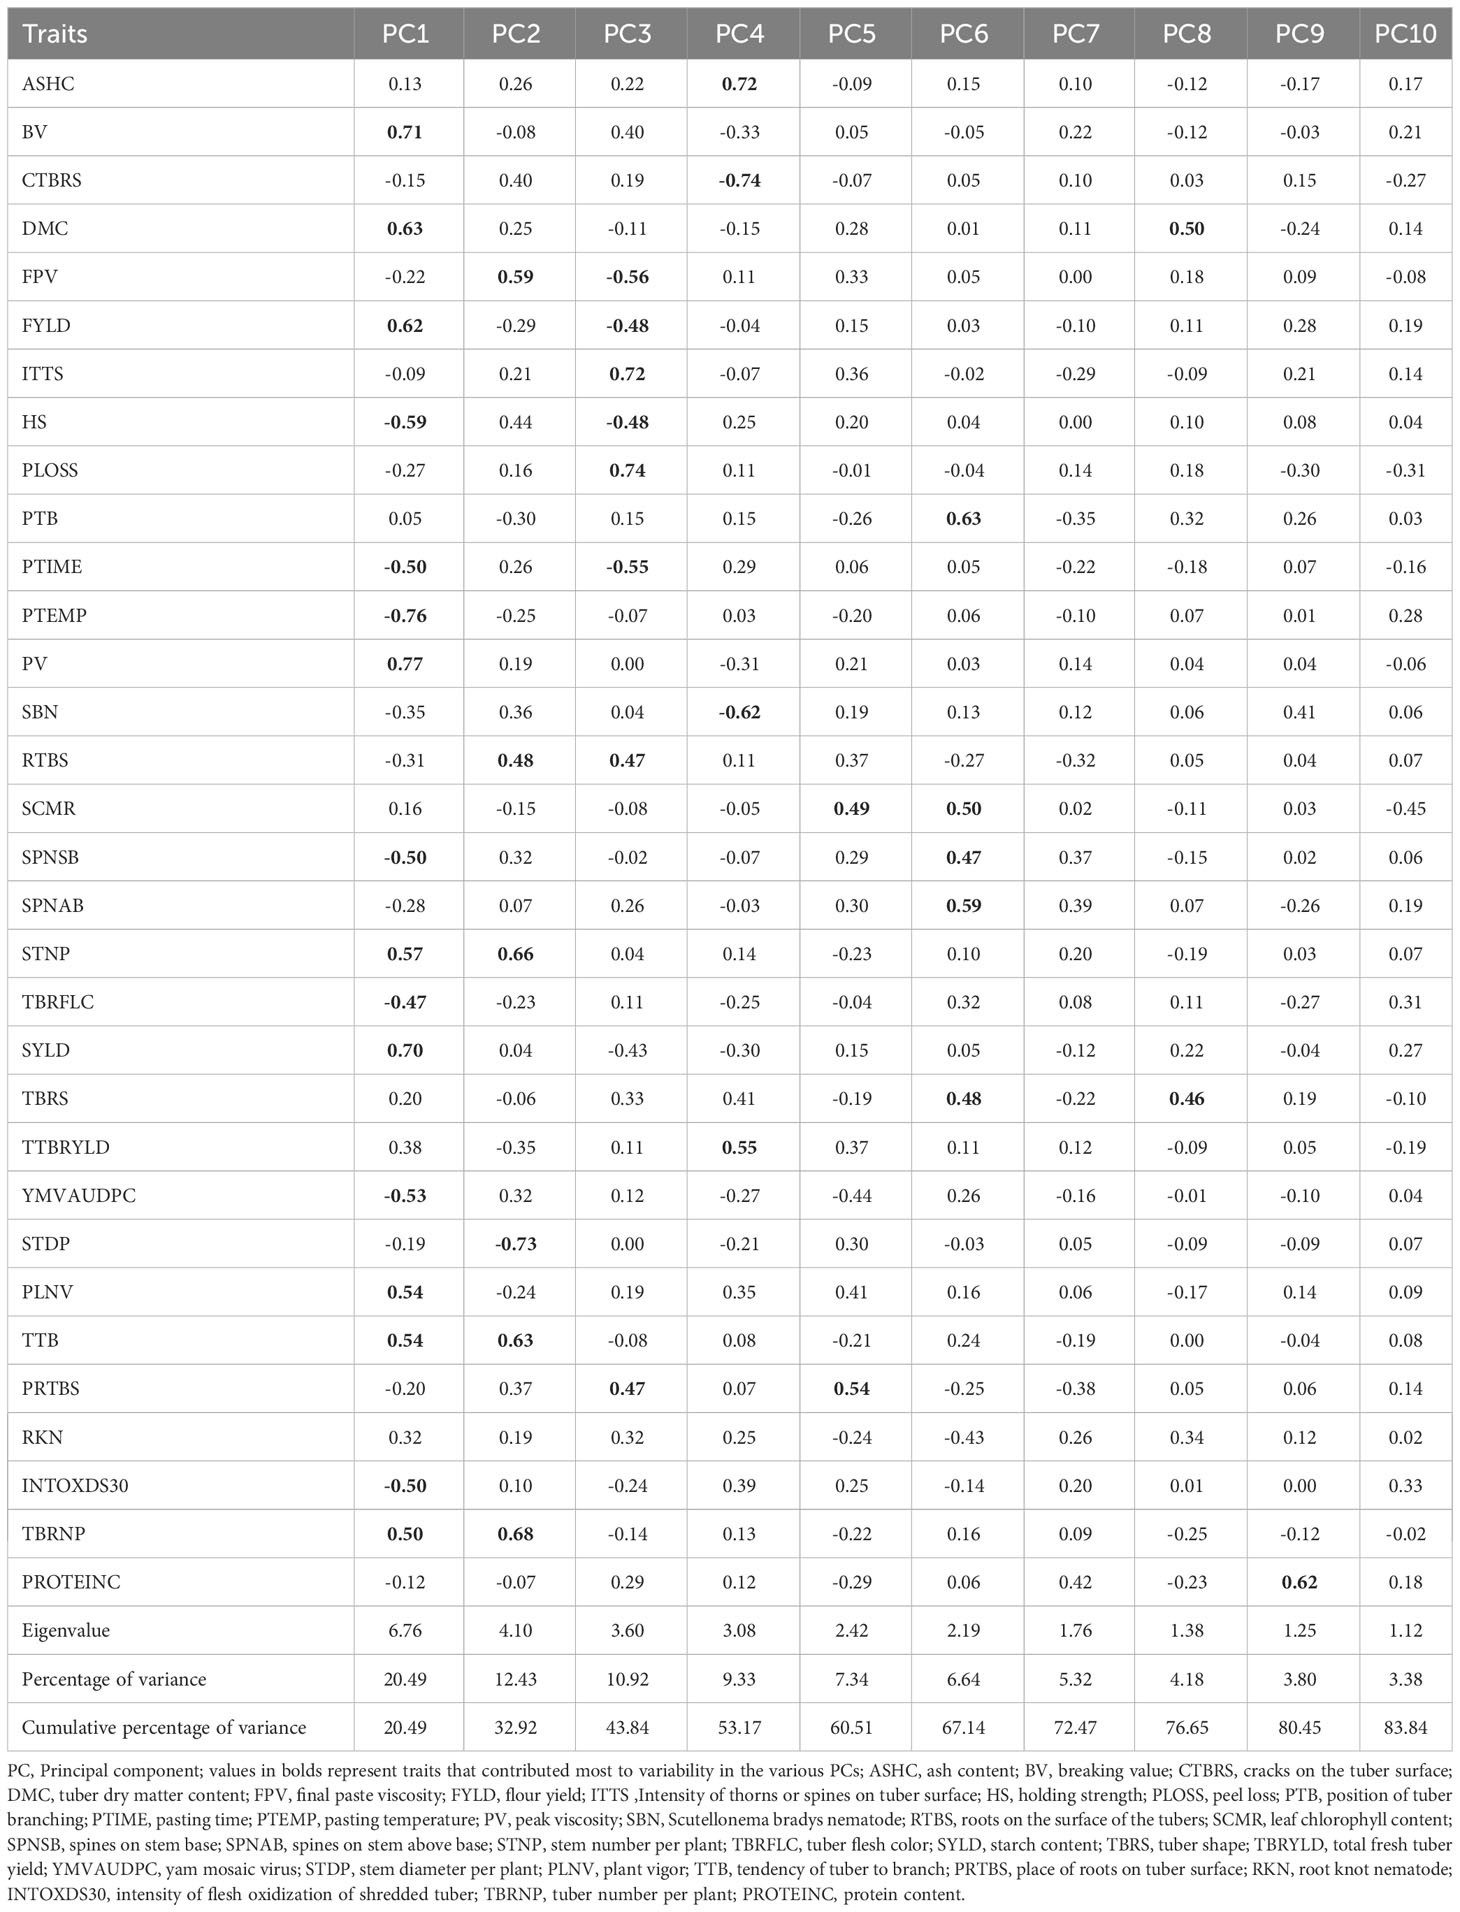
Table 2 Eigen vectors, eigen values, percent variation and accumulated variation accounted by the first ten principal components.
where = disease severity at the ith observation, = time (days) at the ith observation, and n = total number of observations.
The dry matter content (%) was determined using the oven-dry method (AOAC, 1990). The starch content was measured using a modified protocol of Asaoka et al. (1992). Tuber samples of each genotype were weighed, washed, peeled, shredded and mixed in a container. About 200 ml of deionized water was added to 0.1 kg of each sample in a bottle and ground for 5 min using the LabMill. After blending, 3 L of water was added before sieving using 125 µm mesh (Yokyo SANPO). The mixture was left for 20 h followed by decantation of supernatant. The starch particles in dishes of known masses were dried to constant mass in an oven at 60°C.
where W1 = mass of evaporating dish; W2 = mass of evaporating dish + mass of starch before drying; and W3 = mass of evaporating dish + mass of starch after drying.
The pasting properties of starch were determined using a Rapid Visco-Analyzer (RVA Super 3, Newport Scientific Pty. Ltd, Australia). A 3 g sample of starch was dissolved in 25 ml of water in a sample canister. The sample was thoroughly mixed and fitted into the RVA as recommended (Newport Scientific, 1998).
Yam flour was produced by the method described by Komolafe and Akinoso (2005). Fresh yam tubers of 3 kg per genotype were peeled, washed, sliced, blanched in water heated at 70°C for 15 min, oven-dried at 60°C, milled using a hammer mill and packaged. The flour yield was determined using the protocol described by Krochmal and Kilbride (1966):
where WDF is the weight of dried flour content and WFTBR is the weight of fresh tuber.
The deoxyribonucleic acid (DNA) was extracted from lyophilized young leaves using modified Cetyl trimethylammonium bromide (CTAB) protocol with slight modification (Dellaporta et al., 1983). About 100 mg of lyophilized leaf samples were ground with genogrinder at 1500 rpm for 1 min. The ground tissue was transferred into a 2ml eppendorf tube, followed by the addition of 1ml 0.1M HEPES buffer (12 g HEPES in 500 ml dH20, 102 mg PVP, 90 mg L-ascorbic acid, 200 μl 2-mercaptoethanol), mixing, centrifugation at 13000 rpm for 5 min, and careful discarding of the supernatant. To each sample, 800 µl CTAB buffer (2% CTAB, 1.4 m NaCl, 20 mM EDTA, 100 mm Tris HCl, pH 8, 3% mercaptoethanol) and 10 μl Protienase K were added. The mixture was incubated in 65°C water bath for 30 min, gently mixed, removed from the water bath, uncapped and cooled on ice for 1–2 min. The content was then centrifuged at 13000 rpm for 10 min, the aqueous phase was transferred into clean eppendorf tubes. About 600 µl chloroform:isoamyl alcohol (24:1) was added to the content, mixed for 1 min by inversion of the tube and centrifuged at 13000 rpm for 10 min. About 500 µl of the supernatant was transferred into 1.5 ml clean freshly labeled microcentrifuge tubes followed by the addition of 500 µl ice-cold isopropanol (2:3) and incubation at -20°C for 1 h. The content was gently mixed by inversion until white, thread-like DNA appeared before centrifugation at 13000 rpm for 10 min. The supernatant was carefully decanted and the DNA pellet was washed with 500 µl cold 70% ethanol twice and dried on clean paper towel at 37°C for 30 min. The DNA was dissolved in 100 µl 1×TE (high salt) by gently flicking the tube and centrifuging at 13000 rpm for 10 min to collect the DNA at the bottom. A 6 µl of 10 mg/ml RNase was then added to 100 µl of diluted DNA and incubated at 37°C for 1 h and stored at -20°C for subsequent use.
The DNA was purified by re-suspending samples in 200 µl of 24:1 Chloroform : Isoamyl Alcohol and mixing contents in tubes by inversion. The samples were then centrifuged at 13,000 rpm for 20 min. The DNA quality and concentration were assessed using agarose gel and nanodrop method following Aljanabi and Martinez (1997). Concentrated DNA of 50 µl from each sample was sent to Diversity Array Technology (DArT) Pty Ltd, Canberra, Australia, for sequencing. Raw HapMap file received was converted to a variant call format (VCF) for the analysis using PERL programming language and Tassel (Bradbury et al., 2007; Elshire et al., 2011). The VCF file was filtered for missing values and polymorphic SNPs with quality parameters, a call rate greater than 80%, depth >95%, and a minor allele frequency of > 5%. A total of 8,277 SNPs markers were retained after filtering and were used to construct genomic relationship matrix in R (De Mendiburu, 2019) package ridge regression best linear unbiased prediction (rrBLUP) (Endelman, 2011). The missing data for markers were imputed using beagle 4 (Browning and Browning, 2007). The VCF file with the final SNP markers was converted to the numerical format in 0, 1, 2, where zero stands for genotype with no minor allele, 1 for heterozygote and 2 for homozygote minor allele count at each locus using recode A function implemented in PLINK (Purcell et al., 2007). The deviation of 1 from gene content or minor allele frequency (MAF) matrix were obtained to generate a score of -1, 0, 1 used in rrBLUP to construct the genomic relationship G-matrix.
Population genetic analysis to estimate various statistics such as the minor allele frequency (MAF), the observed and the expected heterozygosity, and the polymorphism information content were done using the function “–freq” and “–hardy” using PLINK V1.90 (Purcell et al., 2007).
A total of 32 variables were subjected to the best linear unbiased estimation (BLUE) analysis and a list of seven covariates (days to first emergence, senescence stage, days to 50% senescence, days to 100% senescence, tuber set weight, days to 50% emergence, sprout establishment rate (%)), were used in the model to estimate the BLUE for tuber yield. The identification and selection of key traits involved two stages: principal component analysis (PCA) and detection of multicollinearity using variance inflation factor (VIF) and path coefficient analysis. The 32 traits × 36 genotypes matrix were subjected to PCA. The PCA is one of the multivariate techniques utilized for the reduction of dimensionality in trait sets. The PCA was carried out using ppcor R package (Kim, 2015). The principal components (PCs) with eigenvalue > 1.0 were retained to explain the most significant amount of variation in the dataset and variables with eigenvector > 0.45 were considered to have significantly contributed to the variation accounted by the retained PCs (Peres-Neto et al., 2003).
The correlation coefficients between different traits were analyzed using ppcor R package (Kim, 2015) and FatorMiner R package (R Core Team, 2019). The statistical significance of the correlations was determined based on the standard guideline by Ratner (2009). According to this guideline, sets of traits with r-values ranging from 0 – 0.3 = weak positive or low colour intensity, 0.3 – 0.7 medium positive or medium colour intensity, and 0.7 – 1 = strong positive or high colour intensity. Moreover, traits with r-values ranging from 0 – -0.3 = weak negative or low colour intensity, -0.3 – -0.7 medium negative or medium colour intensity, and from -0.7 – -1 = strong negative linear relationship or high colour intensity.
The variables identified from the PCA were further subjected to a multicollinearity test using vif_metan and path_coeff function implemented in Metan package in R (Olivoto and Lúcio, 2020) and the VIF of each variable was assessed to remove traits that were highly correlated and redundant. Traits with inflated variance (VIF > 10) were considered redundant and then removed from the variables’ list (Hebbali, 2020). Based on this criterion, 14 traits were identified as independent and retained as key traits for genomic prediction and other related analyses to dissect the genetic merits of the breeding lines. Pattern of association among the key traits was further assessed with genotype–trait interaction (GT) biplot function in the GGE biplot analysis tool, according to Yan and Kang (2003).
Single-trial analysis based on multivariate mixed models using R lmerTest library (Kuznetsova et al., 2017) was considered. The model is described as follows: e where is a vector of observations from plots for each yam variety, and are the fixed and random effect vectors, respectively, e denotes the random error vector, and is the incidence matrix of the fixed effects for the blocks effect nested within replication; is the incidence matrix of random effects corresponding to the yam varieties under testing. Considering the mixed model matrix.
the solutions for β and b from the mixed model equation can be derived as thus:
Phenotypic BLUP (Best Linear Unbiased Predictor) was derived from the solution as:
The SNP data was later incorporated to model the relationship between the varieties based on marker information. Relationship matrix was computed based on the ridge regression method using rrBLUP library of R (Endelman, 2011). The R sommer library (Giovanny, 2019) was used to fit the model by constructing a new variance-covariance structure using genotype and the relationship matrix based on mmer (mixed model equation in R) solver. The Gu option, which by default makes use of the identity matrix was used to induce the relationship matrix.
The incidence matrix Z is now the design matrix for SNP effects, rather than an incident matrix of the genotype. b refers to the vector of random additive genomic effects that follows the assumption normality as: , where denotes the proportion of the genetic variance contributed by each SNP and Q is the additive genomic relationship matrix. is the proportion of residual variances to the marker variances. A prediction for the GEBV for each individual was calculated as , where ZiT is the vector of the SNP for individual i and b is the estimated SNP effects. An estimate of the genetic differences between and within genotypes was extracted and saved as “variance component.xls”. Breeding value (BV) modelled based on G-Matrix was extracted as the GEBV and correlated with raw BV for each trait to estimate the prediction accuracy (r) as:
Where PEV is the prediction error variance derived from the elements of the inverse of the coefficient matrix of the mixed model equations; and VA is the additive genetic variance.
Broad sense heritability estimates on mean entry basis ( were done to capture the proportion of phenotypic variation due to genetic values that may include effects due to dominance and epistasis (Robinson et al., 1949):
The genetic relationship matrix G was calculated from SNP markers for the genotypes based on the procedure described by vanRaden (2008). Accordingly,
where M is a n × m matrix (n = number of clones, m = number of marker loci) which specifies SNP genotype coefficients at each locus. The coefficients of the ith column in the M matrix are () for genotype A1A1, () for genotypes A1A2, and () for A2A2, where qi and pi are the frequencies of allele 1 (A1) and allele 2 (A2) at locus i, respectively. From the variance component analysis, additive genetic variance () was estimated. Narrow sense heritability was estimated from rrBLUP model considering SNP effect:
Where , and represents the total genetic variance, environmental variance, and additive variance, respectively, and nrep represent the number of replications. The and values were considered low for values that range from 0–0.30, moderate for values that range from 0.30–0.60, and high for those >0.60 as described by Robinson et al. (1949).
The population genetics analysis of the white yam breeding lines is presented in Table 1. The observed heterozygosity value ranged from 0.00 to 0.83, with an average of 0.36. The expected heterozygosity value ranged from 0.11 to 0.50, with an average of 0.35. The minor allele frequency ranged from 0.06 to 0.50, with a mean of 0.26. The polymorphic information content (PIC) ranged from 0.10 to 0.38, with an average value of 0.28. The proportion of heterozygosity in clones ranged from 0.30 to 0.61, with an average of 0.36. The findings indicate presence of high genetic variability and the potential usefulness of the studied genotypes for genetic improvement of the crop. Genotypes with high heterozygosity indicated high genetic variability for a response to selection. The findings agree with the views of Shete et al. (2000) and Norman et al. (2020) who noted the influence of heterozygosity and polymorphic information content on the genetic variability and response to selection. Pruvost et al. (2013) also noted the influence of allelic diversity and genetic differences on the genome transmission mode and number of successful hybridizations.
The selection of key traits was based on significant coefficients identified in the principal components and multicollinearity analysis tools. The principal component analysis demonstrated that all the PCs exhibited positive and negative coefficients for the studied traits, indicating the differential expressions and contributions of these traits to the genetic variations of yam genotypes. The PCA identified a total of 31 traits, of which the first principal component was more associated with breeding values of vegetative, disease, flour yield, starch yield and starch property traits (Table 2). The PC3 was more associated with tuber and starch property traits; PC2 with stem, tuber and starch attribute traits and PC4 more with the disease, tuber yield and quality traits, while PC5 and PC6 with growth and tuber attribute traits, PC8 and PC9 with tuber attribute and protein content traits, respectively. The PCA results also demonstrated a trend of higher genetic values of some traits with significantly strong positive or negative contributions to the observed genetic variability than those with weak correlation coefficients.
Of the 31 traits identified in the PCA, 14 traits (ash content, dry matter content, peak time, peak temperature, Scutellonema bradys nematode, leaf chlorophyll content, spines on stem above base, tuber flesh colour, tuber shape, fresh tuber yield, area under disease progress curve for yam mosaic virus, stem diameter per plant, intensity of flesh oxidization of shredded tuber and protein content) had VIF ranging from 5.0–9.9 (Table 3). Traits with small VIF values (VIF<5) indicate low correlation among variables under ideal conditions and non-significant multicollinearity. A VIF value of 10 implies that the relevant independent variable’s tolerance is 0.10 and that other variables explain 90% of the variable. Moreover, the VIF for the predictor starch peak viscosity (PV), for instance, reveals that the variance of the estimated coefficient of PV value is inflated by a factor of 240.7 because the PV value is highly correlated with the other traits (dry matter content and starch yield) in the dataset (Figure 1). The results generally implied that the 17 traits (breakdown value, cracks on the tuber surface, final paste viscosity, flour yield, intensity of thorns or spines on tuber surface, holding strength, peel loss, position of tuber branching, peak viscosity, roots on the surface of the tubers, spines on stem base, stem number per plant, starch yield, plant vigour, tendency of tuber to branch, place of roots on tuber surface and tuber number per plant) that identified discriminative with PCA analysis but exhibited serious multicollinearity exhibited relatively strong marginal correlations with several other traits in the dataset.
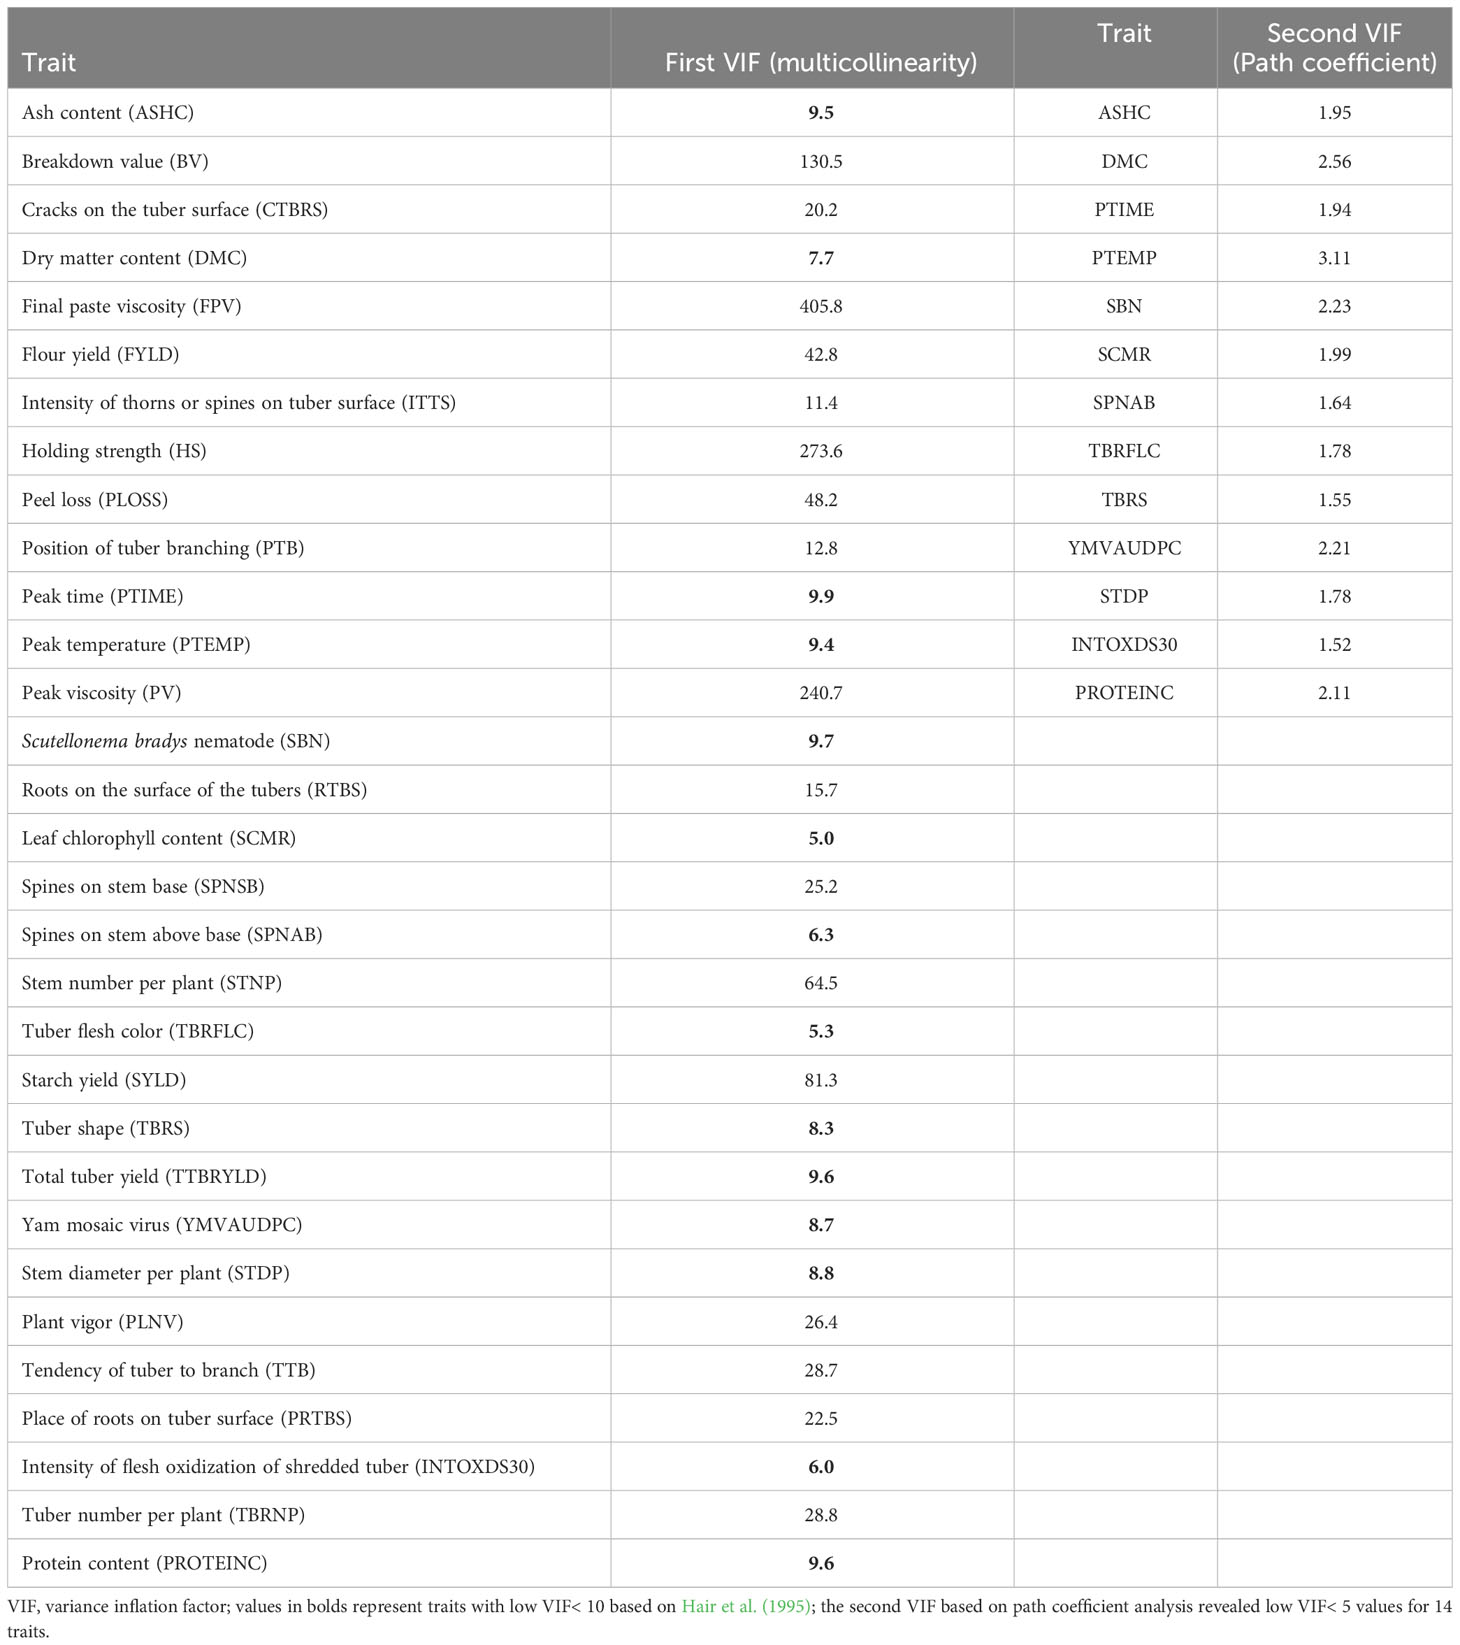
Table 3 Variance inflation factor (VIF) values of 31 traits and 14 traits determined based on multicollinearity and path coefficient analysis, respectively, in 36 genotypes of white yam.
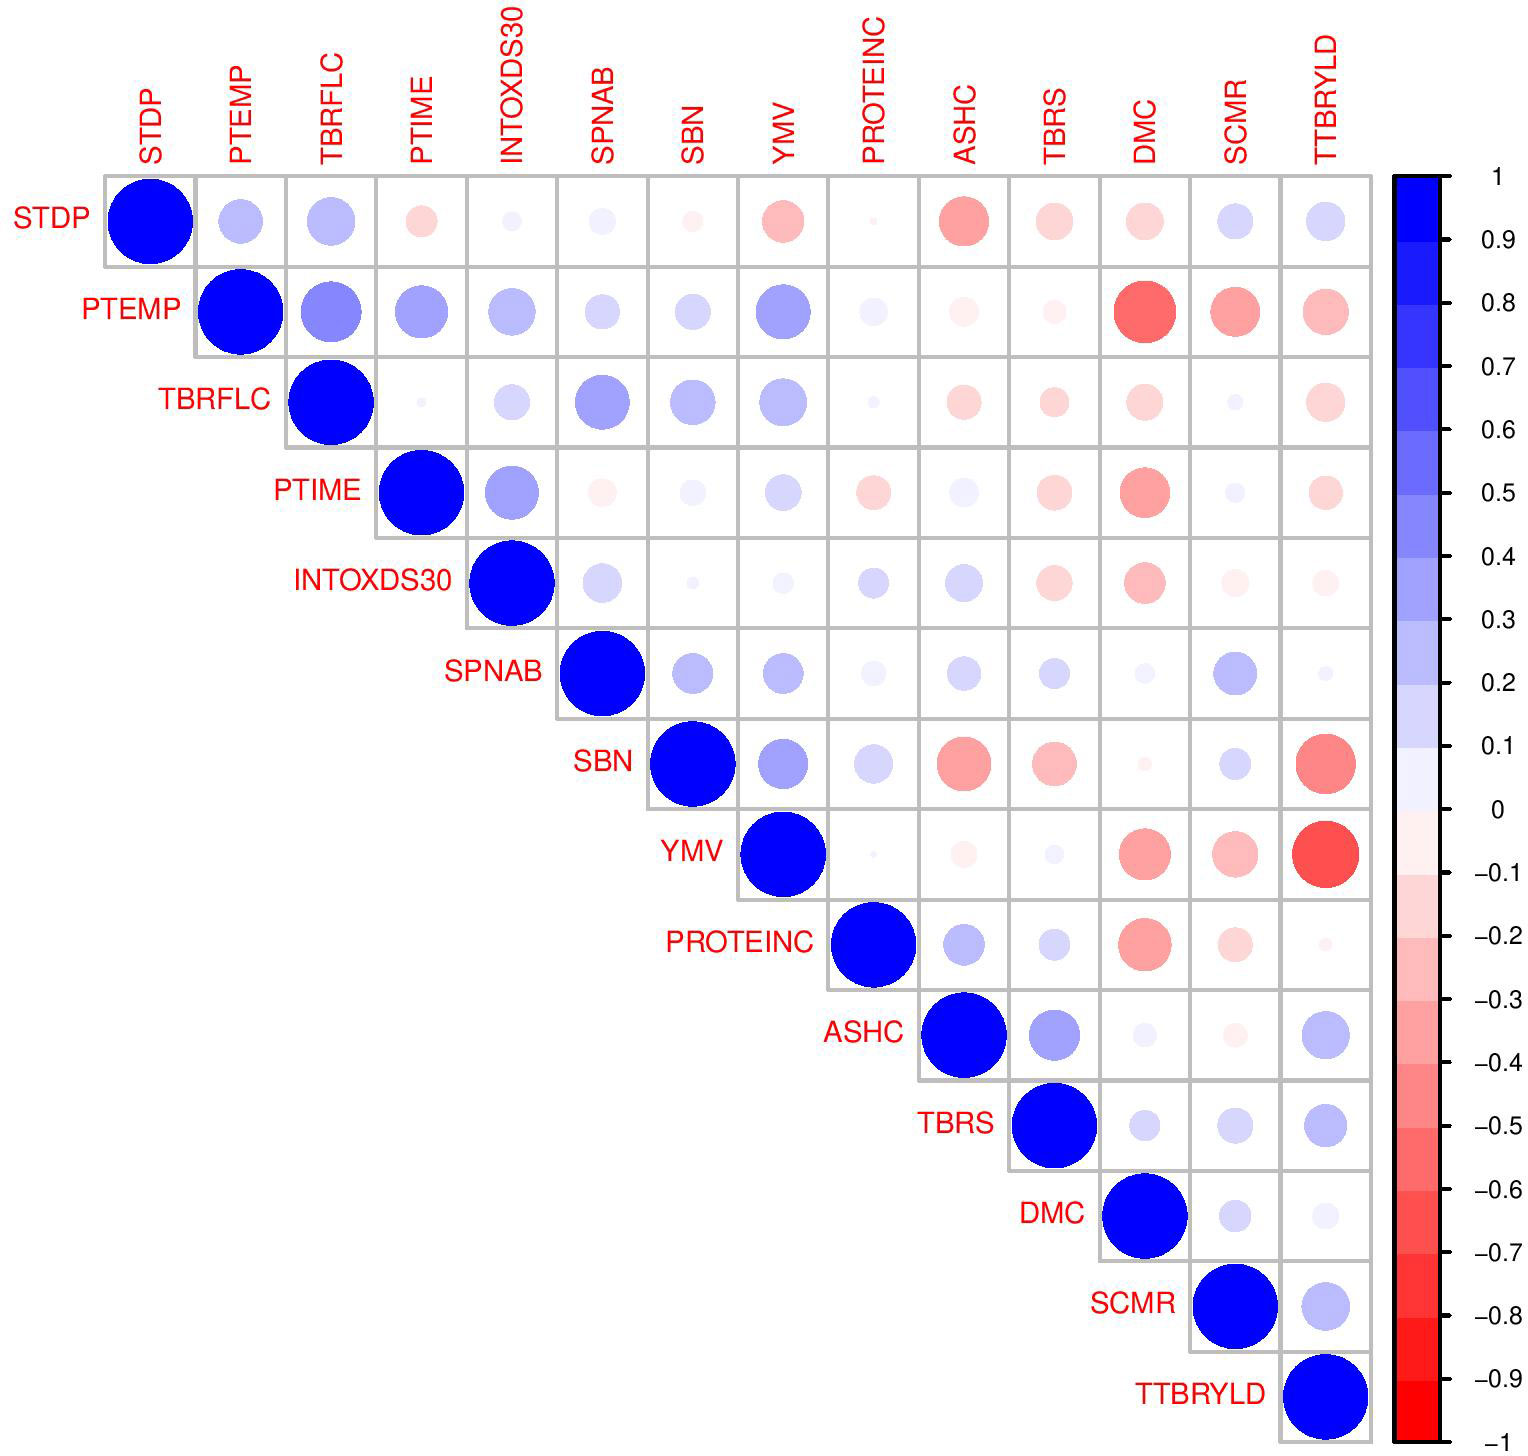
Figure 1 Correlogram of genotypic estimated breeding values based on 14 variables with low VIF selected in 36 genotypes of white yam. Positive and negative correlations are displayed in blue and red, respectively. High color intensity is proportional to high correlation coefficients and significance. Very light and blank colors are insignificant at p-value>0.01.
Plant domestication and agronomic selection for selected desired traits may have an associated effect on other traits. At the start of plant domestication, some of these traits were considered less or of no importance; and as such, were eventually dropped during the long-term selection process. Moreover, few other hidden traits escaped direct selection due to the lack of human understanding of their significance and existence. The demerit of selective breeding is that future generations of selectively bred plants share similar genes leading to reduction of genetic variation in the gene pool. The reduced gene pool makes it more cumbersome to produce new crop varieties in the future. Some of the merits of selective breeding include production of high yielding and better-quality food crops. Moreover, with the advent of new genetics and -omics technologies, hidden traits have been identified and characterized in wild and domesticated plant populations (Fernández-Marín et al., 2014; Luna-Ruiz et al., 2018; Singh et al., 2019; Wang et al., 2020; Pereira et al., 2021). Domestication-related selection is noted to inflict undesirable impacts on several beneficial traits such as plant immunity, nutritional quality and flavour and adaptation.
The narrow-sense heritability estimates exhibited negligible (protein content) to 0.99 (yam mosaic virus) values with five traits showing high , two traits medium and seven traits low (Table 4). Broad sense heritability () estimates based on mean entry ranged between 2.40e-06 and 0.90. Of the 14 key traits, seven had high and five traits had medium values, while two traits (ash content and protein content) had low values. Traits with medium to high H2 and h2 estimates imply their potential usefulness for yam genetic improvement through direct selection. This supports the view that traits with high H2 and h2 estimates are potentially useful for genetic improvement (Piaskowski et al., 2018).
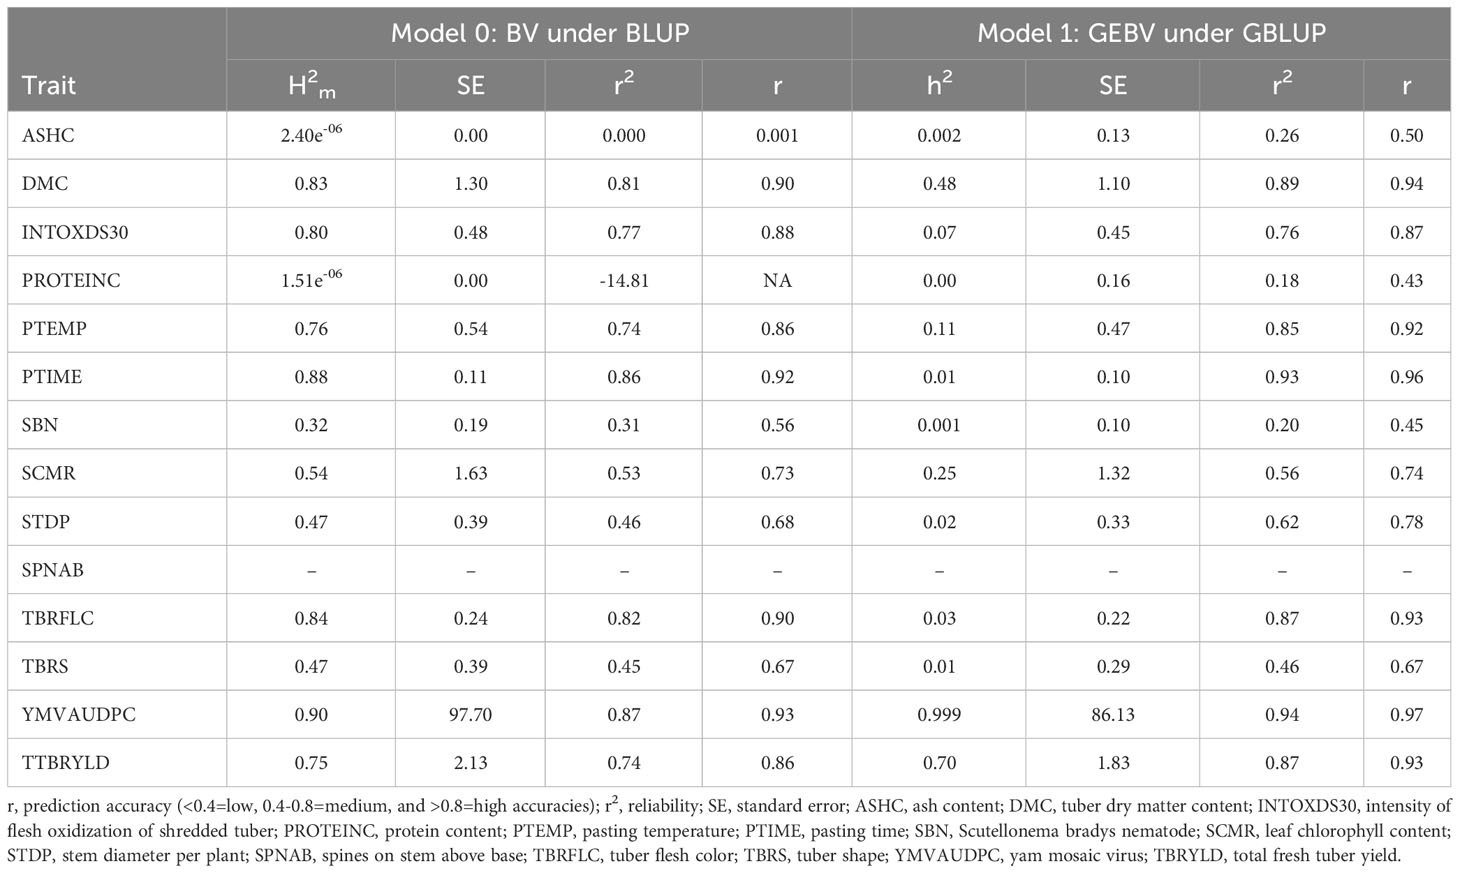
Table 4 Trait heritability, standard error, prediction accuracy and reliability estimates of breeding values (BV) under best linear unbiased prediction (BLUP) and genomic estimated breeding value (GEBV) under the genomic best linear unbiased prediction (GBLUP).
The breeding values of the 14 key traits significantly varied among the 36 yam breeding lines studied (Tables 3, 4). The results indicated genetic variations among the lines in disease response, growth, yield and quality traits that could enhance breeding efficiency by selecting parents with desired complementary traits and good combining ability in generating new, improved breeding populations. High tuber yield and quality attributes in some genotypes indicate their suitability for selection for yam population improvement targeted at food and industrial applications (Jansson et al., 2009).
The fresh tuber yield significantly ranged from 5.1–24.1 t ha-1. The highest fresh tuber yields >20 t ha-1 were recorded for Nndu, TDr9501932, TDr8902475 and TDr08-21-2 and the lowest 5.1 t ha-1 was for TDr04-219. The dry matter content significantly ranged from 26.6–39.4% with the highest and lowest values from TDr8902665 and Agbanwobe, respectively. These results are consistent with Frossard et al. (2017), who noted that yams’ fresh and dry tuber yields vary with genotypes, species, and environment. Fresh tuber yield potential of 40 t ha−1 and 50 t ha−1 were reported for D. rotundata and D. alata, respectively (Diby et al., 2011; Bassey and Akpan, 2015). The dry matter content of yam tubers ranges from 7 – 40% (Eka, 1985). The area under disease progress curve for yam mosaic virus (AUDPCYMV) significantly ranged from 466.2–1665.4, with the highest record for TDr0000362 and the lowest for TDr8902475. These results agree with earlier findings that depicted differential genotypic response to yam mosaic virus using the area under disease progress curve technique (Asfaw et al., 2021; Norman et al., 2021).
The ash content ranged from 2.1–4.1%. The highest ash content was recorded for TDr9518544 and the lowest for Pouna. The ash content of a food sample reveals the mineral elements present in the food. The ash content is also known as the composition of inorganic constituents after organic materials (fats, proteins and carbohydrates) and moisture have been removed by incineration. Minerals are a group of essential nutrients that serve a variety of important metabolic functions and are parts of molecules such as haemoglobin, adenosine triphosphate (ATP) and deoxyribonucleic acid (DNA). The protein content significantly varied among breeding lines with values ranging from 2.8–5.6%. The highest protein content was observed for TDr08-21-3 and the lowest was observed for Alumaco.
Peak time and pasting temperature significantly differed among the yam breeding lines. The pasting time ranged from 4.9–6.2 min, with the highest peak time observed for TDr9700917 and the lowest for TDr08-21-3, TDr9501932, TDr9519177, TDr9700793, TDr9902562, TDr9902626, Pampars and Yangbedu. The pasting temperature ranged from 80.0–84.8°C, with the highest pasting temperature observed for TDr06-15 and the lowest was observed for TDr8902475 and TDr9518988. The significant variation in pasting properties of yam starches and the other traits studied indicates the uniqueness of the parental genotypes utilized in this study. The pasting behavior of the breeding lines is similar to the intermediate pasting temperature of 83°C noted in starches from D. alata and D. cayenensis-rotundata complex, but lower than those observed in D. dumetorum (87°C) and higher than D. esculenta starch (78.7°C) (Amani et al., 2005). Genotypes with high pasting temperature indicate that the starch exhibits restriction to swelling (Kaur and Singh, 2005), while those with reduced peak time and pasting temperatures imply reduced energy requirements. Genotypes with lower pasting temperature indicates they exhibit a higher gelatinisation temperature, a longer cooking time, lower energy requirement, and lower energy cost. These findings are supported by the view that genotypes with lower pasting temperatures exhibit a lower gelatinisation temperature and a shorter cooking time (Otegbayo et al., 2006). Accordingly, D. rotundata varieties with low pasting temperature, high peak viscosities, holding strength, breakdown, final viscosities and setback exhibited pounded yam with good textural qualities, moderate softness, springiness, cohesiveness and smoothness (Otegbayo et al., 2006). The starch pasting temperatures are higher than the pasting temperature of 65.2°C reported for potato (Pérez et al., 2011). Pasting and swelling attributes of starch granules have been reportedly inhibited by the amounts of amylose and lipids, whereas both properties are enhanced by the quantum of amylopectin (Falade and Okafor, 2013). Other factors noted to inhibit pasting properties include plant source, starch content, interaction among attributes and testing conditions (Liu et al., 2006). Thus, in the present study, the variations in the pasting characteristics indicate further studies required on amylose and amylopectin contents, lipids, interaction among attributes and genotypes. These aspects would form part of future studies.
The prediction accuracies of GEBV under the GBLUP model ranged from 0.43–0.96 at low narrow-sense heritability of < 0.30; from 0.83–0.94 at moderate narrow sense heritability ranging from 0.31–0.59; and from 0.84-0.97 at high heritability of > 0.60. The medium to high prediction accuracies indicates medium to high reliability and a medium to low risk of genotypic performance based on GEBV. The prediction accuracy based on BV using BLUP was high for 11 traits (0.82 ≥ r ≤ 0.93) and low for ash content and protein content. The standard error was generally lower for the genetic values of the traits assessed using GBLUP compared to the traditional BLUP that only considered phenotypic records. The breeding values of key traits measured in the 36 white yam genotypes are presented in Table 3. Heritability estimate has been the most critical factor influencing the prediction accuracy. Accordingly, the high prediction accuracy obtained in this study was due to the high heritability estimates. Wimmer et al. (2013) demonstrated that, for a given number of markers, higher heritability estimates, and a larger training population increase the prediction accuracy of marker effects. The determination of marker effects with improved accuracy produced higher prediction accuracy for the progeny mean (Yao et al., 2018). Our findings also agree with the suggestion that the marker-based relationship matrix enhances the capacity to estimate the narrow-sense heritability based on additive genetic effects (Lee et al., 2010). The breeding value approach that captures a large proportion of the variance due to additive and non-additive effects often inflates the genetic gain estimates (Hill et al., 2008).
The pairwise relationship of the traits that provided non-redundant information in discriminating the current set of yam breeding lines is shown in Figure 1. The correlations between pairs of the 14 key traits were predominantly weak positive and weak negative. Few cases exhibited moderate positive associations (between tuber flesh colour and pasting temperature; pasting time and pasting temperature; spines on stem above base and tuber flesh colour; yam mosaic virus and pasting temperature); and moderate negative associations (between total tuber yield and yam mosaic virus; and between dry matter content and pasting temperature). These findings agree with the view that traits with small and non-significant multicollinearity exhibit low correlation. The correlation coefficients were interpreted based on the standard guideline by Ratner (2009) and depicted by the colour intensity in the correlogram. The results indicated the differential magnitude of correlation coefficients between different pairs of key traits. Findings also suggest that where significant associations with more than one trait domain exists, a pleiotropic situation occurs. The implication of pleiotropy is that a single gene affects several characteristics. This supports the view of Solovief et al. (2013), who defined pleiotropy as the presence of statistically significant associations with more than one trait domain, as traits within a domain tend to show stronger phenotypic correlations than those between domains. Watanabe et al. (2019) found that locus pleiotropy is widespread (90%), whereas those at the level of genes (63%) and SNPs (31%) are less abundant, suggesting that a gene can be involved in multiple traits but how that gene is affected by the causal SNPs may differ across traits. Accordingly, the SNPs and genes associated with multiple trait domains are more likely to be involved in general biological functions (Watanabe et al., 2019). Pleiotropy could be caused by gene mutation with both advantages and drawbacks in the long term. The beneficial effect of pleiotropy involving the ability to produce multiple phenotypic effects from a single gene is useful for adaptation and evolution. One of the drawbacks of pleiotropy is that a single gene mutation that causes pleiotropy can lead to negative effects on other traits that are not directly related to the original trait due to multiple functions of the gene that are not always beneficial to the plants.
The genotype-by-trait analysis revealed the associations among the 14 key traits and the genotypes (Figure 2). The first and second principal components (PC1 and PC2) explained 34.5% of the variation. Some of the breeding lines with superior inherent component traits were TDr8902475, TDr0000362, TDr08−21−2, TDr9518544 and Agbanwobe. Genotype TDr8902475 exhibited the lowest value for YMVAUDPC, no spines on stem above base, no oxidization of shredded portion of tuber, with the highest value in leaf chlorophyll content, dry matter content, fresh tuber yield and tuber flesh colour. TDr0000362 had the highest value in YMVAUDPC. TDr08−21−2 had no oxidization of shredded portion of tuber, no spines on stem above base, with the highest values for fresh tuber yield. TDr9518544 had no spines on stem above base, highest ash content and recorded with the highest values for protein content. Agbanwobe had the highest value in protein content. Genotypes TDr9700793, TDr9519177, TDr9519156, TDr9501932, TDr9518544, Nndu and TDr08−21−2 were associated with fresh tuber yield, tuber shape, and ash content; nine genotypes (TDr9600629, TDr08−21−3, TDr8902677, TDr9519158, TDr9700917, TDr9902789, TDr06−15, Ehobia and Agbanwobe) were associated with quality attributes (protein content, pasting time, the intensity of flesh oxidization of shredded tuber), and yam mosaic virus. TDr8902607, TDr9700632, TDr9700205, TDr9902626, Yangbedu, Ufenyi, TDr04−219, and TDr0000362 were associated with tuber flesh colour, Scutellonema bradys nematode, spines on stem above the base and pasting temperature, while the remaining genotypes were associated with dry matter content, leaf chlorophyll content and stem diameter. The GT biplots revealed best-performing clones that were associated with the measured traits (Figure 2). Our results suggest the relevance of assessing multiple traits in yam breeding trials to ensure that the selected genotype(s) have acceptable performance and possess desirable traits that meet the demands of the producers, processors and consumers. These findings concur with the suggestion that white yam clones should be selected based on desired high fresh tuber yield, higher tuber dry matter content, and field tolerance to YMV (Darkwa et al., 2020a). Our findings are also supported by the view that GT biplot provides vital information that could be useful for parental selection aimed at improving key traits, as reported by Yan and Frégeau-Reid (2008) and Norman et al. (2021). Thus, the genotypes that exhibited good attributes would be useful as parents in a hybridization program aimed at population improvement for high fresh tuber yields, tuber dry matter content, resistance to YMV and other key complementary traits.
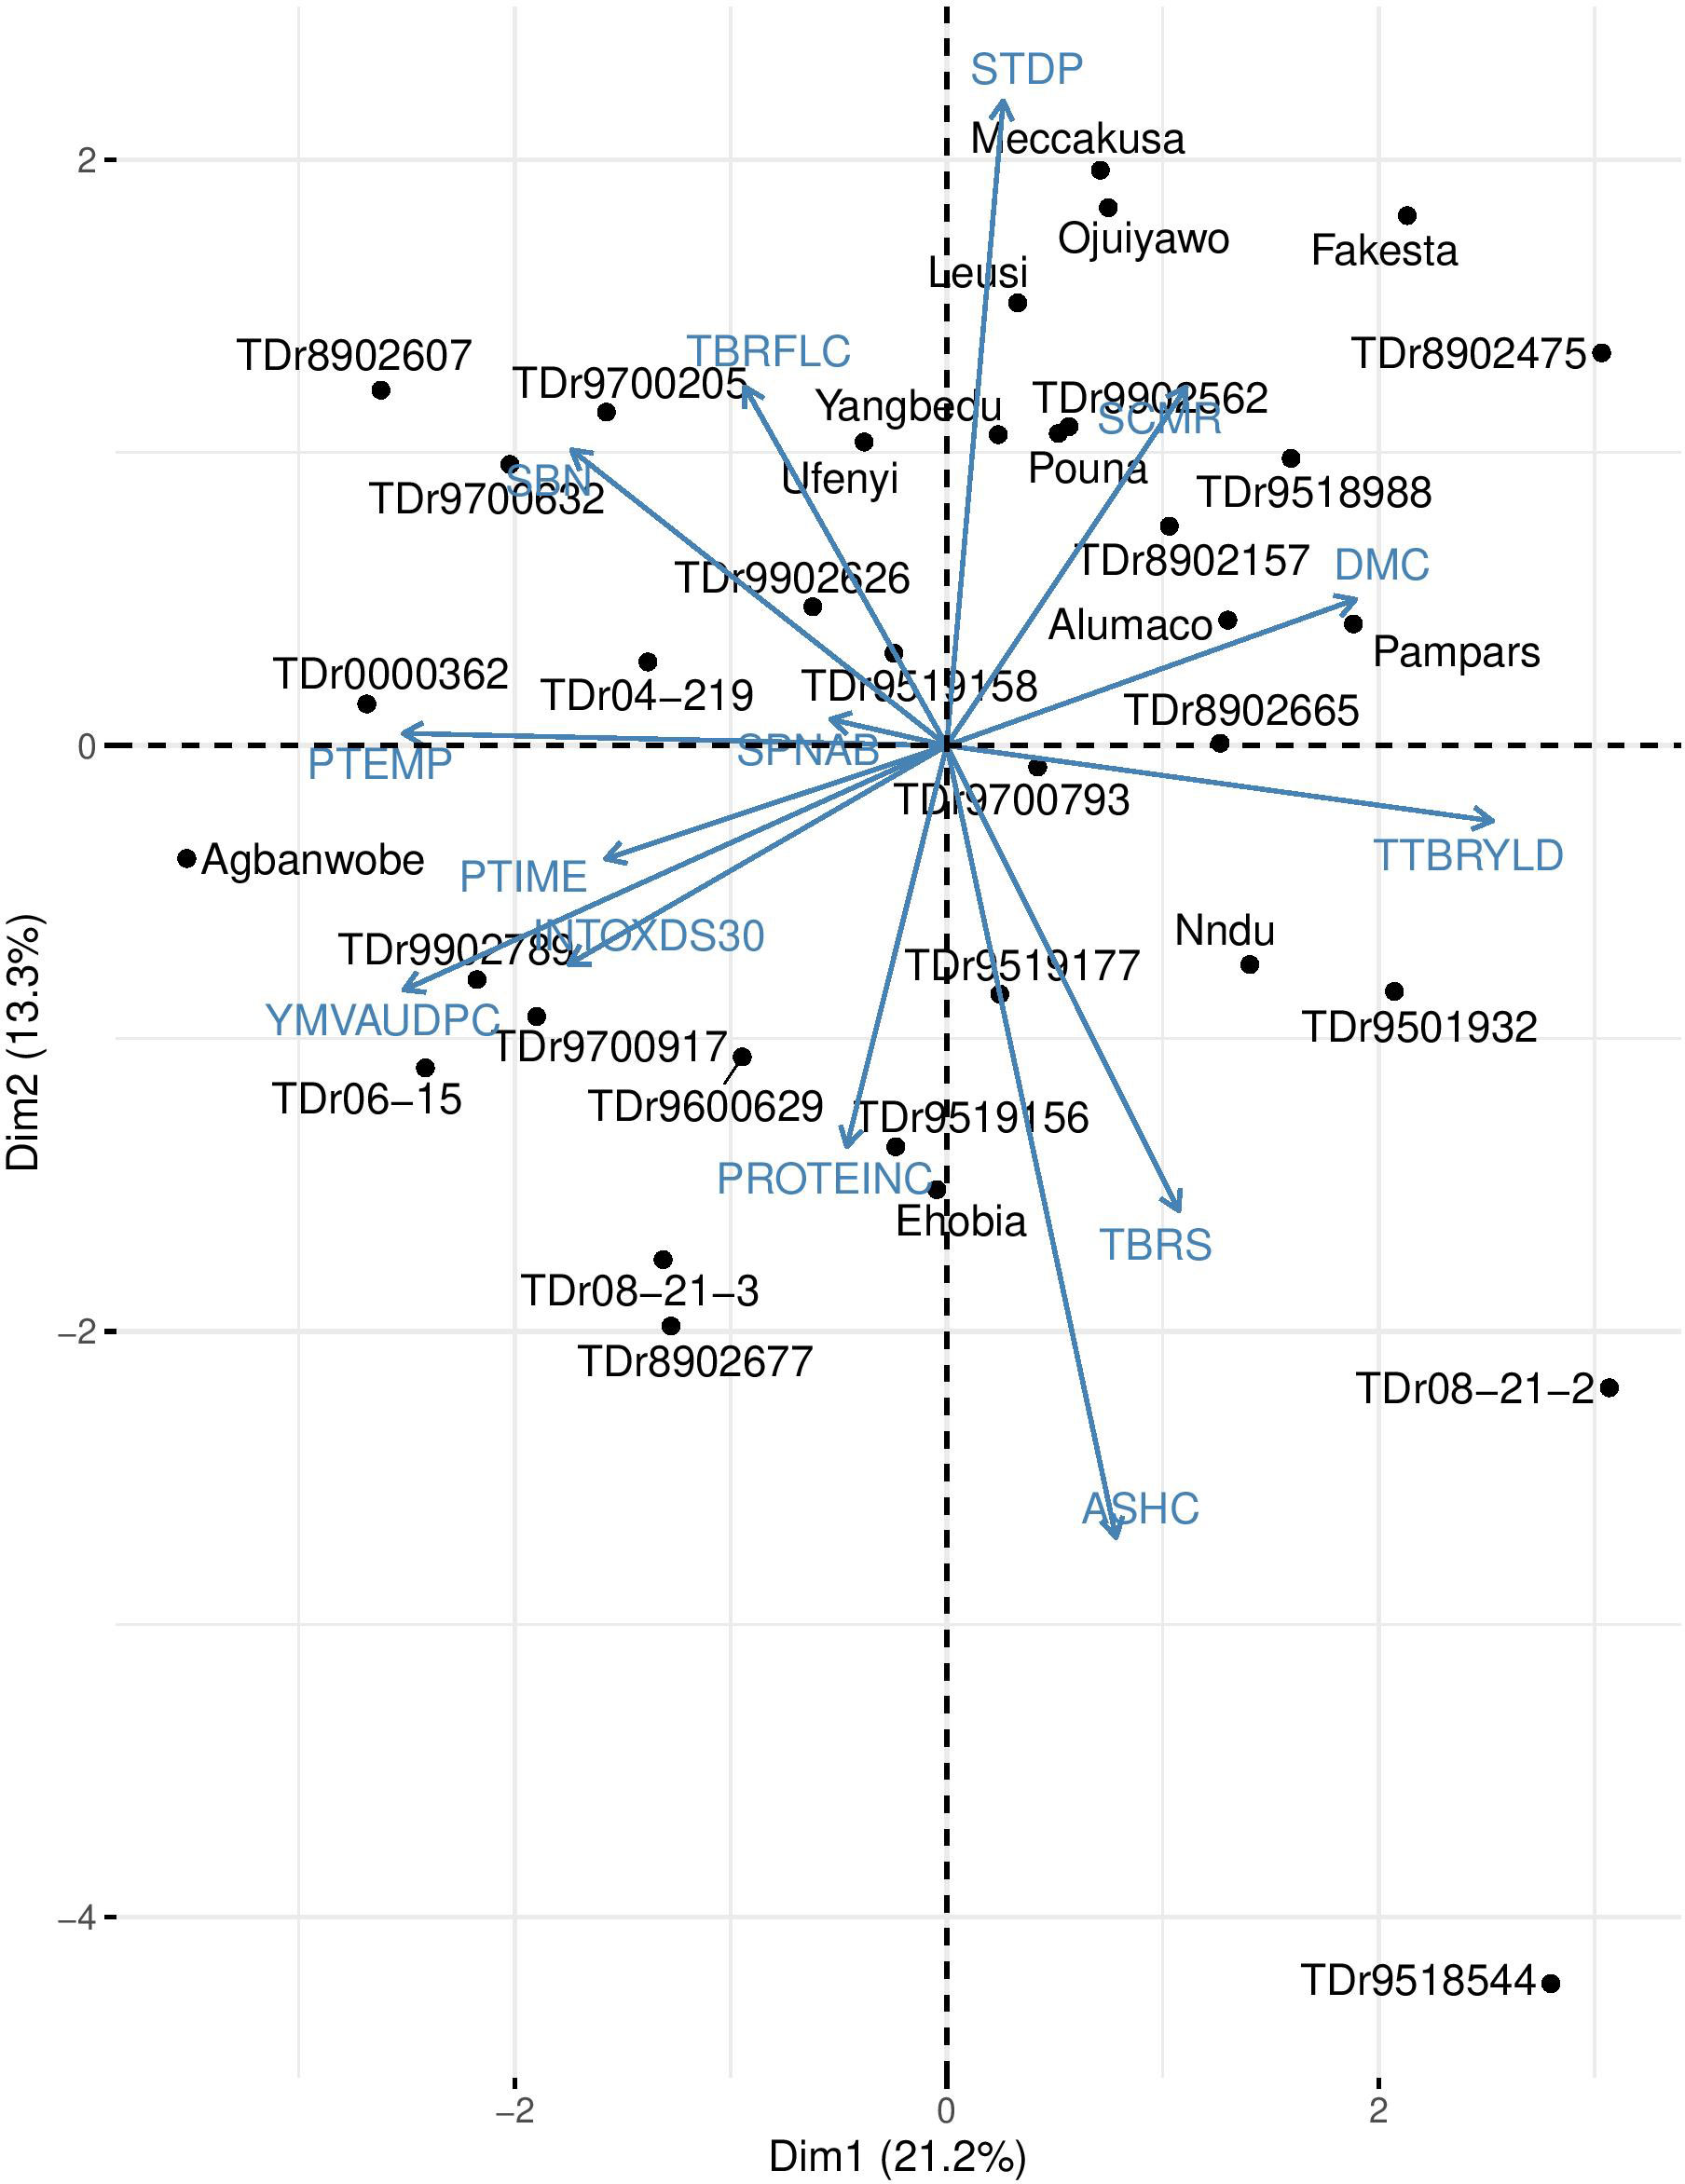
Figure 2 Genotype by trait biplot of 36 clones of white Guinea yams grown at Ibadan, Nigeria.
The study established that yam breeding lines possessed functional variability and complementary traits values for yam population improvement and selection for short release program. Breeders could exploit the useful variability in molecular and phenotypic trait values in selecting a suitable breeding strategy and elite parents for the genetic improvement of the crop. Complementation of estimated breeding values with genomic estimated breeding values revealed higher prediction accuracy and genetic values of breeding lines’ profiled white yam traits. The information from our study could be useful in designing future marker-based breeding as well as genetic conservation of the crop. The long-term effects of plant domestication, pleiotropy and selective breeding for desired agronomic traits of yam forms part of future work on the crop.
The original contributions presented in the study are included in the article/Supplementary Material. Further inquiries can be directed to the corresponding author.
PN: Conceptualization, Formal Analysis, Investigation, Methodology, Project administration, Validation, Visualization, Writing – original draft, Writing – review & editing. AA: Conceptualization, Formal Analysis, Funding acquisition, Investigation, Methodology, Project administration, Resources, Supervision, Validation, Visualization, Writing – review & editing. PA: Data curation, Formal Analysis, Software, Validation, Visualization, Writing – review & editing. AD: Supervision, Writing – review & editing. PT: Investigation, Methodology, Supervision, Writing – review & editing. ED: Investigation, Supervision, Writing – review & editing. RA: Funding acquisition, Project administration, Resources, Visualization, Writing – review & editing.
The author(s) declare financial support was received for the research, authorship, and/or publication of this article. This research was supported by Bill and Melinda Gates Foundation (BMGF) through the AfricaYam project (OPP1052998) to IITA and the International Development Research Centre (IDRC) under the IDRC/CORAF-WECARD/IITA sub-grant agreement for developing capacity for Agricultural Research in sub-Saharan Africa (PJ-2126) to PN (Ph.D. student) at the West African Centre for Crop Improvement (WACCI), University of Ghana.
The authors are grateful to the yam breeding team, IITA, Ibadan, Nigeria, for the technical support.
The authors declare that the research was conducted in the absence of any commercial or financial relationships that could be construed as a potential conflict of interest.
The author(s) ED, AD, PA declared that they were an editorial board member of Frontiers, at the time of submission. This had no impact on the peer review process and the final decision.
All claims expressed in this article are solely those of the authors and do not necessarily represent those of their affiliated organizations, or those of the publisher, the editors and the reviewers. Any product that may be evaluated in this article, or claim that may be made by its manufacturer, is not guaranteed or endorsed by the publisher.
The Supplementary Material for this article can be found online at: https://www.frontiersin.org/articles/10.3389/fhort.2023.1290521/full#supplementary-material
Supplementary Figure 1 | Correlogram of genotypic estimated breeding values based on 32 variables measured in 36 genotypes of white yam. Positive and negative correlations are displayed in blue and red, respectively. High colour intensity is proportional to high correlation coefficients and significance. Very light and blank colours are insignificant at p-value>0.01.
Agre P., Asibe F., Darkwa K., Edemodu A., Bauchete G., Asiedu R., et al. (2019). Phenotypic and molecular assessment of genetic structure and diversity in a panel of winged yam (Dioscorea alata) clones and cultivars. Sci. Rep. 9, 18221. doi: 10.1038/s41598-019-54761-3
Aighewi B., Maroya N., Asiedu R., Aihebhoria D., Balogun M., Mignouna D. (2020). Seed yam production from whole tubers versus minisetts. J Crop Improv 34, 858–874. doi: 10.1080/15427528.2020.1779157
Aljanabi S. M., Martinez I. (1997). Universal and rapid salt-extraction of high-quality genomic DNA for PCR-based techniques. Nucleic Acids Res. 25 (1997), 4692–4693. doi: 10.1093/nar/25.22.4692
Amani N’G.G., Dufour D., Mestres C., Bule´on A., Kamenan A., Colonna P. (2005). Variability in starch physicochemical and functional properties of yam (Dioscorea sp.) cultivated in Ivory Coast. J. Sci. Food Agric. 84, 2085–2096. doi: 10.1002/jsfa.2160
AOAC Association of Official Analytical Chemists (1990). Official Methods of Analysis. 15th Edition (Washington DC, USA: Association of Official Analytical Chemists).
Arnau G., Bhattacharjee R., Shela M. N., Chair H., Malapa R., Lebot V., et al. (2017). Understanding the genetic diversity and population structure of yam (Dioscorea alata L.) using microsatellite markers. PloS One 12 (3), e0174150. doi: 10.1371/journal.pone.0174150
Asaoka M., Blanshard J. M. V., Richard J. E. (1992). Effects of cultivar and growth season on the gelatinization properties of cassava (Manihot esculenta) starch. J. Sci. Food. Agric. 59, 53–58. doi: 10.1002/jsfa.2740590108
Asfaw A. (Ed.) (2016). Standard operating protocol for yam variety performance evaluation trial (Ibadan, Nigeria: IITA), 27. p.
Asfaw A., Aderonmu D. S., Darkwa K., De Koeyer D., Agre P., Ayodeji Abe A., et al. (2021). Genetic parameters, prediction, and selection in a white Guinea yam early-generation breeding population using pedigree information. Crop Sci. 61, 1038–1051. doi: 10.1002/csc2.20382
Asiedu R., Sartie A. (2010). Crops that feed the World 1. Yams. Yams for income and food security. Food Secur. 2, 305–315. doi: 10.1007/s12571-010-0085-0
Baldwin S. J., Dodds K. G., Auvray B., Genet R. A., Macknight R. C., Jacobs J. M. E. (2011). Association mapping of cold-induced sweetening in potato using historical phenotypic data. Ann. Appl. Biol. 158, 248–256. doi: 10.1111/j.1744-7348.2011.00459.x
Bassey E. E., Akpan U. S. (2015). Evaluation of Guinea white yam (Dioscorea rotundata Poir) for yield and yield components in Nigeria. Am. J. Exp. Agric. 8, 216–223. doi: 10.9734/AJEA/2015/16496
Bink M. P., Uimari P., Sillanpaa J., Janss G., Jansen C. (2002). Multiple QTL mapping in related plant populations via a pedigree-analysis approach. Theor. Appl. Genet. 104, 751–762. doi: 10.1007/s00122-001-0796-x
Bradbury P. J., Zhang Z., Kroon D. E., Casstevens T. M., Ramdoss Y., Buckler E. S. (2007). TASSEL: software for association mapping of complex traits in diverse samples. Bioinformatics 23, 2633–2635. doi: 10.1093/bioinformatics/btm308
Browning S. R., Browning B. L. (2007). Rapid and accurate haplotype phasing and missing data inference for whole genome association studies by use of localized haplotype clustering. Am. J. Hum. Genet. 81, 1084–1097. doi: 10.1086/521987
Coursey D. G. (1976). “The origin and domestication of yams in Africa,” in Origins of African Plant Domestication. Eds. Harlan J. R., De Wit J. M. J., Stemler A. B. L. (The Hague, Paris: Mouton Publ.), 383–408.
Darkwa K., Olasanmi B., Asiedu R., Asfaw A. (2020a). Review of empirical and emerging methods and tools for yam (Dioscorea spp.) improvement: status and prospects. Plant Breed. 00, 1–24. doi: 10.1111/PBR.12783
Darkwa K., Agre P., Olasanmi B., Iseki K., Matsumoto R., Powell A., et al. (2020b). Comparative assessment of genetic diversity matrices and clustering methods in white Guinea yam (Dioscorea rotundata) based on morphological and molecular markers. Sci. Rep. 10, 13191. doi: 10.1038/s41598-020-69925-9
Dellaporta S. L., Wood J., Hicks J. B. (1983). A plant DNA mini preparation Version II. Plant Mol. Biol. Rep. 1, 19–21. doi: 10.1007/BF02712670
De Mendiburu F. (2019). Agricolae-Statistical Procedure for Agricultural Research. R-package version 1.3.0.
Diby L. N., Hgaza V. K., Tié T. B., Assa A., Carsky R., Girardin O., et al. (2011). How does soil fertility affect yam growth? Scand. Section B 61 (5), 448–457. doi: 10.1080/09064710.2010.505578
Eka O. U. (1985). “The chemical composition of yam,” in Advances in Yam Research. Ed. Osuji G.. (Enugu, Nigeria: Biochemical Society of Nigeria) 1, 51–72.
Elshire R. J., Glaubitz J. C., Sun Q., Poland J. A., Kawamoto K., Buckler E. S., et al. (2011). A robust, simple genotyping-by-sequencing (GBS) approach for high diversity species. PloS One 6 (5), e19379. doi: 10.1371/journal.pone.0019379
Endelman J. B. (2011). Ridge regression and other kernels for genomic selection with R Package rrBLUP. Plant Genome 4, 250–255. doi: 10.3835/plantgenome2011.08.0024
Falade K. O., Okafor C. A. (2013). Physicochemical properties of five cocoyam (Colocasia esculenta and Xanthosoma sagittifolium) starches. Food Hydroc. 30, 173–181. doi: 10.1016/j.foodhyd.2012.05.006
FAOSTAT. (2019). Food and Agricultural Organization of the United Nations (Rome, Italy). Available at: www.fao.org/statistics/en.
Fernández-Marín B., Milla R., Martín-Robles N., Arc E., Kranner I., Becerril J. M., et al. (2014). Side-effects of domestication: cultivated legume seeds contain similar tocopherols and fatty acids but less carotenoids than their wild counterparts. BMC Plant Biol. 14, 385. doi: 10.1186/s12870-014-0385-1
Forbes G., Pérez W., Andrade-Piedra J. L. (2014). Field assessment of resistance in potato to Phytophthora infestans: International cooperators guide (Lima (Peru: International Potato Center (CIP), 35, ISBN: ISSBN 978-92-9060-440-2. p. doi: 10.4160/9789290604402
Frossard E., Aighewi B. A., Aké S., Barjolle D., Baumann P., Bernet T., et al. (2017). The challenge of improving soil fertility in yam cropping systems of West Africa. Front. Plant Sci. 8 (1953). doi: 10.3389/fpls.2017
Girma G., Hyma K. E., Asiedu R., Mitchell S. E., Gedil M., Spillane C. (2014). Next-generation sequencing based genotyping, cytometry and phenotyping for understanding diversity and evolution of Guinea yams. Theor. Appl. Genet. 127, 1783–1794. doi: 10.1007/s00122-014-2339-2
Gjedrem T. (2010). The first family–based breeding program in aquaculture. Rev. Aquac. 2, 2–15. doi: 10.1111/j.1753-5131.2010.01011.x
Hebbali A. (2020). olsrr: Tools for Building OLS Regression Models. R package version 0.5.3. Available at: https://CRAN.R-project.org/package=olsrr.
Hair J. F. Jr., Anderson R. E., Tatham R. L., Black W. C. (1995). Multivariate data analysis (3rd ed). (New York: Macmillan), p. 761.
Hill W., Goddard M., Visscher P. (2008). Data and theory point to mainly additive genetic variance for complex traits. PloS Genet. 4 (2), e1000008. doi: 10.1371/journal.pgen.1000008
ISRIC/FAO International Soil Reference and Information Centre and the Food and Agriculture Organization (2002). “Procedures for soil analysis,” in Technical Paper 9, 6th Edition (Wageningen, The Netherlands: FAO), 120. p.
Jansson C., Westerbergh A., Zhang J., Hu X., Sun C. (2009). Cassava, a potential biofuel crop in (the) People’s Republic of China. Appl. Energy 86 (S1), S95–S99. doi: 10.1016/j.apenergy.2009.05.011
Kaur M., Singh N. (2005). Studies on functional, thermal and pasting properties of flours from different chickpea (Cicer arietinum L.) cultivars. Food Chem. 91, 403–411. doi: 10.1016/j.foodchem.2004.06.015
Kim S. (2015). ppcor: An R package for a fast calculation to semi-partial correlation coefficients. Com. Stat. Appl. Methods 22 (6), 665–674.
Komolafe A. O., Akinoso R. (2005). Design, fabrication and testing of a 50kg yam Parboiler. Nigerian Food J. 23, 225–230. doi: 10.4314/nifoj.v23i1.33628
Krochmal A., Kilbride B. (1966). An inexpensive laboratory method for cassava starch extraction. J. Agric. Univ. Puerto Rico 50, 252–253. doi: 10.46429/jaupr.v50i3.3464
Kuznetsova A., Brockhoff P. B., Christensen R. H. B. (2017). lmerTest package: tests in linear mixed effects models. J. Stat. Soft. 82, 1–26. doi: 10.18637/jss.v082.i13
Lee S. H., Goddard M. E., Visscher P. M., van der Werf J. H. J. (2010). Using the realized relationship matrix to disentangle confounding factors for the estimation of genetic variance components of complex traits. Genet. Sel. Evol. 42, 22. doi: 10.1186/1297-9686-42-22
Liu Q., Donner E., Yin Y., Huang R. L., Fan M. Z. (2006). The physicochemical properties and in vitro digestibility of selected cereals, tubers and legumes grown in China. Food Chem. 99, 470–477. doi: 10.1016/j.foodchem.2005.08.008
Luna-Ruiz J. D., Nabhan G. P., Aguilar-Melendez A. (2018). Shifts in plant chemical defenses of Chile pepper (Capsicum annuum L.) due to domestication in Mesoamerica. Front. Ecol. Evol. 6, 48. doi: 10.3389/fevo.2018.00048
Nemorin A., David J., Maledon E., Nudol E., Dalon J., Arnau G. (2013). Microsatellite and flow cytometry analysis to help understand the origin of Dioscorea alata polyploids. Ann. Bot. 112, 811–819. doi: 10.1093/aob/mct145
Newport Scientific. (1998). Applications Manual for the Rapid ViscoTM Analyzer Using Thermocline for Windows (Warriewood, Australia: Newport Scientific Pty Ltd.), 2–26.
Norman P. E., Asfaw A., Tongoona P. B., Danquah A., Danquah E. Y., Koeyer D. D., et al. (2018). Can parentage analysis facilitate breeding activities in root and tuber crops? Agric. J. 8, 1–24. doi: 10.3390/agriculture8070095
Norman P. E., Agre P. A., Danquah A., Tongoona P. B., Danquah E. Y., De Koeyer D., et al. (2020). Paternity assignment in white Guinea yam (Dioscorea rotundata) half-sib progenies from polycross mating design using SNP markers. Plants 9, 527–540. doi: 10.3390/plants9040527
Norman P. E., Tongoona P. B., Danquah A., Danquah E. Y., Asiedu R., Agbona A., et al. (2021). Genetic parameter estimation and selection in advanced breeding population of white Guinea yam. J. Crop Improv. 35 (6), 790–815. doi: 10.1080/15427528.2021.1881012
Obidiegwu J. E., Akpabio E. M. (2017). The geography of yam cultivation in southern Nigeria: Exploring its social meanings and cultural functions. J. Ethnic Foods 4, 28–35. doi: 10.1016/J.JEF.2017.02.004
Olivoto T., Lúcio A. D. (2020). metan: an R package for multi-environment trial analysis. Methods Ecol. Evol. 11, 783–789. doi: 10.1111/2041-210X.13384
Otegbayo B., Aina J., Asiedu R., Mpoko Bokanga M. (2006). Pasting characteristics of fresh yams (Dioscorea spp.) as indicators of textural quality in a major food product – pounded yam. Food Chem. 99, 663–669. doi: 10.1016/j.foodchem.2005.08.041
Pereira L., Zhang L., Sapkota M., Ramos A., Razifard H., Caicedo A. L., et al. (2021). Unraveling the genetics of tomato fruit weight during crop domestication and diversification. Theo. Appl. Genet. 134, 3363–3378. doi: 10.1007/s00122-021-03902-2
Peres-Neto P. R., Jackson D. A., Somers K. M. (2003). Giving meaningful interpretation to ordination axes: assessing loading significance in principal component analysis. Ecology 84 (9), 2347–2363.
Pérez E., Gibert O., Rolland-Sabaté A., Jiménez Y., Sánchez T., Giraldo A., et al. (2011). Physicochemical, functional, and macromolecular properties of waxy yam starches discovered from "Mapuey" (Dioscorea trifida) genotypes in the Venezuelan Amazon. J. Agric. Food Chem. 59, 263–273. doi: 10.1021/jf100418r
Piaskowski J., Hardner C., Cai L., Zhao Y., Iezzoni A., Peace C. (2018). Genomic heritability estimates in sweet cherry reveal non-additive genetic variance is relevant for industry-prioritized traits. BMC Genet. 19 (1), 23. doi: 10.1186/s12863-018-0609-8
Price E. J., Bhattacharjee R., Lopez-Montes A., Fraser P. D. (2017). Metabolite profiling of yam (Dioscorea spp.) accessions for use in crop improvement programmes. Metabolomics 13, 144. doi: 10.1007/s11306-017-1279-7
Pruvost N. B. M., Hoffmann A., Reyer H. U. (2013). Gamete production patterns, ploidy, and population genetics reveal evolutionary significant units in hybrid water frogs (Pelophylax exculentus). Ecol. Evol. 3, 2933–2948. doi: 10.1111/mec.13325
Purcell S., Neale B., Todd-Brown K., Thomas L., Ferreira M. A. R., Bender D., et al. (2007). PLINK: A tool set for whole-genome association and population-based linkage analyses. Am. J. Hum. Genet. 81, 559–575. doi: 10.1086/519795
Ratner B. (2009). The correlation coefficient: Its values range between +1/–1, or do they?” J. Targeting Measurement Anal. Market. 17 (2), 139–142. doi: 10.1057/jt.2009.5
R Core Team. (2019). R: A language and environment for statistical computing (Vienna, AU: R Foundation for Statistical Computing).
Robinson H. F., Comstock R. E., Harvey P. H. (1949). Estimates of heritability and the degree of dominance in corn. Agron. J. 41, 353–359. doi: 10.2134/agronj1949.00021962004100080005x
Shete S., Tiwari H., Elston R. C. (2000). On estimating the heterozygosity and polymorphism information content value. Theor. Popul. Biol. 57, 265–271. doi: 10.1006/tpbi.2000.1452
Singh J., Salvador G. A., Vallejos C. E. (2019). Developmental pleiotropy shaped the roots of the domesticated common bean (Phaseolus vulgaris). Plant Physiol. 180, 1467–1479. doi: 10.1104/pp.18.01509
Solovief N., Cotsapas C., Lee P. H., Purcell S. M., Smoller J. W. (2013). Pleiotropy in complex traits: challenges and strategies. Nat. Rev. Genet. 14, 483–495. doi: 10.1038/nrg3461
Song Y. S., Hepting L., Schweizer G., Hartl L., Wenzel G., Schwarzfischer A. (2005). Mapping of extreme resistance to PVY (Ry (sto)) on chromosome XII using anther-culture-derived primary dihaploid potato lines. Theor. Appl. Genet. 111, 879–887. doi: 10.1007/s00122-005-0010-7
Souza D. C. L. (2015). Molecular techniques for the characterization and conservation of medicinal and aromatic plants: a review. Braz. J. Med. Plants 17, 495–503. doi: 10.1590/1983-084X/13071
Tamiru M., Natsume S., Takagi H., White B., Yaegashi H., Shimizu M., et al. (2017). Genome sequencing of the staple food crop white Guinea yam enables the development of a molecular marker for sex determination. BMC Biol. 15, 86. doi: 10.1186/s12915-017-0419-x
vanRaden P. M. (2008). Efficient methods to compute genomic predictions. J. Dairy Sci. 91, 4414–4423. doi: 10.3168/jds.2007-0980
Wang Z., Hong Y., Zhu G., Li Y., Niu Q., Yao J., et al. (2020). Loss of salt tolerance during tomato domestication conferred by variation in a Na+/K+ transporter. EMBO J. 39, e103256. doi: 10.15252/embj.2019103256
Watanabe K., Stringer S., Frei O., Mirkov M. U., de Leeuw C., Polderman T. J. C., et al. (2019). A global overview of pleiotropy and genetic architecture in complex traits. Nat. Genet., 15. doi: 10.1038/s41588-019-0481-0. p.
Wimmer V., Lehermeier C., Albrecht T., Auinger H. J., Wang Y., Schon C. C. (2013). Genome-wide prediction of traits with different genetic architecture through efficient variable selection. Genetics 195, 573–587. doi: 10.1534/genetics.113.150078
Yan W., Frégeau-Reid J. (2008). Breeding line selection based on multiple traits. Crop Sci. 48 (2), 417–423. doi: 10.2135/cropsci2007.05.0254
Yan W., Kang M. S. (2003). GGE biplot analysis: A graphical tool for breeders, geneticists, and agronomists (Boca Raton, FL: CRC Press), 271. p.
Keywords: heritability, breeding value, prediction accuracy, trait profiling, yams
Citation: Norman PE, Asfaw A, Agre PA, Danquah A, Tongoona PB, Danquah EY and Asiedu R (2023) Molecular and phenotypic profiling of white Guinea yam (Dioscorea rotundata) breeding lines. Front. Hortic. 2:1290521. doi: 10.3389/fhort.2023.1290521
Received: 07 September 2023; Accepted: 16 October 2023;
Published: 01 November 2023.
Edited by:
Nicola Busatto, Fondazione Edmund Mach, ItalyReviewed by:
Hans Adu-Dapaah, Council for Scientific and Industrial Research (CSIR), GhanaCopyright © 2023 Norman, Asfaw, Agre, Danquah, Tongoona, Danquah and Asiedu. This is an open-access article distributed under the terms of the Creative Commons Attribution License (CC BY). The use, distribution or reproduction in other forums is permitted, provided the original author(s) and the copyright owner(s) are credited and that the original publication in this journal is cited, in accordance with accepted academic practice. No use, distribution or reproduction is permitted which does not comply with these terms.
*Correspondence: Prince Emmanuel Norman, bm9ybWFuLnByaW5jZTY0QGdtYWlsLmNvbQ==; cG5vcm1hbkB3YWNjaS51Zy5lZHUuZ2g=
Disclaimer: All claims expressed in this article are solely those of the authors and do not necessarily represent those of their affiliated organizations, or those of the publisher, the editors and the reviewers. Any product that may be evaluated in this article or claim that may be made by its manufacturer is not guaranteed or endorsed by the publisher.
Research integrity at Frontiers
Learn more about the work of our research integrity team to safeguard the quality of each article we publish.