 Rui Miao1*†
 Bing-Jie Zhong1†Xin-Yue Mei2Xin Dong2Yang-Dong Ou3
 Yong Liang4Hao-Yang Yu1Ying Wang1Zi-Han Dong1
- 1Basic Teaching Department, Zhuhai Campus of Zunyi Medical University, Zhu Hai, China
- 2Institute of Systems Engineering, Macau University of Science and Technology, Macau, China
- 3School of Biomedical Engineering, Guangdong Medical University, Dongguan, China
- 4Peng Cheng Laboratory, Shenzhen, China
Motivation: Predicting the response of cell lines to characteristic drugs based on multi-omics gene information has become the core problem of precision oncology. At present, drug response prediction using multi-omics gene data faces the following three main challenges: first, how to design a gene probe feature extraction model with biological interpretation and high performance; second, how to develop multi-omics weighting modules for reasonably fusing genetic data of different lengths and noise conditions; third, how to construct deep learning models that can handle small sample sizes while minimizing the risk of possible overfitting.
Results: We propose an innovative drug response prediction model (NMDP). First, the NMDP model introduces an interpretable semi-supervised weighted SPCA module to solve the feature extraction problem in multi-omics gene data. Next, we construct a multi-omics data fusion framework based on sample similarity networks, bimodal tests, and variance information, which solves the data fusion problem and enables the NMDP model to focus on more relevant genomic data. Finally, we combine a one-dimensional convolution method and Kolmogorov–Arnold networks (KANs) to predict the drug response. We conduct five sets of real data experiments and compare NMDP against seven advanced drug response prediction methods. The results show that NMDP achieves the best performance, with sensitivity and specificity reaching 0.92 and 0.93, respectively—an improvement of 11%–57% compared to other models. Bio-enrichment experiments strongly support the biological interpretation of the NMDP model and its ability to identify potential targets for drug activity prediction.
1 Introduction
Precision oncology aims to leverage genomic information to identify patient groups with similar biological traits, enabling the delivery of the most suitable treatments (Dlamini et al., 2020; Garraway et al., 2013; Hodson, 2020; Prasad, 2016; Prasad et al., 2016). In clinical applications, this approach generally involves choosing targeted therapies based on the individual genomic profiles of patients (Ballester and Carmona, 2021). However, research reveals that only approximately 9% of patients experience effective outcomes from such targeted treatments, which greatly restricts the broad applicability of precision oncology (Barretina et al., 2012a; Rubio-Perez et al., 2015). Moreover, limited drug response prediction models for non-specific therapies mean that many patients miss out on the benefits of precision oncology and may even receive ineffective treatments. Fortunately, data from extensive pharmacogenomic screenings have shown that nearly all cancer cell lines and patient-derived xenografts (PDXs) respond to some form of targeted therapy or non-specific chemotherapy (Barretina et al., 2012b; Gao et al., 2015; Garnett et al., 2012). Thus, a primary challenge now is accurately aligning cancer patients with treatments that match their unique drug response profiles.
Currently, a significant research focus is predicting drug responses in cancer patients using single genomics data (Adam et al., 2020; Dong et al., 2015; Firoozbakht et al., 2022; Sheng et al., 2015). For instance, as demonstrated by Geeleher et al., a ridge regression model that utilizes gene expression data from the Genomics of Drug Sensitivity in Cancer (GDSC) database has shown effective application to clinical trial datasets for drugs including erlotinib, cisplatin, docetaxel, and bortezomib. The study also found that incorporating data from cancer cell lines other than breast cancer can improve the predictive performance of the docetaxel drug response model (Geeleher et al., 2014). Moreover, our preliminary research indicates that combining statistical methods based on individual genomic information from patients with machine learning techniques can construct highly performant drug response prediction models (Miao et al., 2020; Zheng et al., 2024; Sharma et al., 2024).
Recently, the increasing availability of multi-omics datasets for drug response has opened new avenues for machine learning models, enabling a deeper understanding of biological processes. Multi-omics data have shown notable success across various bioinformatics tasks, including survival prediction, cancer subtype classification, and target gene identification (Xu et al., 2024). As deep learning continues to progress rapidly, constructing predictive models that utilize multi-omics data through deep learning techniques becomes a primary research focus. Several multi-omics drug response models have been developed (Ballester et al., 2022; Baptista et al., 2021; Chen and Zhang, 2021; Zhou et al., 2024; Rashid, 2024; Baptista and Ferreira, 2023). For instance, Chiu et al. developed a deep learning model that utilizes autoencoders to combine diverse omics features for drug response prediction (Chiu et al., 2019). Similarly, Hossein et al. proposed a model that employs deep neural network fusion, combining hidden layer representations from different multi-omics networks to synthesize feature information effectively (Sharifi-Noghabi et al., 2019). Peng et al. proposed a two-space graph convolutional neural network (TSGCNN) that combines cell line and drug feature spaces to predict drug responses by leveraging both homogeneous and heterogeneous relationships (Peng et al., 2023). Similarly, Trac et al. proposed a GCN-based drug response prediction model for acute myeloid leukemia (AML), highlighting the versatility of graph-based neural networks in oncology research (Trac et al., 2023). Wang et al. proposed MOICVAE, a deep learning model that integrates multi-omics data using a variational autoencoder to improve drug sensitivity prediction (Wang et al., 2023). Meanwhile, Sharma et al. proposed DeepInsight-3D, architecture to fuse multi-omics data for anticancer drug response prediction, offering an advanced deep learning perspective for modeling complex interactions in diverse biological datasets (Sharma et al., 2023).
Currently, the multi-omics drug response prediction model faces three major challenges. First, genomic data typically involve small sample sizes, which increases the likelihood of overfitting in existing models (Deng et al., 2023). Developing an efficient and biologically interpretable feature selection method to select key genomic data is the first major challenge currently faced (Deng et al., 2023). Second, most genomic datasets for drug response prediction contain multiple independent genomic data types (Munquad et al., 2024). The data lengths and noise levels of these genomic datasets vary significantly, making the rational design of the multi-omics fusion method the second major challenge in constructing high-performance drug response medical models. Third, considering that drug response prediction is a complex biological problem and the dataset has only limited training samples, constructing a sufficiently high-performance prediction model based on a small sample of data remains the third major challenge.
In this study, we introduce an innovative model for predicting drug response (NMDP, Figure 1). The NMDP model is composed of four main modules. 1) Key genome selection module: we propose an interpretable, semi-supervised weighted sparse PCA to identify essential biological features. 2) Similarity network construction module: this module addresses the challenge of aligning data across different omics. 3) Data fusion module: we introduce a weighted similarity network fusion approach, incorporating the dip test method and variance information. 4) Drug response prediction module: we integrate one-dimensional convolutional neural networks (CNNs) and the Kolmogorov–Arnold network (KAN) method.
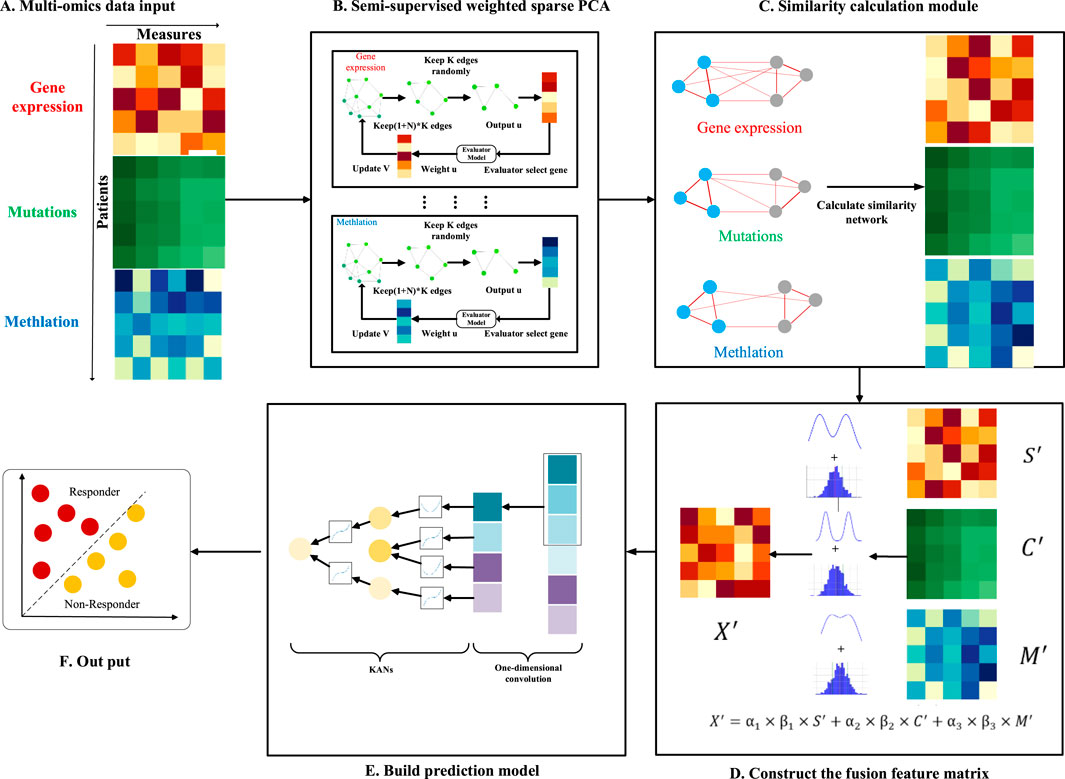
Figure 1. Overview of the NMDP model workflow. (A) Multi-omics data input. (B) Semi-supervised weighted sparse PCA. (C) Similarity calculation module. (D) Construct of the fusion feature matrix. (E) Prediction model. (F) Output.
2 Materials and methods
2.1 Datasets
In this study, we use publicly available datasets to extract drug response and genomic data from cell lines. The first dataset is Genomics of Drug Sensitivity in Cancer (GDSC), which provides extensive data on drug response measurements. The second is the Gene Expression Omnibus (GEO) and Cell Model Passports, along with the European Bioinformatics Institute (EMBL-EBI) datasets. These two datasets provide the genomic data needed for this experiment.
It is important to note that the GDSC dataset comprises 624 unique drugs, 576,758 IC_50 values, and 978 cell lines. Genomic characteristics for each cell line include somatic copy number alterations (SCNAs) across 21,878 genes, RNA-Seq expression levels for 44,421 probes, and methylation levels for 365,860 CpG sites. For our study, we select 68 drugs: 14 FDA-approved targeted therapies, 49 drugs with known target genes not yet FDA-approved, and 5 nonspecific treatments (Supplementary Tables S1–S3).
2.2 Dataset of gene pathway data
The pathway data used in this study are sourced from the Pathway Commons database, which contains commonly used pathway datasets such as the Kyoto Encyclopedia of Genes and Genomes (KEGG) and Gene Ontology (GO).
2.3 Drug response data
In addition to the preprocessing already performed by the provider of this dataset, we also perform additional preprocessing. The following are the steps and criteria of our preprocessing: first, we remove samples with certain missing data, such as samples with a missing rate of more than 10%; second, we remove drugs with limited IC_50 test information, requiring the amount of IC_50 test data for each drug to be no less than 200 samples. Third, we use waterfall distribution to divide drug response data (Ding et al., 2018). Waterfall distribution is a method that sorts drugs based on their IC_50 values and uses a linear model to fit the data, which is used to determine whether a drug is effective. Specifically, the drugs are sorted according to the true IC_50 information. A linear model is then constructed to fit the distribution, and Pearson’s coefficient is used to evaluate the degree of fit of the model. If the fit is higher than 0.95, then the median is chosen as the cut-off point. If the fit is less than 0.95, a new monadic linear function is created, and the parameters of the function are determined by the smallest and largest points of IC_50. Finally, the point furthest away from the unary linear function in the IC_50 curve is calculated as the demarcation point. Ultimately, we classify divide drugs into two categories: responsive and non-responsive. In addition, to ensure that the data are balanced, we ensure that the response group constitutes at least 25% of the total data.
2.4 Methods
In this section, we provide a detailed overview of the architecture and algorithm flow of the NMDP model. This NMDP method transforms the sparse PCA model from a non-supervised to a semi-supervised approach, improving the ability of feature selection (key genome selection module). Second: Similarity network building module: in this module, we construct a sample similarity network based on the Spearman and Kendall correlation coefficients. Third: Data fusion module: we develop a data fusion algorithm based on the dip and variance tests. Fourth: Drug response prediction module: in this module, we propose a drug response prediction model based on one-dimensional convolution and KANs.
2.4.1 Key genome selection module
2.4.1.1 ESPCA method
Before introducing the NMDP model, we first define the sparse PCA (SPCA) and edge sparse PCA (ESPCA) models. Suppose we have an
Here,
In this case,
Here,
2.4.1.2 Semi-supervised weighted edge sparse PCA
The existing SPCA and ESPCA methods are pure non-supervised methods; this method has a great advantage in data analysis with small samples and high dimensions. However, two primary issues arise: first, the method cannot utilize existing grouping information, which may reduce its effectiveness. Second, for the problem of drug response, the existing sparse PCA method selects the exact same key gene probe for all types of drugs; it obviously does not accord with the common sense of biology. In this study, we propose a novel semi-supervised weighted edge sparse PCA. This method mainly includes a weighted parameter
In general, the semi-supervised weighted edge sparse PCA method proposed in this paper can be expressed as Formula 5:
Here,
Here,
Finally, the edge weight can be represented as
Here,
In this case, we can obtain a sparse gene weight vector
Here,
In this case, if the gene probe corresponding to
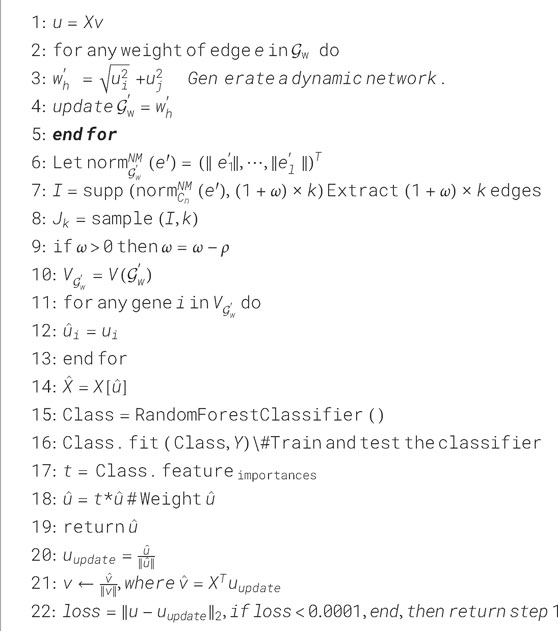
Algorithm 1. Semi-supervised weighted edge SPCA.
2.4.2 Similarity network building modules
For the same drug, we can get at least three different genomics data. The experiments in this paper mainly include gene expression data, copy volume data, and methylation data. Each omics performs sparse PCA operations independently. Finally, we can obtain three key feature matrices, namely,
Because of the inconsistency of the data lengths for each omics, data cannot be aligned. Therefore, we calculate a sample similarity subnet for each omics based on the concept of the sample similarity network. In this paper, we use two similarity measurement methods. We use the Spearman correlation coefficient to calculate the sample similarity subnet of gene expression and methylation omics, as represented in Formula 13:
Here, for the
The Kendall correlation coefficient is used for the copy number dataset, as provided in Formula 14:
Here, the
2.4.3 Data fusion module
After completing the construction of the sample similarity subnet, we can obtain three feature matrices, namely,
where
We define
It is important to note that
Another statistical method is the variance test. In addition to information about the probability distribution of the samples, our goal is to retain a matrix of sample similarity features that preserves as much discrete information as possible. The formula for the variance
where
The computed
Here,
2.4.4 Drug response prediction module
Finally, we obtain the feature matrix
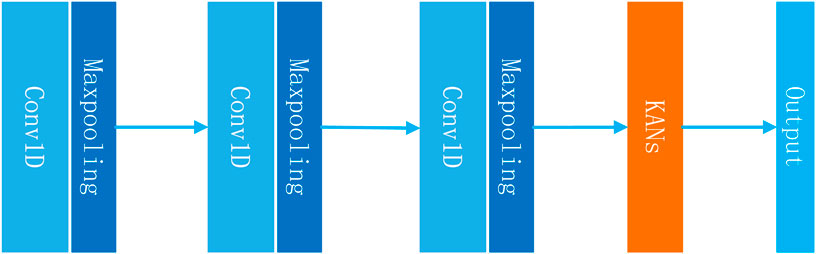
Figure 2. Structure of the deep learning model used in the NMDP model.
The theorem shows that even a complex function in a high-dimensional space can be reconstructed using a series of lower-dimensional function operations. Specifically, a KAN layer with
where the function
The main advantage of KANs is that they can achieve results beyond fully connected neural networks while using fewer parameters. This is especially important for the drug response prediction problem. Due to the limitation of the sample size, it is unlikely that we can construct a deep learning model that contains a huge neural network. To summarize, the module can be expressed using Formulas 27, 28 as follows:
3 Results
The procedure in this article consists of six distinct steps. Initially, experiments were performed using 14 FDA-approved targeted therapy drugs already authorized for clinical use. In the second step, we broadened the model evaluation by testing it with 49 targeted therapy drugs not approved by the FDA. In the third step, we conducted experiments on five chemotherapeutic agents (non-targeted therapeutics) in order to verify that the NMDP model has good scalability. We used seven state-of-the-art AI models for comparison, namely, TSGCNN, MOICVAE, MOLI, netDx, netDx–elastic network, deep autoencoder, and netDx–SVR. Five evaluation indicators were used, namely, sensitivity, specificity, precision, accuracy, and F1 score. The details of comparison models are provided in Supplementary Materials.
In the fourth step, we selected the GDSC1 dataset for training and testing and the GDSC2 dataset for validation. We selected 14 FDA-approved drugs to perform and calculate the mean value. The consistency and reliability of the results were ensured by calculating the mean value.
The fifth step included conducting ablation experiments to determine the importance of each sub-module of the NMDP model. We randomly selected 10 drugs for analysis and averaged the results. All experiments were performed using the GDSC2 dataset (Supplementary Table S7). We conducted four independent experiments: the first experiment was conducted to remove the multi-omics weighting module; the second experiment, to remove the convolution module; the third experiment, to remove the sample similarity network; and the last experiment, to replace KANs with MLPs.
Ultimately, we used the Metascape platform to examine the biological pathways associated with the gene probes chosen by the NMDP model (Zhou et al., 2019). The details of the indicators are provided in Supplementary Materials.
3.1 FDA-approved targeted therapy drugs
Based on the results presented in Figure 3 and Supplementary Table S4, experiments show that the NMDP model is much better than the advanced deep learning model. Notably, the NMDP model achieves an average sensitivity of 0.92 and a specificity of 0.93. Among the models for comparison, the MOICVAE model ranks highest, with a sensitivity of 0.77 and a specificity of 0.91. The deep autoencoder model, however, performs the lowest, with sensitivity and specificity values of 0.53 and 0.44, respectively.
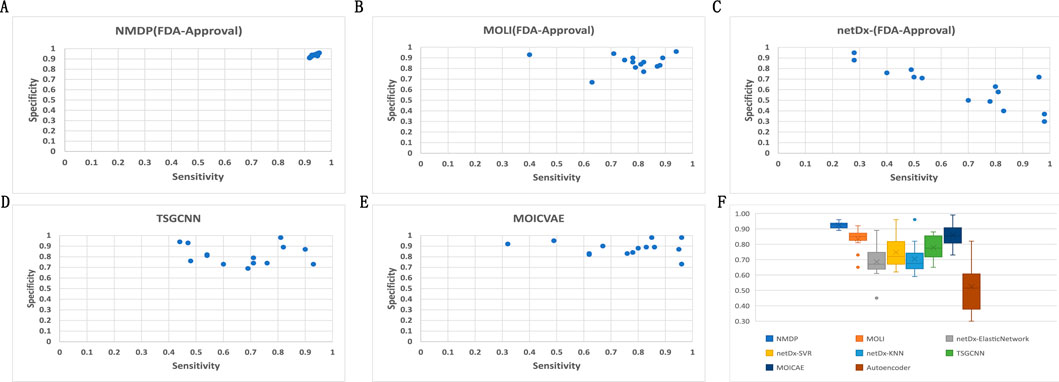
Figure 3. Results of 14 FDA-approved drugs for each model. (A) Sensitivity and specificity of the NMDP model; (B) sensitivity and specificity of the MOLI model; (C) sensitivity and specificity of the netDx model; (D) sensitivity and specificity of the TSGCNN model; (E) sensitivity and specificity of the MOICVAE model; and (F) accuracy of each model.
Based on Figure 3C, it is evident that the deep autoencoder model exhibits overfitting across multiple drugs. Moreover, the NMDP model demonstrates minimal fluctuation across 14 drugs, indicating its superior stability (Figure 3F). Compared to other models, all except the MOLI model show relatively high levels of fluctuation, suggesting weaker stability in those models. The NMDP model achieves values of 0.93, 0.92, 0.92, and 0.92 for average accuracy and F1 score, outperforming the MOICVAE model by 10% in each metric (Table 1). When compared to the deep autoencoder model, it shows improvements of 31%, 48%, 52%, and 50%, respectively.
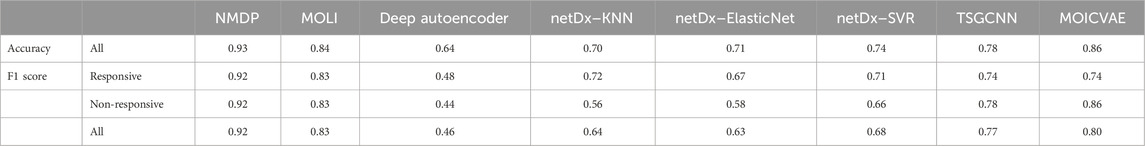
Table 1. Results of each model of the 14 drugs approved by the FDA.
According to Figure 4, the NMDP model demonstrated excellent performance in predictive accuracy. It is worth mentioning that out of these 14 drugs, the prediction accuracy for 13 of them exceeded 90%.
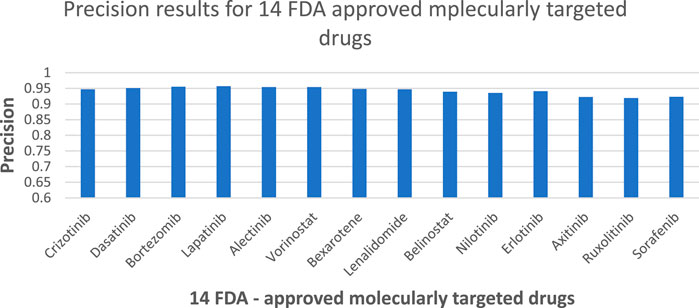
Figure 4. NMDP model precision results of 14 FDA-approved drugs.
3.2 FDA non-approved targeted therapy drugs
Across the 49 drugs not approved by the FDA, we observe similar outcomes. Experimental findings indicate that the NMDP model achieves average sensitivity and specificity values of 0.92 and 0.93, respectively, outperforming the comparison models by 11%–57% (Supplementary Figure S1; Supplementary Table S5). Supplementary Figure S1F illustrates the NMDP model’s high stability, with only 5 out of the 49 drugs showing precision below 0.9 (see Figure 5). In addition, the average precision of the NMDP method can reach 0.95. F1 score can reach 0.92, surpassing the MOLI model by 14%, 10%, and 13% (Supplementary Table S1). Among the seven models compared, MOLI achieves the highest performance. Nevertheless, its sensitivity, specificity, precision, and accuracy for response, non-response, and all samples are only 0.80, 0.88, and 0.86, respectively, with F1 scores of 0.83, 0.83, 0.83, 0.82, and 0.84.
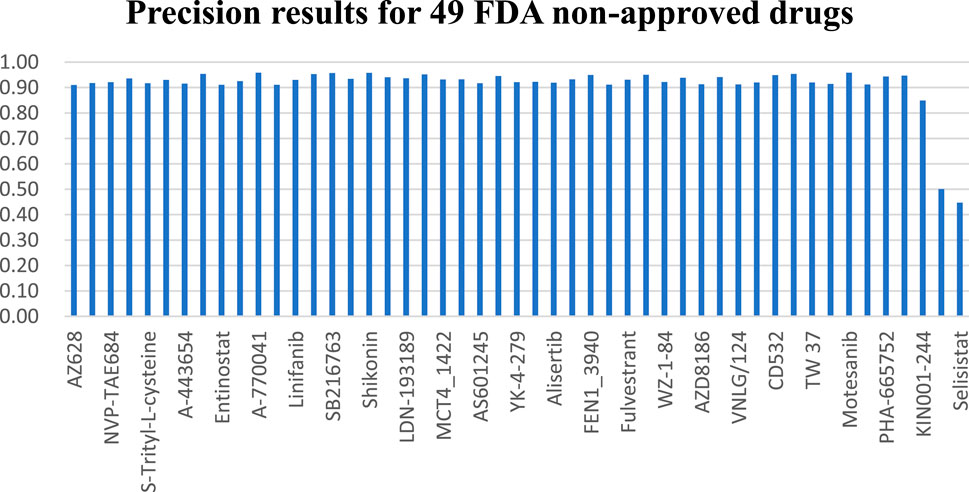
Figure 5. NMDP model precision results of five non-specific therapeutic drugs.
3.3 Non-specific therapeutic drugs
In the study of five non-specific therapeutic drugs, we achieve optimal outcomes in three experiments. Results indicate that the NMDP model achieves 0.93 for average sensitivity, surpassing the comparison models by 19%–42% (Supplementary Figure S2; Supplementary Table S6). Additionally, the NMDP model demonstrates a precision close to 0.95 across the five drugs (Figure 6). The model also shows outstanding performance in F1 score and accuracy, reaching 0.93 (Supplementary Table S2). Compared to the other models, the MOLI model achieves the best results, but its average F1 score and accuracy reach only 0.78. The experimental results show that the NMDP model has good expansibility.
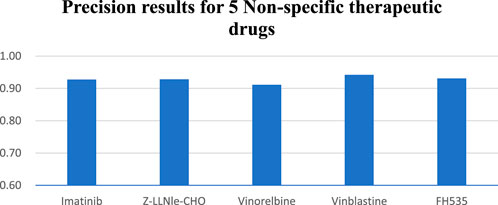
Figure 6. NMDP model precision results of five non-specific therapeutic drugs.
3.4 External independent validation results
To evaluate the model’s performance and test its generalization ability, we design this external independent validation experiment. The experimental outcomes demonstrate that the NMDP model exhibits superior generalization capabilities. Specifically, the NMDP model achieves an overall prediction accuracy of 0.77 and precision, recall, F1 score, and accuracy of 0.73, 0.77, 0.74, and 0.77, respectively (Table 2). It is worth noting that a slight decrease in accuracy is observed on the validation set compared to the results on the test set. This may be due to the noise difference between the datasets. Overall, the NMDP model exhibits robustness and reliability, with the capability for widespread application.

Table 2. External independent validation results.
3.5 Ablation experiment
The experimental results show that the model feature extraction effect is weakened by removing the multi-omics weighting module and the convolution module, but the convolution module has a greater impact on the model. The sample similarity network module has the greatest impact, further verifying the importance of similarity across samples. When KANs are replaced with MLPs, the performance of the model improves but still does not surpass that of the original model. This indicates that KANs have a unique advantage in capturing complex relationships, especially when dealing with multi-omics data. Taken together, the results of the ablation experiments fully indicate that the sample similarity network and convolution module are the key factors in improving the model performance. Among them, the sample similarity network module has the greatest impact, and we believe that the main reason is that, even after the feature filtering of the sparse PCA model, the three modules are still able to save more than 9,000 gene probes collectively, and the excessively high data dimensions make it easy for the model to fall into an overfitting state.
3.6 Enrichment analysis
To validate the biological interpretability of the NMDP model, we conduct bio-enrichment analysis using gene selection results for erlotinib across different omics types obtained from the first principal component (PC) in the NMDP model. Erlotinib is an FDA-approved non-small cell lung cancer drug, with EGFR as its primary target (Tsao et al., 2005; Zhou et al., 2021). The analysis yields promising results as the NMDP model successfully identifies lung cancer-related pathways and gene probes. For instance, in copy number omics, we discover pathways corresponding to genes like EGFR, CDK6, RASSF5, BRAF, and CCND1, which are associated with non-small cell lung cancer (Chen et al., 2018; Xue et al., 2019; Zhao et al., 2018) (Figure 7A). In methylation omics, we observe the developmental process pathway GO:0032502, involving genes such as EGFR, FGFR2, GATA6, ASCL1, BMP4, and FOXA1, indicating relevance to lung development (Bach et al., 2018; Ju et al., 2019; Murai et al., 2015) (Figure 7B). In Seq omics, we identify pathways related to the KEGG pathway, which include genes like EGFR, MAPK1, KRAS, CCND1, HRAS, NRAS, PLCG1, and GRB2, which show strong connections to non-small cell lung cancer (Betticher et al., 1996; Park et al., 2020; Pązik et al., 2021) (Figure 7C). Remarkably, EGFR, the target gene of erlotinib, is consistently identified across these three omics types.
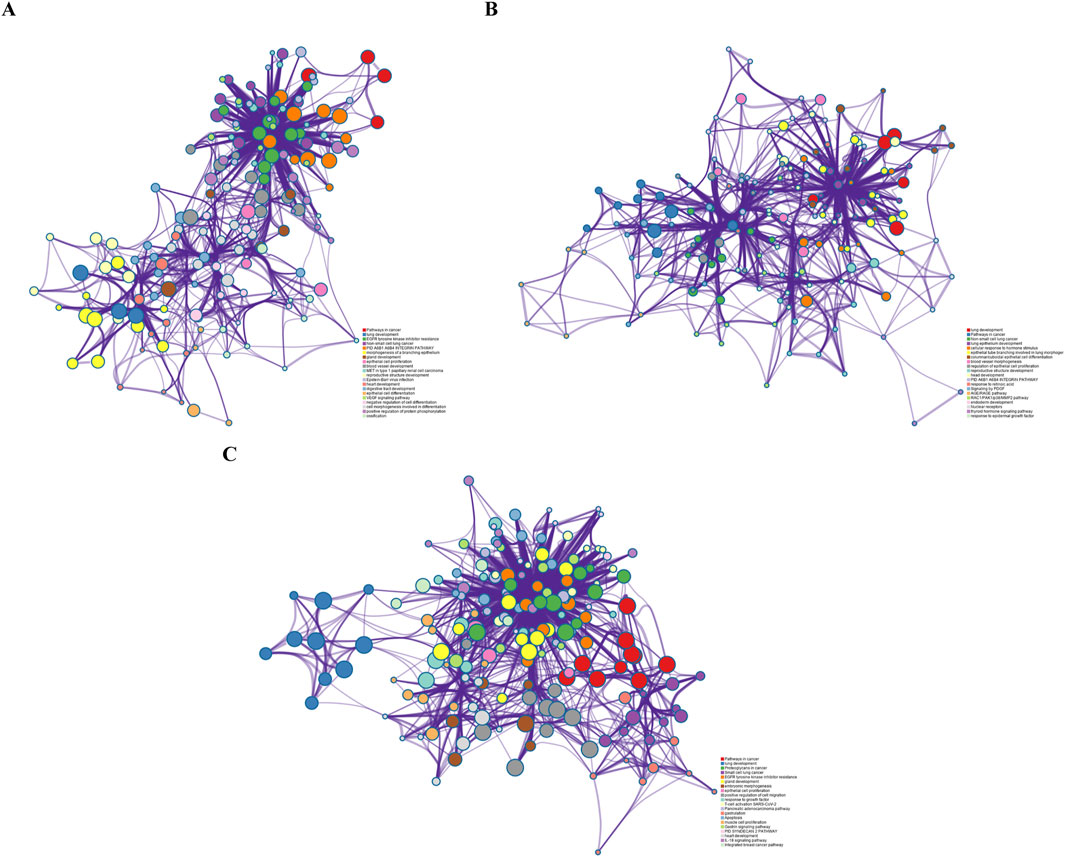
Figure 7. (A) Pathway results from the first PC of copy number; (B) pathway results from the first PC of methylation data; and (C) pathway results from the first PC of sequencing data.
Overall, the NMDP model demonstrates superior performance compared to other models across all metrics.
4 Discussion
With advancements in bioassay technology, a growing number of large-scale drug response datasets are being released, creating new possibilities for building drug response prediction models. In recent years, researchers have proposed a number of AI-based drug response prediction models (Chiu et al., 2020). However, drug response prediction data are mostly characterized by the typical features of multi-omics, small samples, high dimensionality, and high noise. Designing feature selection and multi-omics fusion methods based on regularization ideas becomes very important. In addition, considering the potential overfitting problem, it is difficult for researchers to build AI-based drug response prediction models with many parameters.
In light of the aforementioned issues, we propose the NMDP model, which integrates semi-supervised weighted SPCA, similarity networks, dip tests, and KANs. Unlike the traditional unsupervised sparse PCA model, the NMDP model proposes an independent evaluator that converts the sparse PCA model from a traditional unsupervised to a semi-supervised model. This improvement allows the NMDP model to use known dataset grouping information, ultimately allowing the model to stably select different potential target genes for different target drugs. The experimental results show that the NMDP model inherits the advantages of the sparse PCA model, such as good biological interpretability and strong denoising ability, further enhances the feature selection ability of the model in multi-omics gene data, and greatly strengthens the stability of the model in high-dimensional small-sample cases. Sample similarity networks further address the dimensionality challenge of the samples while helping the model perform multi-omics data alignment. We introduce a fusion algorithm that utilizes both dip test and variance data with weighted integration, which allows the model to focus on important histological information, thus improving prediction accuracy. Finally, we propose a one-dimensional convolution combined with KANs for drug response prediction modeling. The model achieves efficient prediction with a small number of parameters, thereby effectively avoiding the overfitting problem.
To enhance the validation of the model, we also conduct external validation experiments to assess the generalization capability of the model using independent datasets. The experimental findings indicate that the NMDP model performs consistently on different datasets, validating its robustness and reliability. In addition, we conduct ablation experiments to evaluate the contribution of each component to the model performance. The results of the ablation experiments show that removing the multi-omics weighting module and the convolution module significantly degrades the model’s performance, and in particular, the sample similarity network module plays the most crucial role in influencing the model’s effectiveness. This further emphasizes the importance of inter-sample similarity and the unique advantage of KANs in capturing complex relationships. Bioenrichment experiments fully validate the biointerpretability of the model, suggesting that the NMDP model could help researchers in drug development.
We also acknowledge some limitations to this study: our research is confined to predicting the response to a single drug, without considering the effects of combination drug therapies. Moreover, the weighted edge sparse PCA method has high time complexity, which leads to slower model computations. In future work, we plan to improve the model’s ability to predict responses to drug combinations and optimize its computational efficiency.
Data availability statement
The data presented in the study are deposited in the European Genome-phenome Archive (EGA) repository, accession numbers EGAD00001001039, EGAD00001004201, EGAD00010000644; and in the Gene Expression Omnibus (GEO) repository, accession number GSE68379.
Author contributions
RM: data curation, methodology, software, writing–original draft, and writing–review and editing. B-JZ: writing–original draft and writing–review and editing. X-YM: methodology, software, and writing–original draft. XD: software and writing–original draft. Y-DO: software and writing–original draft. YL: writing–review and editing. H-YY: writing–review and editing. YW: writing–review and editing. Z-HD: writing–review and editing.
Funding
The author(s) declare that financial support was received for the research, authorship, and/or publication of this article. The study is supported by the Guangdong Provincial Department of Education youth innovative talent project (no. 2023KQNCX155), Post-doctoral training project of Zunyi Medical University (no. 2023F-ZH- 019), the Key Construction Discipline of Immunology and Pathogen Biology Fund, Zunyi Medical University Zhuhai Campus, China (no. ZHGF 2024-1), and the Science and Technology Project of Guizhou Province (Project Number: Guizhou Science and Technology Support [2021] General 446).
Conflict of interest
The authors declare that the research was conducted in the absence of any commercial or financial relationships that could be construed as a potential conflict of interest.
Generative AI statement
The author(s) declare that no Generative AI was used in the creation of this manuscript.
Publisher’s note
All claims expressed in this article are solely those of the authors and do not necessarily represent those of their affiliated organizations, or those of the publisher, the editors and the reviewers. Any product that may be evaluated in this article, or claim that may be made by its manufacturer, is not guaranteed or endorsed by the publisher.
Supplementary material
The Supplementary Material for this article can be found online at: https://www.frontiersin.org/articles/10.3389/fgene.2025.1532651/full#supplementary-material
References
Adam, G., Rampášek, L., Safikhani, Z., Smirnov, P., Haibe-Kains, B., and Goldenberg, A. (2020). Machine learning approaches to drug response prediction: challenges and recent progress. NPJ Precis. Oncol. 4 (1), 19. doi:10.1038/s41698-020-0122-1
Bach, D.-H., Kim, D., An, Y. J., Park, S., Park, H. J., Lee, S. K., et al. (2018). Bmp4 upregulation is associated with acquired drug resistance and fatty acid metabolism in egfr-mutant non-small-cell lung cancer cells. Mol. Therapy-Nucleic Acids 12, 817–828. doi:10.1016/j.omtn.2018.07.016
Ballester, P. J., and Carmona, J. (2021). Artificial intelligence for the next generation of precision oncology. NPJ Precis. Oncol. 5 (1), 79. doi:10.1038/s41698-021-00216-w
Ballester, P. J., Stevens, R., Haibe-Kains, B., Huang, R. S., and Aittokallio, T. (2022). Artificial intelligence for drug response prediction in disease models, bbab450. Oxford University Press.
Baptista, D., and Ferreira, P. G. (2023). A systematic evaluation of deep learning methods for the prediction of drug synergy in. Cancer 19 (3), e1010200. doi:10.1371/journal.pcbi.1010200
Baptista, D., Ferreira, P. G., and Rocha, M. (2021). Deep learning for drug response prediction in cancer. Briefings Bioinforma. 22 (1), 360–379. doi:10.1093/bib/bbz171
Barretina, J., Caponigro, G., Stransky, N., Venkatesan, K., Margolin, A. A., Kim, S., et al. (2012a). The Cancer Cell Line Encyclopedia enables predictive modelling of anticancer drug sensitivity. Cancer Cell Line Encycl. enables Predict. Model. anticancer drug Sensit. Nat. 483, 603–607. doi:10.1038/nature11003
Barretina, J., Caponigro, G., Stransky, N., Venkatesan, K., Margolin, A. A., Kim, S., et al. (2012b). The cancer cell line encyclopedia enables predictive modelling of anticancer drug sensitivity. Nature 483 (7391), 603–607. doi:10.1038/nature11003
Betticher, D. C., Heighway, J., Hasleton, P. S., Altermatt, H. J., Ryder, W. D. J., Cerny, T., et al. (1996). Prognostic significance of Ccnd1 (cyclin D1) overexpression in primary resected non-small-cell lung cancer. Br. J. cancer 73 (3), 294–300. doi:10.1038/bjc.1996.52
Chen, C., Zhang, Z., Li, J., and Sun, Y. (2018). Snhg8 is identified as a key regulator in non-small-cell lung cancer progression sponging to mir-542-3p by targeting ccnd1/cdk6. OncoTargets Ther. 11, 6081–6090. doi:10.2147/OTT.S170482
Chen, J., and Zhang, L. (2021). A survey and systematic assessment of computational methods for drug response prediction. Briefings Bioinforma. 22 (1), 232–246. doi:10.1093/bib/bbz164
Chiu, Y.-C., Chen, H.-I. H., Gorthi, A., Mostavi, M., Zheng, S., Huang, Y., et al. (2020). Deep learning of pharmacogenomics resources: moving towards precision oncology. Briefings Bioinforma. 21 (6), 2066–2083. doi:10.1093/bib/bbz144
Chiu, Y.-C., Chen, H.-I. H., Zhang, T., Zhang, S., Gorthi, A., Wang, L.-Ju, et al. (2019). Predicting drug response of tumors from integrated genomic profiles by deep neural networks. BMC Med. genomics 12 (1), 18–55. doi:10.1186/s12920-018-0460-9
Deng, T., Chen, S., Zhang, Y., Xu, Y., Feng, Da, and Wu, H. (2023). A cofunctional grouping-based approach for non-redundant feature gene selection in unannotated single-cell rna-seq analysis. Brief. Bioinform. 24, bbad042. doi:10.1093/bib/bbad042
Ding, M. Q., Chen, L., Cooper, G. F., Young, J. D., and Lu, X. (2018). Precision oncology beyond targeted therapy: combining omics data with machine learning matches the majority of cancer cells to effective therapeutics. Mol. cancer Res. 16 (2), 269–278. doi:10.1158/1541-7786.MCR-17-0378
Dlamini, Z., Francies, F. Z., Hull, R., and Marima, R. (2020). Artificial intelligence (ai) and big data in cancer and precision oncology. Comput. Struct. Biotechnol. J. 18, 2300–2311. doi:10.1016/j.csbj.2020.08.019
Dong, Z., Zhang, N., Li, C., Wang, H., Fang, Y., Wang, J., et al. (2015). Anticancer drug sensitivity prediction in cell lines from baseline gene expression through recursive feature selection. BMC cancer 15, 489–512. doi:10.1186/s12885-015-1492-6
Firoozbakht, F., Yousefi, B., and Schwikowski, B. (2022). An overview of machine learning methods for monotherapy drug response prediction. Briefings Bioinforma. 23 (1), bbab408. doi:10.1093/bib/bbab408
Gao, H., Korn, J. M., Ferretti, S., Monahan, J. E., Wang, Y., Singh, M., et al. (2015). High-throughput screening using patient-derived tumor xenografts to predict clinical trial drug response. Nat. Med. 21 (11), 1318–1325. doi:10.1038/nm.3954
Garnett, M. J., Edelman, E. J., Heidorn, S. J., Greenman, C. D., Dastur, A., Lau, K. W., et al. (2012). Systematic identification of genomic markers of drug sensitivity in cancer cells. Nature 483 (7391), 570–575. doi:10.1038/nature11005
Garraway, L. A., Verweij, J., and Ballman, K. V. (2013). Precision oncology: an overview. J. Clin. Oncol. 31 (15), 1803–1805. doi:10.1200/JCO.2013.49.4799
Geeleher, P., Cox, N. J., and Huang, R. S. (2014). Clinical drug response can Be predicted using baseline gene expression levels and in vitro drug sensitivity in cell lines. Genome Biol. 15, R47–R12. doi:10.1186/gb-2014-15-3-r47
Hartigan, J. A., and Pamela, M. J. (1985). “The annals of statistics hartigan,” in The dip test of unimodality, 70–84.
Ju, F.-J., Meng, F.-Q., Hu, H.-L., and Liu, J. (2019). Association between Bmp4 expression and pathology, ct characteristics and prognosis of non-small cell lung cancer. Eur. Rev. Med. and Pharmacol. Sci. 23, 5787–5794. doi:10.26355/eurrev_201907_18317
Liu, Z., Wang, Y., Vaidya, S., Ruehle, F., Halverson, J., Soljačić, M., et al. (2024). Kan: Kolmogorov-arnold networks. arXiv preprint arXiv:2404.19756.
Miao, R., Chen, H.-H., Qi, D., Xia, L.-Y., Yang, Z.-Yi, He, M.-F., et al. (2020). Beyond the limitation of targeted therapy: improve the application of targeted drugs combining genomic data with machine learning. Pharmacol. Res. 159, 104932. doi:10.1016/j.phrs.2020.104932
Miao, R., Dong, X., Liu, X.-Y., Lo, S.-L., Xin-Yue, M., Qi, D., et al. (2022). Dynamic meta-data network sparse pca for cancer subtype biomarker screening. Front. Genet. 13, 869906. doi:10.3389/fgene.2022.869906
Min, W., Liu, J., and Zhang, S. (2018). Edge-group sparse pca for network-guided high dimensional data analysis. Bioinformatics 34 (20), 3479–3487. doi:10.1093/bioinformatics/bty362
Munquad, S., Bikas, A., and Das, J. H. (2024). Uncovering the subtype-specific disease module and the development of drug response prediction models for glioma. Heliyon 10 (5), e27190. doi:10.1016/j.heliyon.2024.e27190
Murai, F., Koinuma, D., Shinozaki-Ushiku, A., Fukayama, M., Miyaozono, K., and Ehata, S. (2015). Ezh2 promotes progression of small cell lung cancer by suppressing the tgf-Β-smad-ascl1 pathway. Cell Discov. 1 (1), 1–17. doi:10.1038/celldisc.2015.26
Park, S., Kim, T. M., Cho, S.-Y., Kim, S., Oh, Y., Kim, M., et al. (2020). Combined blockade of polo-like kinase and pan-raf is effective against nras-mutant non-small cell lung cancer cells. Cancer Lett. 495, 135–144. doi:10.1016/j.canlet.2020.09.018
Pązik, M., Michalska, K., Żebrowska-Nawrocka, M., Zawadzka, I., Łochowski, M., and Balcerczak, E. (2021). Clinical significance of hras and kras genes expression in patients with non–small-cell lung cancer-preliminary findings. BMC cancer 21, 130–213. doi:10.1186/s12885-021-07858-w
Peng, W., Chen, T., Liu, H., Dai, W., Yu, N., and Lan, W. (2023). Improving drug response prediction based on two-space graph convolution. Comput. Biol. Med. 158, 106859. doi:10.1016/j.compbiomed.2023.106859
Prasad, V. (2016). Perspective: the precision-oncology illusion. Nature 537 (7619), S63. doi:10.1038/537S63a
Prasad, V., Fojo, T., and Brada, M. (2016). Precision oncology: origins, optimism, and potential. Lancet Oncol. 17 (2), e81–e86. doi:10.1016/S1470-2045(15)00620-8
Rashid, Md M. (2024). Advancing drug-response prediction using multi-modal and-omics machine learning integration (momlin): a case study on breast cancer clinical data. Brief. Bioinform. 25 (4), bbae300. doi:10.1093/bib/bbae300
Rubio-Perez, C., Tamborero, D., Schroeder, M. P., Antolín, A. A., Deu-Pons, J., Perez-Llamas, C., et al. (2015). In silico prescription of anticancer drugs to cohorts of 28 tumor types reveals targeting opportunities. Cancer Cell 27 (3), 382–396. doi:10.1016/j.ccell.2015.02.007
Sharifi-Noghabi, H., Zolotareva, O., Collins, C. C., and Ester, M. (2019). Moli: multi-omics late integration with deep neural networks for drug response prediction. Bioinformatics 35 (14), i501–i509. doi:10.1093/bioinformatics/btz318
Sharma, A., Lysenko, A., and Boroevich, K. A. (2023). DeepInsight-3D architecture for anti-cancer drug response prediction with deep-learning on multi-omics. Deepinsight-3d Archit. Anti-Cancer Drug Response Predict. Deep-Learning Multi-Omics 13 (1), 2483. doi:10.1038/s41598-023-29644-3
Sharma, A., Lysenko, A., Jia, S., and Boroevich, K. A. (2024). Advances in ai and machine learning for predictive medicine, 1–11.
Sheng, J., Li, F., and Wong, S. T. C. (2015). Optimal drug prediction from personal genomics profiles. IEEE J. Biomed. Health Inf. 19 (4), 1264–1270. doi:10.1109/JBHI.2015.2412522
Trac, Q. T., Pawitan, Y., Mou, T., Erkers, T., Östling, P., Bohlin, A., et al. (2023). Prediction model for drug response of acute myeloid leukemia patients. NPJ Precis. Oncol. 7 (1), 32. doi:10.1038/s41698-023-00374-z
Tsao, M.-S., Sakurada, A., Cutz, J.-C., Zhu, C.-Qi, Kamel-Reid, S., Squire, J., et al. (2005). Erlotinib in lung cancer—molecular and clinical predictors of outcome. N. Engl. J. Med. 353 (2), 133–144. doi:10.1056/NEJMoa050736
Wang, C., Zhang, M., Zhao, J., Li, B., Xiao, X., and Zhang, Y. (2023). The prediction of drug sensitivity by multi-omics fusion reveals the heterogeneity of drug response in pan-cancer. Comput. Biol. Med. 163, 107220. doi:10.1016/j.compbiomed.2023.107220
Xu, K., Lu, Y., Hou, S., Liu, K., Du, Y., Huang, M., et al. (2024). Detecting anomalous anatomic regions in spatial transcriptomics with stands. Nat. Commun. 15 (1), 8223. doi:10.1038/s41467-024-52445-9
Xue, Y., Meehan, B., Fu, Z., Wang, X. Q. D., Fiset, P. O., Rieker, R., et al. (2019). Smarca4 loss is synthetic lethal with cdk4/6 inhibition in non-small cell lung cancer. Nat. Commun. 10 (1), 557. doi:10.1038/s41467-019-08380-1
Zhao, M., Xu, P., Liu, Z., Zhen, Y., Chen, Y., Liu, Y., et al. (2018). Retracted article: dual roles of mir-374a by modulated C-jun respectively targets ccnd1-inducing pi3k/akt signal and pten-suppressing wnt/Β-catenin signaling in non-small-cell lung cancer. Cell Death and Dis. 9 (2), 78. doi:10.1038/s41419-017-0103-7
Zheng, X., Wang, M., and Huang, K. (2024). Global and cross-modal feature aggregation for multi-omics data classification and application on drug response prediction. Inf. Fusion 102, 102077. doi:10.1016/j.inffus.2023.102077
Zhou, L., Wang, N., Zhu, Z., Gao, H., Lu, N., Su, H., et al. (2024). Multi-omics fusion based on attention mechanism for survival and drug response prediction in digestive system tumors, Neurocomputing 572, 127168. doi:10.1016/j.neucom.2023.127168
Zhou, Q., Xu, C.-R., Cheng, Y., Liu, Y.-P., Chen, G.-Y., Cui, J.-W., et al. (2021). Bevacizumab plus erlotinib in Chinese patients with untreated, egfr-mutated, advanced nsclc (Artemis-Ctong1509): a multicenter phase 3 study. Cancer Cell 39 (9), 1279–1291. e3. doi:10.1016/j.ccell.2021.07.005
Keywords: drug response prediction, feature extraction, sparse PCA, Kolmogorov–Arnold networks, data fusion
Citation: Miao R, Zhong B-J, Mei X-Y, Dong X, Ou Y-D, Liang Y, Yu H-Y, Wang Y and Dong Z-H (2025) A semi-supervised weighted SPCA- and convolution KAN-based model for drug response prediction. Front. Genet. 16:1532651. doi: 10.3389/fgene.2025.1532651
Received: 02 December 2024; Accepted: 24 February 2025;
Published: 21 March 2025.
Edited by:
Lin Zhang, China University of Mining and Technology, ChinaReviewed by:
Xiaobo Sun, Zhongnan University of Economics and Law, ChinaConghao Wang, Nanyang Technological University, Singapore
Copyright © 2025 Miao, Zhong, Mei, Dong, Ou, Liang, Yu, Wang and Dong. This is an open-access article distributed under the terms of the Creative Commons Attribution License (CC BY). The use, distribution or reproduction in other forums is permitted, provided the original author(s) and the copyright owner(s) are credited and that the original publication in this journal is cited, in accordance with accepted academic practice. No use, distribution or reproduction is permitted which does not comply with these terms.
*Correspondence: Rui Miao, bWlhb3J1aS5yZXNlYXJjaEBnbWFpbC5jb20=
†These authors have contributed equally to this work