- 1Department of Geriatrics, Sir Run Run Hospital, Nanjing Medical University, Nanjing, Jiangsu, China
- 2Department of Geriatrics, The First Affiliated Hospital of Soochow University, Suzhou, Jiangsu, China
Background: Sarcopenia is a prevalent condition associated with aging. Inflammation and pyroptosis significantly contribute to sarcopenia.
Methods: Two sarcopenia-related datasets (GSE111016 and GSE167186) were obtained from the Gene Expression Omnibus (GEO), followed by batch effect removal post-merger. The “limma” R package was utilized to identify differentially expressed genes (DEGs). Subsequently, LASSO analysis was conducted on inflammation and pyroptosis-related genes (IPRGs), resulting in the identification of six hub IPRGs. A novel skeletal muscle aging model was developed and validated using an independent dataset. Additionally, Gene Ontology (GO) enrichment analysis was performed on DEGs, along with Kyoto Encyclopedia of Genes and Genomes (KEGG) pathway analysis and gene set enrichment analysis (GSEA). ssGSEA was employed to assess differences in immune cell proportions between healthy muscle groups in older versus younger adults. The expression levels of the six core IPRGs were quantified via qRT-PCR.
Results: A total of 44 elderly samples and 68 young healthy samples were analyzed for DEGs. Compared to young healthy muscle tissue, T cell infiltration levels in aged muscle tissue were significantly reduced, while mast cell and monocyte infiltration levels were relatively elevated. A new diagnostic screening model for sarcopenia based on the six IPRGs demonstrated high predictive efficiency (AUC = 0.871). qRT-PCR results indicated that the expression trends of these six IPRGs aligned with those observed in the database.
Conclusion: Six biomarkers—BTG2, FOXO3, AQP9, GPC3, CYCS, and SCN1B—were identified alongside a diagnostic model that offers a novel approach for early diagnosis of sarcopenia.
Introduction
Sarcopenia is a disease characterized by the gradual loss of skeletal muscle mass, strength, and function, typically associated with aging (Cruz-Jentoft et al., 2019). This common age-related condition significantly impacts an individual’s physical health and overall quality of life (Cruz-Jentoft and Sayer, 2019). Sarcopenia becomes more prevalent with advancing age, with its incidence rising significantly among the elderly population. It affects both men and women, but its prevalence is particularly high among older adults and individuals with certain underlying health conditions (Pascual-Fernández et al., 2020). Therefore, identifying new biomarkers and uncovering immune mechanisms are crucial for prevention and treatment.
Inflammation is defined as a series of tissue responses triggered by injury, which is closely associated with various diseases (Franceschi and Campisi, 2014). Numerous studies have demonstrated that inflammation ultimately influences the mass, strength, and function of skeletal muscle by regulating protein synthesis and degradation within these muscles (Franceschi and Campisi, 2014; Zembron-Lacny et al., 2019). Tumor necrosis factor α (TNF-α) plays a pivotal role in the degradation of muscle proteins via the nuclear factor-κB (NF-κB) signaling pathway (Hirata et al., 2022). Interleukin 6 (IL-6)(IL-6), a pro-inflammatory cytokine, mediates processes that lead to either reduction or stabilization of muscle atrophy (Hirata et al., 2022). Additionally, interleukin 1 (IL-1) and IL-18 are also implicated in inflammation-mediated muscle atrophy (McBride et al., 2017; Dalle et al., 2017). While inflammation is a well-known contributor to muscle degradation, recent studies have begun to explore more specific inflammatory mechanisms such as pyroptosis, which may provide new insights into the molecular underpinnings of sarcopenia.
Pyroptosis involves apoptotic cells characterized by programmed cell death and is linked to inflammatory processes (Picca and Calvani, 2021). This phenomenon is typically initiated through two molecular pathways: one classical pathway mediated by Caspase-1 and another non-classical pathway involving Caspases 4/5/11, culminating in pyroptosis executed by members of the gasdermin protein family (Rosenberg, 1997; Ibebunjo et al., 2013; Rudolf et al., 2014). Both in vivo and in vitro investigations have indicated that activation of the NLRP3 inflammasome induces pyroptosis while promoting activation of the ubiquitin-proteasome system (UPS), resulting in muscle proteolysis and subsequent muscle atrophy (You et al., 2023). Factors related to inflammation and pyroptosis may serve as molecular markers for early diagnosis of muscular atrophy since their levels increase with age-related changes in muscle.
Currently, there are no predictive models based on the characteristics of IPRGs in musculoskeletal aging. Combining inflammation, pyroptosis, and immune infiltration analysis can more accurately identify diagnostic biomarkers. In this study, we systematically analyzed the expression of IPRGs, which play pivotal roles in inflammation-mediated muscle atrophy, along with their relationship to immune infiltration. We identified six key characteristic genes and constructed a diagnostic model, validated through RT-qPCR in a sarcopenia cell model, to support the early diagnosis of sarcopenia.
Results
DEGs between sarcopenia patients and healthy controls
Using the “limma” package in R, DEGs were identified in a combined dataset of 44 elderly patients with sarcopenia and 68 normal controls. The analysis revealed 1,194 low-expressed genes and 2,196 highly expressed genes. The results of the DEGs were visualized using a volcano plot and heatmap (Figure 1). The top five most significantly upregulated genes were FLG2, FLG, KRT2, DSC1, and DSG1, while the top five most significantly downregulated genes were MTATP8P2, DCD, CHI3L1, PVALB, and MTRNR2L8. DEGs have been provided in the supplementary material (Supplementary Table 1).
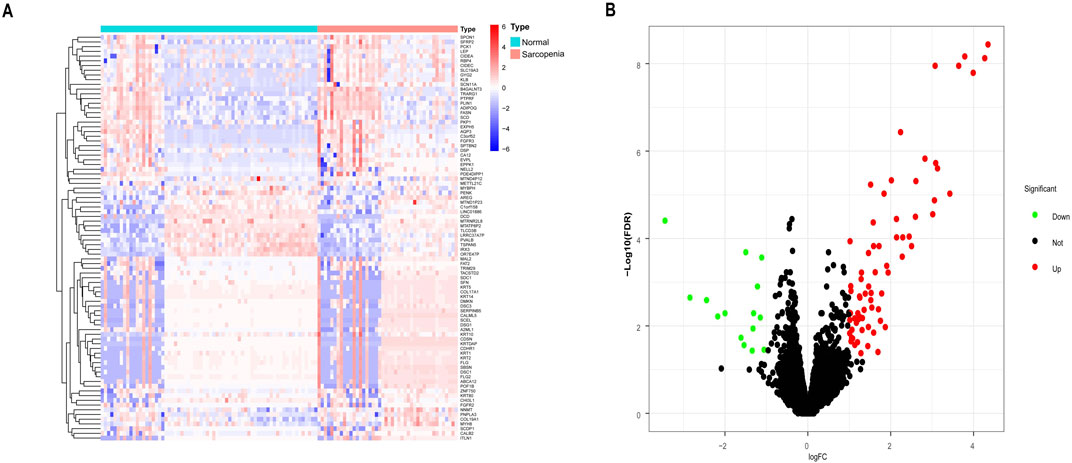
Figure 1. Differentially expressed genes (DEGs) between sarcopenia tissues and normal samples from the GSE111016 and GSE167186 datasets. (A) Heatmap of the top 50 DEGs. Colors range from red to blue, representing high to low expression levels of DEGs. (B) Volcano plot of DEGs. Red dots in the upper right denote upregulated DEGs, yellow dots in the upper left denote downregulated DEGs, and black dots in the middle represent genes with stable expression.
Functional enrichment analysis and GSEA
According to the screening criteria of an adjusted p-value <0.05, GO enrichment analysis of DEGs identified significant annotations across biological processes (BPs), cellular components (CCs), and molecular functions (MFs) (Figure 2A). BP analysis revealed that DEGs were primarily enriched in the ribose phosphate metabolic process, purine ribonucleotide metabolic process, energy derivation by oxidation of organic compounds, purine nucleoside triphosphate metabolic process, and ribonucleoside triphosphate metabolic process. CC analysis showed that DEGs were associated with the mitochondrial inner membrane, mitochondrial protein-containing complex, mitochondrial matrix, contractile fiber, and myofibril. MF analysis indicated that DEGs were enriched in actin binding, primary active transmembrane transporter activity, extracellular matrix structural constituent, oxidoreduction-driven active transmembrane transporter activity, and electron transfer activity. KEGG pathway enrichment analysis revealed that DEGs were mainly involved in pathways related to neurodegeneration-multiple diseases, amyotrophic lateral sclerosis, Alzheimer’s disease, prion disease, the PI3K-Akt signaling pathway, the AMPK signaling pathway, and the Foxo signaling pathway (Figure 2B). Furthermore, GSEA identified the top five gene sets most significantly enriched in both the sarcopenia and normal groups, suggesting that the development of musculoskeletal aging may be mediated by specific molecular mechanisms involving DEGs (Figure 3A).
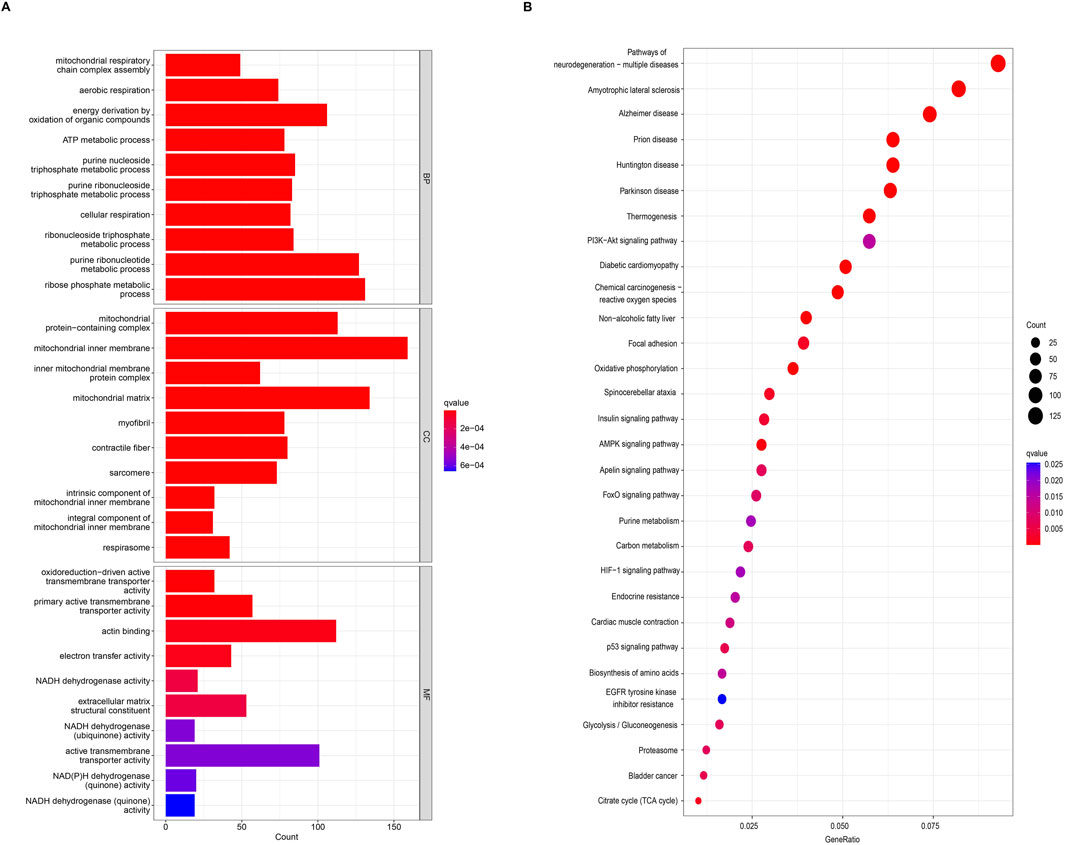
Figure 2. Functional and pathway enrichment analyses of DEGs. (A) Gene Ontology (GO) enrichment analysis of DEGs. (B) Kyoto Encyclopedia of Genes and Genomes (KEGG) enrichment analysis of DEGs.
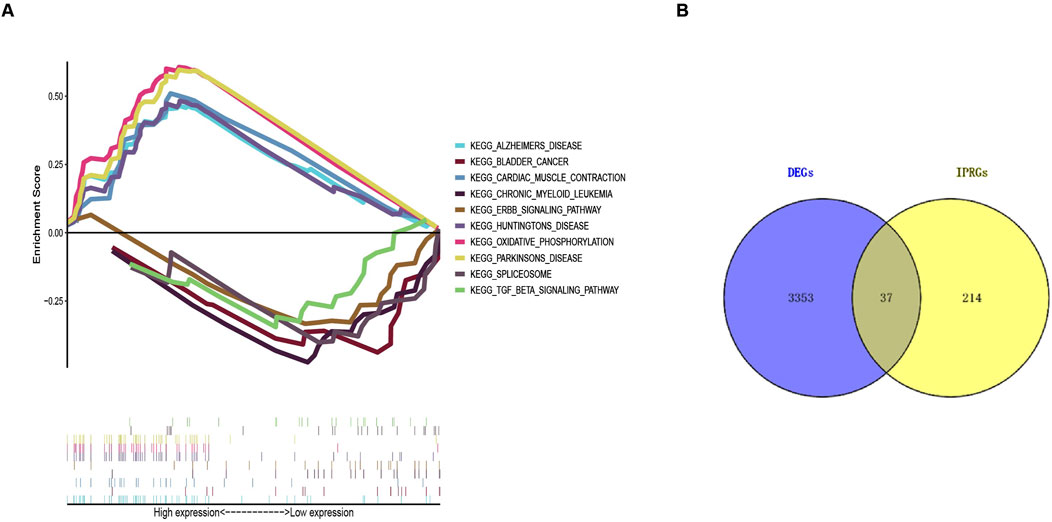
Figure 3. Gene Set Enrichment Analysis (GSEA) results and identification of IPRGs. (A) Enrichment results of the top five positively and negatively correlated pathways in sarcopenia. (B) Intersection of 3,390 DEGs with 251 IPRGs.
Identification of IPRGs and diagnostic biomarkers
A collection of 251 IPRGs was acquired from the MSigDB database and PubMed. These genes intersected with the DEGs, resulting in 37 overlapping IPRGs, which were further examined. Figure 3B shows the 37 IPRGs in a Venn diagram. The expression profiles of 37 IPRGs were used to build the LASSO model. As shown in Figure 4A, the optimal λ value, which minimized classification errors, was determined. Based on this λ value, the LASSO coefficient spectrum of DEGs was analyzed (Figure 4B). Subsequently, 6 hub genes with nonzero coefficients were identified: GPC3, CYCS, FOXO3, SCN1B, AQP9, and BTG2.
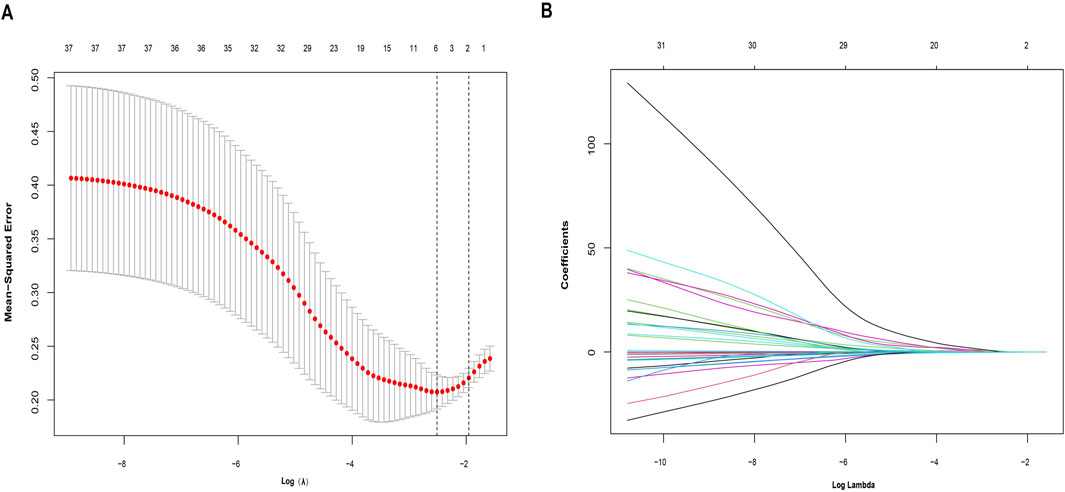
Figure 4. Identification of potential hub genes for sarcopenia using the LASSO regression model. (A) Selection of the optimal parameter for nonzero coefficients in the LASSO model. (B) Coefficient selection for the 6 hub genes based on LASSO analysis.
Development and validation of the model for sarcopenia
Based on six diagnostic biomarkers, we developed a nomogram model to predict the onset of sarcopenia (Figure 5A). The model demonstrated promising performance, with an AUC of 0.871 on the training dataset (Figure 5B) and an AUC of 0.825 on the test dataset (Figure 5C). The high AUC values suggest that the model may serve as a valuable tool for early diagnosis of sarcopenia, potentially aiding clinicians in identifying at-risk patients before significant muscle loss occurs. These results indicate that our nomogram model exhibits high classification accuracy. Our study successfully constructed a diagnostic model for sarcopenia using the differential gene expression of these six biomarkers. The reliability of the nomogram model’s predictions is supported by the calibration curves (Figures 6A, B). Additionally, the Decision Curve Analysis (DCA) curve (Figures 6C, D) suggests that the model’s decisions may offer additional benefits for sarcopenia patients. We also plotted ROC curves for each of the six target genes individually (Figure 7). The results revealed that all six key genes had predicted AUCs >0.6, indicating their ability to successfully distinguish between sarcopenia and normal samples.
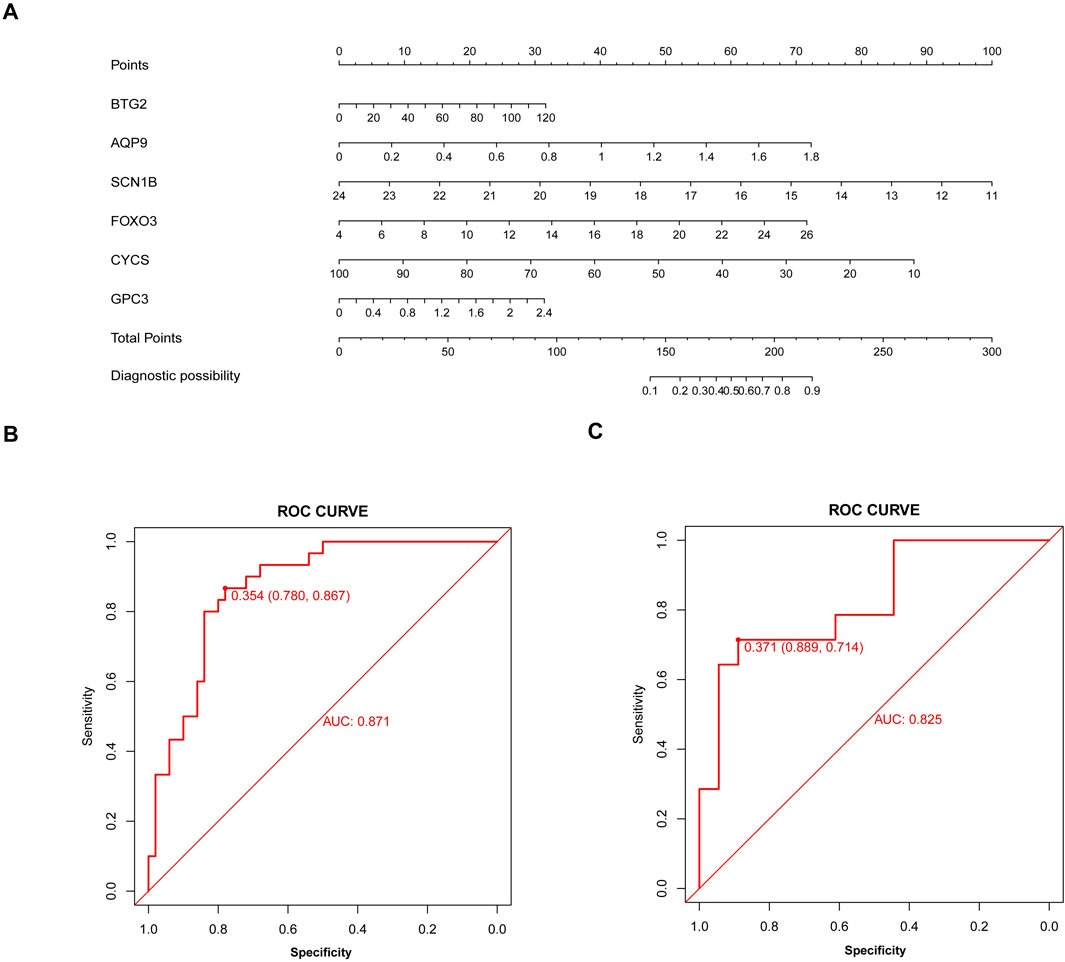
Figure 5. Nomogram model for sarcopenia. (A) Construction of the nomogram model based on six inflammation and pyroptosis-related genes (IPRGs). (B) Receiver operating characteristic (ROC) curve for the nomogram diagnostic model of sarcopenia. (C) ROC curve of the nomogram diagnostic model in the validation cohort.
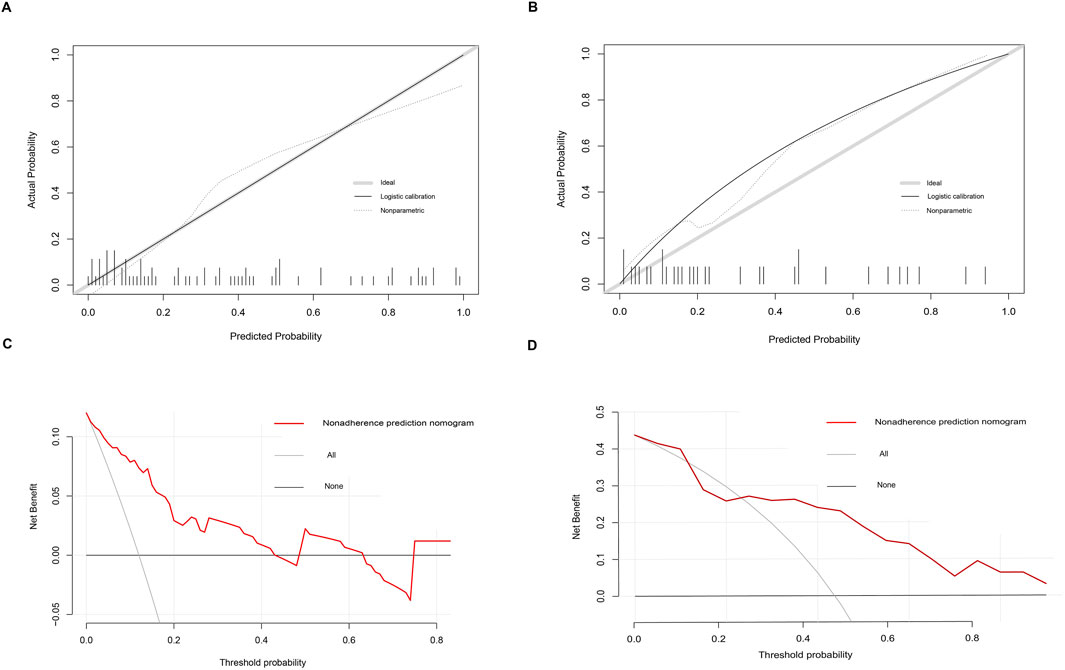
Figure 6. Calibration and decision curves for the nomogram model of sarcopenia. (A, B) Calibration curves showing the predictive ability of the nomogram model using the training and validation datasets. (C, D) Decision curve analysis (DCA) of the nomogram model using the training and validation datasets.
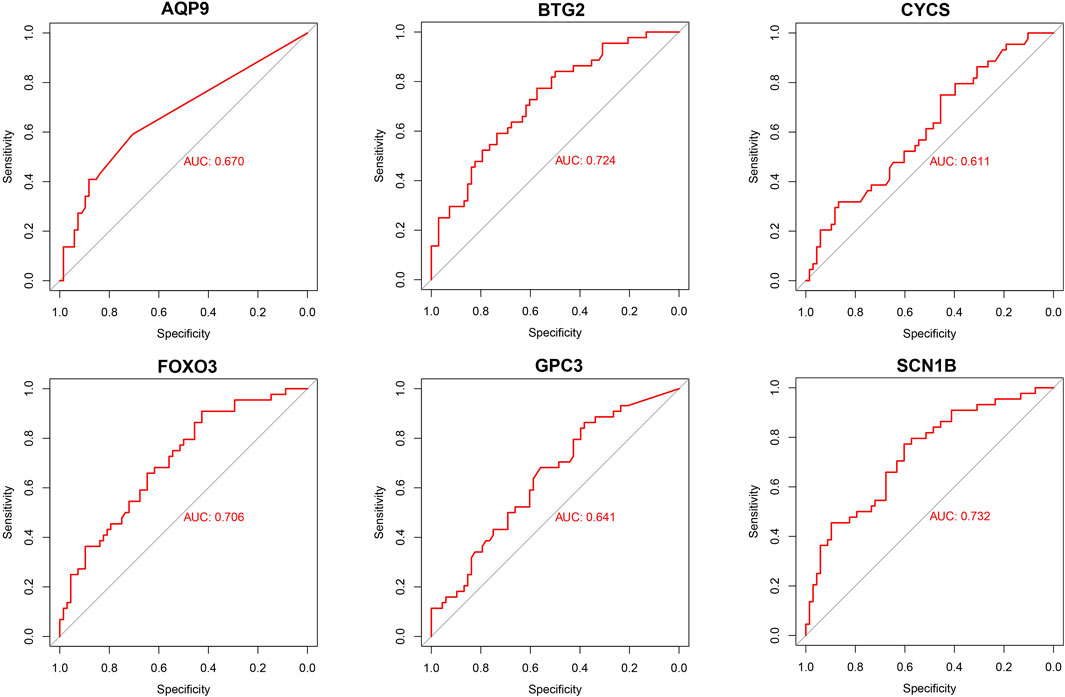
Figure 7. Validation of diagnostic validity for six diagnostic markers. ROC curves for GPC3, CYCS, FOXO3, SCN1B, AQP9, and BTG2 in the combined dataset.
Infiltration analysis of immune cells
To further investigate immune cell infiltration between sarcopenia patients and healthy controls, we used ssGSEA to evaluate the enrichment scores of different immune cell subsets. The results were visualized using a heatmap (Figure 8A) and violin plots (Figure 8B). Elevated levels of eosinophils, mast cells, monocytes, and natural killer cells were observed in sarcopenia patients, whereas levels of γδT cells, macrophages, natural killer T cells, and effector memory CD4 T cells were decreased. Additionally, we analyzed the association of six characteristic genes with immune cells (Figure 8C). Notably, FOXO3 showed a strong positive correlation with several immune cells, including monocytes, mast cells, and activated dendritic cells, and a strong negative correlation with other immune cells, including type 2 T helper cells, macrophages, γδT cells, and effector memory CD4 T cells.
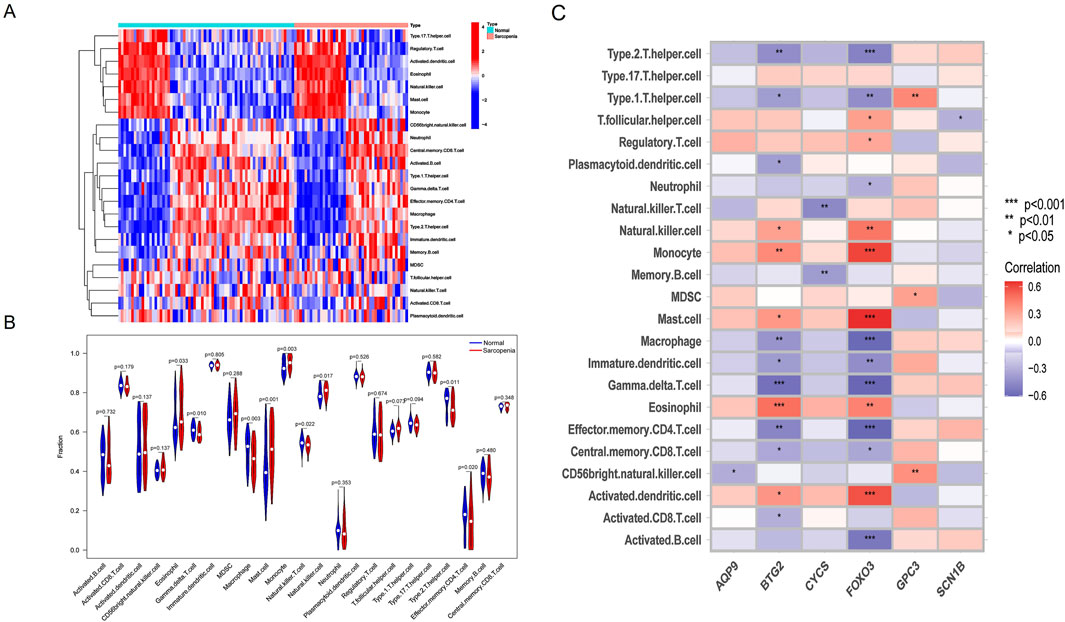
Figure 8. Immune cell infiltration differences between sarcopenia patients and healthy controls. (A) Heatmap showing the correlation between all DEGs and immune cells. (B) Violin plots comparing immune cell expression between normal and sarcopenia groups. (C) Correlation analysis between the six hub genes and immune cells.
Validation of feature genes using RT-qPCR analysis
To verify the expression of the six characteristic genes in sarcopenia, we constructed a muscle atrophy cell model. RT-qPCR results indicated that, compared to the control group, the muscle atrophy markers Atrogin-1 and Murf-1 were significantly upregulated, confirming the successful establishment of the muscle atrophy cell model (Figure 9A). In this model, RT-qPCR analysis revealed that three characteristic genes (BTG2, FOXO3, and AQP9) were highly expressed compared to the control (Figure 9B). Conversely, three other characteristic genes (GPC3, CYCS, and SCN1B) were significantly downregulated in the muscle atrophy cells relative to the control (Figure 9C).
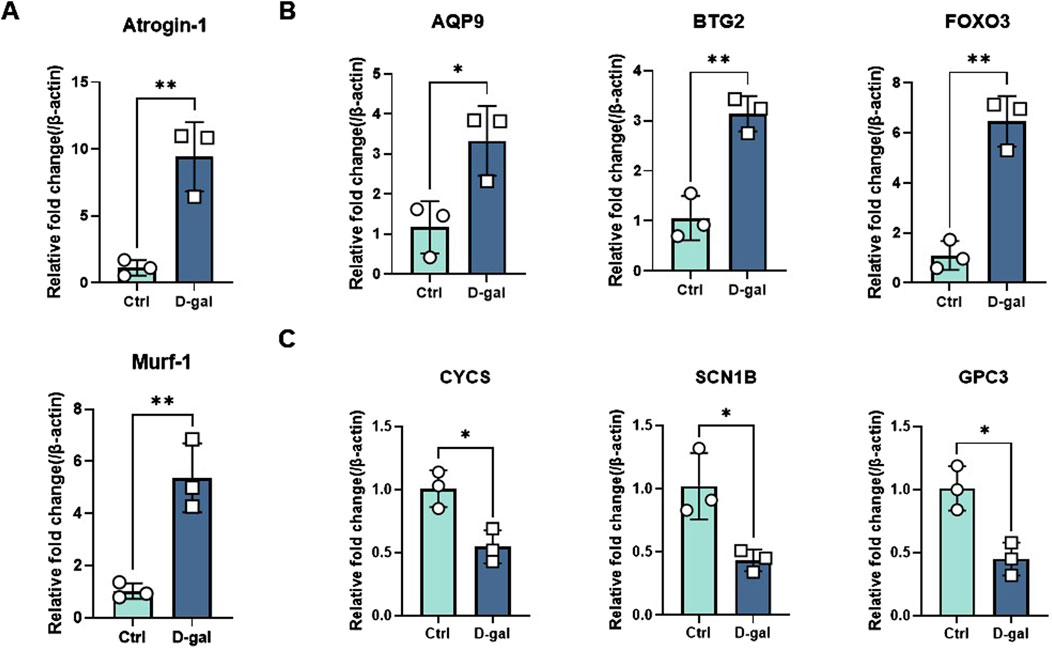
Figure 9. Evaluation of characteristic gene expression in muscle atrophy cells by RT-qPCR. (A) Marker genes for muscle atrophy. (B, C) Expression of elevated and decreased genes in sarcopenia cell models. Significant differences between groups were assessed using Student’s t-test. Data are presented as mean ± SD (*p < 0.05, **p < 0.01, ***p < 0.001, ****p < 0.0001).
Discussion
Sarcopenia has emerged as a significant health concern due to an aging population; thus, early diagnosis of muscular atrophy has become imperative. In recent years, accurately predicting sarcopenia through screening relevant genes as diagnostic biomarkers has gained critical importance.
Although the pathogenesis of musculoskeletal aging is not fully understood, inflammation, pyroptosis, and immune infiltration in skeletal muscle cells are believed to play significant roles in its molecular mechanisms. Recent studies have indicated that the NLRP3 inflammasome and pyroptosis contribute to muscle dysfunction by reducing glycolytic potential and decreasing muscle fiber size (McBride et al., 2017). Additionally, chronic inflammation is linked to key characteristics of sarcopenia, such as increased skeletal muscle wasting, loss of strength, and functional impairment (Dalle et al., 2017; Picca and Calvani, 2021). Therefore, we hypothesize that inflammation and pyroptosis may be central mechanisms in musculoskeletal aging. To date, no studies have specifically explored the relationship between inflammation and pyroptosis in sarcopenia.
In this study, we developed and validated a predictive model for sarcopenia through bioinformatics analysis, which led to the identification of potential biomarkers. These findings are further supported by the confirmation of these biomarkers in follow-up experiments. Our study identified potential biomarkers for sarcopenia using LASSO analysis and experimental validation.
Firstly, we identified DEGs in the combined dataset through differential expression analysis. Next, we applied a LASSO regression model to 37 common genes related to inflammation and pyroptosis to screen for potential hub genes closely associated with the development of sarcopenia. GO enrichment analysis revealed that these DEGs are primarily involved in oxidative and metabolic processes within mitochondria. KEGG pathway enrichment analysis also indicated that these DEGs are strongly linked to pathways associated with various neurodegenerative diseases. Previous studies have shown that aging leads to gradual disorders in the neuromuscular system (Rosenberg, 1997). The neuromuscular junction (NMJ), a central component of this system, is a crucial synapse connecting motor nervous system excitability with skeletal muscle contraction (Ibebunjo et al., 2013; Rudolf et al., 2014; Punga and Ruegg, 2012). Recent research has increasingly highlighted the NMJ’s role in sarcopenia development (Gonzalez-Freire et al., 2014; Pannérec et al., 2016; Monti et al., 2021). On one hand, the NMJ is rich in mitochondria that supply the energy needed for neuromuscular transmission in the form of ATP (Anagnostou and Hepple, 2020; Zhou, 2021; Spendiff et al., 2016). On the other hand, mitochondria depend on PGC-1α as a cofactor for their transcriptional activities and normal metabolic functions (Austin and St-Pierre, 2012; St-Pierre et al., 2006). Furthermore, correlation analyses of the six hub genes with immune cells revealed strong associations with monocytes, macrophages, and mast cells, consistent with observations from DEGs and immune cell correlation analyses. In 2021, Afandy et al. found significantly higher MCP-1 levels in the sarcopenia group compared to the non-sarcopenia group (Afandy et al., 2021). MCP-1 promotes the migration and infiltration of monocytes to inflammation sites, contributing to muscle atrophy (Franceschi and Campisi, 2014; Bettcher et al., 2019; Curtis et al., 2015; Sell et al., 2006). Several studies have demonstrated that macrophages play a role in the regeneration and repair of aging-associated skeletal muscle (Sell et al., 2006; Sousa-Victor et al., 2015; Tidball, 2017; Fuchs and Blau, 2020; Zhang et al., 2020), exerting anti-inflammatory effects, clearing dead cells, and facilitating tissue repair through altered polarization states (Tidball, 2017; Fuchs and Blau, 2020). Additionally, a study revealed a significant increase in mast cells in the skeletal muscle of mice with malignant disease (Widner et al., 2021). These findings are consistent with our correlation analysis results.
The highlight of our study is the identification of six potential diagnostic markers for sarcopenia: BTG2, FOXO3, AQP9, SCN1B, CYCS, and GPC3.
Protein BTG2, also known as B-cell translocation gene 2, BTG family member 2, NGF-inducible anti-proliferative protein PC3, or NGF-inducible protein TIS21, plays a crucial role in regulating cell senescence, differentiation, and various other biological processes (Mauxion et al., 2009; Wheaton et al., 2010; Passeri et al., 2006). It can be induced by p53 to inhibit the cell cycle (Zhang et al., 2011), and its expression can be upregulated by stimuli such as IL-6 and growth factors (Yuniati et al., 2019). Previous studies have shown that miR-103-3p and miR-222-3p may influence the proliferation and differentiation of C2C12 myoblasts by targeting BTG2 (He et al., 2023; Yang et al., 2019). Peng et al. demonstrated that BTG2 could be a target for muscle aging by regulating MuSCs senescence (Peng et al., 2023). Our findings that BTG2 expression is significantly increased in the muscle atrophy group align with these studies, although the precise mechanism by which BTG2 regulates muscle atrophy requires further investigation.
FOXO family proteins, which are known for their highly conserved structural domains, are involved in crucial intracellular processes, including cell cycle regulation, oxidative stress response, inflammation, apoptosis, and energy metabolism (Dijkers et al., 2000a; Medema et al., 2000; Furukawa-Hibi et al., 2002; Kops et al., 2002; Ogg et al., 1997; Brunet et al., 1999; Dijkers et al., 2000b; Li et al., 2010). In mammals, the primary FOXO family members are FOXO1, FOXO3, FOXO4, and FOXO6 (Cao et al., 2023). Notably, FOXO3 is predominantly expressed in skeletal muscle (Curtis et al., 2015). Numerous studies have demonstrated that FOXO3 enhances the expression of atrogin-1 and MuRF1 through the IGF1-PI3K-AKT signaling pathway, leading to muscle atrophy (Sandri et al., 2004; Kamei et al., 2004; Southgate et al., 2009; Liu et al., 2007; Schiaffino et al., 2013). Additionally, activation of AMPK has been shown to promote muscle atrophy by increasing FOXO3 expression (Romanello et al., 2010; Nakashima and Yakabe, 2007; Sanchez et al., 2012). Interestingly, oxidative stress induction contributes to the activation of FOXO3 in models of disuse-mediated muscle atrophy (Suzuki et al., 2007; Piétri-Rouxel et al., 2010; Levine et al., 2008). It has also been reported that PGC-1α can work in conjunction with FOXO3 to mitigate muscle atrophy (Puigserver et al., 2003; Wu et al., 1999; Geng et al., 2011; Wenz et al., 2009). Aquaporins (AQPs) are a class of membrane channel proteins classified into water-selective channel proteins and aquaglyceroporins (Agre, 2004; Ishibashi et al., 1997; Ishibashi et al., 1998; Kishida et al., 2000). As a member of the latter group, AQP9 is primarily expressed in hepatocytes and plays a crucial role in gluconeogenesis and lipid metabolism by transporting glycerol (Trinchese et al., 2023; Inoue et al., 2009). Yang et al. first identified AQP9 expression in rat skeletal muscle in 2000 (Leek et al., 2012), with subsequent studies by Wang et al. and Inoue et al. confirming its presence in human skeletal muscle as well (Inoue et al., 2009; Yang et al., 2000; Wang et al., 2003). Although no reports have yet linked AQP9 directly to muscle atrophy, the skeletal muscle, as the largest endocrine organ in the body, also exhibits glycerol kinase activity (Inoue et al., 2009). Ren et al. suggested that the PI3K-AKT signaling pathway inhibits AQP9 (Ren and Wang, 2018), hinting at a potentially unexplored relationship between AQP9 and muscle atrophy that merits further investigation.
SCN1B, encoding the β1 and β1B subunits of voltage-gated sodium channels, is implicated in epilepsy and arrhythmia syndromes (O'Malley and Isom, 2015; Cervantes et al., 2022). It is widely recognized that muscle strength is influenced by both skeletal muscle and neurological factors (Arnold and Clark, 2023). The neuromuscular junction plays a critical role by converting electrical signals from presynaptic neurons into chemical signals that trigger muscle fiber contraction. Thus, SCN1B may impact muscle force production by regulating sodium influx and action potential generation. There is a clear positive relationship between SCN1B and muscle strength, consistent with our findings.
CYCS encodes cytochrome c, a mitochondrial membrane protein crucial for oxidative phosphorylation and apoptosis (Earnshaw, 1999; Liu et al., 1996; Kluck et al., 1997; Zou et al., 1997). Huang et al. demonstrated that overexpression of Mdfi (Myod family inhibitor) increased CYCS expression, promoting differentiation in C2C12 cells (Huang et al., 2021). Conversely, Kan et al. observed a significant decrease in CYCS expression with skeletal muscle aging (Kan et al., 2021). Baechler et al. identified that mitochondrial autophagy can activate CYCS to support myogenic differentiation (Baechler et al., 2019). These studies collectively highlight a strong association between CYCS and sarcopenia, although the underlying mechanisms warrant further investigation.
GPC3, a member of the glypican family, is typically expressed in embryonic tissues and various organs, and is notably overexpressed in hepatocellular carcinoma (Zhou et al., 2018; Wang et al., 2014; Xu et al., 2021; Qin et al., 2020). A study published in 2014 showed that GPC3 expression decreases with age in mouse skeletal muscle (Jones et al., 2014). However, our study did not find a significant difference in GPC3 expression between sarcopenia and control groups. This discrepancy may be due to the limited sample size; we plan to expand our sample and validate these results in future experiments and additional models.
In summary, our study developed and validated a risk-prediction model for sarcopenia, offering a precise biological tool for diagnosing sarcopenia in primary healthcare settings. By accurately identifying these potential biomarkers, the model aims to reduce instances of missed and misdiagnosed sarcopenia, thereby allowing for timely early intervention.
Conclusion
In this study, we identified correlations between inflammation and pyroptosis-related genes, finding that 37 genes were differentially expressed in the sarcopenia group compared to controls. This indicates a significant interaction between inflammation and pyroptosis in the development of sarcopenia. Through bioinformatics analysis, we screened six IPRGs as potential diagnostic biomarkers for sarcopenia. We then developed a novel nomogram model based on these IPRGs, which demonstrated high diagnostic performance. The ROC curve analysis confirmed the significant predictive value of these biomarkers. Additionally, validation in a sarcopenia cell model supported the reliability of these six characteristic genes, reinforcing their potential as diagnostic biomarkers for sarcopenia.
Materials and methods
Data source and preprocessing
The gene expression profiles in the GSE111016 and GSE167186 datasets derived from bulk RNA sequencing were extracted from the public database GEO (http://www.ncbi.nlm.nih.gov/geo). The two raw datasets were transformed into an expression value matrix using the ‘limma’ package (Ritchie et al., 2015). Batch effects were removed using the “sva” package after merging the two datasets (Leek et al., 2012). The GSE111016 and GSE167186 datasets comprise 44 samples from patients with sarcopenia and 68 from healthy controls. All data were randomly divided into a 70% training dataset and a 30% validation dataset using R analysis software. The training dataset was used to create the screening model, while the validation dataset was used to verify the model’s performance.
Identification of DEGs and IPRGs
DEGs were identified using the ‘limma’ R package with thresholds of |log2FC| > 0.1 and p-value <0.05. The results were visualized using volcano plots and heatmaps created with the “ggplot2” and “pheatmap” R packages. Inflammation-related genes (IRGs) were obtained from the HALLMARK_INFLAMMATORY_RESPONSE gene set in the Molecular Signature Database (MSigDB) (https://www.broadinstitute.org/msigdb) (Liberzon et al., 2015). Pyroptosis-related genes (PRGs) were collected from a previous study (Ye et al., 2021). After merging IRGs and PRGs, their intersection with DEGs was defined as IPRGs.
Screening biomarkers and construction of the diagnostic nomogram model
Based on IPRGs, LASSO regression analysis was performed using R software package “glmnet” (Friedman et al., 2010) to identify key genes related to sarcopenia.
Based on the selected musculoskeletal aging candidate biomarkers, we used the R package ‘rms’ to predict the prevalence of sarcopenia and construct a new diagnostic nomogram model. This model is based on a logistic regression framework, where gene score assessments predict the probability of sarcopenia. Calibration curves were plotted to evaluate the consistency between predicted and actual values. Additionally, Decision Curve Analysis (DCA) was performed to assess the clinical benefit of the nomogram model’s decisions for patients.
Evaluation and verification of nomogram model
The ROC curve was generated using the R package “pROC”, and the AUC was calculated to evaluate the diagnostic performance of the novel model. Additionally, the AUC and confidence interval (CI) were used to validate the model’s efficiency.
Functional enrichment analysis and GSEA
To further elucidate the characteristic biological properties of DEGs, we conducted functional enrichment analysis using the “clusterProfiler” package in R (Yu et al., 2012) This analysis included Gene Ontology (GO) and Kyoto Encyclopedia of Genes and Genomes (KEGG) pathway analyses. GO terms were categorized into three categories: molecular function (MF), biological process (BP), and cellular component (CC). Items with a corrected p-value <0.05 were considered significantly enriched among the candidate genes (CGs). Bubble plots and bar charts were created using the “ggplot2” and “enrichplot” packages in R to visualize the KEGG enrichment analysis of CGs. GSEA is a computational method used to determine whether predefined gene sets exhibit statistical differences between two biological states. It is commonly employed to assess changes in expression, biological processes, pathways, and activities within dataset samples (Subramanian et al., 2005). To investigate differences in biological processes between the two sample groups, enrichment analysis and visualization were performed using the GSEA method in the “clusterProfiler” package in R, based on the gene expression profile dataset. Adjusted p-values <0.05 were considered statistically significant.
Infiltration analysis of immune cells
The infiltration scores of immune cells and the activity of immune functions in the healthy and sarcopenia groups were calculated using single-sample Gene Set Enrichment Analysis (ssGSEA) with the “gsva” R package (Park et al., 2019). These results were visualized using heatmaps generated with the “pheatmap” package (Dailey, 2017). To compare and visualize the proportion of infiltrating immune cells between healthy and sarcopenia samples, violin plots were created using the ‘ggpubr’ R package (Hu, 2020).
Construction of muscular atrophy cell model
Murine C2C12 myoblasts, obtained from ATCC, were cultured at 37°C with 5% CO2 in DMEM supplemented with 80 U/mL penicillin, 0.08 mg/mL streptomycin, and 10% fetal bovine serum (Gibco, United States). To induce differentiation into myotubes, sub-confluent myoblasts were transferred to DMEM containing 2% horse serum (Biological Industries, Israel) and cultured for 4–6 days (Wang et al., 2021). To construct a cellular model of sarcopenia, mature myotubes were treated with varying concentrations of D-gal (20 g/L, Sigma, United States) for 24 h (Yang et al., 2021).
Real-time fluorescence quantitative PCR
Total RNA was extracted from C2C12 myotube samples using the Total RNA Extraction Kit (TIANGEN, China). Complementary DNA (cDNA) synthesis was carried out with the PrimeScript™ RT reagent Kit (Perfect Real Time) (Takara, Japan). Quantitative real-time PCR was conducted with Maxima SYBR Green/ROX qPCR Master Mix (2X) (Thermo Scientific, United States) on the LightCycler480 system (LightCycler, United States). Relative gene expression levels were determined by the 2−ΔΔCT method, using beta-actin (β-actin) as the internal control. Primer sequences are listed in Supplementary Table S1.
Statistical analysis
The statistical analysis was performed using R software (version4.2.0) and GraphPad Prism (Version 9.0). Continuous variables were expressed as mean ± SD or median (quartile). The Student’s t-test and Mann–Whitney test were used to compare continuous variables with and without normal distribution, respectively. Categorical variables were presented as counts (percentages) and analyzed using the chi-square test. All statistical p-values were two-sided, with p < 0.05 considered statistically significant.
Data availability statement
The original contributions presented in the study are included in the article/Supplementary Material, further inquiries can be directed to the corresponding authors.
Author contributions
XLi: Conceptualization, Data curation, Formal Analysis, Methodology, Validation, Writing–original draft. CW: Conceptualization, Validation, Writing–review and editing. XLu: Conceptualization, Methodology, Writing–review and editing. LW: Conceptualization, Funding acquisition, Writing–review and editing.
Funding
The author(s) declare that financial support was received for the research, authorship, and/or publication of this article. This work was supported by the Scientific Research Project on Elderly Health of Jiangsu Provincial Healthcare Commission (No. LKM2024013 to LW).
Conflict of interest
The authors declare that the research was conducted in the absence of any commercial or financial relationships that could be construed as a potential conflict of interest.
Publisher’s note
All claims expressed in this article are solely those of the authors and do not necessarily represent those of their affiliated organizations, or those of the publisher, the editors and the reviewers. Any product that may be evaluated in this article, or claim that may be made by its manufacturer, is not guaranteed or endorsed by the publisher.
Supplementary material
The Supplementary Material for this article can be found online at: https://www.frontiersin.org/articles/10.3389/fgene.2024.1491577/full#supplementary-material
References
Afandy, N. O., Lock, H. S., Tay, L., Yeo, A., Yew, S., Leung, B. P., et al. (2021). Association of monocyte chemotactic protein-1 and dickkopf-1 with body composition and physical performance in community-dwelling older adults in Singapore. J. Frailty Sarcopenia Falls 6 (1), 25–31. doi:10.22540/JFSF-06-025
Agre, P. (2004). Nobel Lecture. Aquaporin water channels. Biosci. Rep. 24 (3), 127–163. doi:10.1007/s10540-005-2577-2
Anagnostou, M. E., and Hepple, R. T. (2020). Mitochondrial mechanisms of neuromuscular junction degeneration with aging. Cells 9 (1), 197. doi:10.3390/cells9010197
Arnold, W. D., and Clark, B. C. (2023). Neuromuscular junction transmission failure in aging and sarcopenia: the nexus of the neurological and muscular systems. Ageing Res. Rev. 89, 101966. doi:10.1016/j.arr.2023.101966
Austin, S., and St-Pierre, J. (2012). PGC1α and mitochondrial metabolism--emerging concepts and relevance in ageing and neurodegenerative disorders. J. Cell Sci. 125 (Pt 21), 4963–4971. doi:10.1242/jcs.113662
Baechler, B. L., Bloemberg, D., and Quadrilatero, J. (2019). Mitophagy regulates mitochondrial network signaling, oxidative stress, and apoptosis during myoblast differentiation. Autophagy 15 (9), 1606–1619. doi:10.1080/15548627.2019.1591672
Bettcher, B. M., Neuhaus, J., Wynn, M. J., Elahi, F. M., Casaletto, K. B., Saloner, R., et al. (2019). Increases in a pro-inflammatory chemokine, MCP-1, are related to decreases in memory over time. Front. Aging Neurosci. 11, 25. doi:10.3389/fnagi.2019.00025
Brunet, A., Bonni, A., Zigmond, M. J., Lin, M. Z., Juo, P., Hu, L. S., et al. (1999). Akt promotes cell survival by phosphorylating and inhibiting a Forkhead transcription factor. Cell 96 (6), 857–868. doi:10.1016/s0092-8674(00)80595-4
Cao, G., Lin, M., Gu, W., Su, Z., Duan, Y., Song, W., et al. (2023). The rules and regulatory mechanisms of FOXO3 on inflammation, metabolism, cell death and aging in hosts. Life Sci. 328, 121877. doi:10.1016/j.lfs.2023.121877
Cervantes, D. O., Pizzo, E., Ketkar, H., Parambath, S. P., Tang, S., Cianflone, E., et al. (2022). Scn1b expression in the adult mouse heart modulates Na(+) influx in myocytes and reveals a mechanistic link between Na(+) entry and diastolic function. Am. J. Physiol. Heart Circ. Physiol. 322 (6), H975–h993. doi:10.1152/ajpheart.00465.2021
Cruz-Jentoft, A. J., Bahat, G., Bauer, J., Boirie, Y., Bruyère, O., Cederholm, T., et al. (2019). Sarcopenia: revised European consensus on definition and diagnosis. Age Ageing 48 (1), 601–631. doi:10.1093/ageing/afz046
Cruz-Jentoft, A. J., and Sayer, A. A. (2019). Sarcopenia. Lancet 393 (10191), 2636–2646. doi:10.1016/S0140-6736(19)31138-9
Curtis, E., Litwic, A., Cooper, C., and Dennison, E. (2015). Determinants of muscle and bone aging. J. Cell Physiol. 230 (11), 2618–2625. doi:10.1002/jcp.25001
Dailey, A. L. (2017). Metabolomic bioinformatic analysis. Methods Mol. Biol. 1606, 341–352. doi:10.1007/978-1-4939-6990-6_22
Dalle, S., Rossmeislova, L., and Koppo, K. (2017). The role of inflammation in age-related sarcopenia. Front. Physiol. 8, 1045. doi:10.3389/fphys.2017.01045
Dijkers, P. F., Medema, R. H., Lammers, J. W., Koenderman, L., and Coffer, P. J. (2000b). Expression of the pro-apoptotic Bcl-2 family member Bim is regulated by the forkhead transcription factor FKHR-L1. Curr. Biol. 10 (19), 1201–1204. doi:10.1016/s0960-9822(00)00728-4
Dijkers, P. F., Medema, R. H., Pals, C., Banerji, L., Thomas, N. S., Lam, E. W., et al. (2000a). Forkhead transcription factor FKHR-L1 modulates cytokine-dependent transcriptional regulation of p27(KIP1). Mol. Cell Biol. 20 (24), 9138–9148. doi:10.1128/mcb.20.24.9138-9148.2000
Earnshaw, W. C. (1999). Apoptosis. A cellular poison cupboard. Nature 397 (6718), 387, 389–389. doi:10.1038/17015
Franceschi, C., and Campisi, J. (2014). Chronic inflammation (inflammaging) and its potential contribution to age-associated diseases. J. Gerontol. A Biol. Sci. Med. Sci. 69 (Suppl. 1), S4–S9. doi:10.1093/gerona/glu057
Friedman, J., Hastie, T., and Tibshirani, R. (2010). Regularization paths for generalized linear models via coordinate descent. J. Stat. Softw. 33 (1), 1–22.
Fuchs, E., and Blau, H. M. (2020). Tissue stem cells: architects of their niches. Cell Stem Cell 27 (4), 532–556. doi:10.1016/j.stem.2020.09.011
Furukawa-Hibi, Y., Yoshida-Araki, K., Ohta, T., Ikeda, K., and Motoyama, N. (2002). FOXO forkhead transcription factors induce G(2)-M checkpoint in response to oxidative stress. J. Biol. Chem. 277 (30), 26729–26732. doi:10.1074/jbc.C200256200
Geng, T., Li, P., Yin, X., and Yan, Z. (2011). PGC-1α promotes nitric oxide antioxidant defenses and inhibits FOXO signaling against cardiac cachexia in mice. Am. J. Pathol. 178 (4), 1738–1748. doi:10.1016/j.ajpath.2011.01.005
Gonzalez-Freire, M., de Cabo, R., Studenski, S. A., and Ferrucci, L. (2014). The neuromuscular junction: aging at the crossroad between nerves and muscle. Front. Aging Neurosci. 6, 208. doi:10.3389/fnagi.2014.00208
He, Y., Yang, P., Yuan, T., Zhang, L., Yang, G., Jin, J., et al. (2023). miR-103-3p regulates the proliferation and differentiation of C2C12 myoblasts by targeting BTG2. Int. J. Mol. Sci. 24 (20), 15318. doi:10.3390/ijms242015318
Hirata, Y., Nomura, K., Kato, D., Tachibana, Y., Niikura, T., Uchiyama, K., et al. (2022). A Piezo1/KLF15/IL-6 axis mediates immobilization-induced muscle atrophy. J. Clin. Invest. 132 (10), 1–13. doi:10.1172/JCI154611
Hu, K. (2020). Become competent within one day in generating boxplots and violin plots for a novice without prior R experience. Methods Protoc. 3 (4), 64. doi:10.3390/mps3040064
Huang, B., Jiao, Y., Zhu, Y., Ning, Z., Ye, Z., Li, Q. X., et al. (2021). Mdfi promotes C2C12 cell differentiation and positively modulates fast-to-slow-twitch muscle fiber transformation. Front. Cell Dev. Biol. 9, 605875. doi:10.3389/fcell.2021.605875
Ibebunjo, C., Chick, J. M., Kendall, T., Eash, J. K., Li, C., Zhang, Y., et al. (2013). Genomic and proteomic profiling reveals reduced mitochondrial function and disruption of the neuromuscular junction driving rat sarcopenia. Mol. Cell Biol. 33 (2), 194–212. doi:10.1128/MCB.01036-12
Inoue, M., Wakayama, Y., Kojima, H., Shibuya, S., Jimi, T., Hara, H., et al. (2009). Aquaporin 9 expression and its localization in normal skeletal myofiber. J. Mol. Histol. 40 (3), 165–170. doi:10.1007/s10735-009-9226-1
Ishibashi, K., Kuwahara, M., Gu, Y., Kageyama, Y., Tohsaka, A., Suzuki, F., et al. (1997). Cloning and functional expression of a new water channel abundantly expressed in the testis permeable to water, glycerol, and urea. J. Biol. Chem. 272 (33), 20782–20786. doi:10.1074/jbc.272.33.20782
Ishibashi, K., Kuwahara, M., Gu, Y., Tanaka, Y., Marumo, F., and Sasaki, S. (1998). Cloning and functional expression of a new aquaporin (AQP9) abundantly expressed in the peripheral leukocytes permeable to water and urea, but not to glycerol. Biochem. Biophys. Res. Commun. 244 (1), 268–274. doi:10.1006/bbrc.1998.8252
Jones, J. C., Kroscher, K. A., and Dilger, A. C. (2014). Reductions in expression of growth regulating genes in skeletal muscle with age in wild type and myostatin null mice. BMC Physiol. 14, 3. doi:10.1186/1472-6793-14-3
Kamei, Y., Miura, S., Suzuki, M., Kai, Y., Mizukami, J., Taniguchi, T., et al. (2004). Skeletal muscle FOXO1 (FKHR) transgenic mice have less skeletal muscle mass, down-regulated Type I (slow twitch/red muscle) fiber genes, and impaired glycemic control. J. Biol. Chem. 279 (39), 41114–41123. doi:10.1074/jbc.M400674200
Kan, J., Hu, Y., Ge, Y., Zhang, W., Lu, S., Zhao, C., et al. (2021). Declined expressions of vast mitochondria-related genes represented by CYCS and transcription factor ESRRA in skeletal muscle aging. Bioengineered 12 (1), 3485–3502. doi:10.1080/21655979.2021.1948951
Kishida, K., Kuriyama, H., Funahashi, T., Shimomura, I., Kihara, S., Ouchi, N., et al. (2000). Aquaporin adipose, a putative glycerol channel in adipocytes. J. Biol. Chem. 275 (27), 20896–20902. doi:10.1074/jbc.M001119200
Kluck, R. M., Bossy-Wetzel, E., Green, D. R., and Newmeyer, D. D. (1997). The release of cytochrome c from mitochondria: a primary site for Bcl-2 regulation of apoptosis. Science 275 (5303), 1132–1136. doi:10.1126/science.275.5303.1132
Kops, G. J., Dansen, T. B., Polderman, P. E., Saarloos, I., Wirtz, K. W. A., Coffer, P. J., et al. (2002). Forkhead transcription factor FOXO3a protects quiescent cells from oxidative stress. Nature 419 (6904), 316–321. doi:10.1038/nature01036
Leek, J. T., Johnson, W. E., Parker, H. S., Jaffe, A. E., and Storey, J. D. (2012). The sva package for removing batch effects and other unwanted variation in high-throughput experiments. Bioinformatics 28 (6), 882–883. doi:10.1093/bioinformatics/bts034
Levine, S., Nguyen, T., Taylor, N., Friscia, M. E., Budak, M. T., Rothenberg, P., et al. (2008). Rapid disuse atrophy of diaphragm fibers in mechanically ventilated humans. N. Engl. J. Med. 358 (13), 1327–1335. doi:10.1056/NEJMoa070447
Li, C. J., Chang, J. K., Chou, C. H., Wang, G. J., and Ho, M. L. (2010). The PI3K/Akt/FOXO3a/p27Kip1 signaling contributes to anti-inflammatory drug-suppressed proliferation of human osteoblasts. Biochem. Pharmacol. 79 (6), 926–937. doi:10.1016/j.bcp.2009.10.019
Liberzon, A., Birger, C., Thorvaldsdóttir, H., Ghandi, M., Mesirov, J. P., and Tamayo, P. (2015). The Molecular Signatures Database (MSigDB) hallmark gene set collection. Cell Syst. 1 (6), 417–425. doi:10.1016/j.cels.2015.12.004
Liu, C. M., Yang, Z., Liu, C. W., Wang, R., Tien, P., Dale, R., et al. (2007). Effect of RNA oligonucleotide targeting Foxo-1 on muscle growth in normal and cancer cachexia mice. Cancer Gene Ther. 14 (12), 945–952. doi:10.1038/sj.cgt.7701091
Liu, X., Kim, C. N., Yang, J., Jemmerson, R., and Wang, X. (1996). Induction of apoptotic program in cell-free extracts: requirement for dATP and cytochrome c. Cell 86 (1), 147–157. doi:10.1016/s0092-8674(00)80085-9
Mauxion, F., Chen, C. Y. A., Séraphin, B., and Shyu, A. B. (2009). BTG/TOB factors impact deadenylases. Trends Biochem. Sci. 34 (12), 640–647. doi:10.1016/j.tibs.2009.07.008
McBride, M. J., Foley, K. P., D'Souza, D. M., Li, Y. E., Lau, T. C., Hawke, T. J., et al. (2017). The NLRP3 inflammasome contributes to sarcopenia and lower muscle glycolytic potential in old mice. Am. J. Physiol. Endocrinol. Metab. 313 (2), E222-E232–e232. doi:10.1152/ajpendo.00060.2017
Medema, R. H., Kops, G. J., Bos, J. L., and Burgering, B. M. (2000). AFX-like Forkhead transcription factors mediate cell-cycle regulation by Ras and PKB through p27kip1. Nature 404 (6779), 782–787. doi:10.1038/35008115
Monti, E., Reggiani, C., Franchi, M. V., Toniolo, L., Sandri, M., Armani, A., et al. (2021). Neuromuscular junction instability and altered intracellular calcium handling as early determinants of force loss during unloading in humans. J. Physiol. 599 (12), 3037–3061. doi:10.1113/JP281365
Nakashima, K., and Yakabe, Y. (2007). AMPK activation stimulates myofibrillar protein degradation and expression of atrophy-related ubiquitin ligases by increasing FOXO transcription factors in C2C12 myotubes. Biosci. Biotechnol. Biochem. 71 (7), 1650–1656. doi:10.1271/bbb.70057
Ogg, S., Paradis, S., Gottlieb, S., Patterson, G. I., Lee, L., Tissenbaum, H. A., et al. (1997). The Fork head transcription factor DAF-16 transduces insulin-like metabolic and longevity signals in C. elegans. Nature 389 (6654), 994–999. doi:10.1038/40194
O'Malley, H. A., and Isom, L. L. (2015). Sodium channel β subunits: emerging targets in channelopathies. Annu. Rev. Physiol. 77, 481–504. doi:10.1146/annurev-physiol-021014-071846
Pannérec, A., Springer, M., Migliavacca, E., Ireland, A., Piasecki, M., Karaz, S., et al. (2016). A robust neuromuscular system protects rat and human skeletal muscle from sarcopenia. Aging (Albany NY) 8 (4), 712–729. doi:10.18632/aging.100926
Park, T. J., Park, J. H., Lee, G. S., Lee, J. Y., Shin, J. H., Kim, M. W., et al. (2019). Quantitative proteomic analyses reveal that GPX4 downregulation during myocardial infarction contributes to ferroptosis in cardiomyocytes. Cell Death Dis. 10 (11), 835. doi:10.1038/s41419-019-2061-8
Pascual-Fernández, J., Fernández-Montero, A., Córdova-Martínez, A., Pastor, D., Martínez-Rodríguez, A., and Roche, E. (2020). Sarcopenia: molecular pathways and potential targets for intervention. Int. J. Mol. Sci. 21 (22), 8844. doi:10.3390/ijms21228844
Passeri, D., Marcucci, A., Rizzo, G., Billi, M., Panigada, M., Leonardi, L., et al. (2006). Btg2 enhances retinoic acid-induced differentiation by modulating histone H4 methylation and acetylation. Mol. Cell Biol. 26 (13), 5023–5032. doi:10.1128/MCB.01360-05
Peng, B., Chen, Y., Wang, Y., Fu, Y., Zeng, X., Zhou, H., et al. (2023). BTG2 acts as an inducer of muscle stem cell senescence. Biochem. Biophys. Res. Commun. 669, 113–119. doi:10.1016/j.bbrc.2023.05.098
Picca, A., and Calvani, R. (2021). Molecular mechanism and pathogenesis of sarcopenia: an overview. Int. J. Mol. Sci. 22 (6), 3032. doi:10.3390/ijms22063032
Piétri-Rouxel, F., Gentil, C., Vassilopoulos, S., Baas, D., Mouisel, E., Ferry, A., et al. (2010). DHPR alpha1S subunit controls skeletal muscle mass and morphogenesis. Embo J. 29 (3), 643–654. doi:10.1038/emboj.2009.366
Puigserver, P., Rhee, J., Donovan, J., Walkey, C. J., Yoon, J. C., Oriente, F., et al. (2003). Insulin-regulated hepatic gluconeogenesis through FOXO1-PGC-1alpha interaction. Nature 423 (6939), 550–555. doi:10.1038/nature01667
Punga, A. R., and Ruegg, M. A. (2012). Signaling and aging at the neuromuscular synapse: lessons learnt from neuromuscular diseases. Curr. Opin. Pharmacol. 12 (3), 340–346. doi:10.1016/j.coph.2012.02.002
Qin, Y., Cheng, S., Li, Y., Zou, S., Chen, M., Zhu, D., et al. (2020). The development of a Glypican-3-specific binding peptide using in vivo and in vitro two-step phage display screening for the PET imaging of hepatocellular carcinoma. Biomater. Sci. 8 (20), 5656–5665. doi:10.1039/d0bm00943a
Ren, N., and Wang, M. (2018). microRNA-212-induced protection of the heart against myocardial infarction occurs via the interplay between AQP9 and PI3K/Akt signaling pathway. Exp. Cell Res. 370 (2), 531–541. doi:10.1016/j.yexcr.2018.07.018
Ritchie, M. E., Phipson, B., Wu, D., Hu, Y., Law, C. W., Shi, W., et al. (2015). Limma powers differential expression analyses for RNA-sequencing and microarray studies. Nucleic Acids Res. 43 (7), e47. doi:10.1093/nar/gkv007
Romanello, V., Guadagnin, E., Gomes, L., Roder, I., Sandri, C., Petersen, Y., et al. (2010). Mitochondrial fission and remodelling contributes to muscle atrophy. Embo J. 29 (10), 1774–1785. doi:10.1038/emboj.2010.60
Rosenberg, I. H. (1997). Sarcopenia: origins and clinical relevance. J. Nutr. 127 (5 Suppl. l), 990S-991S–991s. doi:10.1093/jn/127.5.990S
Rudolf, R., Khan, M. M., Labeit, S., and Deschenes, M. R. (2014). Degeneration of neuromuscular junction in age and dystrophy. Front. Aging Neurosci. 6, 99. doi:10.3389/fnagi.2014.00099
Sanchez, A. M., Csibi, A., Raibon, A., Cornille, K., Gay, S., Bernardi, H., et al. (2012). AMPK promotes skeletal muscle autophagy through activation of forkhead FoxO3a and interaction with Ulk1. J. Cell Biochem. 113 (2), 695–710. doi:10.1002/jcb.23399
Sandri, M., Sandri, C., Gilbert, A., Skurk, C., Calabria, E., Picard, A., et al. (2004). Foxo transcription factors induce the atrophy-related ubiquitin ligase atrogin-1 and cause skeletal muscle atrophy. Cell 117 (3), 399–412. doi:10.1016/s0092-8674(04)00400-3
Schiaffino, S., Dyar, K. A., Ciciliot, S., Blaauw, B., and Sandri, M. (2013). Mechanisms regulating skeletal muscle growth and atrophy. Febs J. 280 (17), 4294–4314. doi:10.1111/febs.12253
Sell, H., Dietze-Schroeder, D., Kaiser, U., and Eckel, J. (2006). Monocyte chemotactic protein-1 is a potential player in the negative cross-talk between adipose tissue and skeletal muscle. Endocrinology 147 (5), 2458–2467. doi:10.1210/en.2005-0969
Sousa-Victor, P., García-Prat, L., Serrano, A. L., Perdiguero, E., and Muñoz-Cánoves, P. (2015). Muscle stem cell aging: regulation and rejuvenation. Trends Endocrinol. Metab. 26 (6), 287–296. doi:10.1016/j.tem.2015.03.006
Southgate, R. J., Neill, B., Prelovsek, O., El-Osta, A., Kamei, Y., Miura, S., et al. (2009). FOXO1 regulates the expression of 4E-BP1 and inhibits mTOR signaling in mammalian skeletal muscle. J. Biol. Chem. 284 (30), 20440. doi:10.1074/jbc.a702039200
Spendiff, S., Vuda, M., Gouspillou, G., Aare, S., Perez, A., Morais, J. A., et al. (2016). Denervation drives mitochondrial dysfunction in skeletal muscle of octogenarians. J. Physiol. 594 (24), 7361–7379. doi:10.1113/JP272487
St-Pierre, J., Drori, S., Uldry, M., Silvaggi, J. M., Rhee, J., Jäger, S., et al. (2006). Suppression of reactive oxygen species and neurodegeneration by the PGC-1 transcriptional coactivators. Cell 127 (2), 397–408. doi:10.1016/j.cell.2006.09.024
Subramanian, A., Tamayo, P., Mootha, V. K., Mukherjee, S., Ebert, B. L., Gillette, M. A., et al. (2005). Gene set enrichment analysis: a knowledge-based approach for interpreting genome-wide expression profiles. Proc. Natl. Acad. Sci. U. S. A. 102 (43), 15545–15550. doi:10.1073/pnas.0506580102
Suzuki, N., Motohashi, N., Uezumi, A., Fukada, S. i., Yoshimura, T., Itoyama, Y., et al. (2007). NO production results in suspension-induced muscle atrophy through dislocation of neuronal NOS. J. Clin. Invest. 117 (9), 2468–2476. doi:10.1172/JCI30654
Tidball, J. G. (2017). Regulation of muscle growth and regeneration by the immune system. Nat. Rev. Immunol. 17 (3), 165–178. doi:10.1038/nri.2016.150
Trinchese, G., Gena, P., Cimmino, F., Cavaliere, G., Fogliano, C., Garra, S., et al. (2023). Hepatocyte aquaporins AQP8 and AQP9 are engaged in the hepatic lipid and glucose metabolism modulating the inflammatory and redox state in milk-supplemented rats. Nutrients 15 (16), 3651. doi:10.3390/nu15163651
Wang, L., Jiao, X. F., Wu, C., Li, X. Q., Sun, H. X., Shen, X. Y., et al. (2021). Trimetazidine attenuates dexamethasone-induced muscle atrophy via inhibiting NLRP3/GSDMD pathway-mediated pyroptosis. Cell Death Discov. 7 (1), 251. doi:10.1038/s41420-021-00648-0
Wang, S. K., Zynger, D. L., Hes, O., and Yang, X. J. (2014). Discovery and diagnostic value of a novel oncofetal protein: glypican 3. Adv. Anat. Pathol. 21 (6), 450–460. doi:10.1097/PAP.0000000000000043
Wang, W., Hart, P. S., Piesco, N. P., Lu, X., Gorry, M. C., and Hart, T. C. (2003). Aquaporin expression in developing human teeth and selected orofacial tissues. Calcif. Tissue Int. 72 (3), 222–227. doi:10.1007/s00223-002-1014-9
Wenz, T., Rossi, S. G., Rotundo, R. L., Spiegelman, B. M., and Moraes, C. T. (2009). Increased muscle PGC-1alpha expression protects from sarcopenia and metabolic disease during aging. Proc. Natl. Acad. Sci. U. S. A. 106 (48), 20405–20410. doi:10.1073/pnas.0911570106
Wheaton, K., Muir, J., Ma, W., and Benchimol, S. (2010). BTG2 antagonizes Pin1 in response to mitogens and telomere disruption during replicative senescence. Aging Cell 9 (5), 747–760. doi:10.1111/j.1474-9726.2010.00601.x
Widner, D. B., Liu, C., Zhao, Q., Sharp, S., Eber, M. R., Park, S. H., et al. (2021). Activated mast cells in skeletal muscle can be a potential mediator for cancer-associated cachexia. J. Cachexia Sarcopenia Muscle 12 (4), 1079–1097. doi:10.1002/jcsm.12714
Wu, Z., Puigserver, P., Andersson, U., Zhang, C., Adelmant, G., Mootha, V., et al. (1999). Mechanisms controlling mitochondrial biogenesis and respiration through the thermogenic coactivator PGC-1. Cell 98 (1), 115–124. doi:10.1016/S0092-8674(00)80611-X
Xu, H., Tang, Y., Zhao, Y., Wang, F., Gao, X., Deng, D., et al. (2021). SPECT imaging of hepatocellular carcinoma detection by the GPC3 receptor. Mol. Pharm. 18 (5), 2082–2090. doi:10.1021/acs.molpharmaceut.1c00060
Yang, B., Verbavatz, J. M., Song, Y., Vetrivel, L., Manley, G., Kao, W. M., et al. (2000). Skeletal muscle function and water permeability in aquaporin-4 deficient mice. Am. J. Physiol. Cell Physiol. 278 (6), C1108–C1115. doi:10.1152/ajpcell.2000.278.6.C1108
Yang, D. L., Gan, M. L., Tan, Y., Ge, G. H., Li, Q., Jiang, Y. Z., et al. (2019). MiR-222-3р regulates the proliferation and differentiation of C2C12 myoblasts by targeting BTG2. Mol. Biol. Mosk. 53 (1), 44–52. doi:10.1134/S002689841901018X
Yang, Y. F., Yang, W., Liao, Z. Y., Wu, Y. X., Fan, Z., Guo, A., et al. (2021). MICU3 regulates mitochondrial Ca(2+)-dependent antioxidant response in skeletal muscle aging. Cell Death Dis. 12 (12), 1115. doi:10.1038/s41419-021-04400-5
Ye, Y., Dai, Q., and Qi, H. (2021). A novel defined pyroptosis-related gene signature for predicting the prognosis of ovarian cancer. Cell Death Discov. 7 (1), 71. doi:10.1038/s41420-021-00451-x
You, Z., Huang, X., Xiang, Y., Dai, J., Xu, L., Jiang, J., et al. (2023). Ablation of NLRP3 inflammasome attenuates muscle atrophy via inhibiting pyroptosis, proteolysis and apoptosis following denervation. Theranostics 13 (1), 374–390. doi:10.7150/thno.74831
Yu, G., Wang, L. G., Han, Y., and He, Q. Y. (2012). clusterProfiler: an R package for comparing biological themes among gene clusters. Omics 16 (5), 284–287. doi:10.1089/omi.2011.0118
Yuniati, L., Scheijen, B., van der Meer, L. T., and van Leeuwen, F. N. (2019). Tumor suppressors BTG1 and BTG2: beyond growth control. J. Cell Physiol. 234 (5), 5379–5389. doi:10.1002/jcp.27407
Zembron-Lacny, A., Dziubek, W., Wolny-Rokicka, E., Dabrowska, G., and Wozniewski, M. (2019). The relation of inflammaging with skeletal muscle properties in elderly men. Am. J. Mens. Health 13 (2), 1557988319841934. doi:10.1177/1557988319841934
Zhang, C., Cheng, N., Qiao, B., Zhang, F., Wu, J., Liu, C., et al. (2020). Age-related decline of interferon-gamma responses in macrophage impairs satellite cell proliferation and regeneration. J. Cachexia Sarcopenia Muscle 11 (5), 1291–1305. doi:10.1002/jcsm.12584
Zhang, Z., Chen, C., Wang, G., Yang, Z., San, J., Zheng, J., et al. (2011). Aberrant expression of the p53-inducible antiproliferative gene BTG2 in hepatocellular carcinoma is associated with overexpression of the cell cycle-related proteins. Cell Biochem. Biophys. 61 (1), 83–91. doi:10.1007/s12013-011-9164-x
Zhou, F., Shang, W., Yu, X., and Tian, J. (2018). Glypican-3: a promising biomarker for hepatocellular carcinoma diagnosis and treatment. Med. Res. Rev. 38 (2), 741–767. doi:10.1002/med.21455
Zhou, J. (2021). Ca(2+)-mediated coupling between neuromuscular junction and mitochondria in skeletal muscle. Neurosci. Lett. 754, 135899. doi:10.1016/j.neulet.2021.135899
Keywords: inflammation and pyroptosis-related genes, sarcopenia, LASSO, nomogram model, predictive model
Citation: Li X, Wu C, Lu X and Wang L (2024) Predictive models of sarcopenia based on inflammation and pyroptosis-related genes. Front. Genet. 15:1491577. doi: 10.3389/fgene.2024.1491577
Received: 05 September 2024; Accepted: 05 December 2024;
Published: 24 December 2024.
Edited by:
Serena Dato, University of Calabria, ItalyReviewed by:
Bruno A. Cisterna, Augusta University, United StatesJunying Xu, Wuxi People’s Hospital, China
Copyright © 2024 Li, Wu, Lu and Wang. This is an open-access article distributed under the terms of the Creative Commons Attribution License (CC BY). The use, distribution or reproduction in other forums is permitted, provided the original author(s) and the copyright owner(s) are credited and that the original publication in this journal is cited, in accordance with accepted academic practice. No use, distribution or reproduction is permitted which does not comply with these terms.
*Correspondence: Li Wang, d2xzcy0xMjNAMTYzLmNvbQ==; Xiang Lu, bHV4aWFuZzY2QG5qbXUuZWR1LmNu
 Xiaoqing Li1
 Cheng Wu
 Li Wang