- 1Laboratory for Translational Genomic Bioinformatics, Moscow Institute of Physics and Technology, Dolgoprudny, Russia
- 2Moscow Center for Advanced Studies, Moscow, Russia
- 3Laboratory of Bioinformatics, Endocrinology Research Center, Moscow, Russia
- 4Laboratory of Clinical and Genomic Bioinformatics, I. M. Sechenov First Moscow State Medical University, Moscow, Russia
- 5Laboratory of Systems Biology, Shemyakin-Ovchinnikov Institute of Bioorganic Chemistry, Moscow, Russia
- 6Oncobox Ltd., Moscow, Russia
- 7PathoBiology Group, European Organization for Research and Treatment of Cancer (EORTC), Brussels, Belgium
Introduction: The differential ratio of nonsynonymous to synonymous nucleotide substitutions (dN/dS) is a common measure of the rate of structural evolution in proteincoding genes. In addition, we recently suggested that the proportion of transposable elements in gene promoters that host functional genomic sites serves as a marker of the rate of regulatory evolution of genes. Such functional genomic regions may include transcription factor binding sites and modified histone binding loci.
Methods: Here, we constructed a model of the human interactome based on 600,136 documented molecular interactions and investigated the overall relationship between the number of interactions of each protein and the rate of structural and regulatory evolution of the corresponding genes.
Results: By evaluating a total of 4,505 human genes and 1,936 molecular pathways we found a general correlation between structural and regulatory evolution rate metrics (Spearman 0.08–0.16 and 0.25–0.37 for gene and pathway levels, respectively, p < 0.01). Further exploration revealed in the established human interactome model lack of correlation between the rate of gene regulatory evolution and the number of protein interactions on gene level, and weak negative correlation (∼0.15) on pathway level. We also found a statistically significant negative correlation between the rate of gene structural evolution and the number of protein interactions (Spearman −0.11 and −0.3 for gene and pathway levels, respectively, p < 0.01).
Discussion: Our result suggests stronger structural rather than regulatory conservation of genes whose protein products have multiple interaction partners.
1 Introduction
The structural evolution of protein-coding genes is currently central to the field of evolutionary genomics. An established method for quantifying the magnitude of evolutionary pressure on protein-coding genes includes estimation of the ratio of nonsynonymous (changing amino acids) to synonymous (not changing) base substitutions in coding codons, known as dN/dS (Jeffares et al., 2015). Specifically, a dN/dS ratio significantly greater than one serves as an indicator of positive Darwinian selection, while a ratio below one indicates purifying selection. In turn, a dN/dS ratio equal or close to one indicates neutral selection. Thus, a higher dN/dS value corresponds to an accelerated rate of gene structural evolution, while a lower value reflects structural conservation of a gene product (Kryazhimskiy and Plotkin, 2008).
Another important aspect of gene evolution is related to functional changes in transcriptional activity. Recently, we have proposed for the first time a Retrospect method that measures the rate of regulatory evolution of genes through relative quantification of the enrichment of gene promoters with functional motifs that map to transposable elements. Such functional motifs can be transcription factor binding sites or modified histone binding loci. Greater association of regulatory modules with transposable elements means faster evolution of gene regulation. In the case of the human genome, Retrospect considers a class of transposable elements called retroelements (REs), which are selfish elements capable of replicating in the genome through reverse transcription (Nikitin et al., 2019C).
REs constitute the vast majority of human transposable elements and occupy about 40% of total human DNA. They can participate in the control of gene expression by providing functional regulatory elements such as alternative promoters, enhancers, silencers, polyadenylation signals and others (Gogvadze and Buzdin, 2009). In particular, about half of all transcription factor binding sites (TFBS) in the human genome are estimated to be associated with REs (Nikitin et al., 2019a). In addition, REs may be involved in chromatin tag rearrangement by converting euchromatic (active) regions to heterochromatic (inactive) regions and vice versa. In general, RE insertions tend to be much less conserved than surrounding genomic regions (Lander et al., 2001) and thus may indicate rapidly evolving regulatory features if they are enriched with functional motifs.
The regulatory influence of REs on individual genes can be measured using a metric called Gene RE-linked Enrichment score (GRE) (Nikitin et al., 2018). This metric can be applied to different types of regulatory elements such as TFBS or chromatin tags. For example, in the case of TFBS analysis, a gene’s GRE score is calculated as the sum of RE-linked TFBS hits mapped in the 10-kb neighborhood of its transcription start site divided by the average number of RE-linked TFBS hits across all genes analyzed. A further modification of this metric, called Normalized Gene RE-linked Enrichment score (NGRE), takes into account the fact that the number of TFBS hits, whether RE-linked or not, can vary greatly between different genes with different regulatory mechanisms. Thus, an NGRE estimate for a gene can be obtained by further normalizing the GRE value by the balanced number of all (not just RE-linked) TFBS hits for that gene. Similarly, GRE and NGRE scores can also be calculated for chromatin tags such as modified histone binding sites (Igolkina et al., 2019).
Another approach is to look at the bigger picture by combining genes at the molecular pathway level. The quantitative measure here is the pathway involvement index (PII), calculated as the average GRE value for all genes involved in the pathway of interest. Similarly, PII can be normalized by the average effect of TFBS or chromatin tags on all genes in the pathway analyzed, yielding a normalized pathway involvement index (NPII). In general, aggregating data at the molecular pathway level improves the overall stability of the data by reducing the bias that can be caused by variations in metrics for individual genes (Borisov et al., 2017).
Previously, for the first time we reported a consistent positive correlation between the rate of structural and regulatory evolution of human protein coding genes and molecular pathways (Zakharova et al., 2023).
In addition, the pathway-level approach can be transferred to the interactome level. In particular, many attempts have been made to investigate the relationship between the evolution of proteins and their properties in the interaction network, such as connectivity. Indeed, it has been shown that the rate of structural evolution of individual proteins is negatively correlated with the number of their interactions in yeast (Fraser et al., 2002). Indeed, intuitively one can expect that genes encoding proteins involved in a large number of molecular interactions should be more evolutionarily conservative, since excessive structural variation in them is more likely to disrupt some of their functional sites that support their downstream interactions. However, this conclusion has been questioned (Bloom and Adami, 2003; Jordan et al., 2003; Batada et al., 2006), and a number of studies (Hahn et al., 2004; Drummond et al., 2006) have reported that the relationship between knot connectivity and evolutionary rate is weak, although significant.
However, to the best of our knowledge, there have been no studies to date examining the regulatory evolution of protein-coding genes in the context of interactome connectivity.
In this paper, we combined the quantitative measures of structural and regulatory evolution described above to characterize the human interactome. We constructed a model of the human interactome based on 600,136 documented molecular interactions and investigated the overall correlation between the number of interactions of each protein and the rate of structural and regulatory evolution of the corresponding genes. We found a general correlation between metrics for the rate of structural and regulatory evolution of genes encoding human proteins for both transcription factor binding sites and histone modification mapping data.
However, no correlation was observed between the rate of regulatory evolution and the number of gene interactions in the human interactome model. In contrast, we found a negative correlation between the rate of structural evolution and the number of gene interactions in the human interactome model, which was more pronounced for the pathway level of data analysis. Taken together, these results suggest structural rather than regulatory conservation of genes whose protein products have multiple interaction partners.
2 Methods
2.1 Genomic retroelement enrichment data
To quantitatively characterize the rates of regulatory evolution of genes, we have previously introduced analytic metrics termed Gene RE-linked Enrichment (GRE) and Normalized RE-linked Enrichment (NGRE) (Nikitin et al., 2018). The GRE score of a gene x characterizes the total number of RE-linked regulatory elements in that gene and is calculated as follows:
where FESx (Feature Enrichment Score) is the number of RE-linked regulatory element alignment hits that were mapped within 10 kb-frame centered at the canonical transcription start site of gene x; n is the total number of genes under analysis, and the denominator is the average FES of all genes under analysis. GRE score is calculated for a single type of a regulatory feature at a time, e.g., for mapped hits of TFBS or of a specific histone tag.
Additional variable GFE (gene feature enrichment) score characterizes gene-specific hits distribution trends, expressed by the formula:
where TFSx is the total number of feature hits mapped in the 10-kb neighborhood of gene x and TFSm is the mean TFS for all genes under investigation (Figure 1).
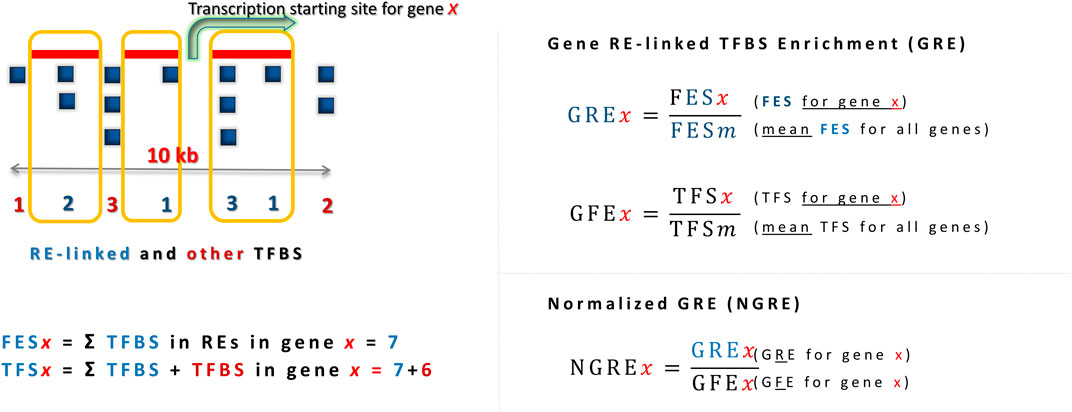
Figure 1. Characterization of regulatory evolution rate at gene-wise level, exemplified for the analysis of TFBS data. Higher GRE reflects greater number of RE-linked TFBS in a gene, higher NGRE - greater proportion of RE-linked TFBS in a gene. RE-linked TFBS are boxed. TFSx (Total Feature Score) is the total number of hits associated with the regulatory feature of interest (both RE-linked and not) mapped within a 10-kb vicinity of the transcription start site of a gene x.
A normalized RE-specific enrichment measure for an individual gene termed NGRE (normalized gene RE-linked enrichment score) was calculated for a gene x as follows:
Relative retroelement enrichment scores for genes (NGRE), which were previously calculated using ChIP-seq profiles of human cell lines, were extracted from our previous published datasets (Igolkina et al., 2019; Nikitin et al., 2019B) for six histone modifications (H3K4me1, H3K4me3, H3K9ac, H3K27ac, H3K27me3, and H3K9me3), and for a total of 563 transcription factor binding sites (TFBSs) in 13 human cell lines (Nikitin et al., 2019a). NGRE reflects the ratio of RE-linked regulatory elements to all regulatory elements in the 10-kb frame centered around the gene canonical transcriptional start site (Nikitin et al., 2018; 2019c; 2019a; Igolkina et al., 2019).
For the analysis at the level of molecular pathways, the Normalized Pathway Involvement Index (NPII) that describes the normalized proportion of RE-associated regulatory features of a given type in pathway member genes, was calculated as follows:
where NGREj is the NGRE of a gene j involved in a pathway p, and k is the total number of genes in this pathway.
2.2 Assessment of structural and functional evolution rates
For the analysis of structural evolution, at the gene-wise level we used dN/dS values for 10,890 common hominid genes extracted from (Scally et al., 2012). For the pathway level of data analysis, we used averaged dN/dS_pw values calculated across all genes participating in the respective pathway, according to our previously published research (Zakharova et al., 2023).
For the analysis of regulatory evolution, we used aggregated NGRE (gene-wise level) and NPII (for pathways) scores. NGRE and NPII were aggregated separately for the different types of biomarkers used: (i) TFBS, (ii) active, and (iii) condensed chromatin marks. Pre-calculated GRE and NGRE values for 10,891 genes in five human cell lines (K562, HepG2, GM12878, MCF-7, HeLa-s3) were taken from our previous studies: for TFBS data (Nikitin et al., 2019b; Zakharova et al., 2023), for H3K4me1 chromatin mark (Nikitin et al., 2019c), and for chromatin marks H3K4me3, H3K9ac, H3K27ac, H3K27me3, and H3K9me3 (Igolkina et al., 2019). For each type of biomarkers, weighted average NGRE profiles (NGREAGG) were calculated among all 5 cell lines under analysis. The weight of a profile i was expressed by the formula
where zi is the proportion of zero/no data values in the profile i. This factor increases importance of more informative profiles in the calculation of an overall evolutionary metric.
2.3 Link between connectivity and evolution
We used our previously published molecular interactions database comprising known protein-protein interactions and metabolic reactions including 293,187 protein-protein and 600,136 total interactions (Zolotovskaia et al., 2022a; 2022b; 2023) to create human interactome model and quantify interactions for 7,483 protein-coding genes.
To create this model, we used molecular architectures of 50,178 different pathways from public databases, uniformly processed (Zolotovskaia et al., 2022b). Complex pathway nodes containing n molecular participants were divided into n nodes with only one participant. Thus, each vertex represents one pathway participant on the graph. We then combined all pathway graphs together based on the coinciding gene products and metabolites.
From all these pathways, we excluded molecular participants which were not connected within the overall network (less than 1% of the initial pathway members). The remaining molecular interactors formed a connected graph.
The model exists as a directed graph where the nodes correspond to gene products and metabolites, and edges represent known pairwise molecular interactions between the nodes (Supplementary Table S1). To assess connectivity on both gene and pathway levels, we utilized data from interactome and OncoboxPD pathway database (Zolotovskaia et al., 2022b; Zakharova et al., 2023). The connectivity of a protein-coding gene was defined as the number of incoming and outcoming edges for the corresponding node. For the comparison of gene connectivity with the NGRE scores and dN/dS, we used intersected gene set where both types of data (connectivity and evolution metrics), were available (Supplementary Figure S1). 12 genes were excluded as outliers by connectivity (Supplementary Figure S2). We obtained 4,505 genes (Supplementary Table S2). The same gene sets were used also for the analysis at the level of molecular pathways (Supplementary Figure S1).
The metric for assessing the connectivity of molecular pathways is the averaged number of interactions per pathway. However, the interactions were taken not from the individual pathway graph, but they were obtained from the reconstructed human whole-interactome model. The number of interactions was then divided by the number of respective genes present in the corresponding pathway. Thus, a normalized measure of interactions per pathway was obtained, which provided an estimate of the interconnectivity and interactions of genes in molecular pathways.
We evaluated connectivity in two ways: considering direct protein-protein interactions and considering all interactions including direct and indirect interactions with proteins, metabolites. Indirect interactions were represented by interactions through auxiliary nodes of biochemical reactions and transport processes.
2.4 Estimating evolutionary rate of molecular pathways
To analyze pathways and estimate their evolutionary rate, we algorithmically constructed molecular pathways based on a model of the human interactome that integrates protein-protein interactions and metabolic reactions (Zolotovskaia et al., 2022b; 2023).
Each molecular pathway was defined by a central gene and its immediate neighbors directly connected in the graph of the interactome. If a neighbor represented a node involved in a known biochemical reaction or transport process, all members of that process were included to maintain process integrity. This resulted in 7,483 molecular pathways. In addition, we took 3,025 classic molecular pathways from OncoboxPD database (Zolotovskaia et al., 2022b).
10,244 of 10,508 pathways contain genes with evolution and interactome data (from the set of 4,505 genes). Then we selected pathways with 10 and more genes and with more than 60% of genes with data available to increase statistic robustness and assess objectively whole molecular pathways. Also, we excluded pathways, which were full duplicates accordingly to their gene composition and pathways with high similarity (Jaccard coefficient >0.7). This resulted in 1936 molecular pathways. All filtration steps are available in Supplementary Figure S1. Duplicated and similar pathways were excluded to avoid false positive results in further correlation analysis due to duplicated values caused by the same or similar gene composition.
For each pathway, structural evolutionary rates were determined by calculating the dN/dS_pw, that is an aggregated dN/dS value for all genes involved in a pathway, averaged to the number of gene products in a pathway, for which dN/dS data were available.
For regulatory evolution, normalized pathway involvement indexes (NPII) that characterize the regulatory evolution were calculated based on NGRE values. NPII values were then calculated for each type of data, and weighted average NPII values were obtained for aggregated TFBS, active and inactive chromatin tags according to (Zakharova et al., 2023).
3 Results
3.1 Design of the study
Using the Retrospect method (Nikitin et al., 2019c), we separately calculated NGRE and NPII scores for sets of (i) TFBS data, (ii) active chromatin tags, and (iii) inactive chromatin tags (Zakharova et al., 2023). Here, H3K4me3, H3K4me1, H3K9ac and H3K27ac histone modifications were recognized as signatures of promoter/enhancer regions and, consequently, marks of the active chromatin. Conversely, H3K27me3 and H3K9me3 were considered as markers of heterochromatin representing transcriptionally silent domains of DNA (Zakharova et al., 2023). In addition, TFBS patterns were indicative of the transcriptional factor binding regulation of genes. We then aggregated the results for each of these groups of raw data and compared the resulting aggregated NGREagg and NPIIagg scores with dN/dS data (gene-wise as well as aggregated at the molecular pathway level).
Using molecular interaction databases, we reconstructed the human interactome, which includes 600,136 total and 293,187 direct protein-protein interactions (Zolotovskaia et al., 2022b) and determined the number of incoming and outgoing interactions for each involved protein. Finally, we compared the obtained estimates of NGRE (gene-level regulatory evolution metric), NPII (pathway-level regulatory evolution metric), and dN/dS (gene- and pathway-level structural evolution metric) with the number of interactions for individual genes or molecular pathways.
3.2 Human oncointeractome model
Presenting overall interactome as a network/graph in addition to providing a useful option for visualization also enables applying mathematical apparatus for graph analysis, such as vertex/node degree, degree distribution, degree sequence, and Brook’s and Vizing’s theorems (Frieze et al., 1988; Karloff, 1989; Misra and Gries, 1992) Here, a vertex/node is the fundamental unit of which graphs are formed (Perfect, 1977).
In our study, we constructed a model of the human interactome (Figure 2) built with 7,483 genes accordingly to (Zolotovskaia et al., 2022b). The total number of interactions was 600,136, of which 293,187 were direct protein-protein interactions. The number of interactions for each gene product is available in Supplementary Table S2.
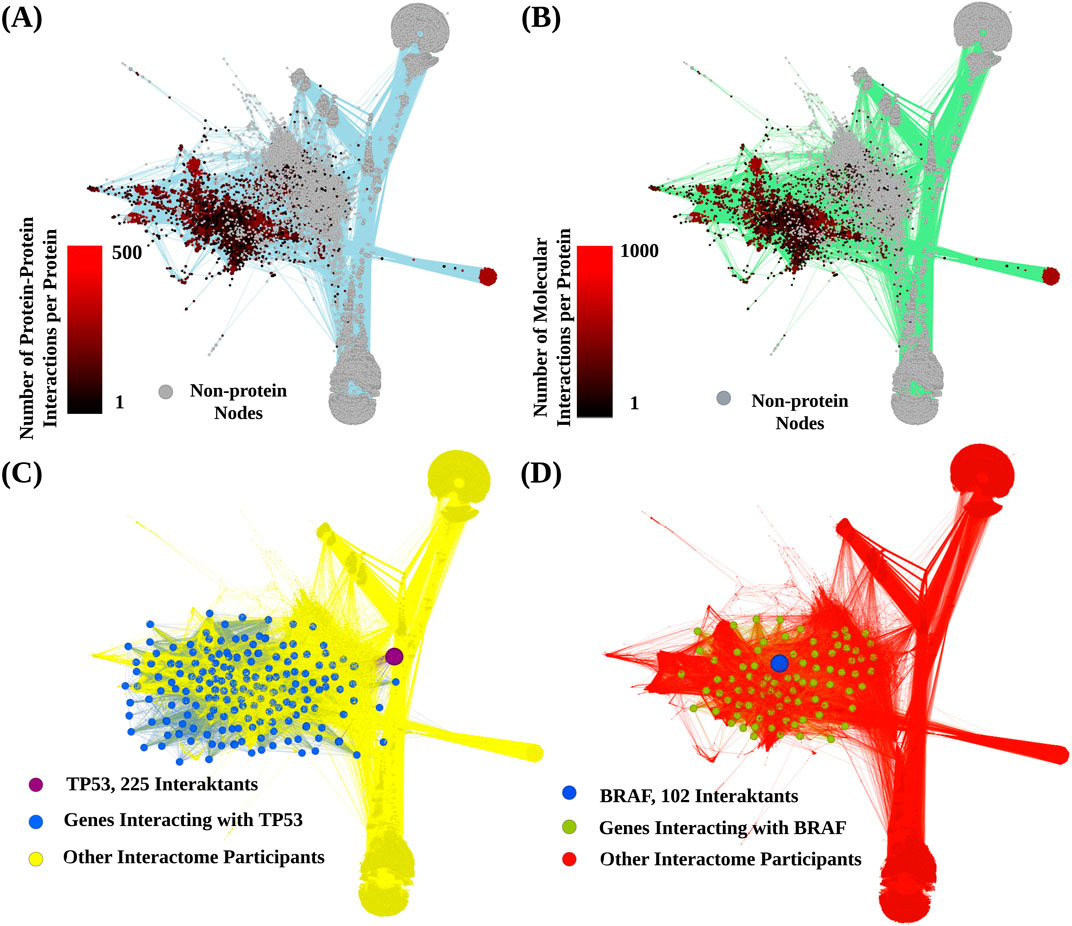
Figure 2. Schematic representation of the human interactome model. Graph vertices correspond to gene products, metabolites and auxiliary nodes denoted biochemical reactions and transport processes. Edges present interactions between nodes. (A) Color indicates number of protein-protein interactions per each protein node. (B), Color indicates number of total molecular interactions per each protein node. (C), representative interaction network shown for protein P53. (D), representative interaction network shown for protein BRAF. Edges inherit color from the corresponding outcoming donor nodes.
Some gene products showed an outstanding connectivity. For example, gene PIK3CA that regulates key cellular processes including growth and survival had 593 interactions. Gene PRKACA, known for its multifaceted role in mediating cAMP signaling and thereby influencing multiple cellular functions, had 588 mapped interactions. Similarly, gene GNG12 that encodes an integral component of heterotrimeric G-proteins critical for signal transduction, showed 574 interactions.
In addition, some gene products had numerous connections with both proteins and metabolites, such as Lipin 1 (LPIN1), 1-Acylglycerol-3-Phosphate O-Acyltransferase 1 (AGPAT) and Phosphatidylserine Synthase 1 (PTDSS1), had 1,234, 1,227, and 960 interactions, respectively.
3.3 Comparison of structural and regulatory evolution rates
On levels of individual genes, we found no meaningful correlations for the connectivity with all types of regulatory evolution rate metrics - for both protein-protein interactions (Figures 3A, C, E, G) and metabolite-protein-protein interactions (Figures 4A, C, E, G). For molecular pathways, we observed a weak negative correlation (from −0.144 to −0.2, Figures 3B, D, F, H; Figures 4 B, D, F, H).
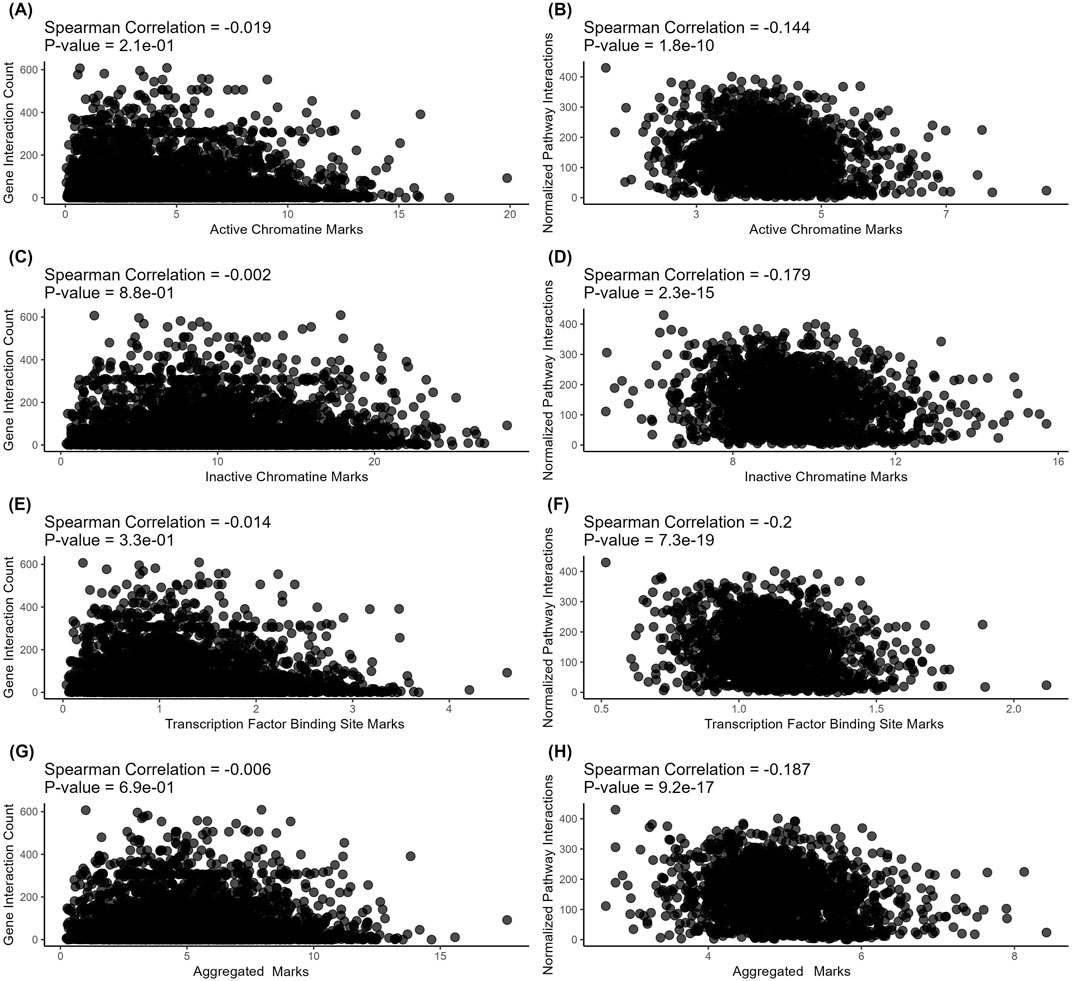
Figure 3. Correlation analysis of gene-level (left) and pathway-level (right) connectivity metrics deduced for protein-protein interactions with the respective regulatory evolution rates measured for the active chromatin, inactive chromatin, and TFBS marks. (A) Number of direct protein-protein interactions versus active chromatin marks-based retroelement enrichment metrics (NGREac). Each point corresponds to a gene. (B) Averaged number of direct protein-protein interactions per pathway versus active chromatin marks-based retroelement enrichment metrics (NPIIac). Each point corresponds to a pathway. (C) Number of direct protein-protein interactions versus heterochromatin marks-based retroelement enrichment metrics NGREhc. Each point corresponds to a gene. (D) Averaged number of direct protein-protein interactions per pathway versus heterochromatin marks-based retroelement enrichment metrics (NPIIhc). Each point corresponds to a pathway. (E) Number of direct protein-protein interactions versus TFBS-based retroelement enrichment metrics (NGRETFBS). Each point corresponds to a gene. (F) Averaged number of direct protein-protein interactions per pathway versus TFBS-based retroelement enrichment metrics (NPIITFBS). Each point corresponds to a pathway. (G) Number of direct protein-protein interactions versus aggregated retroelement enrichment metrics NGREAGG. Each point corresponds to a gene. (H) Averaged number of direct protein-protein interactions per pathway versus aggregated retroelement enrichment metrics (NPIIAGG). Each point corresponds to a pathway.
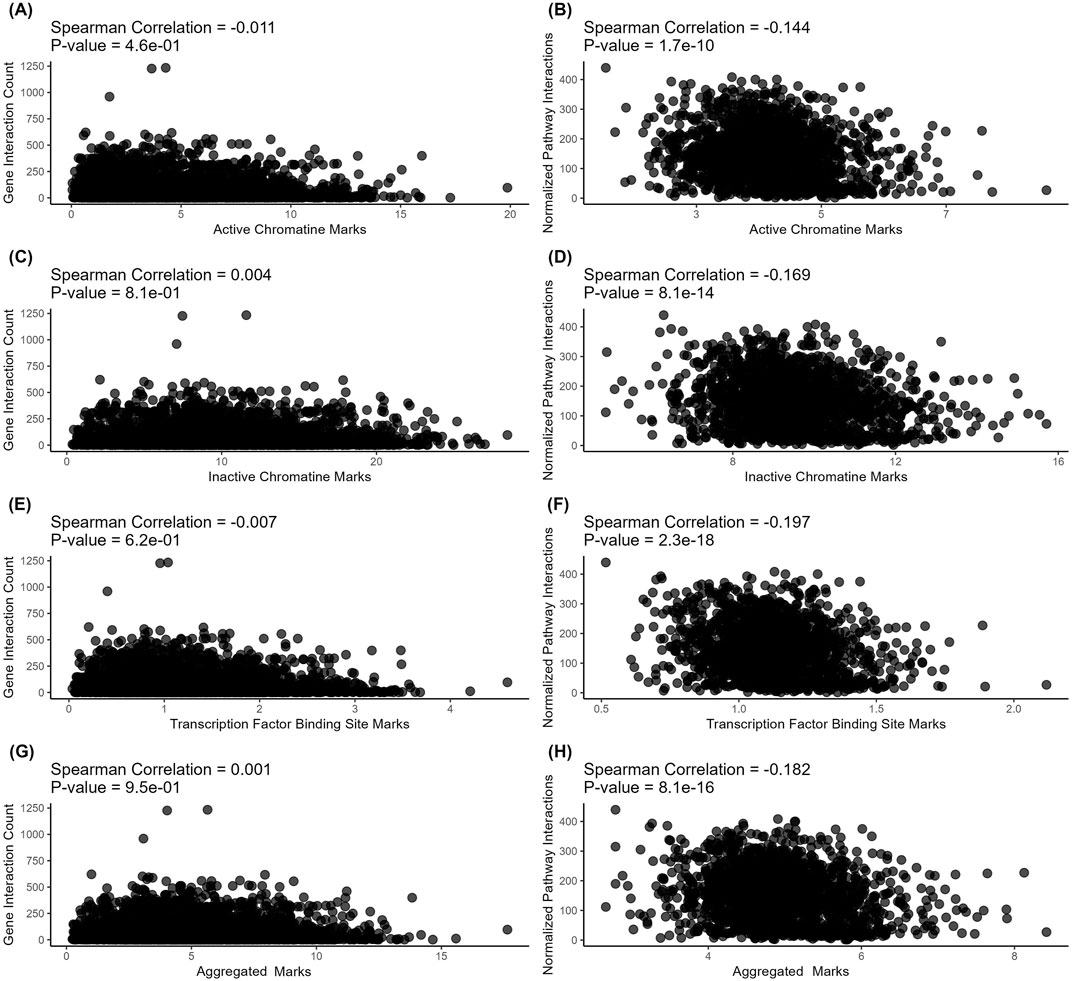
Figure 4. Correlation analysis of gene-level (left) and pathway-level (right) connectivity metrics deduced for metabolite-protein-protein interactions (all interactions) with the respective regulatory evolution rates measured for the active chromatin, inactive chromatin, and TFBS marks. (A) Number of all (direct and indirect, with proteins and metabolites) interactions versus active chromatin marks-based retroelement enrichment metrics (NGREac). Each point corresponds to a gene. (B) Averaged number of all (direct and indirect, with proteins and metabolites) interactions per pathway versus active chromatin marks-based retroelement enrichment metrics (NPIIac). Each point corresponds to a pathway. (C) Number of all (direct and indirect, with proteins and metabolites) interactions versus heterochromatin marks-based retroelement enrichment metrics NGREhc. Each point corresponds to a gene. (D) Averaged number of all (direct and indirect, with proteins and metabolites) interactions per pathway versus heterochromatin marks-based retroelement enrichment metrics (NPIIhc). Each point corresponds to a pathway. (E) Number of all (direct and indirect, with proteins and metabolites) interactions versus TFBS-based retroelement enrichment metrics (NGRETFBS). Each point corresponds to a gene. (F) Averaged number of all (direct and indirect, with proteins and metabolites) interactions per pathway versus TFBS-based retroelement enrichment metrics (NPIITFBS). Each point corresponds to a pathway. (G) Number of all (direct and indirect, with proteins and metabolites) interactions versus aggregated retroelement enrichment metrics NGREAGG. Each point corresponds to a gene. (H) Averaged number of all (direct and indirect, with proteins and metabolites) interactions per pathway versus aggregated retroelement enrichment metrics (NPIIAGG). Each point corresponds to a pathway.
However, on the level of structural evolution metrics, we detected significant negative correlations with the connectivity for both protein-protein (Figure 5) and metabolite-protein-protein (Figure 6) interactions. These results are in line with the previously published findings. However, we show here for the first time that in both types of analysis, these correlations were stronger for the pathways than for the individual gene products (Spearman correlation −0.106 vs. −0.297 and −0.1 vs. −0.296, respectively; Figures 5, 6).
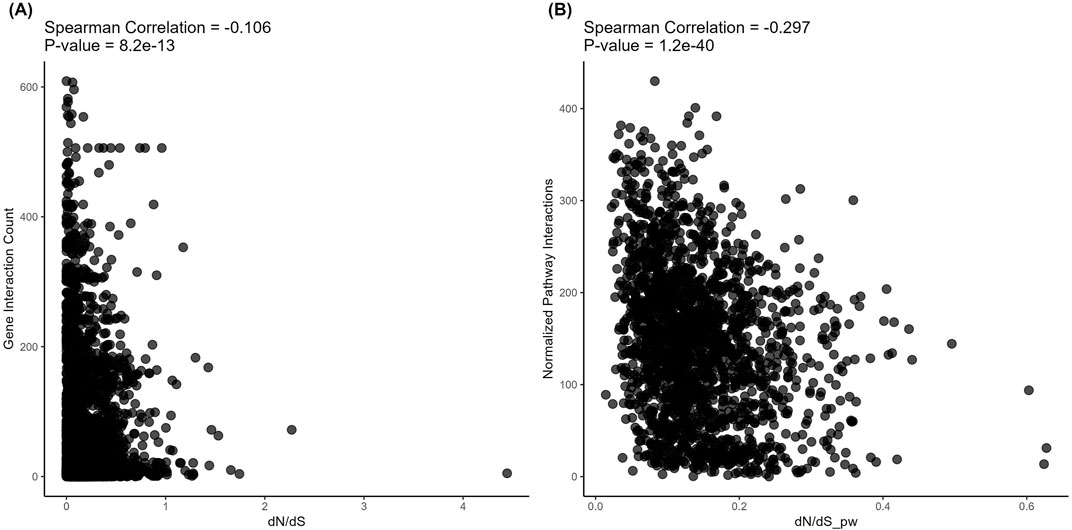
Figure 5. Correlation analysis of gene-level (left) and pathway-level (right) connectivity metrics deduced for protein-protein interactions with the respective structural evolution rates. (A) Number of direct protein-protein interactions versus dN/dS. Each point corresponds to a gene. (B) Averaged number of direct protein-protein interactions per pathway versus dN/dS_pw (averaged dN/dS per pathway). Each point corresponds to a pathway.
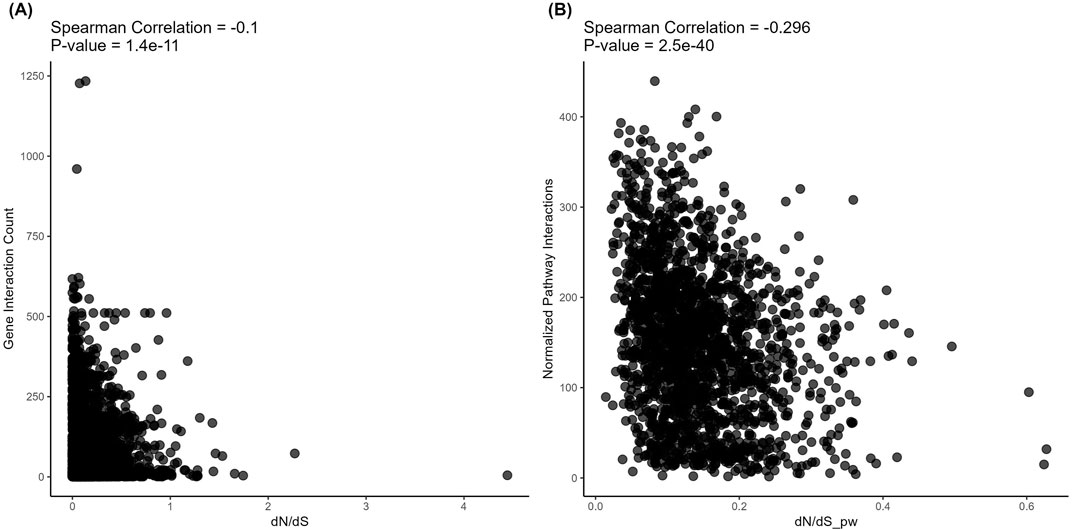
Figure 6. Correlation analysis of gene-level (left) and pathway-level (right) connectivity metrics deduced for metabolite-protein-protein interactions with the respective structural evolution rates. (A) Number of all (direct and indirect, with proteins and metabolites) interactions versus dN/dS. Each point corresponds to a gene. (B) Averaged number of all (direct and indirect, with proteins and metabolites) interactions per pathway versus dN/dS_pw (averaged dN/dS per pathway). Each point corresponds to a pathway.
At the same time, the structural and regulatory evolution metrics themselves correlated on both gene (Spearman correlation 0.082–0.159, Figure 7) and pathway (Spearman correlation 0.253–0.374, Figure 8) levels. Again, the pathway level of data analysis resulted in far stronger correlations among the quantitative evolution rate metrics.
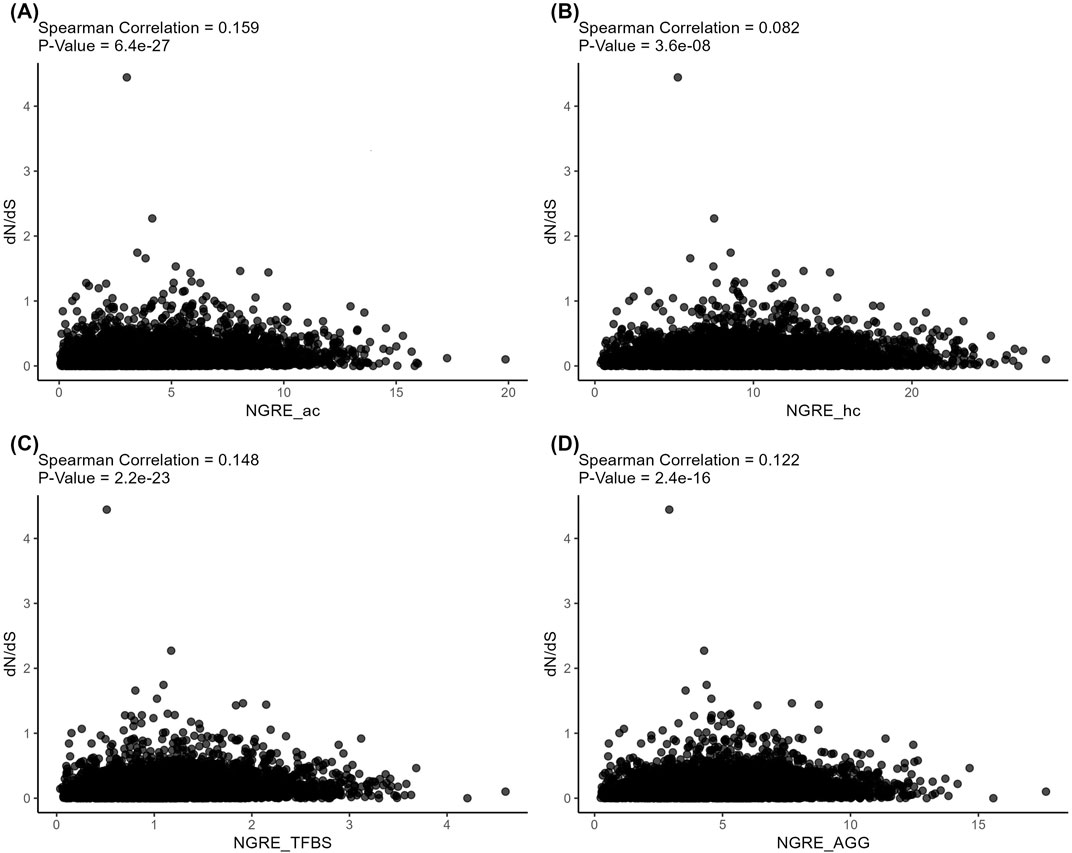
Figure 7. Correlation analysis of gene-level structural and regulatory evolution metrics deduced for active chromatin (A), inactive chromatin (B), TFBS (C), and aggregated regulatory evolution metric (D).
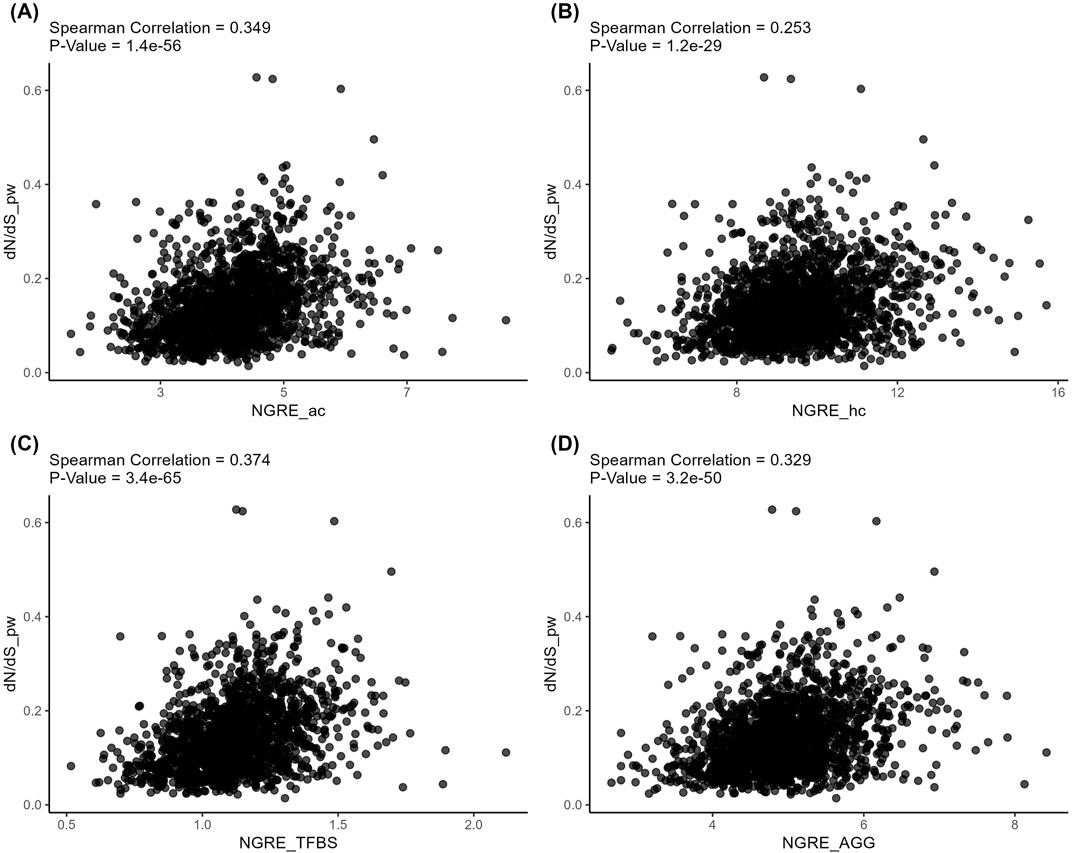
Figure 8. Correlation analysis of pathway-level structural and regulatory evolution metrics deduced for active chromatin (A), inactive chromatin (B), TFBS (C), and aggregated regulatory evolution metric (D).
4 Discussion
Structural and regulatory evolution of protein-coding genes is one of the central areas of evolutionary genomics. The dN/dS ratio, a standard measure of evolutionary pressure, indicates the rate of evolution of protein-coding genes, where values above one indicate positive selection, below one indicates purifying selection, and near one indicates neutral evolution (Kryazhimskiy and Plotkin, 2008). This metric has long been used as a universal barometer of the rate of evolution of genes, highlighting those undergoing rapid evolution or, instead, conservation.
Recently, regulatory changes in gene evolution have attracted increasing attention from the research community. The evolution of gene regulation is often studied through changes in regulatory elements such as transcription factor binding sites (TFBS) and enhancers (Wray et al., 2003). In addition, histone modifications, DNA methylation patterns and transposable elements also play a major role in studying the evolution of gene regulation (Bird, 2007; Feschotte, 2008). The Retrospect method we introduced recently represents a new approach to measure regulatory evolution by quantifying the enrichment of functional motifs in gene promoters, particularly motifs associated with transposable elements. Retroelements (RE), for example, constitute a significant fraction of transcription factor binding sites (TFBS), rearranging the regulatory structure of the human genome. The specific metrics were developed to quantitate the regulatory impact of REs on individual genes with a focus on TFBS and chromatin tags (Nikitin et al., 2019a).
The regulatory context can be extended to the level of molecular pathways and the interactome. Studies integrating evolutionary perspectives have explored the relationship between the evolution of proteins and their properties in interaction networks, such as connectivity (Dosztányi et al., 2006; Mosca et al., 2012), suggesting that there is a complex relationship between a gene’s position in the interactome and its rate of evolution (Hahn and Kern, 2005). It has been repeatedly suggested that proteins with higher connectivity evolve slowly (Brookfield, 2000; Fraser et al., 2002; Fraser et al., 2003; Teixeira et al., 2019). This is probably due to the constraints imposed by their multiple interactions. Lemos et al. (2004) observed a negative correlation between protein-protein interactions and evolutionary diversity in gene expression, implying a possible constraint on the regulatory evolution of genes. This relationship implies that higher levels of protein-protein interactions are associated with reduced variability in gene expression across evolutionary periods, while lower levels of protein interactions may lead to greater variability in gene expression.
In addition, Brown et al. demonstrated that the number of interacting proteins is positively correlated with evolutionary conservation, suggesting that proteins with more interactions are more likely to be conserved (Brown and Jurisica, 2007). In addition, structurally disordered regions of proteins, especially those that play a role in their interaction networks, have been found to be evolutionarily important. As become evident in large-scale analysis of the human, fly, and yeast interactomes, although less conserved, these regions are involved in the evolutionary adaptation of protein networks (Dosztányi et al., 2006; Mosca et al., 2012).
A study of the cancer interactome showed that cancer proteins playing major roles in pathology, evolve more slowly and undergo stronger purifying selection compared to non-cancerous proteins. These proteins show a strong association between their evolutionary age and network connectivity. In these proteins, a significant correlation between nonsynonymous mutation rate and network connectivity was detected, thus highlighting the impact of these mutations on tumor development and progression (Cheng et al., 2014).
We detected a week negative association between the rate of structural evolution and number of protein interactions. The association is strongly statistically significant and may represent a general trend. However, there are remarkable exceptions where the opposite is true, e.g., proteins UBE2U, IL3, and CXCL13 having high dN/dS (>1.3) and at the same time high number of protein-protein interactions (361, 184 and 168, respectively).
On the other hand, regulatory evolution appears to proceed differently than structural evolution. The relationship between the rate of regulatory evolution and position in the interactome is not so clear-cut and may vary depending on specific regulatory elements and mechanisms (He and Zhang, 2006; Jovanovic et al., 2021). So far, different opinions have been expressed as to whether there is a relationship between the rate of protein evolution and the number of protein interactions (Saeed and Deane, 2006). There remains a gap in our understanding of how regulatory evolution is consistent with interactome connectivity.
Here we for the first time investigated relationship between regulatory evolution metrics and number of protein-protein and protein-metabolite interactions. We had no starting hypotheses of whether such an association should exist or not. We observed statistically significant correlation on the level of molecular pathway analysis, but not on the level of individual genes. These results may suggest an overall evolutionary selection trend that largely reshapes the biological processes rather than individual genes.
In our study, we combined quantitative measures of structural and regulatory evolution to analyze the human interactome model built with 7,483 genes. We found a marked correlation between the rates of structural and regulatory evolution of protein-coding genes, evident at both the gene and pathway levels, as assessed by transcription factor binding sites and histone modification mapping data. Our results suggest a common structural/regulatory evolutionary trajectory at the pathway level and weaker but still discernible trends at the gene level.
Weak correlations at the gene level mean that structural and regulatory evolution are relatively dissociated in many individual genes. This may suggest that genes can adopt regulatory flexibility that allows them to change gene expression pattern without altering protein function. Such flexibility may be important for adapting to new environmental or developmental contexts while maintaining the desired protein structure. Other genes may be less conservative structurally but more stable in terms of regulation. Bigger correlations at the pathway level suggest more coordinated evolution because pathways depend on multiple genes working in concert. Significant structural changes in a gene may require regulatory changes to maintain the balance of protein function within a pathway, meaning that coordination between these two forms of evolution becomes more pronounced within integral biological processes.
On the other hand, we detected no significant correlation between the rate of regulatory evolution and human gene connectivity in the interactome model built, suggesting that the dynamics of regulatory mechanisms do not necessarily correspond to the degree of gene connectivity. This indicates that regulatory adaptation may act independently of the frequency of gene interactions.
In this study, we performed the first comparison of structural and regulatory evolution rates with the connectivity, on both gene and pathway levels. A correlation was detected for the structural evolution rates, and the pathway level of data analysis resulted in greater correlations. Thus, as found in several previous studies from different domains (Borisov et al., 2017), the pathway level of data analysis has the advantage of increased data stability.
The correlation between dN/dS and gene connectivity may have applications, for example, for the task of determining the type of inheritance of a gene-related disease. Thus, we verified that both dN/dS and gene connectivity are related to inheritance type. We took genes with known non-conflict inheritance type (543 genes with autosomal dominant inheritance only and 894 genes with autosomal recessive inheritance only accordingly to OMIM) and obtained significant differences in both dN/dS and linkage between genes with different inheritance type (Wilcoxon test p-values of 1.3*10–38 and 2.2*10–13, respectively, Supplementary Figure S3). Genes with autosomal dominant inheritance were more conservative and had more direct protein-protein interactions than genes with autosomal recessive inheritance. The combination of dN/dS and number of interactions increases the difference (Wilcoxon test p-value 1*10–40, Supplementary Figure S3), and can be used as an additional criterion for in silico determination of the type of inheritance for gene-related disease. In addition, one of these two parameters can be used when data for another is absent.
We used previously published datasets on human functional gene regulatory markers, which limits the study from capturing novel interactions or evolutionary changes. Nevertheless, we chose data that allowed us to perform a comprehensive assessment of RE-enrichment of histone marks and TFBS. In the future, our analysis can be repeated with greater samples and more diverse types of functional genome marks to further explore the evolutionary trends of human, primate, and non-primate genomes.
This study deepens our understanding of evolutionary interactions at the genetic and pathway levels, offering new perspectives on the adaptive landscape of molecular biology. Our understanding of the co-evolution of structural and regulatory aspects of genes paves the way for further exploration of the complex interdependencies governing gene and pathway evolution, with broad implications for disease research, evolutionary biology, and other fields.
Data availability statement
The original contributions presented in the study are included in the article/Supplementary Material, further inquiries can be directed to the corresponding author.
Author contributions
RM: Data curation, Formal Analysis, Visualization, Writing–original draft. MZ: Conceptualization, Methodology, Project administration, Writing–review and editing. MS: Conceptualization, Methodology, Project administration, Writing–review and editing. TM: Investigation, Writing–review and editing. NS: Data curation, Formal Analysis, Writing–review and editing. IM: Formal Analysis, Writing–review and editing. VT: Conceptualization, Methodology, Writing–review and editing. AM: Data curation, Writing–review and editing. AS: Data curation, Writing–review and editing. DK: Conceptualization, Project administration, Writing–review and editing. Anton AB: Conceptualization, Methodology, Writing–original draft.
Funding
The author(s) declare that financial support was received for the research, authorship, and/or publication of this article. The processing of the interactome model was financially supported by the project “Digital technologies for quantitative medicine solutions” FSMG-2021–0006 (Agreement No. 075-03-2024-117 of 17 January 2024). Correlation analysis of structural and regulatory evolutionary metrics was supported by the Russian Science Foundation grant 20-75-10071.
Conflict of interest
Author VT was employed by Oncobox Ltd.
The remaining authors declare that the research was conducted in the absence of any commercial or financial relationships that could be construed as a potential conflict of interest.
The author(s) declared that they were an editorial board member of Frontiers, at the time of submission. This had no impact on the peer review process and the final decision.
Publisher’s note
All claims expressed in this article are solely those of the authors and do not necessarily represent those of their affiliated organizations, or those of the publisher, the editors and the reviewers. Any product that may be evaluated in this article, or claim that may be made by its manufacturer, is not guaranteed or endorsed by the publisher.
Supplementary material
The Supplementary Material for this article can be found online at: https://www.frontiersin.org/articles/10.3389/fgene.2024.1472638/full#supplementary-material
SUPPLEMENTARY TABLE S1 | Interactome model, including list of interactions, genes and metabolites.
SUPPLEMENTARY TABLE S2 | Lists of genes and molecular pathways analyzed with evolution metrics and number of direct protein-protein and all (protein-protein-metabolite) interactions.
SUPPLEMENTARY FIGURE S1 | Selection of the genes and pathways, used in the study.
SUPPLEMENTARY FIGURE S2 | Distribution of number of interactions per gene product. (A) Number or direct protein-protein interactions. (B) Number of all direct and indirect molecular interactions. Red vertical line is threshold for outliers, which were excluded from the study.
SUPPLEMENTARY FIGURE S3 | Distribution of number of direct protein-protein interactions and dN/dS for genes with known inheritance type. (A) Number of direct protein-protein interactions per gene. (B) dN/dS values. (C) Combination of dN/dS and number of direct protein-protein interactions (ranked value).
References
Batada, N. N., Hurst, L. D., and Tyers, M. (2006). Evolutionary and physiological importance of hub proteins. PLoS Comput. Biol. 2, e88–e0756. doi:10.1371/JOURNAL.PCBI.0020088
Bloom, J. D., and Adami, C. (2003). Apparent dependence of protein evolutionary rate on number of interactions is linked to biases in protein-protein interactions data sets. BMC Evol. Biol. 3, 21. doi:10.1186/1471-2148-3-21
Borisov, N., Suntsova, M., Sorokin, M., Garazha, A., Kovalchuk, O., Aliper, A., et al. (2017). Data aggregation at the level of molecular pathways improves stability of experimental transcriptomic and proteomic data. Cell Cycle 16, 1810–1823. doi:10.1080/15384101.2017.1361068
Brookfield, J. F. Y. (2000). What determines the rate of sequence evolution? Curr. Biol. 10, R410-R0411. doi:10.1016/S0960-9822(00)00506-6
Brown, K. R., and Jurisica, I. (2007). Unequal evolutionary conservation of human protein interactions in interologous networks. Genome Biol. 8, R95. doi:10.1186/GB-2007-8-5-R95
Cheng, F., Jia, P., Wang, Q., Lin, C. C., Li, W. H., and Zhao, Z. (2014). Studying tumorigenesis through network evolution and somatic mutational perturbations in the cancer interactome. Mol. Biol. Evol. 31, 2156–2169. doi:10.1093/MOLBEV/MSU167
Dosztányi, Z., Chen, J., Dunker, A. K., Simon, I., and Tompa, P. (2006). Disorder and sequence repeats in hub proteins and their implications for network evolution. J. Proteome Res. 5, 2985–2995. doi:10.1021/PR060171O
Drummond, D. A., Raval, A., and Wilke, C. O. (2006). A single determinant dominates the rate of yeast protein evolution. Mol. Biol. Evol. 23, 327–337. doi:10.1093/MOLBEV/MSJ038
Feschotte, C. (2008). Transposable elements and the evolution of regulatory networks. Nat. Rev. Genet. 9, 397–405. doi:10.1038/NRG2337
Fraser, H. B., Hirsh, A. E., Steinmetz, L. M., Scharfe, C., and Feldman, M. W. (2002). Evolutionary rate in the protein interaction network. Science 296, 750–752. doi:10.1126/SCIENCE.1068696
Fraser, H. B., Wall, D. P., and Hirsh, A. E. (2003). A simple dependence between protein evolution rate and the number of protein-protein interactions. BMC Evol. Biol. 3, 11. doi:10.1186/1471-2148-3-11
Frieze, A. M., Jackson, B., McDiarmid, C. J. H., and Reed, B. (1988). Edge-colouring random graphs. J. Comb. Theory, Ser. B 45, 135–149. doi:10.1016/0095-8956(88)90065-2
Gogvadze, E., and Buzdin, A. (2009). Retroelements and their impact on genome evolution and functioning. Cell Mol. Life Sci. 66, 3727–3742. doi:10.1007/S00018-009-0107-2
Hahn, M. W., Conant, G. C., and Wagner, A. (2004). Molecular evolution in large genetic networks: does connectivity equal constraint? J. Mol. Evol. 58, 203–211. doi:10.1007/S00239-003-2544-0
Hahn, M. W., and Kern, A. D. (2005). Comparative genomics of centrality and essentiality in three eukaryotic protein-interaction networks. Mol. Biol. Evol. 22, 803–806. doi:10.1093/MOLBEV/MSI072
He, X., and Zhang, J. (2006). Toward a molecular understanding of pleiotropy. Genetics 173, 1885–1891. doi:10.1534/GENETICS.106.060269
Igolkina, A. A., Zinkevich, A., Karandasheva, K. O., Popov, A. A., Selifanova, M. V., Nikolaeva, D., et al. (2019). H3K4me3, H3K9ac, H3K27ac, H3K27me3 and H3K9me3 histone tags suggest distinct regulatory evolution of open and condensed chromatin landmarks. Cells 8, 1034. doi:10.3390/CELLS8091034
Jeffares, D. C., Tomiczek, B., Sojo, V., and dos Reis, M. (2015). A beginners guide to estimating the non-synonymous to synonymous rate ratio of all protein-coding genes in a genome. Methods Mol. Biol. 1201, 65–90. doi:10.1007/978-1-4939-1438-8_4
Jordan, I. K., Wolf, Y. I., and Koonin, E. V. (2003). No simple dependence between protein evolution rate and the number of protein-protein interactions: only the most prolific interactors tend to evolve slowly. BMC Evol. Biol. 3, 1. doi:10.1186/1471-2148-3-1
Jovanovic, V. M., Sarfert, M., Reyna-Blanco, C. S., Indrischek, H., Valdivia, D. I., Shelest, E., et al. (2021). Positive selection in gene regulatory factors suggests adaptive pleiotropic changes during human evolution. Front. Genet. 12, 662239. doi:10.3389/FGENE.2021.662239
Karloff, H. J. (1989). An NC algorithm for brooks’ theorem. Theor. Comput. Sci. 68, 89–103. doi:10.1016/0304-3975(89)90121-7
Kryazhimskiy, S., and Plotkin, J. B. (2008). The population genetics of dN/dS. PLoS Genet. 4, e1000304. doi:10.1371/JOURNAL.PGEN.1000304
Lander, E. S., Linton, L. M., Birren, B., Nusbaum, C., Zody, M. C., Baldwin, J., et al. (2001). Initial sequencing and analysis of the human genome. Nature 409, 860–921. doi:10.1038/35057062
Lemos, B., Meiklejohn, C. D., and Hartl, D. L. (2004). Regulatory evolution across the protein interaction network. Nat. Genet. 36, 1059–1060. doi:10.1038/NG1427
Misra, J., and Gries, D. (1992). A constructive proof of Vizing’s theorem. Inf. Process Lett. 41, 131–133. doi:10.1016/0020-0190(92)90041-S
Mosca, R., Pache, R. A., and Aloy, P. (2012). The role of structural disorder in the rewiring of protein interactions through evolution. Mol. Cell Proteomics 11, M111.014969. doi:10.1074/MCP.M111.014969
Nikitin, D., Garazha, A., Sorokin, M., Penzar, D., Tkachev, V., Markov, A., et al. (2019a). Retroelement-linked transcription factor binding patterns point to quickly developing molecular pathways in human evolution. Cells 8, 130. doi:10.3390/CELLS8020130
Nikitin, D., Kolosov, N., Murzina, A., Pats, K., Zamyatin, A., Tkachev, V., et al. (2019b). Retroelement-linked H3K4me1 histone tags uncover regulatory evolution trends of gene enhancers and feature quickly evolving molecular processes in human physiology. Cells 8, 1219. doi:10.3390/CELLS8101219
Nikitin, D., Penzar, D., Garazha, A., Sorokin, M., Tkachev, V., Borisov, N., et al. (2018). Profiling of human molecular pathways affected by retrotransposons at the level of regulation by transcription factor proteins. Front. Immunol. 9, 30. doi:10.3389/FIMMU.2018.00030
Nikitin, D., Sorokin, M., Tkachev, V., Garazha, A., Markov, A., and Buzdin, A. (2019c). RetroSpect, a new method of measuring gene regulatory evolution rates using co-mapping of genomic functional features with transposable elements. Evol. Orig. Life, Concepts Methods, 85–111. doi:10.1007/978-3-030-30363-1_5
Perfect, H. (1977). by N. L. Biggs, E. K. Lloyd, and R. J. Wilson Graph theory 1736-1936, by N. L. Biggs, E. K. Lloyd and R. J. Wilson. Pp xi, 239. £9·50. 1976. SBN 0 19 853901 0 (oxford university press), Oxford University Press. The mathematical gazette 61, 233. doi:10.2307/3617244
Saeed, R., and Deane, C. M. (2006). Protein protein interactions, evolutionary rate, abundance and age. BMC Bioinforma. 7, 128. doi:10.1186/1471-2105-7-128
Scally, A., Dutheil, J. Y., Hillier, L. W., Jordan, G. E., Goodhead, I., Herrero, J., et al. (2012). Insights into hominid evolution from the gorilla genome sequence. Nature 483, 169–175. doi:10.1038/NATURE10842
Teixeira, M. B., Alborghetti, M. R., and Kobarg, J. (2019). Fasciculation and elongation zeta proteins 1 and 2: from structural flexibility to functional diversity. World J. Biol. Chem. 10, 28–43. doi:10.4331/WJBC.V10.I2.28
Wray, G. A., Hahn, M. W., Abouheif, E., Balhoff, J. P., Pizer, M., Rockman, M. V., et al. (2003). The evolution of transcriptional regulation in eukaryotes. Mol. Biol. Evol. 20, 1377–1419. doi:10.1093/MOLBEV/MSG140
Zakharova, G., Modestov, A., Pugacheva, P., Mekic, R., Savina, E., Guryanova, A., et al. (2023). Distinct traits of structural and regulatory evolutional conservation of human genes with specific focus on major cancer molecular pathways. Cells 2023 12, 1299. doi:10.3390/CELLS12091299
Zolotovskaia, M., Kovalenko, M., Pugacheva, P., Tkachev, V., Simonov, A., Sorokin, M., et al. (2023). Algorithmically reconstructed molecular pathways as the new generation of prognostic molecular biomarkers in human solid cancers. Proteomes 11, 26. doi:10.3390/proteomes11030026
Zolotovskaia, M. A., Kovalenko, M. A., Tkachev, V. S., Simonov, A. M., Sorokin, M. I., Kim, E., et al. (2022a). Next-generation grade and survival expression biomarkers of human gliomas based on algorithmically reconstructed molecular pathways. Int. J. Mol. Sci. 23, 7330. doi:10.3390/IJMS23137330
Zolotovskaia, M. A., Tkachev, V. S., Guryanova, A. A., Simonov, A. M., Raevskiy, M. M., Efimov, V. V., et al. (2022b). OncoboxPD: human 51 672 molecular pathways database with tools for activity calculating and visualization. Comput. Struct. Biotechnol. J. 20, 2280–2291. doi:10.1016/J.CSBJ.2022.05.006
Keywords: human gene regulation, molecular evolution, retrospect, regulatory evolution rate, structural evolution rate, human interactome model, molecular pathways, oncoboxpd database
Citation: Mekic R, Zolotovskaia MA, Sorokin M, Mohammad T, Shaban N, Musatov I, Tkachev V, Modestov A, Simonov A, Kuzmin D and Buzdin A (2024) Number of human protein interactions correlates with structural, but not regulatory conservation of the respective genes. Front. Genet. 15:1472638. doi: 10.3389/fgene.2024.1472638
Received: 29 July 2024; Accepted: 14 October 2024;
Published: 29 October 2024.
Edited by:
Pora Kim, University of Texas Health Science Center at Houston, United StatesReviewed by:
Meng Niu, University of Nebraska Medical Center, United StatesHimansu Kumar, University of Texas Health Science Center at Houston, United States
Copyright © 2024 Mekic, Zolotovskaia, Sorokin, Mohammad, Shaban, Musatov, Tkachev, Modestov, Simonov, Kuzmin and Buzdin. This is an open-access article distributed under the terms of the Creative Commons Attribution License (CC BY). The use, distribution or reproduction in other forums is permitted, provided the original author(s) and the copyright owner(s) are credited and that the original publication in this journal is cited, in accordance with accepted academic practice. No use, distribution or reproduction is permitted which does not comply with these terms.
*Correspondence: Marianna A. Zolotovskaia, em9sb3RvdnNrYXlhQG9uY29ib3guY29t
 Rijalda Mekic
 Marianna A. Zolotovskaia
 Maksim Sorokin
 Tharaa Mohammad
 Nina Shaban
 Ivan Musatov1
 Victor Tkachev
 Alexander Modestov
 Alexander Simonov
 Denis Kuzmin
 Anton Buzdin