- 1Key Laboratory of Ministry of Education for Gastrointestinal Cancer, School of Basic Medical Sciences, Fujian Medical University, Fuzhou, Fujian, China
- 2Fujian Key Laboratory of Tumor Microbiology, Department of Medical Microbiology, Fujian Medical University, Fuzhou, Fujian, China
- 3Institute of Applied Microbiology, Research Center for BioSystems, Land Use, and Nutrition (IFZ), Justus-Liebig-University Giessen, Giessen, Germany
Introduction: Dihydrouridine (D) is a conserved modification of tRNA among all three life domains. D modification enhances the flexibility of a single nucleotide base in the spatial structure and is disease- and evolution-associated. Recent studies have also suggested the presence of dihydrouridine on mRNA.
Methods: To identify D in epitranscriptome, we provided a prediction framework named “DPred_3S” based on the machine learning approach for three species D epitranscriptome, which used epitranscriptome sequencing data as training data for the first time.
Results: The optimal features were evaluated by the F-score and integration of different features; our model achieved area under the receiver operating characteristic curve (AUROC) scores 0.955, 0.946, and 0.905 for Saccharomyces cerevisiae, Escherichia coli, and Schizosaccharomyces pombe, respectively. The performances of different machine learning algorithms were also compared in this study.
Discussion: The high performances of our model suggest the D sites can be distinguished based on their surrounding sequence, but the lower performance of cross-species prediction may be limited by technique preferences.
Introduction
The first RNA modification was reported in 1951, and currently, at least 170 types of RNA modifications have been identified among all life domains (Boccaletto et al., 2022). Among these modifications, dihydrouridine (D) is the second most popular tRNA modification (Machnicka et al., 2014), which was introduced as the natural component of yeast tRNA in 1965 (Holley et al., 1965). Additionally, D is conserved in the D-loop of tRNA in Bacteria, Eukaryota, and some Archaea based on mass spectrometry (Kowalak et al., 1995). In recent studies, it has been observed that D has several molecular functions and participates in many biological processes, such as the spatial configuration of RNA, evaluation (Song et al., 2023), cancer development (Xing et al., 2004; Kasprzak et al., 2012), and virus replication. Additionally, the potential associations between SNP and D in disease development were revealed (Song et al., 2023).
The hydrogenation of the uridine C5–C6 bond is regulated by dihydrouridine synthase (DUS) enzymes, which are from a conserved gene family COG0042 (Kasprzak et al., 2012). Each family member is responsible for dihydrouridylation of one or two U positions in a tRNA molecule (Xing et al., 2004). Interestingly, the mRNA expression is associated with the DUS expression based on the knockdown experiment (Kato et al., 2005). The cross-linking and immunoprecipitation (CLIP) analyses also showed that DUS can bind with mRNA (Mitchell et al., 2013). These results suggest that D not only appears in tRNA but also in mRNA.
With the advance in sequencing techniques, the concept of epitranscriptome arose in 2011 (Jia et al., 2011). Multiple methods have been developed in the past 10 years to help decipher the epitranscriptome landscape of different modifications (Dominissini et al., 2016; Yang et al., 2017; Koh et al., 2019). Rho-seq (Finet et al., 2022) is the first D epitranscriptome profiling method based on the reverse transcription arrest. The results of Rho-seq reported hundreds of D sites and suggested the mRNA D modification affects meiotic chromosome segregation. In another study, D-seq (Draycott et al., 2022) was also developed with a similar concept of Rho-seq. In addition to the NGS platform, nanopore techniques could be used to detect RNA modifications, including D sites (Wang et al., 2023a; Song et al., 2023; Zhang et al., 2023).
Although the sequencing method can provide a precise and accurate location of D modification, the experiment is still time-consuming and expensive. The bioinformatics prediction provides another convenient method to detect putative modification sites. There are some studies providing prediction tools for D identification (Xu et al., 2019; Dou et al., 2021); however, there are two limitations in those studies. First, the number of D sites is limited; only 176 sites were identified by the LC/MS method among five species. Second, these works only considered the D modification of tRNA. To address these, we provided a new prediction framework “DPred_3S” to support the prediction of D sites in three species epitranscriptome. After features and parameter optimization, our models achieved credible performances. The workflow for DPred_3S is summarized in Figure 1. The project code and training sequences are available at https://github.com/SXWuFJMU/Dpred_3S/.

FIGURE 1. Workflow for DPred_3S. The information on D sites was obtained by Rho-seq or D-seq and filtered by CD-HIT to reduce sequence redundancy. Different feature encoding methods were integrated with their importance and combined together to find the optimal features for D prediction. The different machine learning algorithms were compared in this work also.
Methods and materials
Putative D sites from Rho-seq and D-seq
The processing data were obtained from the original paper. There are 106 and 372 D sites identified in the epitranscriptome of Escherichia coli and Schizosaccharomyces pombe, respectively (see Table 1). To select positive samples, the sequence length 41 bp of D was primarily used to extract sequence information, which is widely used in many previous studies (Chen et al., 2019a; Liu and Chen, 2020; Song et al., 2020; Liu et al., 2021; Xu et al., 2021). The unmodified uridines were randomly selected from the transcriptome and extended 20 bp in both directions as negative samples. The ratio of positive and negative samples is 1:1. To remove redundant sequences, CD-HIT (Fu et al., 2012) software with default parameters was used to keep the sequence similarity less than 85%. For model training and cross-validation, 80% samples were used and the remaining 20% were considered independent testing data.
Feature encoding and selection
Sequence-derived features were widely used in the bioinformatics prediction, such as RNA-binding proteins, RNA modification, microRNA interaction, and RNA sub-location. Some recent works have summarized the commonly used encoding features in the bioinformatics prediction field (Hou et al., 2019; Liu, 2019; Su et al., 2020; Chen et al., 2021a). In this study, we considered eight types of encoding methods in the beginning to find the optimal features of D site prediction.
Binary encoding method
Binary encoding is known as one-hot encoding (ONE_HOT). Each nucleic acid was converted into a four numeric vector based on the following settings: A = (1,0,0,0), U = (0,1,0,0), G = (0,0,1,0), and C = (0,0,0,1).
Chemical property
In the chemical property (ChemProper), the ring structure, functional groups, and hydrogen bonds of nucleic acids were considered to be the features. A and C have the amino group, whereas G and U have the keto group. In hybridization, A and U have two hydrogen bonds, but G and C have three hydrogen bonds, and A and G have two ring structures, whereas C and U only have one. Based on these concepts, each nucleic acid can be presented as three numeric vectors as
Electron–ion interaction pseudopotentials
The electron–ion interaction pseudopotentials (EIIPs) were proposed by Veljko and Dragutin (Lalović and Veljković, 1990), and each nucleic acid can be represented by a number due to their electron–ion interaction pseudopotentials. The A, U, G, and C values equal to 0.1260, 0.1335, 0.0806, and 0.1340, respectively.
Nucleic acid composition (CONPOSI)
The frequency of each dinucleotide is calculated, which can be presented as a vector with 16 numbers:
Accumulated nucleotide frequency (frequency)
This encoding method considered the position and order of nucleic acids. In a sequence, the frequency of nucleotide in the
Auto-correlation (autoCor) and cross-correlation (crossCor)
These two methods were invented based on the physicochemical (PC) properties between two nucleotides. autoCor considers the correlation coefficient of the same PC properties between two subsequences, whereas crossCor focuses on the correlation coefficient of the different PC properties between two subsequences. More detail information was introduced in previous studies (Song et al., 2022).
Pseudo k-tuple composition (PseKNC)
PseKNC is the most popular encoding method which was used in multiple types of bioinformatics prediction, including but not limited to protein, DNA, and RNA prediction (Chen et al., 2013; Lin et al., 2014; Chen et al., 2018). The PseKNC section in the webserver iLearnPlus (Chen et al., 2021b) was used in this project to generate sequence-derived features.
In feature optimization, the F-score (Chen and Lin, 2006) was used to evaluate the discriminative capability in the
In addition, based on the order of F-score, the incremental feature selection (IFS) (Lin et al., 2014) was used to identify the optimal features.
Machine learning algorithms and evaluation
Support vector machine (SVM) is a widely used machine learning approach in bioinformatics research. In this study, SVM with default parameters from LIBSVM (R language interface) was used in feature optimization (Chang and Lin, 2011). To evaluate the impact of machine learning algorithms, generalized linear model (GLM), random forest (RF), and naive Bayes (NB) from the R package caret were used to compare the performances from different methods (Kuhn, 2008). Finally, we analyzed the regularization parameter C and the kernel width parameter γ in SVM to select the optimal parameter for our model.
To evaluate the performances, AUROC (area under the receiver operating characteristic curve) was used as the key evaluator. AUPRC (area under the precision-recall curve) was calculated in SVM parameter optimization. The accuracy (ACC), sensitivity (Sn), and specificity (Sp) were calculated to measure the performance on algorithm comparison:
Results
Feature selection for D prediction
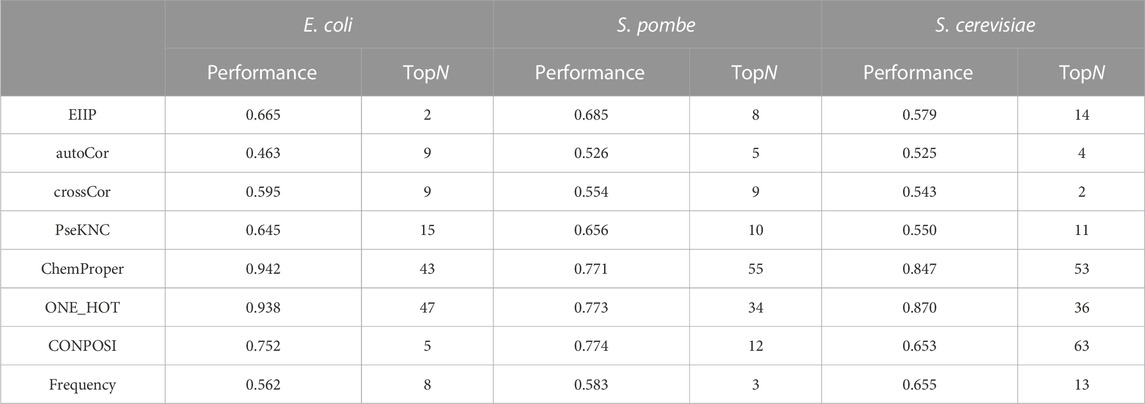
To select the optimal features, the F-score was calculated for each encoding method. Based on the order of F-score, the top N features were used in the five-fold cross-validation. When the top N features achieved the highest performances, more features included in the training will not improve the performances. The results are summarized in Table 2. For E. coli D site prediction, 43 features with the highest F-score from the chemical property encoding method show the best performance (AUROC: 0.942). For S. pombe prediction, 12 features with decreasing F-score from the nucleic acid composition method achieved the highest AUROC value.
The feature combination is a common way to improve the prediction performance. In this study, we considered the combination of three types of features. The reason we only considered three rather than more feature types is the limited number of sample sequences as the redundant features may adversely affect the predictor. Different encoding methods with their identified top N features were combined and analyzed by five-fold cross-validation. The results (Figure 2) suggested the best performances for E. coli D site prediction were observed when CONPOSI, Frequency, and EIIP were used together, whereas the best choice for S. pombe is PseKNC Chemical Proper and CONPOSI. For the D site prediction on S. cerevisiae, the optimal feature is the combination of Chemical property, CONPOSI, and autoCovar. Interestingly, although using chemical property shows the best performance for E. coli when one encoding method was used, a combination with more features could not improve its performance.
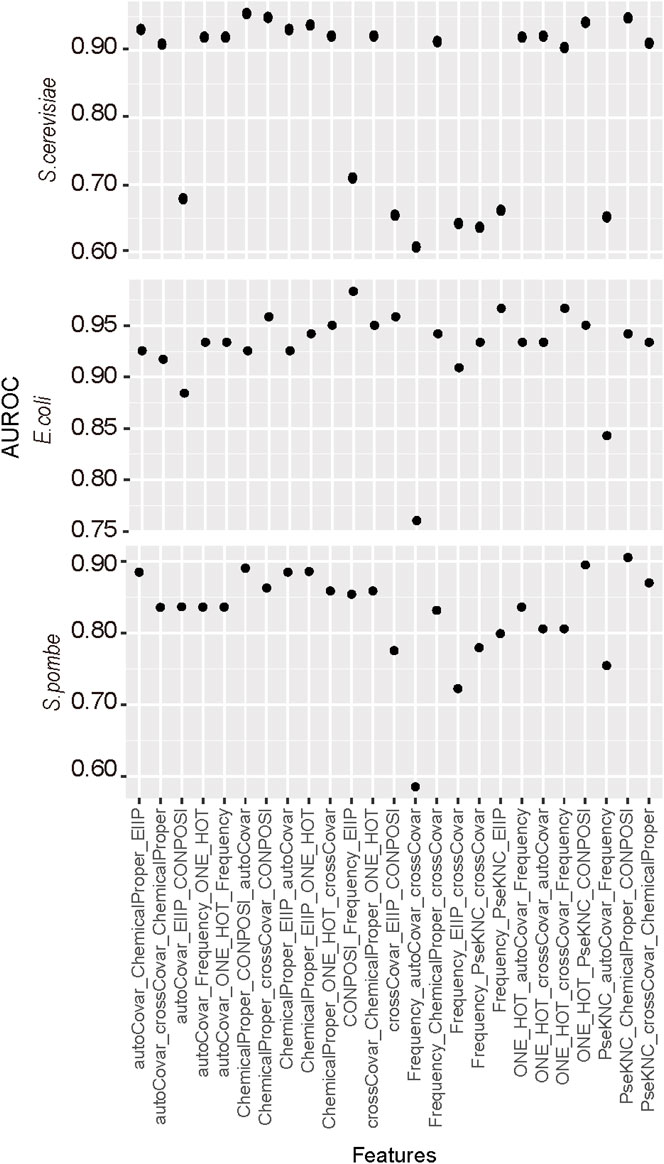
FIGURE 2. Identification of the optimal combination of feature encoding methods. For each feature, only top N features were used in this section, and three different types of features were integrated together.
Performance comparison among different approaches
To evaluate the impact of machine learning algorithms on the D site prediction, besides SVM, GLM, RF, and NB were used to construct predictors. AUROC, ACC, Sn, and Sp were calculated to measure the performance of each algorithm. The results are summarized in Figure 3. Based on the independent test, the performances were stable when different algorithms were used based on optimized sequence features. SVM shows the best performances in E. coli and S. pombe, while the RF model achieved best performances in S. cerevisiae.
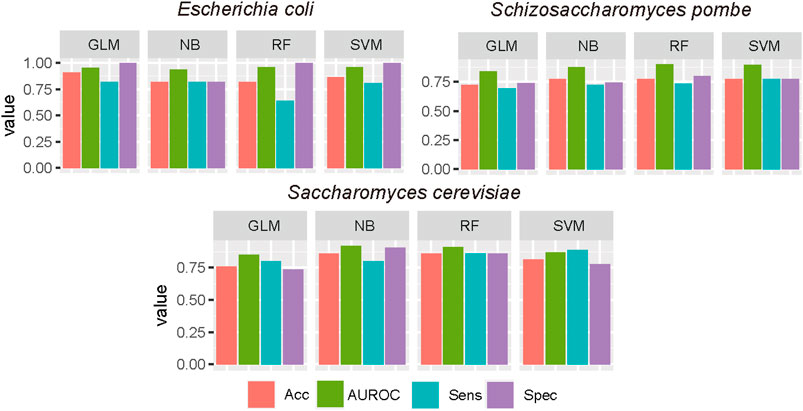
FIGURE 3. Performance evaluation of different machine learning algorithms. The optimal features were used in different ML algorithms, and the performance was evaluated by the independent test. GLM, generalized linear model; RF, random forest; NB, Naive Bayes.
Parameter analysis
The regularization parameter C and the kernel width parameter γ in SVM were analyzed in this study to find the optimal model (Figure 4). For the S. pombe D site prediction, when parameter C equaled to 2 ^ (−1) and γ equaled to 2 ^ (−6), the model achieved the best performance with AUROC and AUPRC scores of 0.905 and 0.917, respectively. For E. coli prediction, the optimal model can achieve an AUROC score of 0.946 and an AUPRC score of 0.938, when C and γ settings were 2 ^ (−2) and 2 ^ (−9), respectively. For the S. cerevisiae D site prediction, when C is 2 ^ (−2) and γ is 2 ^ (−7), the predictor achieved the best performance with AUROC 0.955 and AUPRC 0.962.
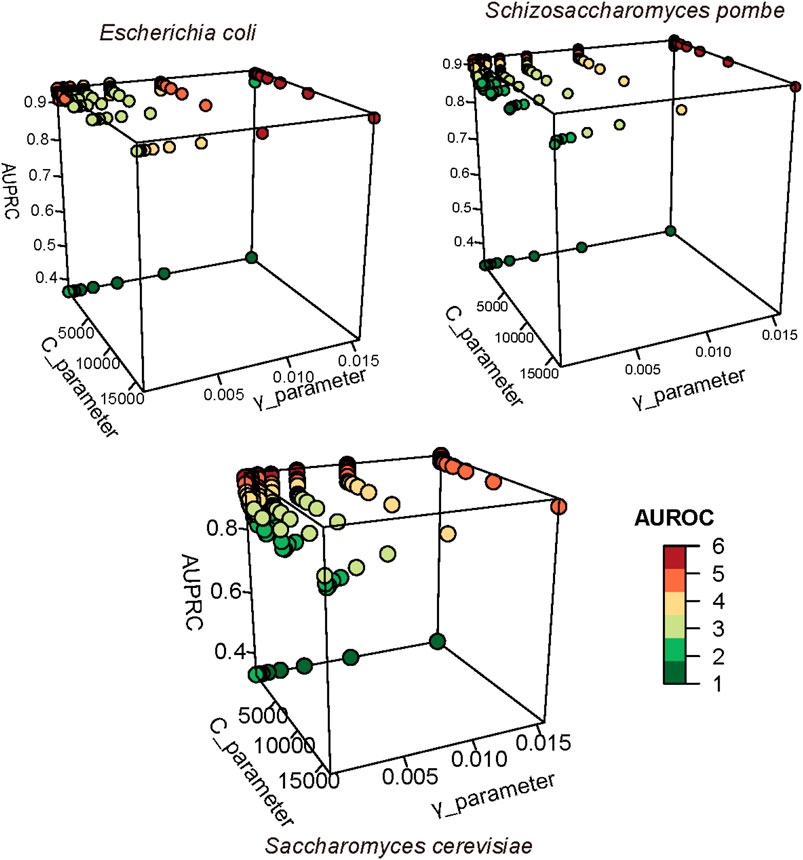
FIGURE 4. Optimized parameters in SVM. AUROC and AUPRC were used to evaluate the performance of SVM with different parameters. We used different colors to present the number of AUROC; the high value is represented in red, and the low value is represented in green.
Cross-species prediction and data interpretation
To estimate the consistence of D among the different species, the performances of cross-species prediction were used (see Figure 5). The prediction between S. pombe and E. coli is higher than that between S. pombe and S. cerevisiae, which is from the same genus. Considering the D sites identified on S. pombe and E. coli by Rho-seq, the lower performance may be limited by technique preferences, which is a common issue in the RNA modification sequencing field. Additionally, the optimal features of each species were identified, and these specific features may only help for prediction in same species rather than cross-species prediction.
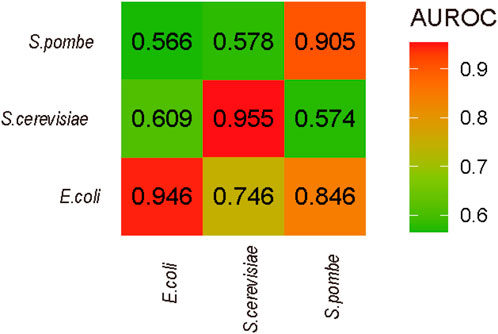
FIGURE 5. Cross-species prediction. The names of x-axis are the species of training data in prediction, and the names of y-axis are the species for testing.
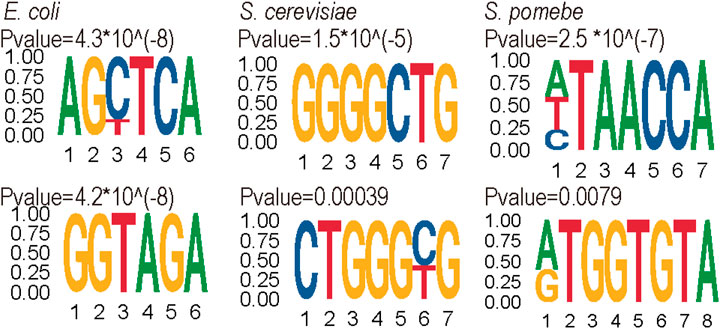
Furthermore, the motifs of positive data were analyzed by the MEME suits (Bailey et al., 2015) website (see Figure 6). The results showed the motif of each species is quite different. The motif of S. cerevisiae is enriched in the high G contact region, whereas S. pombe and E. coli are enriched in the ‘GA’ region.
Discussion
The importance of RNA modifications has been illustrated in the past 10 years, which participates in many biological processes, including stem cell/embryo development, immunity of infection, and carcinogenesis. Additionally, multiple RNA modifications have been proven to be conserved in the evolution. D, as the second abundant tRNA modification, has many molecular functions due to its unique structure and participates in different biological processes. Recent studies have suggested the D modification also appears in mRNA.
With accumulated sequencing results, bioinformatics research studies become an important part of epitranscriptome analysis, which included the peak calling method (Meng et al., 2013; Meng et al., 2014), databases (Liu et al., 2018; Tang et al., 2021; Ma et al., 2022), annotation (Zheng et al., 2018; Chen et al., 2021a), and prediction tools (Chen et al., 2016; Yang et al., 2018; Chen et al., 2019b; Chen et al., 2019c; Feng and Chen, 2022; Jiang et al., 2022; Zhang et al., 2022); all of these provide a convenient way to understand epitranscriptome regulation. In this study, we provided a bioinformatics framework named “DPred_3S″ to predict D sites in S. cerevisiae, S. pombe, and E. coli.
Compared with previous studies (Table 3), we used a new dataset using high-throughput sequencing techniques Rho-seq and D-seq, which provide more D sites in more RNA types rather than tRNA only. After system evaluation, the optimal features and parameter were identified in our work. The high performances of our model suggest the D sites can be distinguished based on their surrounding sequence.
The current study only considered the sequence-derived features, and more advanced encoding methods (Chen et al., 2019a; Huang et al., 2022) could be used to improve the performance in further study. Moreover, deep learning-based algorithms should be integrated to illustrate sequence characteristics by data interpretation.
Data availability statement
The original contributions presented in the study are included in the article/Supplementary Material; further inquiries can be directed to the corresponding author.
Author contributions
JR: software and writing–original draft. XC: validation and writing–original draft. ZZ: data curation and writing–original draft. HS: writing–review and editing. SW: supervision and writing–review and editing.
Funding
The author(s) declare that financial support was received for the research, authorship, and/or publication of this article. This research was funded by the Scientific Research Foundation for Advanced Talents of Fujian Medical University (XRCZX2020012).
Conflict of interest
The authors declare that the research was conducted in the absence of any commercial or financial relationships that could be construed as a potential conflict of interest.
Publisher’s note
All claims expressed in this article are solely those of the authors and do not necessarily represent those of their affiliated organizations, or those of the publisher, the editors, and the reviewers. Any product that may be evaluated in this article, or claim that may be made by its manufacturer, is not guaranteed or endorsed by the publisher.
References
Bailey, T. L., Johnson, J., Grant, C. E., and Noble, W. S. (2015). The MEME suite. Nucleic acids Res. 43, W39–W49. doi:10.1093/nar/gkv416
Boccaletto, P., Stefaniak, F., Ray, A., Cappannini, A., Mukherjee, S., Purta, E., et al. (2022). MODOMICS: a database of RNA modification pathways. 2021 update. Nucleic acids Res. 50, D231–d235. doi:10.1093/nar/gkab1083
Chang, C.-C., and Lin, C.-J. (2011). LIBSVM: a library for support vector machines. ACM Trans. Intell. Syst. Technol. 2, 1–27. doi:10.1145/1961189.1961199
Chen, K., Song, B., Tang, Y., Wei, Z., Xu, Q., Su, J., et al. (2021a). RMDisease: a database of genetic variants that affect RNA modifications, with implications for epitranscriptome pathogenesis. Nucleic acids Res. 49, D1396–d1404. doi:10.1093/nar/gkaa790
Chen, K., Wei, Z., Zhang, Q., Wu, X., Rong, R., Lu, Z., et al. (2019a). WHISTLE: a high-accuracy map of the human N6-methyladenosine (m6A) epitranscriptome predicted using a machine learning approach. Nucleic acids Res. 47, e41. doi:10.1093/nar/gkz074
Chen, W., Ding, H., Zhou, X., Lin, H., and Chou, K.-C. (2018). iRNA (m6A)-PseDNC: identifying N6-methyladenosine sites using pseudo dinucleotide composition. Anal. Biochem. 561, 59–65. doi:10.1016/j.ab.2018.09.002
Chen, W., Feng, P., Song, X., Lv, H., and Lin, H. (2019c). iRNA-m7G: identifying N(7)-methylguanosine sites by fusing multiple features. Mol. Ther. Nucleic acids 18, 269–274. doi:10.1016/j.omtn.2019.08.022
Chen, W., Feng, P.-M., Lin, H., and Chou, K.-C. (2013). iRSpot-PseDNC: identify recombination spots with pseudo dinucleotide composition. Nucleic acids Res. 41, e68. doi:10.1093/nar/gks1450
Chen, W., Song, X., Lv, H., and Lin, H. (2019b). iRNA-m2G: identifying N(2)-methylguanosine sites based on sequence-derived information. Mol. Ther. Nucleic acids 18, 253–258. doi:10.1016/j.omtn.2019.08.023
Chen, W., Tang, H., Ye, J., Lin, H., and Chou, K. C. (2016). iRNA-PseU: identifying RNA pseudouridine sites. Mol. Ther. Nucleic acids 5, e332. doi:10.1038/mtna.2016.37
Chen, Z., Zhao, P., Li, C., Li, F., Xiang, D., Chen, Y. Z., et al. (2021b). iLearnPlus: a comprehensive and automated machine-learning platform for nucleic acid and protein sequence analysis, prediction and visualization. Nucleic acids Res. 49, e60. doi:10.1093/nar/gkab122
Dominissini, D., Nachtergaele, S., Moshitch-Moshkovitz, S., Peer, E., Kol, N., Ben-Haim, M. S., et al. (2016). The dynamic N1-methyladenosine methylome in eukaryotic messenger RNA. Nature 530, 441–446. doi:10.1038/nature16998
Dou, L., Zhou, W., Zhang, L., Xu, L., and Han, K. (2021). Accurate identification of RNA D modification using multiple features. RNA Biol. 18, 2236–2246. doi:10.1080/15476286.2021.1898160
Draycott, A. S., Schaening-Burgos, C., Rojas-Duran, M. F., Wilson, L., Schärfen, L., Neugebauer, K. M., et al. (2022). Transcriptome-wide mapping reveals a diverse dihydrouridine landscape including mRNA. PLoS Biol. 20, e3001622. doi:10.1371/journal.pbio.3001622
Feng, P., and Chen, W. (2022). iRNA-m5U: a sequence based predictor for identifying 5-methyluridine modification sites in Saccharomyces cerevisiae. Methods (San Diego, Calif.) 203, 28–31. doi:10.1016/j.ymeth.2021.04.013
Finet, O., Yague-Sanz, C., Krüger, L. K., Tran, P., Migeot, V., Louski, M., et al. (2022). Transcription-wide mapping of dihydrouridine reveals that mRNA dihydrouridylation is required for meiotic chromosome segregation. Mol. Cell 82, 404–419.e9. doi:10.1016/j.molcel.2021.11.003
Fu, L., Niu, B., Zhu, Z., Wu, S., and Li, W. (2012). CD-HIT: accelerated for clustering the next-generation sequencing data. Bioinforma. Oxf. Engl. 28, 3150–3152. doi:10.1093/bioinformatics/bts565
Holley, R. W., Apgar, J., Everett, G. A., Madison, J. T., Marquisee, M., Merrill, S. H., et al. (1965). Structure of a ribonucleic acid. Sci. (New York, N.Y.) 147, 1462–1465. doi:10.1126/science.147.3664.1462
Hou, J., Zhang, H., Liu, J., Zhao, Z., Wang, J., Lu, Z., et al. (2019). YTHDF2 reduction fuels inflammation and vascular abnormalization in hepatocellular carcinoma. Mol. cancer 18, 163. doi:10.1186/s12943-019-1082-3
Huang, D., Chen, K., Song, B., Wei, Z., Su, J., Coenen, F., et al. (2022). Geographic encoding of transcripts enabled high-accuracy and isoform-aware deep learning of RNA methylation. Nucleic acids Res. 50, 10290–10310. doi:10.1093/nar/gkac830
Jia, G., Fu, Y., Zhao, X., Dai, Q., Zheng, G., Yang, Y., et al. (2011). N6-methyladenosine in nuclear RNA is a major substrate of the obesity-associated FTO. Nat. Chem. Biol. 7, 885–887. doi:10.1038/nchembio.687
Jiang, J., Song, B., Chen, K., Lu, Z., Rong, R., Zhong, Y., et al. (2022). m6AmPred: identifying RNA N6, 2'-O-dimethyladenosine (m(6)A(m)) sites based on sequence-derived information. Methods (San Diego, Calif.) 203, 328–334. doi:10.1016/j.ymeth.2021.01.007
Kasprzak, J. M., Czerwoniec, A., and Bujnicki, J. M. (2012). Molecular evolution of dihydrouridine synthases. BMC Bioinforma. 13, 153. doi:10.1186/1471-2105-13-153
Kato, T., Daigo, Y., Hayama, S., Ishikawa, N., Yamabuki, T., Ito, T., et al. (2005). A novel human tRNA-dihydrouridine synthase involved in pulmonary carcinogenesis. Cancer Res. 65, 5638–5646. doi:10.1158/0008-5472.CAN-05-0600
Koh, C. W. Q., Goh, Y. T., and Goh, W. S. S. (2019). Atlas of quantitative single-base-resolution N(6)-methyl-adenine methylomes. Nat. Commun. 10, 5636. doi:10.1038/s41467-019-13561-z
Kowalak, J. A., Bruenger, E., and McCloskey, J. A. (1995). Posttranscriptional modification of the central loop of domain V in Escherichia coli 23 S ribosomal RNA. J. Biol. Chem. 270, 17758–17764. doi:10.1074/jbc.270.30.17758
Kuhn, M. (2008). Building predictive models in R using the caret package. J. Stat. Softw. 28, 1–26. doi:10.18637/jss.v028.i05
Lalović, D., and Veljković, V. (1990). The global average DNA base composition of coding regions may be determined by the electron-ion interaction potential. Bio Syst. 23, 311–316. doi:10.1016/0303-2647(90)90013-q
Lin, H., Deng, E.-Z., Ding, H., Chen, W., and Chou, K.-C. (2014). iPro54-PseKNC: a sequence-based predictor for identifying sigma-54 promoters in prokaryote with pseudo k-tuple nucleotide composition. Nucleic acids Res. 42, 12961–12972. doi:10.1093/nar/gku1019
Liu, B. (2019). BioSeq-Analysis: a platform for DNA, RNA and protein sequence analysis based on machine learning approaches. Briefings Bioinforma. 20, 1280–1294. doi:10.1093/bib/bbx165
Liu, H., Wang, H., Wei, Z., Zhang, S., Hua, G., Zhang, S.-W., et al. (2018). MeT-DB V2. 0: elucidating context-specific functions of N 6-methyl-adenosine methyltranscriptome. Nucleic acids Res. 46, D281–D287. doi:10.1093/nar/gkx1080
Liu, K., and Chen, W. (2020). iMRM: a platform for simultaneously identifying multiple kinds of RNA modifications. Bioinforma. Oxf. Engl. 36, 3336–3342. doi:10.1093/bioinformatics/btaa155
Liu, L., Song, B., Chen, K., Zhang, Y., de Magalhães, J. P., Rigden, D. J., et al. (2021). WHISTLE server: a high-accuracy genomic coordinate-based machine learning platform for RNA modification prediction. Methods 203, 378–382. doi:10.1016/j.ymeth.2021.07.003
Ma, J., Song, B., Wei, Z., Huang, D., Zhang, Y., Su, J., et al. (2022). m5C-Atlas: a comprehensive database for decoding and annotating the 5-methylcytosine (m5C) epitranscriptome. Nucleic acids Res. 50, D196–d203. doi:10.1093/nar/gkab1075
Machnicka, M. A., Olchowik, A., Grosjean, H., and Bujnicki, J. M. (2014). Distribution and frequencies of post-transcriptional modifications in tRNAs. RNA Biol. 11, 1619–1629. doi:10.4161/15476286.2014.992273
Meng, J., Cui, X., Rao, M. K., Chen, Y., and Huang, Y. (2013). Exome-based analysis for RNA epigenome sequencing data. Bioinforma. Oxf. Engl. 29, 1565–1567. doi:10.1093/bioinformatics/btt171
Meng, J., Lu, Z., Liu, H., Zhang, L., Zhang, S., Chen, Y., et al. (2014). A protocol for RNA methylation differential analysis with MeRIP-Seq data and exomePeak R/Bioconductor package. Methods (San Diego, Calif.) 69, 274–281. doi:10.1016/j.ymeth.2014.06.008
Mitchell, S. F., Jain, S., She, M., and Parker, R. (2013). Global analysis of yeast mRNPs. Nat. Struct. Mol. Biol. 20, 127–133. doi:10.1038/nsmb.2468
Song, B., Huang, D., Zhang, Y., Wei, Z., Su, J., Pedro de Magalhães, J., et al. (2022). m6A-TSHub: unveiling the context-specific m(6)A methylation and m6A-affecting mutations in 23 human tissues. Genomics, proteomics Bioinforma. doi:10.1016/j.gpb.2022.09.001
Song, B., Tang, Y., Chen, K., Wei, Z., Rong, R., Lu, Z., et al. (2020). m7GHub: deciphering the location, regulation and pathogenesis of internal mRNA N7-methylguanosine (m7G) sites in human. Bioinforma. Oxf. Engl. 36, 3528–3536. doi:10.1093/bioinformatics/btaa178
Song, B., Wang, X., Liang, Z., Ma, J., Huang, D., Wang, Y., et al. (2023). RMDisease V2.0: an updated database of genetic variants that affect RNA modifications with disease and trait implication. Nucleic acids Res. 51, D1388–d1396. doi:10.1093/nar/gkac750
Su, R., Dong, L., Li, Y., Gao, M., Han, L., Wunderlich, M., et al. (2020). Targeting FTO suppresses cancer stem cell maintenance and immune evasion. Cancer Cell 38, 79–96. doi:10.1016/j.ccell.2020.04.017
Tang, Y., Chen, K., Song, B., Ma, J., Wu, X., Xu, Q., et al. (2021). m6A-Atlas: a comprehensive knowledgebase for unraveling the N 6-methyladenosine (m6A) epitranscriptome. Nucleic acids Res. 49, D134–D143. doi:10.1093/nar/gkaa692
Wang, X., Zhang, Y., Chen, K., Liang, Z., Ma, J., Xia, R., et al. (2023a). m7GHub V2.0: an updated database for decoding the N7-methylguanosine (m7G) epitranscriptome. Nucleic acids Res., gkad789. doi:10.1093/nar/gkad789
Wang, Y., Wang, X., Cui, X., Meng, J., and Rong, R. (2023b). Self-attention enabled deep learning of dihydrouridine (D) modification on mRNAs unveiled a distinct sequence signature from tRNAs. Mol. Ther. Nucleic acids 31, 411–420. doi:10.1016/j.omtn.2023.01.014
Xing, F., Hiley, S. L., Hughes, T. R., and Phizicky, E. M. (2004). The specificities of four yeast dihydrouridine synthases for cytoplasmic tRNAs. J. Biol. Chem. 279, 17850–17860. doi:10.1074/jbc.M401221200
Xu, Q., Chen, K., and Meng, J. (2021). WHISTLE: a functionally annotated high-accuracy map of human m(6)a epitranscriptome. Methods Mol. Biol. Clift. N.J.) 2284, 519–529. doi:10.1007/978-1-0716-1307-8_28
Xu, Z. C., Feng, P. M., Yang, H., Qiu, W. R., Chen, W., and Lin, H. (2019). iRNAD: a computational tool for identifying D modification sites in RNA sequence. Bioinforma. Oxf. Engl. 35, 4922–4929. doi:10.1093/bioinformatics/btz358
Yang, H., Lv, H., Ding, H., Chen, W., and Lin, H. (2018). iRNA-2OM: a sequence-based predictor for identifying 2'-O-methylation sites in Homo sapiens. J. Comput. Biol. a J. Comput. Mol. Cell Biol. 25, 1266–1277. doi:10.1089/cmb.2018.0004
Yang, X., Yang, Y., Sun, B. F., Chen, Y. S., Xu, J. W., Lai, W. Y., et al. (2017). 5-methylcytosine promotes mRNA export - NSUN2 as the methyltransferase and ALYREF as an m(5)C reader. Cell Res. 27, 606–625. doi:10.1038/cr.2017.55
Zhang, Y., Huang, D., Wei, Z., and Chen, K. (2022). Primary sequence-assisted prediction of m(6)A RNA methylation sites from Oxford nanopore direct RNA sequencing data. Methods (San Diego, Calif.) 203, 62–69. doi:10.1016/j.ymeth.2022.04.003
Zhang, Y., Jiang, J., Ma, J., Wei, Z., Wang, Y., Song, B., et al. (2023). DirectRMDB: a database of post-transcriptional RNA modifications unveiled from direct RNA sequencing technology. Nucleic acids Res. 51, D106–d116. doi:10.1093/nar/gkac1061
Keywords: dihydrouridine, machine learning, Escherichia coli, Schizosaccharomyces pombe, Saccharomyces cerevisiae
Citation: Ren J, Chen X, Zhang Z, Shi H and Wu S (2023) DPred_3S: identifying dihydrouridine (D) modification on three species epitranscriptome based on multiple sequence-derived features. Front. Genet. 14:1334132. doi: 10.3389/fgene.2023.1334132
Received: 06 November 2023; Accepted: 29 November 2023;
Published: 15 December 2023.
Edited by:
Yuan Zhou, Peking University, ChinaReviewed by:
Bowen Song, Nanjing University of Chinese Medicine, ChinaTeng Zhang, Jiangsu University of Science and Technology, China
Copyright © 2023 Ren, Chen, Zhang, Shi and Wu. This is an open-access article distributed under the terms of the Creative Commons Attribution License (CC BY). The use, distribution or reproduction in other forums is permitted, provided the original author(s) and the copyright owner(s) are credited and that the original publication in this journal is cited, in accordance with accepted academic practice. No use, distribution or reproduction is permitted which does not comply with these terms.
*Correspondence: Shuxiang Wu, d3VzaHV4aWFuZ0Bmam11LmVkdS5jbg==
 Jinjin Ren
 Xiaozhen Chen1
 Haoran Shi
 Shuxiang Wu
