 Sihui Huang
 Jie Wang
 Nannan Liu
 Ping Li1,2
 Luming Qi
- 1College of Health and Rehabilitation, Chengdu University of Traditional Chinese Medicine, Chengdu, China
- 2Key Laboratory of Traditional Chinese Medicine Regimen and Health Industry Development, State Administration of TCM, Chengdu, China
- 3Leshan Vocational and Technical College, Leshan, China
Genome-wide association study (GWAS) have identified over 1,000 loci associated with blood pressure. However, these loci only explain 6% of heritability. Transcriptome-wide association studies (TWAS) combine GWAS summary data with expression quantitative trait loci (eQTL) to provide a better approach to finding genes associated with complex traits. GWAS summary data (N = 450,584) for essential hypertension originating from European samples were subjected to Post-GWAS analysis using FUMA software and then combined with eQTL data from Genotype-Tissues Expression Project (GTEx) v8 for TWAS analysis using UTMOST, FUSION software, and then validated the results with SMR. FUMA identified 346 significant genes associated with hypertension, FUSION identified 461, and UTMOST cross-tissue analysis identified 34, of which 5 were common. SMR validation identified 3 key genes: ENPEP, USP38, and KCNK3. In previous GWAS studies on blood pressure regulation, the association of ENPEP and KCNK3 with hypertension has been established, and the association between USP38 and blood pressure regulation still needs further validation.
1 Introduction
Hypertension is an important risk factor for many diseases, such as dementia, chronic kidney disease, ischemic heart disease, stroke, and other cardiovascular diseases (CVD) (Zhou et al., 2021). From 1990 to 2019, the number of people aged 30 to 79 with hypertension worldwide increased from 650 million to 1.28 billion (NCD Risk Factor Collaboration, 2021). Between 1990 and 2015, as the rate of elevated systolic pressure increased, so did the disabilities and deaths associated with it (Forouzanfar et al., 2017). Elevated blood pressure contributes to a huge global burden of CVD and premature death. Essential hypertension is a multi-gene and multi-factor disease caused by the interaction of environment and heredity and it accounts for about 95% of hypertension cases.
The heritability of blood pressure is estimated to be 30%–50% (Russo et al., 2018), and twin studies showed that monozygotic twins were more correlated with blood pressure phenotypes than dizygotic twins (Luft, 2001). A multi-generational cohort study indicated that early-onset hypertension in grandparents increased the risk of high blood pressure in grandchildren (Niiranen et al., 2017). However, the first genome-wide association study (GWAS) for hypertension can’t find significant loci (Hirschhorn and Daly, 2005), possibly because hypertension has fewer common risk alleles but has a large effect size that was not detected due to the limitations of genetic analysis and analytical methods (Wellcome Trust Case Control, 2007). Two years later, a GWAS meta-analysis based on six cohorts identified 10 SNPs associated with hypertension and mapped them to a corresponding gene ATP2B1 (Levy et al., 2009). In a subsequent meta-analysis of blood pressure in more than one million people, 535 novel loci associated with blood pressure were identified (Evangelou et al., 2018). The GWAS research has continued for over a decade, and it has found over 1,000 blood pressure loci which explain about 6% of the heritability based on single nucleotide polymorphism (SNP) (Olczak et al., 2021). However, most of the disease trait loci identified by GWAS studies are located in non-coding regions, so it’s difficult to evaluate their function (Maurano et al., 2012). Transcriptome-wide association study (TWAS) integrates individual-level genotype data or GWAS summary data with expression quantitative trait loci (eQTL) to evaluate the association between gene expression level and complex traits or diseases (Page et al., 2021). Compared to GWAS, TWAS is a gene-based association approach with tissue specificity, and it has a lower burden of multiple testing (Page et al., 2021). In recent years, TWAS is widely used in genetic epidemiology to search for genes associated with complex phenotypes (Dall'Aglio et al., 2021; Pairo-Castineira et al., 2021).
To find the key genes of essential hypertension, we integrated the GWAS data including 450,584 samples and the eQTL file from Genotype-Tissues Expression Project (GTEx) v8 (Consortium, 2020), which were analyzed using FUMA (Watanabe et al., 2017), UTMOST (Hu et al., 2019), and FUSION (Gusev et al., 2016) software respectively, and we finally validated the results using SMR (Zhu et al., 2016). The main target organs of hypertension are the heart, kidneys, brain, retina, and arteries, and the activation of the renin-angiotensin-aldosterone system, oxidative stress, and inflammation plays an important role in the pathogenesis of hypertension (Kucmierz et al., 2021). Therefore, hypertension may hurt various systems within the body. We used the eQTL information of all the tissues and finally identified three key genes associated with essential hypertension: ENPEP, USP38, and KCNK3.
2 Materials and methods
2.1 Datasets
To obtain a larger sample size, we identified hypertension GWAS summary data from two databases and performed a meta-analysis using metal software (http://csg.sph.umich.edu/abecasis/metal/) to get statistics of greater efficacy. One contains a sample of 244,890 participants (71,332 cases, 173,558 controls) from the UK Biobank by Kyoko Watanabe (https://atlas.ctglab.nl) and the other 205,694 participants (42,857 cases, 162,837 controls) from FinnGen (https://www.finngen.fi/en/access_results). Based on the p-values of the two GWAS summary data SNPs, we used a fixed effects inverse variance weighted meta-analysis in METAL software (Willer et al., 2010). The direction of effect and p-value in each study were converted into Z-score, and the Z-score for each allele were combined in a weighted form in the sample with weights proportional to the square root of the sample size in each study (Willer et al., 2010). To improve statistical validity, we screened the common SNPs in two GWAS datasets with a total of 8,436,487. The main model weights file of gene expression was derived from GTEx v8 (16). The reference panel used to estimate linkage disequilibrium (LD) was derived from the 1,000 Genomes Europe sample (Genomes Project et al., 2015).
2.2 Characterization and annotation of genetic associations with functional mapping and annotation
Functional Mapping and Annotation (FUMA) serves as a post-GWAS analysis tool, integrating information from multiple biological resources to perform gene prioritization, functional annotation, and visual analysis of GWAS results (Watanabe et al., 2017). We performed the following analysis of the hypertension GWAS data prepared in advance using FUMA (v1.3.7). First, appropriate parameters for determining the priority genes were set. Independent significant SNPs were defined as genome-wide p < 5 × 10⁻⁸ and LD r2 < 0.6. Lead SNPs were defined as those independent from each other at r2 < 0.1 inside a subset of independent significant SNPs (Watanabe et al., 2017). Based on the lead SNPs, genomic risk loci were physically located close to or overlapped with these independent signals. The distance of the genetic risk region was determined according to the default of 250 kb. The data from phase 3 of the European 1000G project were used for the LD reference.
Next, gene analysis and gene-set analysis were performed using the default parameters of the MAGMA (v1.08) software implemented in FUMA. The gene analysis with MAGMA is based on multilinear principal component regression, where the SNP matrix of genes is projected onto the principal components and the F-test is used to calculate the gene p-values (de Leeuw et al., 2015). Therefore, a gene analysis on input GWAS data can be done in MAGMA. If SNPs are located within the gene, the gene-base p-value of the protein-coding gene is calculated by mapping the SNPs to the gene (Watanabe et al., 2017). The threshold for Bonferroni correction is 0.05/18,800 (number of genes tested). The gene-set analysis is divided into two distinct and largely independent parts: self-contained and competitive gene-set analysis, so it is more flexible (de Leeuw et al., 2015). The gene-set analysis used 10,678 gene sets from MsigDB v6.2, with 4,761 curated gene sets and 5,917 GO terms. Bonferroni correction was performed for all tested gene sets.
2.3 Transcriptome-wide associationstudies
2.3.1 Transcriptome-wide association studies analysis with UTMOST
Because hypertension is associated with all systems of the body (Kucmierz et al., 2021), the conventional approach to TWAS analysis is to train separate attribution models for different tissues (Gusev et al., 2016). Such hypothesis-free searches across genes and tissues increase the burden of multiple testing and reduce statistical power (Hu et al., 2019). However, a new method Unified Test for Molecular SignaTures (UTMOST) (http://zhaocenter.org/UTMOST), which combines multiple single-tissue associations into a single powerful metric to quantify the entire genetic-trait associations, can improve the accuracy of imputation (Hu et al., 2019). Single-tissue association tests were then performed in conjunction with the hypertension GWAS summary statistics. Finally, we used the generalized Berk-Jones (GBJ) test to combine single-tissue gene-trait associations. Considering the number of valid tests, we set the transcriptome-wide significance threshold for the joint test at p < 2.26193 × 10⁻⁶ (0.05/22,105).
2.3.2 Transcriptome-wide association studies analysis with FUSION
Functional Summary-based Imputation (FUSION) was commonly used for TWAS analysis to estimate heritability, build predictive models, and determine transcriptome-wide associations (Li et al., 2021). We performed TWAS analysis with the above meta-merged hypertension GWAS data using the FUSION software with default settings (http://gusevlab.org/projects/fusion/). Then, we downloaded 49 tissues’ eQTL reference panels from GTEx v8 for which predictive models had been built.
Next, 1,000 Genomes European samples (https://data.broadinstitute.org/alkesgroup/FUSION/LDREF.tar.bz2) were used to estimate the LD between the prediction model and the SNP at each locus of GWAS (Gusev et al., 2019). The Bonferroni-corrected TWAS threshold was defined as p < 1.51 × 10⁻⁷ (0.05/330,952) (total number of predictive models).
2.4 Joint/conditional analysis
To distinguish whether multiple significant genes in a locus were independently associated or interlinked with each other, we performed joint/conditional tests using the post-process module in FUSION(25). Multiple associated genes within the region identified by TWAS were modeled jointly to determine which was the independent association signal, and each hypertension GWAS association was conditioned on the joint model, with one SNP at a time (Liao et al., 2019). After testing, genes that represent independent associations were termed jointly significant, and those that were no longer significant were termed marginally significant.
2.5 Bayesian colocalization
To determine whether the GWAS summary data and eQTL signal shared the same causal variant, we performed a Bayesian colocalization analysis using the COLOC R package (https://cran.r-project.org/web/packages/coloc/, version 5.1.0). The colocation test is based on sample size and converts the relevant statistics into an effect size. This approach estimates the posterior probability (PP) that two outcomes within a locus are associated and driven by a common causal variable (Dall'Aglio et al., 2021). There are 5 PP statistics for the hypothesis: H0 (not related), H1 (a causal variant for GWAS only), H2 (a causal variant for eQTL only), H3 (two independent causal variants), and H4 (a shared causal variant). If PP4 is larger (PP4 >75%), it indicates that a single variant affects both traits (Giambartolomei et al., 2014).
2.6 Results validation using SMR
A research method SMR based on Mendelian randomization was proposed by Zhu et al., in 2016 (20). It is a joint analysis of GWAS signal and expression and methylation quantitative traits loci (eQTL and mQTL, respectively) to determine the associations between gene expression levels and traits (Baranova et al., 2021). We analyzed the hypertension GWAS data using the eQTL data of 49 human tissues from GTEx v8 (n = 73–670) (Consortium, 2020). Genotype data from the European 1000 Genomes Project Phase 3 were used to estimate the LD. The heterogeneity in dependent instruments (HEIDI) test was conducted to estimate the heterogeneity between effects. We performed this analysis using the default parameters of the SMR software (https://yanglab.westlake.edu.cn/software/smr/#SMR). A strict Bonferroni-corrected SMR threshold of p < 0.05/number of probes, and p > 0.05 was used as the threshold for the HEIDI test (Restuadi et al., 2022).
3 Results
3.1 Study overview
We used GWAS summary statistics regarding essential hypertension from two European sample databases to first perform Post-GWAS analysis on the FUMA platform to identify independently significant SNPs and corresponding genes. Next, we combined multiple tissues’ eQTL files from GTEx v8 and GWAS data for TWAS analysis. We used both the UTMOST and the FUSION software for TWAS analysis. The results of TWAS were merged with the genes identified by FUMA. Finally, the merged results were validated by SMR (Figure 1).
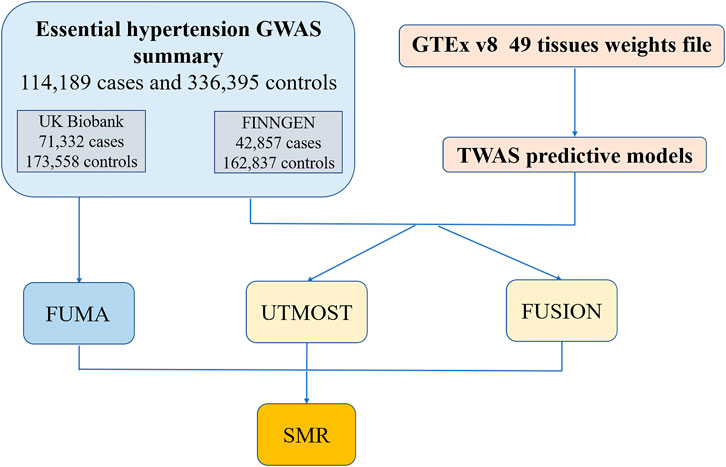
FIGURE 1. The workflow of the study. GWAS, genome-wide association; GTEx, Genotype-Tissues Expression Project; TWAS, transcriptome-wide association studies; FUMA, functional mapping and annotation; UTMOST, unified test for molecular signatures; FUSION, functional summary-based imputation; SMR, summary-data-based Mendelian randomization.
3.2 The results of post-genome-wide association study annotation by functional mapping and annotation
We used the FUMA platform to functionally annotate summary statistics of hypertensive GWASs, including 114,189 cases and 336,395 controls. Based on the previously set parameters, FUMA identified 173 genomic risk loci associated with essential hypertension (Supplementary Table S1). Within these loci, there were 248 lead SNPs and 662 independent significant SNPs (Supplementary Tables S2, S3). There were 21,127 candidate SNPs that had LD with the lead SNPs. Among the candidate SNPs, those with significant differences were located in intronic (10,958), intergenic (6,411), non-coding RNA intronic (2,278), UTR3 (271), and UTR5 (104) (Supplementary Table S4). Of the total number of SNPs, 7,848 were reported in previous studies, 27 of which were identified in one of the largest GWAS studies on hypertension by Evangelou et al., 2018.
The input SNPs mapped to 18,800 protein-coding genes. According to the set threshold, 346 genes met the genome-wide significant requirement (Supplementary Table S5). The top three differentially expressed genes were CACNB2 (p = 1.18E - 28), CMIP (p = 1.57E - 21) and CUX2 (p = 9.47E - 18). The CACNB2 gene has been reported in a previous genome-wide association study of blood pressure and hypertension (Levy et al., 2009). Based on the input GWAS summary statistics, significant genes identified by the MAGMA gene-based test were plotted on a Manhattan map (Figure 2). MAGMA’s gene-set analysis tested 15,483 gene sets using the default competitive testing model, with the top 10 gene sets provided in Supplementary Table S6. The top three most significant pathways were positive regulation of gene expression (p = 7.37E - 07), positive regulation of biosynthetic process (p = 1.22E - 06), and positive regulation of RNA biosynthetic process (p = 1.50E - 06). It is suggested that hypertension is associated with gene expression, RNA biological processes, which explains the heritability of hypertension.
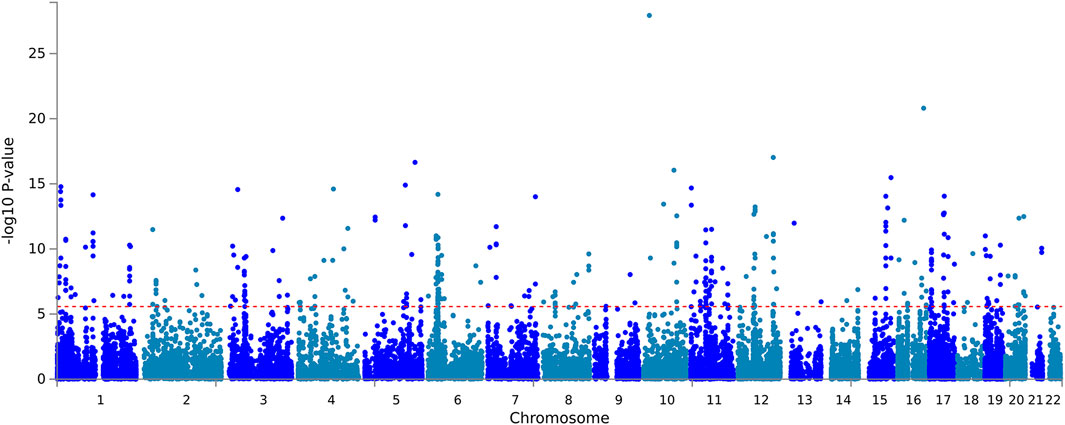
FIGURE 2. Manhattan Plot of MAGMA gene-based test. Gene-based testing using MAGMA based on input GWAS summary statistics for essential hypertension. Red lines indicate levels of genome-wide significance (-log10P).
3.3 Transcriptome-wide association studies result
3.3.1 UTMOST single-tissue analysis
UTMOST single tissue analysis identified 483 significant gene-trait associations (Supplementary Table S7) between 83 genes and 49 tissues (49 tissues from GTEx v8). Of the 83 TWAS-significant genes, 15 had significant associations with more than ten tissues, including KCNK3, SH3D19, AGBL5-IT1, ASXL2, BMP3, DPYSL5, USP38, ENPEP, RP11-286E11.2, LEF1, RAB10, TCF23, SNORA70F, MLPH, and TMEM214. These 15 genes together contributed 310 (64.2%) of the 483 significant loci, suggesting that they are crucial in essential hypertension. Of these 483 significant loci, there were 203 significant loci in the heart, brain, kidney, and arterial tissues which are common targets of hypertension. There were 15 loci in the ovary, 14 loci in adipose subcutaneous, and 14 loci in the minor salivary gland, and the associations between these tissues and hypertension need further validation.
3.3.2 UTMOST cross-tissue analysis
In the cross-tissue analysis, we found 34 genes that showed statistical significance, as detailed in Table 1. These 34 significant genes were all concentrated on three chromosomes:2, 4, and 18. Of the 15 significant genes identified in the previous single-tissue analysis, 14 were among the significant genes identified in the cross-tissue analysis. The remaining one, MLPH, is a gene encoding melanin, and no association with hypertension has been found in the previous literatures. Among the 34 significant genes identified by the cross-tissue analysis, MFSD10 had no significant p-value in single-tissue analysis. The protein encoded by MFSD10 may be involved in the efflux of organic anions. MFSD10 has been identified as an eosinophil-specific surface molecule that may be an effective therapeutic target for eosinophil-related diseases (Nishimura et al., 2014). Whether there is an association between MFSD10 and hypertension needs further study.
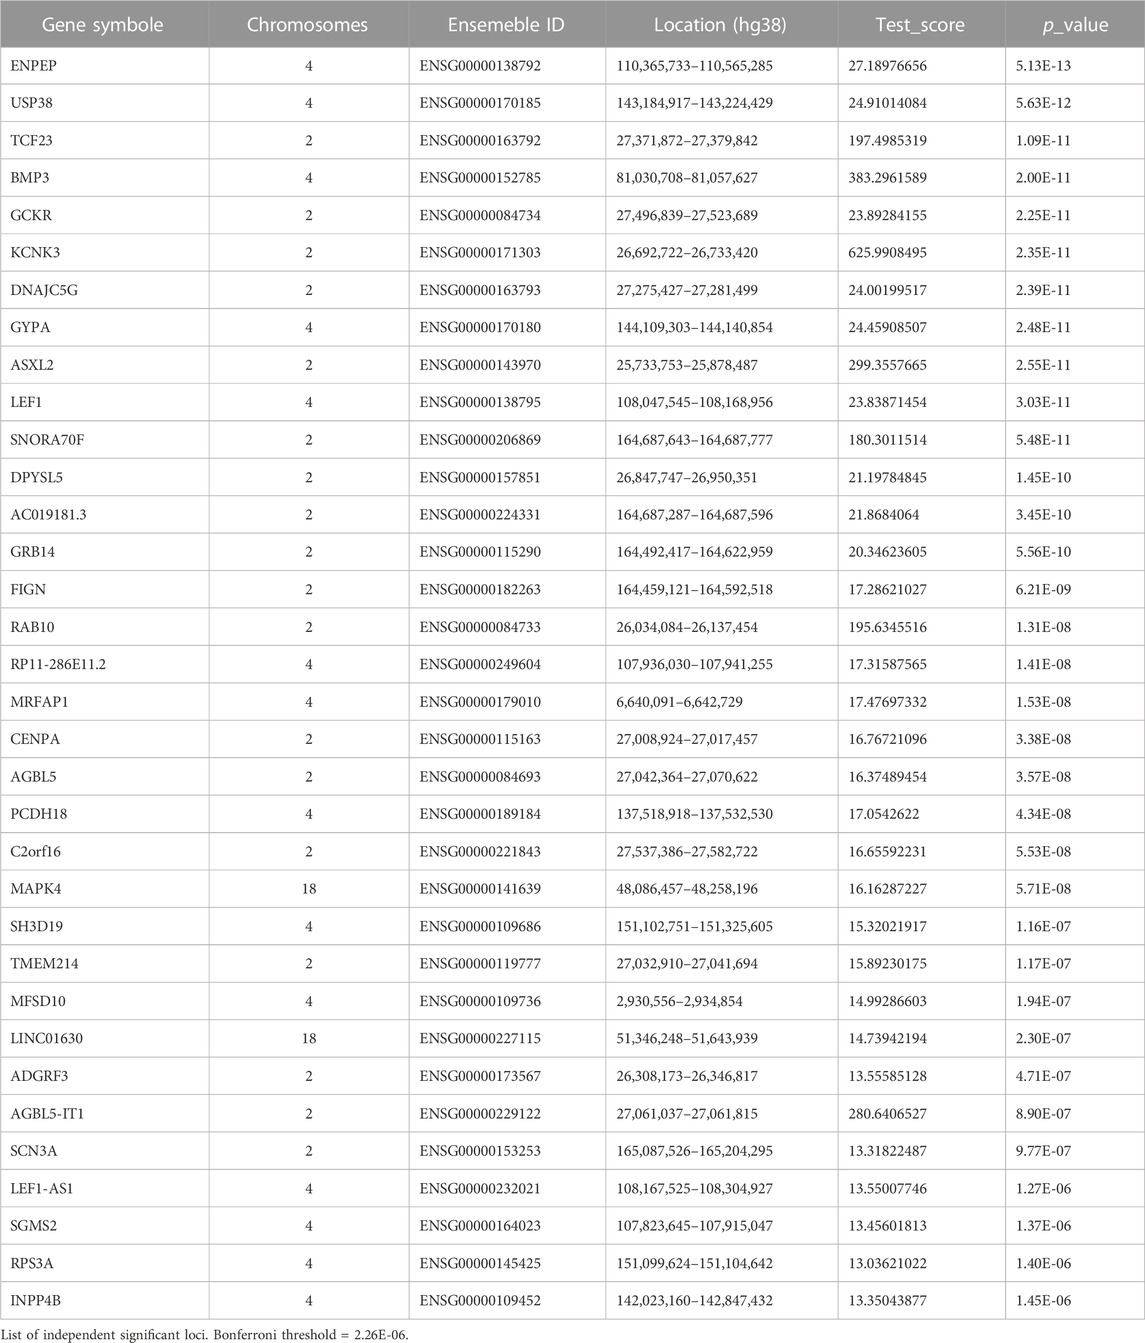
TABLE 1. UTMOST cross tissue analysis result.
3.4 FUSION conditional analysis and colocalization results
We identified 461 significant genes through TWAS analysis of hypertension GWAS statistical summary data and 49 tissue eQTL data from GTEx v8 using FUSION software (Supplementary Table S7). To reduce false-positive results and obtain more statistically significant association results, we combined the UTMOST cross-tissue results with the significant genes detected by FUSION and FUMA and identified five common significant genes (Figure 3; Table 2). We identified 20 significant features from 5 unique genes (KCNK3, ENPEP, LEF1, USP38, MAPK4) that were differentially expressed in different tissues. Among the 20 significant features, 4 were upregulated, while 16 were downregulated. The most significant feature was KCNK3 (GTEx pancreas) (Z = −13.97, p = 2.41E-44).
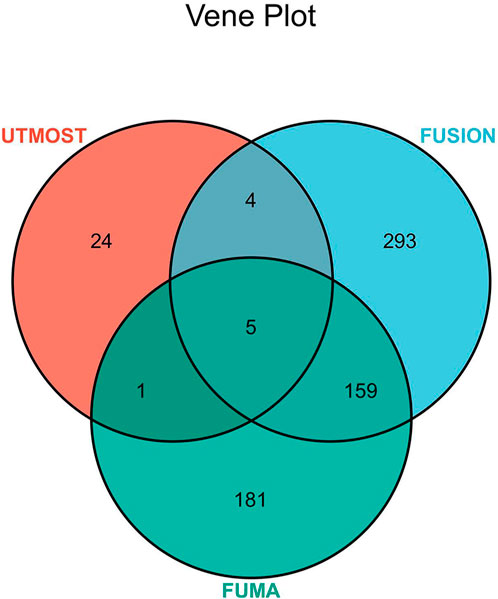
FIGURE 3. Venn diagram. FUMA identified 346 significant genes associated with hypertension, FUSION identified 461, and UTMOST cross-tissue analysis identified 34, of which 5 were common.
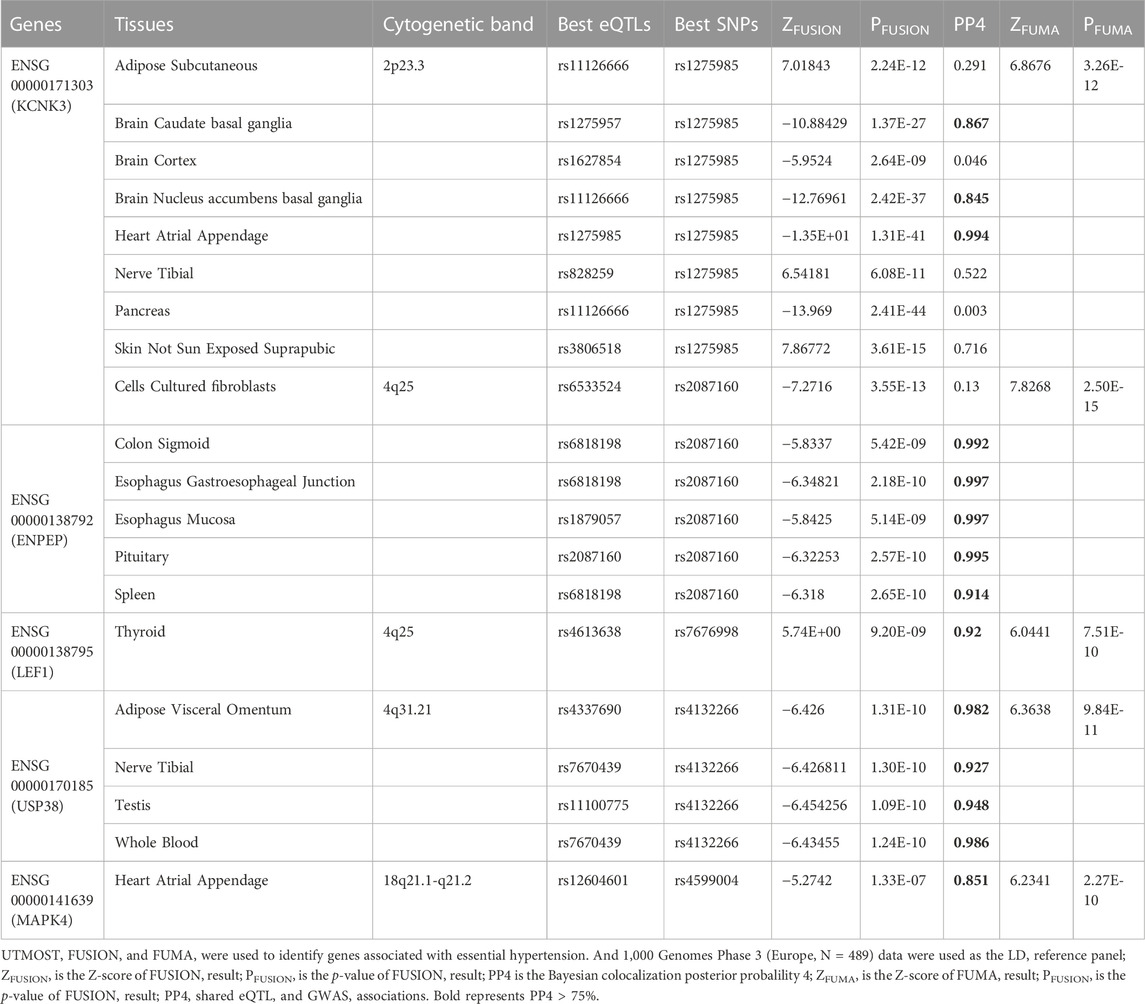
TABLE 2. List of the significant candidate genes identified by UTMOST, FUSION and FUMA.
KCNK3 is located on chromosome 2p23.3. The results of FUSION showed that it was significant in the adipose subcutaneous, brain caudate basal ganglia, brain cortex, brain nucleus accumbens basal ganglia, heart atrial appendage, nerve tibial, pancreas, skin not sun-exposed suprapubic. The results of the conditional analysis showed that the KCNK3 gene was able to explain all the signals at this locus (rs1275985 lead SNPGWAS p = 1.40E-50, conditioned on KCNK3 lead SNPGWAS p = 1) (Figure 4A). Bayesian colocalization results showed that the gene was greater than 75% of PP4 in three tissues: brain caudate basal ganglia, brain nucleus accumbens basal ganglia, and heart atrial appendage (Table 2).
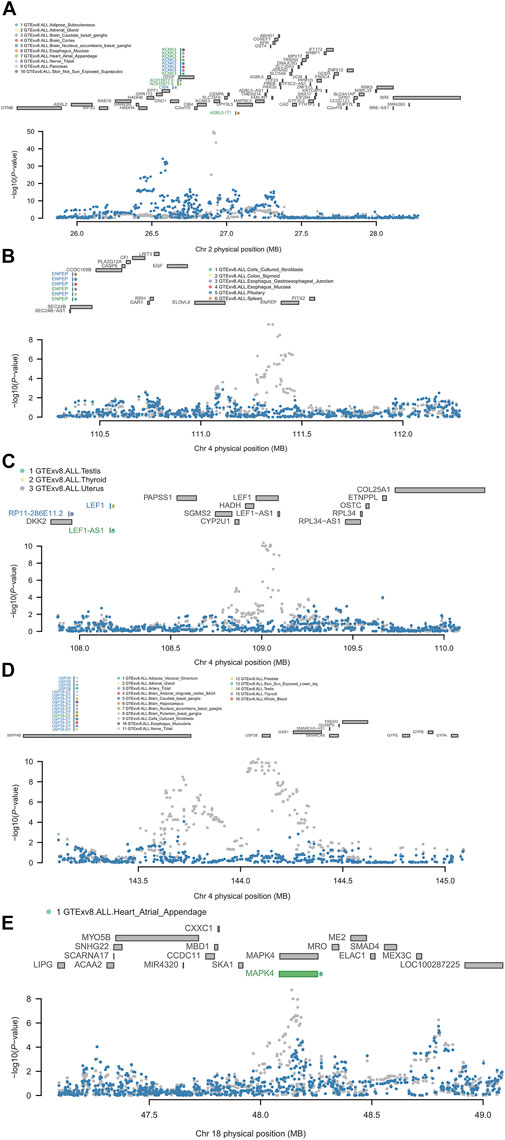
FIGURE 4. Regional association of TWAS hits. (A) Chromosome 2 regional association plot. (B) Chromosome 4 regional association plot (part 1). (C) Chromosome 4 regional association plot (part 2). (D) Chromosome 4 regional association plot (part 3). (E) Chromosome 18 regional association plot. The marginally associated TWAS genes are shown in blue, and the conditionally significant genes are shown in green. The bottom panel shows a regional Manhattan plot of the GWAS data before (gray) and after (blue) conditioning on the green genes’ predicted expression.
ENPEP is located on chromosome 4q25, the results of FUSION showed that it was significant in the cells cultured fibroblasts, colon sigmoid, esophagus gastroesophageal junction, esophagus mucosa, pituitary, and spleen. It was observed that ENPEP explained all of the signals at its loci (rs2087160 lead SNPGWAS p = 2.50E-10, conditioned on ENPEP lead SNPGWAS p = 1) (Figure 4B). Bayesian colocalization resulting from ENPEP showed that PP4 was greater than 75% in all five tissue (Table 2), except for cells cultured fibroblasts.
LEF1 is also located on chromosome 4q25 and the FUSION results revealed that it was only significant in thyroid tissue. It was found that LEF1 explained all of the signals at its loci (rs7676998 lead SNPGWAS p = 4.20E-11, conditioned on LEF1 lead SNPGWAS p = 1) (Figure 4C). Bayesian colocalization results showed a PP4 of 0.92 (Table 2).
USP38 is located on chromosome 4q31.21, the results of FUSION showed its significance in the adipose visceral omentum, nerve tibial, testis, and whole blood. It was found that USP38 explained a portion of the signal at its loci (rs4132266 lead SNPGWAS p = 5.70E-11, conditioned on USP38 lead SNPGWAS p = 0.14) (Figure 4D). The Bayesian colocalization results for PP4 were greater than 75% in all four tissues (Table 2).
MAPK4 is located on chromosome 18q21.1-q21.2 and the FUSION results illustrated that it was only significant in heart atrial appendage. It was observed that MAPK4 only explained the weak signal at its loci (rs4599004 lead SNPGWAS p = 1.80E-09, conditioned on MAPK4 lead SNPGWAS p = 0.00063) (Figure 4E). Bayesian colocalization results show a PP4 of 0.85 (Table 2).
3.5 SMR validation results
To verify whether there is a causal relationship between these five genes and essential hypertension, we validated the GWAS data for hypertension with the GTEx v8 data in SMR. We found that the expression of 3 genes in 10 tissues was significantly associated with hypertension (PSMR < 0.05/number of probes), and there was no significant heterogeneity underlying the eQTL signals (PHEIDI > 0.05) (Table 3). LEF1 and MAPK4 were not found to be significant in the validation of Mendelian randomization-based summary data from 49 tissues. Three features among ten tissues were downregulated, suggesting a protective effect of these three genes for essential hypertension (Table 3). The gene ENPEP had been found to be associated with hypertension in a meta-analysis (Surendran et al., 2016). KCNK3 was also identified to be associated with blood pressure in a genome-wide association study (Kato et al., 2015). However, these three genes were not reported in one of the largest GWAS studies on hypertension by Evangelou et al., 2018.
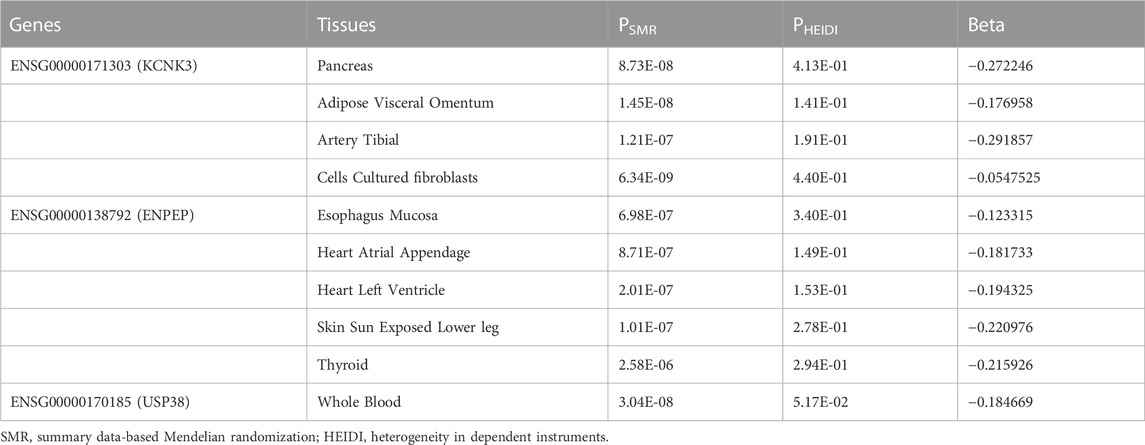
TABLE 3. SMR validates the association of 5 genes in different tissues.
4 Discussion
As blood pressure is regulated by a complex network of renal, neurological, cardiac, vascular, and endocrine mechanisms under the influence of genetic and environmental factors, hypertension is likewise a multifactorial and complex trait (Padmanabhan and Dominiczak, 2021). The rapid development of genome-wide association study has identified over 1,477 common SNPs associated with blood pressure traits (Padmanabhan and Joe, 2017; Evangelou et al., 2018; Giri et al., 2019). A systematic evaluation identified 62 genes associated with essential hypertension, and after being screened according to a series of inclusion and exclusion criteria, only 21 genes were matched (Manosroi and Williams, 2019). Determining which genes are the key genes for polygenic hypertension has been an ongoing quest for researchers working on hypertension.
In our study, different methods were used to combine the essential hypertension GWAS summary statistics from European samples with eQTL data from GTEx v8. FUMA identified 346 significant genes associated with hypertension, FUSION identified 461, and UTMOST cross-tissue analysis identified 34, five of which were common. Three (KCNK3, ENPEP, and USP38) of these five genes (KCNK3, ENPEP, USP38, LEF1, and MAPK4) were simultaneously validated by SMR. Results obtained by UTMOST single-tissue analysis and FUSION software analysis showed that significant genes were detected in each of the 49 tissues of GTEx v8. This result further validates that hypertension is a disease that involving all systems of the body.
The protein encoded by KCNK3 is sensitive to changes in extracellular pH (also named acid-sensitive potassium channel protein TASK-1). TASK-1 is expressed in a variety of cells, such as carotid vesicles, lung smooth muscle cells, motor neurons, and adrenal glomerulosa cells (Olschewski et al., 2017). It modulates muscle contraction and promotes arterial relaxation through the resting membrane potential of human pulmonary artery smooth muscle cells (Ma et al., 2013). Several studies have shown that KCNK3 is closely associated with pulmonary arterial hypertension (Ma et al., 2013; Antigny et al., 2016; Southgate et al., 2020). A genome-wide association study identified KCNK3 as a genetic locus that affected blood pressure (Kato et al., 2015). Animal studies have demonstrated that aldosterone is mildly elevated in TASK-1 deficient mice, causing hypertension (Manichaikul et al., 2016). It is well known that obesity is a risk factor for hypertension (Jones et al., 2012). A recent study found that KCNK3 antagonized norepinephrine-induced membrane depolarization by promoting potassium efflux in brown adipocytes, inhibiting adrenergic signaling and thereby attenuating lipolysis and thermogenic respiration (Chen et al., 2017). Whether there is an association between KCNK3 in the regulation of obesity and hypertension remains to be further investigated.
The ENPEP encodes a glutamyl aminopeptidase, also named aminopeptidase A (APA), which converts angiotensin Ⅱ (Ang Ⅱ) to angiotensin Ⅲ (Ang Ⅲ). Ang Ⅱ activates angiotensin 1 (AT1) receptors causing vasoconstriction, while Ang Ⅲ activates angiotensin 2 (AT2) receptors causing vasodilation (Te Riet et al., 2015). APA is expressed in several tissues, especially in the small intestine, kidney, duodenum, placenta, and endometrium in high amounts (Fagerberg et al., 2014). ENPEP was found to be associated with hypertension in a genome-wide association study in humans (Surendran et al., 2016). ENPEP knockout mice, infused with low doses of angiotensin Ⅱ, showed a significant increase in blood pressure (Mitsui et al., 2003). In the circulatory system, Ang Ⅲ is an AT2 receptor agonist, however, in the brain, it is an AT1 receptor agonist (O'Connor et al., 2022). In brain tissue, therefore, APA is capable of causing an increase in blood pressure. An APA inhibitor with high brain tissue selectivity--EC33, blocks the activity of APA in the brain, thereby lowering blood pressure (Llorens-Cortes and Touyz, 2020).
The USP38-encoded protein is involved in protein deubiquitination in the cytoplasmic matrix and nucleus. It has been found that USP38 is a novel histone deubiquitinating enzyme that acts in concert with the histone H3K4-specific demethylase KDM5B to orchestrate the inflammatory response (Zhao et al., 2020). USP38 deficiency-mediated inhibition of H3K4me3 demethylation enhances the inflammatory response and there is an interaction between histone ubiquitination and methylation through the USP38/KDM4B axis in gene transcriptional regulation and the inflammatory response (Zhao et al., 2020). The expression of deubiquitinases in vascular cells is important for maintaining vascular physiology and homeostasis, and it has been shown that USP20 and USP33 can be involved in the regulation of blood pressure by affecting the transport and stabilization of the β2AR (Wang et al., 2020). It has been shown that USP2-45 and USP8 can reverse the binding of the E3 ubiquitin protein ligase Nedd4-2 to epithelial Na+ channels, which in turn affects Na+ transport and uptake, which are closely associated with hypertension (Zhou et al., 2013). USP38 knockout mice showed more severe signs of inflammatory response in acute colitis and lung injury induced by endotoxic shock (Zhao et al., 2020). Current research has linked USP38 to the development of many diseases such as asthma (Hirota et al., 2011), pulmonary fibrosis (Yi et al., 2022), and colorectal cancer (Zhan et al., 2020). Inflammation plays an important role in the pathogenesis of hypertension and it has been suggested that the combination of impaired urinary sodium relationships, vasorelaxation, and increased sympathetic activity caused by inflammation leads to hypertension (Rodriguez-Iturbe et al., 2017). As a deubiquitinating enzyme, USP38 plays an important role in the regulation of inflammation and this family of deubiquitinating enzymes has been found to be closely associated with the development of hypertension, so whether there is a direct association between USP38 and hypertension needs to be further investigated.
In summary, our study identified three key genes in essential hypertension: KCNK3, ENPEP, and USP38. Among them, ENPEP is closely associated with hypertension, and drugs targeting this gene have been investigated. In previous GWAS studies on blood pressure regulation, the association of ENPEP and KCNK3 with hypertension has been established, and the association between USP38 and blood pressure regulation still needs further validation (Evangelou et al., 2018). Our research has certain limitations: no follow-up functional trial validation was done. The sample only included European populations, and therefore it was not possible to extend the results of the trial to the whole human population. Our study is innovative in that TWAS explores associations with traits at the genetic level, allowing more precise targeting of genes than previous SNP studies, however, no TWAS studies have been published on essential hypertension and this study adds to that. We look forward tousing large samples of different ethnic groups, multiple TWAS methods, and in-depth functional tests, to validate key genes in essential hypertension in future studies.
Data availability statement
The original contributions presented in the study are included in the article/Supplementary Material, further inquiries can be directed to the corresponding authors.
Author contributions
SH, JW, and NL contributed equally and share first authorship. Study concept and design: SH, JW, and NL Collection, analysis, interpretation of data and manuscript drafting: SH, PL, and SW Critical revision of the manuscript: JW, NL, LX, and LQ. All authors read and approved the final manuscript.
Funding
This work is supported by the National Natural Science Foundation-Study on the mechanism of preventing and treating salt-sensitive hypertensive vasculopathy through adjusting intestinal micro-ecology with low salt and activating blood circulation method based on the theory of “salt restrict blood” from Neijing. (No. 8197152161).
Acknowledgments
We want to acknowledge the participants and investigators of the FinnGen study and GWASATLAS study. And thanks to all those who participated in this study.
Conflict of interest
The authors declare that the research was conducted in the absence of any commercial or financial relationships that could be construed as a potential conflict of interest.
Publisher’s note
All claims expressed in this article are solely those of the authors and do not necessarily represent those of their affiliated organizations, or those of the publisher, the editors and the reviewers. Any product that may be evaluated in this article, or claim that may be made by its manufacturer, is not guaranteed or endorsed by the publisher.
Supplementary material
The Supplementary Material for this article can be found online at: https://www.frontiersin.org/articles/10.3389/fgene.2023.1114174/full#supplementary-material
SUPPLEMENTARY TABLE S1 | FUMA identified 173 genomic risk loci associated with essential hypertension.
SUPPLEMENTARY TABLE S2 | FUMA identified 248 lead SNPs.
SUPPLEMENTARY TABLE S3 | FUMA identified 662 independent significant SNPs.
SUPPLEMENTARY TABLE S4 | FUMA annotation of candidate SNPs.
SUPPLEMENTARY TABLE S5 | MAGMA gene-based test identified 346 significant genes.
SUPPLEMENTARY TABLE S6 | The top 10 gene-set of MAGMA gene-set analysis.
SUPPLEMENTARY TABLE S7 | UTMOST single-tissue analysis.
SUPPLEMENTARY TABLE S8 | FUSION identified 461 significant genes associated with essential hypertension.
Abbreviations
GWAS, Genome-wide association study; TWAS, Transcriptome-wide association studies; eQTL, Expression quantitative trait loci; GTEx, Genotype-Tissues Expression Project; CVD, Cardiovascular diseases; FUMA, Functional Mapping and Annotation; UTMOST, Unified Test for Molecular SignaTures; GBJ, Generalized Berk-Jones; FUSION, Functional Summary-based Imputation; SMR, Summary data-based Mendelian Randomization.
References
Antigny, F., Hautefort, A., Meloche, J., Belacel-Ouari, M., Manoury, B., Rucker-Martin, C., et al. (2016). Potassium Channel subfamily K member 3 (KCNK3) contributes to the development of pulmonary arterial hypertension. Circulation 133 (14), 1371–1385. doi:10.1161/CIRCULATIONAHA.115.020951
Baranova, A., Cao, H., and Zhang, F. (2021). Unraveling risk genes of COVID-19 by multi-omics integrative analyses. Front. Med. (Lausanne) 8, 738687. doi:10.3389/fmed.2021.738687
Chen, Y., Zeng, X., Huang, X., Serag, S., Woolf, C. J., and Spiegelman, B. M. (2017). Crosstalk between KCNK3-mediated ion current and adrenergic signaling regulates adipose thermogenesis and obesity. Cell 171 (4), 836–848. doi:10.1016/j.cell.2017.09.015
Consortium, G. T. (2020). The GTEx Consortium atlas of genetic regulatory effects across human tissues. Science 369 (6509), 1318–1330. doi:10.1126/science.aaz1776
Dall'Aglio, L., Lewis, C. M., and Pain, O. (2021). Delineating the genetic component of gene expression in major depression. Biol. Psychiatry 89 (6), 627–636. doi:10.1016/j.biopsych.2020.09.010
de Leeuw, C. A., Mooij, J. M., Heskes, T., and Posthuma, D. (2015). Magma: Generalized gene-set analysis of GWAS data. PLoS Comput. Biol. 11 (4), e1004219. doi:10.1371/journal.pcbi.1004219
Evangelou, E., Warren, H. R., Mosen-Ansorena, D., Mifsud, B., Pazoki, R., Gao, H., et al. (2018). Genetic analysis of over 1 million people identifies 535 new loci associated with blood pressure traits. Nat. Genet. 50 (10), 1412–1425. doi:10.1038/s41588-018-0205-x
Fagerberg, L., Hallstrom, B. M., Oksvold, P., Kampf, C., Djureinovic, D., Odeberg, J., et al. (2014). Analysis of the human tissue-specific expression by genome-wide integration of transcriptomics and antibody-based proteomics. Mol. Cell Proteomics 13 (2), 397–406. doi:10.1074/mcp.M113.035600
Forouzanfar, M. H., Liu, P., Roth, G. A., Ng, M., Biryukov, S., Marczak, L., et al. (2017). Global burden of hypertension and systolic blood pressure of at least 110 to 115 mm Hg, 1990-2015. JAMA 317 (2), 165–182. doi:10.1001/jama.2016.19043
Genomes Project, C., Auton, A., Brooks, L. D., Durbin, R. M., Garrison, E. P., Kang, H. M., et al. (2015). A global reference for human genetic variation. Nature 526 (7571), 68–74. doi:10.1038/nature15393
Giambartolomei, C., Vukcevic, D., Schadt, E. E., Franke, L., Hingorani, A. D., Wallace, C., et al. (2014). Bayesian test for colocalisation between pairs of genetic association studies using summary statistics. PLoS Genet. 10 (5), e1004383. doi:10.1371/journal.pgen.1004383
Giri, A., Hellwege, J. N., Keaton, J. M., Park, J., Qiu, C., Warren, H. R., et al. (2019). Trans-ethnic association study of blood pressure determinants in over 750,000 individuals. Nat. Genet. 51 (1), 51–62. doi:10.1038/s41588-018-0303-9
Gusev, A., Ko, A., Shi, H., Bhatia, G., Chung, W., Penninx, B. W., et al. (2016). Integrative approaches for large-scale transcriptome-wide association studies. Nat. Genet. 48 (3), 245–252. doi:10.1038/ng.3506
Gusev, A., Lawrenson, K., Lin, X., Lyra, P. C., Kar, S., Vavra, K. C., et al. (2019). A transcriptome-wide association study of high-grade serous epithelial ovarian cancer identifies new susceptibility genes and splice variants. Nat. Genet. 51 (5), 815–823. doi:10.1038/s41588-019-0395-x
Hirota, T., Takahashi, A., Kubo, M., Tsunoda, T., Tomita, K., Doi, S., et al. (2011). Genome-wide association study identifies three new susceptibility loci for adult asthma in the Japanese population. Nat. Genet. 43 (9), 893–896. doi:10.1038/ng.887
Hirschhorn, J. N., and Daly, M. J. (2005). Genome-wide association studies for common diseases and complex traits. Nat. Rev. Genet. 6 (2), 95–108. doi:10.1038/nrg1521
Hu, Y., Li, M., Lu, Q., Weng, H., Wang, J., Zekavat, S. M., et al. (2019). A statistical framework for cross-tissue transcriptome-wide association analysis. Nat. Genet. 51 (3), 568–576. doi:10.1038/s41588-019-0345-7
Jones, A., Charakida, M., Falaschetti, E., Hingorani, A. D., Finer, N., Masi, S., et al. (2012). Adipose and height growth through childhood and blood pressure status in a large prospective cohort study. Hypertension 59 (5), 919–925. doi:10.1161/HYPERTENSIONAHA.111.187716
Kato, N., Loh, M., Takeuchi, F., Verweij, N., Wang, X., Zhang, W., et al. (2015). Trans-ancestry genome-wide association study identifies 12 genetic loci influencing blood pressure and implicates a role for DNA methylation. Nat. Genet. 47 (11), 1282–1293. doi:10.1038/ng.3405
Kucmierz, J., Frak, W., Mlynarska, E., Franczyk, B., and Rysz, J. (2021). Molecular interactions of arterial hypertension in its target organs. Int. J. Mol. Sci. 22 (18), 9669. doi:10.3390/ijms22189669
Levy, D., Ehret, G. B., Rice, K., Verwoert, G. C., Launer, L. J., Dehghan, A., et al. (2009). Genome-wide association study of blood pressure and hypertension. Nat. Genet. 41 (6), 677–687. doi:10.1038/ng.384
Li, X., Wang, H., Zhu, Y., Cao, W., Song, M., Wang, Y., et al. (2021). Heritability enrichment of immunoglobulin G N-glycosylation in specific tissues. Front. Immunol. 12, 741705. doi:10.3389/fimmu.2021.741705
Liao, C., Laporte, A. D., Spiegelman, D., Akcimen, F., Joober, R., Dion, P. A., et al. (2019). Transcriptome-wide association study of attention deficit hyperactivity disorder identifies associated genes and phenotypes. Nat. Commun. 10 (1), 4450. doi:10.1038/s41467-019-12450-9
Llorens-Cortes, C., and Touyz, R. M. (2020). Evolution of a new class of antihypertensive drugs: Targeting the brain renin-angiotensin system. Hypertension 75 (1), 6–15. doi:10.1161/HYPERTENSIONAHA.119.12675
Luft, F. C. (2001). Twins in cardiovascular genetic research. Hypertension 37 (2), 350–356. doi:10.1161/01.hyp.37.2.350
Ma, L., Roman-Campos, D., Austin, E. D., Eyries, M., Sampson, K. S., Soubrier, F., et al. (2013). A novel channelopathy in pulmonary arterial hypertension. N. Engl. J. Med. 369 (4), 351–361. doi:10.1056/NEJMoa1211097
Manichaikul, A., Rich, S. S., Allison, M. A., Guagliardo, N. A., Bayliss, D. A., Carey, R. M., et al. (2016). KCNK3 variants are associated with hyperaldosteronism and hypertension. Hypertension 68 (2), 356–364. doi:10.1161/HYPERTENSIONAHA.116.07564
Manosroi, W., and Williams, G. H. (2019). Genetics of human primary hypertension: Focus on hormonal mechanisms. Endocr. Rev. 40 (3), 825–856. doi:10.1210/er.2018-00071
Maurano, M. T., Humbert, R., Rynes, E., Thurman, R. E., Haugen, E., Wang, H., et al. (2012). Systematic localization of common disease-associated variation in regulatory DNA. Science 337 (6099), 1190–1195. doi:10.1126/science.1222794
Mitsui, T., Nomura, S., Okada, M., Ohno, Y., Kobayashi, H., Nakashima, Y., et al. (2003). Hypertension and angiotensin II hypersensitivity in aminopeptidase A-deficient mice. Mol. Med. 9 (1-2), 57–62. doi:10.1007/bf03402108
NCD Risk Factor Collaboration (2021). World wide trends in hypertension prevalence and progress in treatment and control from 1990 to 2019: A pooled analysis of 1201 population-representative studies with 104 million participants. Lancet 398 (10304), 957–980. doi:10.1016/S0140-6736(21)01330-1
Niiranen, T. J., McCabe, E. L., Larson, M. G., Henglin, M., Lakdawala, N. K., Vasan, R. S., et al. (2017). Risk for hypertension crosses generations in the community: A multi-generational cohort study. Eur. Heart J. 38 (29), 2300–2308. doi:10.1093/eurheartj/ehx134
Nishimura, T., Saeki, M., Motoi, Y., Kitamura, N., Mori, A., Kaminuma, O., et al. (2014). Selective suppression of Th2 cell-mediated lung eosinophilic inflammation by anti-major facilitator super family domain containing 10 monoclonal antibody. Allergol. Int. 63 (1), 29–35. doi:10.2332/allergolint.13-OA-0635
O'Connor, A. T., Haspula, D., Alanazi, A. Z., and Clark, M. A. (2022). Roles of Angiotensin III in the brain and periphery. Peptides 153, 170802. doi:10.1016/j.peptides.2022.170802
Olczak, K. J., Taylor-Bateman, V., Nicholls, H. L., Traylor, M., Cabrera, C. P., and Munroe, P. B. (2021). Hypertension genetics past, present and future applications. J. Intern Med. 290 (6), 1130–1152. doi:10.1111/joim.13352
Olschewski, A., Veale, E. L., Nagy, B. M., Nagaraj, C., Kwapiszewska, G., Antigny, F., et al. (2017). TASK-1 (KCNK3) channels in the lung: From cell biology to clinical implications. Eur. Respir. J. 50 (5), 1700754. doi:10.1183/13993003.00754-2017
Padmanabhan, S., and Dominiczak, A. F. (2021). Genomics of hypertension: The road to precision medicine. Nat. Rev. Cardiol. 18 (4), 235–250. doi:10.1038/s41569-020-00466-4
Padmanabhan, S., and Joe, B. (2017). Towards precision medicine for hypertension: A review of genomic, epigenomic, and microbiomic effects on blood pressure in experimental rat models and humans. Physiol. Rev. 97 (4), 1469–1528. doi:10.1152/physrev.00035.2016
Page, M. J., McKenzie, J. E., Bossuyt, P. M., Boutron, I., Hoffmann, T. C., Mulrow, C. D., et al. (2021). The PRISMA 2020 statement: An updated guideline for reporting systematic reviews. BMJ Clin. Res. ed) 372, n71. doi:10.1136/bmj.n71
Pairo-Castineira, E., Clohisey, S., Klaric, L., Bretherick, A. D., Rawlik, K., Pasko, D., et al. (2021). Genetic mechanisms of critical illness in COVID-19. Nature 591 (7848), 92–98. doi:10.1038/s41586-020-03065-y
Restuadi, R., Steyn, F. J., Kabashi, E., Ngo, S. T., Cheng, F. F., Nabais, M. F., et al. (2022). Functional characterisation of the amyotrophic lateral sclerosis risk locus GPX3/TNIP1. Genome Med. 14 (1), 7. doi:10.1186/s13073-021-01006-6
Rodriguez-Iturbe, B., Pons, H., and Johnson, R. J. (2017). Role of the immune system in hypertension. Physiol. Rev. 97 (3), 1127–1164. doi:10.1152/physrev.00031.2016
Russo, A., Di Gaetano, C., Cugliari, G., and Matullo, G. (2018). Advances in the genetics of hypertension: The effect of rare variants. Int. J. Mol. Sci. 19 (3), 688. doi:10.3390/ijms19030688
Southgate, L., Machado, R. D., Graf, S., and Morrell, N. W. (2020). Molecular genetic framework underlying pulmonary arterial hypertension. Nat. Rev. Cardiol. 17 (2), 85–95. doi:10.1038/s41569-019-0242-x
Surendran, P., Drenos, F., Young, R., Warren, H., Cook, J. P., Manning, A. K., et al. (2016). Trans-ancestry meta-analyses identify rare and common variants associated with blood pressure and hypertension. Nat. Genet. 48 (10), 1151–1161. doi:10.1038/ng.3654
Te Riet, L., van Esch, J. H., Roks, A. J., van den Meiracker, A. H., and Danser, A. H. (2015). Hypertension: Renin-angiotensin-aldosterone system alterations. Circ. Res. 116 (6), 960–975. doi:10.1161/CIRCRESAHA.116.303587
Wang, B., Cai, W., Ai, D., Zhang, X., and Yao, L. (2020). The role of deubiquitinases in vascular diseases. J. Cardiovasc Transl. Res. 13 (2), 131–141. doi:10.1007/s12265-019-09909-x
Watanabe, K., Taskesen, E., van Bochoven, A., and Posthuma, D. (2017). Functional mapping and annotation of genetic associations with FUMA. Nat. Commun. 8 (1), 1826. doi:10.1038/s41467-017-01261-5
Wellcome Trust Case Control, C. (2007). Genome-wide association study of 14,000 cases of seven common diseases and 3,000 shared controls. Nature 447 (7145), 661–678. doi:10.1038/nature05911
Willer, C. J., Li, Y., and Abecasis, G. R. (2010). Metal: Fast and efficient meta-analysis of genomewide association scans. Bioinformatics 26 (17), 2190–2191. doi:10.1093/bioinformatics/btq340
Yi, X. M., Li, M., Chen, Y. D., Shu, H. B., and Li, S. (2022). Reciprocal regulation of IL-33 receptor-mediated inflammatory response and pulmonary fibrosis by TRAF6 and USP38. Proc. Natl. Acad. Sci. U. S. A. 119 (10), e2116279119. doi:10.1073/pnas.2116279119
Zhan, W., Liao, X., Liu, J., Tian, T., Yu, L., and Li, R. (2020). USP38 regulates the stemness and chemoresistance of human colorectal cancer via regulation of HDAC3. Oncogenesis 9 (5), 48. doi:10.1038/s41389-020-0234-z
Zhao, Z., Su, Z., Liang, P., Liu, D., Yang, S., Wu, Y., et al. (2020). USP38 couples histone ubiquitination and methylation via KDM5B to resolve inflammation. Adv. Sci. (Weinh). 7 (22), 2002680. doi:10.1002/advs.202002680
Zhou, B., Perel, P., Mensah, G. A., and Ezzati, M. (2021). Global epidemiology, health burden and effective interventions for elevated blood pressure and hypertension. Nat. Rev. Cardiol. 18 (11), 785–802. doi:10.1038/s41569-021-00559-8
Zhou, R., Tomkovicz, V. R., Butler, P. L., Ochoa, L. A., Peterson, Z. J., and Snyder, P. M. (2013). Ubiquitin-specific peptidase 8 (USP8) regulates endosomal trafficking of the epithelial Na+ channel. J. Biol. Chem. 288 (8), 5389–5397. doi:10.1074/jbc.M112.425272
Keywords: hypertension, post-gwas, TWAS, SMR, UTMOST
Citation: Huang S, Wang J, Liu N, Li P, Wu S, Qi L and Xia L (2023) A cross-tissue transcriptome association study identifies key genes in essential hypertension. Front. Genet. 14:1114174. doi: 10.3389/fgene.2023.1114174
Received: 02 December 2022; Accepted: 30 January 2023;
Published: 10 February 2023.
Edited by:
Guoxian Yu, Shandong University, ChinaReviewed by:
Zhongshan Cheng, St. Jude Children’s Research Hospital, United StatesZimo Huang, Shandong University, China
Copyright © 2023 Huang, Wang, Liu, Li, Wu, Qi and Xia. This is an open-access article distributed under the terms of the Creative Commons Attribution License (CC BY). The use, distribution or reproduction in other forums is permitted, provided the original author(s) and the copyright owner(s) are credited and that the original publication in this journal is cited, in accordance with accepted academic practice. No use, distribution or reproduction is permitted which does not comply with these terms.
*Correspondence: Luming Qi, bG1xaV90Y21AMTI2LmNvbQ==; Lina Xia, eGlhbGluYUBjZHV0Y20uZWR1LmNu
†These authors have contributed equally to this work