 Nan Li1,2,3†
 Mengyi Hu4†
 Jingyi Xie1Linjia Wei4
 Tianzhen Wu1Wei Zhang1,2,3Shuangxi Gu1,2,3
 Longwei Li1,2,3,4*
- 1School of Geographic Information and Tourism, Chuzhou University, Chuzhou, China
- 2Anhui Province Key Laboratory of Physical Geographic Environment, Chuzhou University, Chuzhou, China
- 3Anhui Engineering Research Center of Remote Sensing and Geoinformatics, Chuzhou University, Chuzhou, China
- 4School of Resources and Environmental Engineering, Anhui University, Hefei, China
Accurate estimation of aboveground biomass (AGB) in Moso bamboo forests (MBFs) has garnered significant attention over the past two decades. However, the remote sensing-based estimation of AGB in MBFs remains challenging because of the limited understanding of the relationship between Moso bamboo growth characteristics and remote sensing data, particularly concerning alternating on-year and off-year cycles. In this study, Sentinel-2 remote sensing imagery and plot survey data were selected, a novel change detection algorithm to assess plot level AGB dynamics between 2018 and 2019 was developed, a hierarchical classifier was proposed to map the spatial distributions of on-year and off-year MBFs, and a time series model was developed for estimating the AGB of MBFs to characterize AGB dynamics between November and December. The results indicated that the AGB of the MBFs exhibited a distinct dynamic cycle characterized by the rapid accumulation of new bamboo and sharp reductions due to selective harvesting during the on-year period, alongside a steady accumulation of lignified bamboo during the off-year period. The AGB of the MBFs during the on-year and off-year cycles ranged primarily from 30 to 80 Mg/ha, with the AGB of the on-year MBFs generally exceeding that of the off-year MBFs. This study demonstrated the potential to accurately estimate AGB and its dynamic changes by accounting for on-year and off-year phenomena.
1 Introduction
Moso bamboo (Phyllostachys edulis) is the most widely distributed and economically significant bamboo species in China, covering approximately 5,277,600 ha and constituting approximately 70% of the country’s bamboo forest area. These Moso bamboo forests (MBFs) are located primarily in the provinces of Zhejiang, Fujian, Jiangxi, and Hunan (National Forestry and Grassland Administration, 2023). The rapid growth of MBFs endows them with substantial carbon storage and sequestration potential. Meanwhile, Moso bamboo forests are uneven-aged forests. Almost all Moso bamboo forests are selectively logged once every two years. At the same time, humans carry out several management measures for Moso bamboo forests, such as hill splitting and fertilization. Compared with other forests, Moso bamboo forests have more interactions with humans. These human activities also indirectly increase the carbon storage and carbon sequestration potential of Moso bamboo forests. Zhou (2006) indicated that their annual carbon sequestration rate reaches 5.1 Mg/ha, which is 1.46 times greater than that of Chinese fir during the fast-growing stage. The carbon stock in China’s MBFs is estimated at approximately 611.15 ± 142.31 Tg, with Moso bamboo forests capable of sequestering 10.19 ± 2.54 Tg of carbon annually (Li et al., 2015). Consequently, the contribution of Moso bamboo to the global carbon sink has garnered extensive attention from the scientific community (Chen et al., 2008; Song et al., 2011; Nath et al., 2015; Li et al., 2019). This significant carbon sequestration capability positions Moso bamboo as a crucial strategic resource in China’s forestry industry for combating climate change. Within the framework of the national dual-carbon strategy and the global “bamboo instead of plastic” initiative, the carbon sink value of MBFs is anticipated to remain a major focus of research. Accurate estimation of the aboveground biomass (AGB) of MBFs is of considerable scientific and practical importance for evaluating the potential of this bamboo species as a carbon sink and for enabling precise carbon trading (Li, 2020). Understanding AGB is central to assessing carbon cycle processes within MBF ecosystems.
Large-scale AGB estimation for forests is primarily based on remote sensing imagery and sample plot data for model construction (Lu et al., 2014; Jurjeviæ et al., 2020). Over time, the remote sensing data utilized for AGB modeling in MBFs have evolved from single-source to multisource data (such as optical, radar, and LiDAR data). Many studies have estimated AGB using Landsat imagery (Xu et al., 2011; Ahmad et al., 2021). Meanwhile, radar data are also used for AGB estimation, but its estimation accuracy is not better than Landsat (Zhao et al., 2016a). LiDAR data were used for AGB estimation, however, its expensive data acquisition costs limited its widely use (Cao et al., 2019; Navarro et al., 2020). The combination of multi-source data improved the accuracy of AGB estimation (Zhao et al., 2016a; Gao et al., 2018; Marchesan et al., 2023). Variables and algorithm selection are two key steps for AGB modeling (Lu et al., 2014). Spectral bands, vegetation indices, and textures are often used as variables for modeling (Xu et al., 2011; Chen et al., 2019). Concurrently, algorithms have transitioned from traditional multiple-regression models to more sophisticated machine learning approaches (Zhao et al., 2016b; Gao et al., 2018; Chen et al., 2019; Talebiesfandarani and Shamsoddini, 2022; Marchesan et al., 2023; Zhang et al., 2024). However, the current validation results for remote sensing-based AGB estimation in MBFs demonstrate relatively low accuracy, which is attributable to factors such as temporal inconsistencies, optical saturation, and the distinct phenological characteristics of MBFs (Li et al., 2018; Zhao et al., 2016b; Gao et al., 2018; Xu et al., 2011; Yu et al., 2012; Han et al., 2013).
One of the significant challenges in enhancing the accuracy of remote sensing-based AGB estimation in MBFs is the frequent cloud cover in subtropical regions; this cloud cover limits the availability of passive remote sensing data and leads to mismatch issues in the timing of sample plot surveys and passive remote sensing data acquisition (Lu et al., 2014; Zhao et al., 2016b). In most studies, it has been assumed that temporal discrepancies between two data acquisition times do not significantly impact the relationship between AGB and remotely sensed variables (Lu et al., 2014). While this hypothesis may be valid for forests with minimal stand structure changes over short periods, it does not apply to MBFs, which exhibit distinct on-year and off-year phenomena.
The on-year and off-year phenomenon in MBFs results in significant differences in AGB, with on-year MBFs producing many bamboo shoots, whereas off-year MBFs produce few or none (Li et al., 2019; Fang et al., 2015). These phenological cycles encompass distinct periods of bamboo shoot emergence, young bamboo growth, and leaf phenology, leading to biomass accumulation at varying rates (Fang et al., 2015). Furthermore, the spectral characteristics of on-year and off-year MBFs are similar during certain periods, despite substantial differences in biomass (Chen et al., 2019). Consequently, the impact of these phases on model accuracy must be thoroughly considered. Current AGB estimates, which are primarily derived from static models based on sample plot data and remote sensing variables, have not effectively captured the unique physiological and ecological characteristics of MBFs, particularly during their growth periods (Zhou, 2006; Guo et al., 2015; Zeng et al., 2016; Zhang, 2016).
To address these challenges, (1) a novel change detection algorithm to assess plot level AGB dynamics between 2018 and 2019 is developed; (2) the yearly change bamboo index is combined with a hierarchical classifier to map the spatial distributions of on-year and off-year MBFs; and (3) the mapped on-year and off-year MBFs are integrated with a pre-estimated spatial map of AGB to characterize AGB dynamics. The new contribution of this research is to better understand the AGB dynamics in bamboo growth stage, and the impacts of the on-year and off-year phenomena on AGB estimation.
2 Materials and methods
2.1 Study area
The study area (a rectangle with 54,000 ha) is located in the northwestern region of Zhejiang Province, spanning Anji County, Deqing County and Yuhang District (Figure 1A). This area exhibits significant variations in geomorphologic relief, with elevations ranging from 12 to 866 m above sea level. It is characterized by a northern subtropical monsoon climate with an average annual temperature between 15 and 18°C and average annual precipitation totaling 1,100 to 1,900 mm (Li, 2020). The predominant vegetation types include Moso bamboo forests (Figures 1B, C), coniferous forests (such as Pinus massoniana and Cunninghamia lanceolata) and evergreen broadleaf forests. In May, the growth processes of on-year and off-year MBFs are different (Figure 1E), resulting in distinct colors in the remote sensing images (Figure 1D).
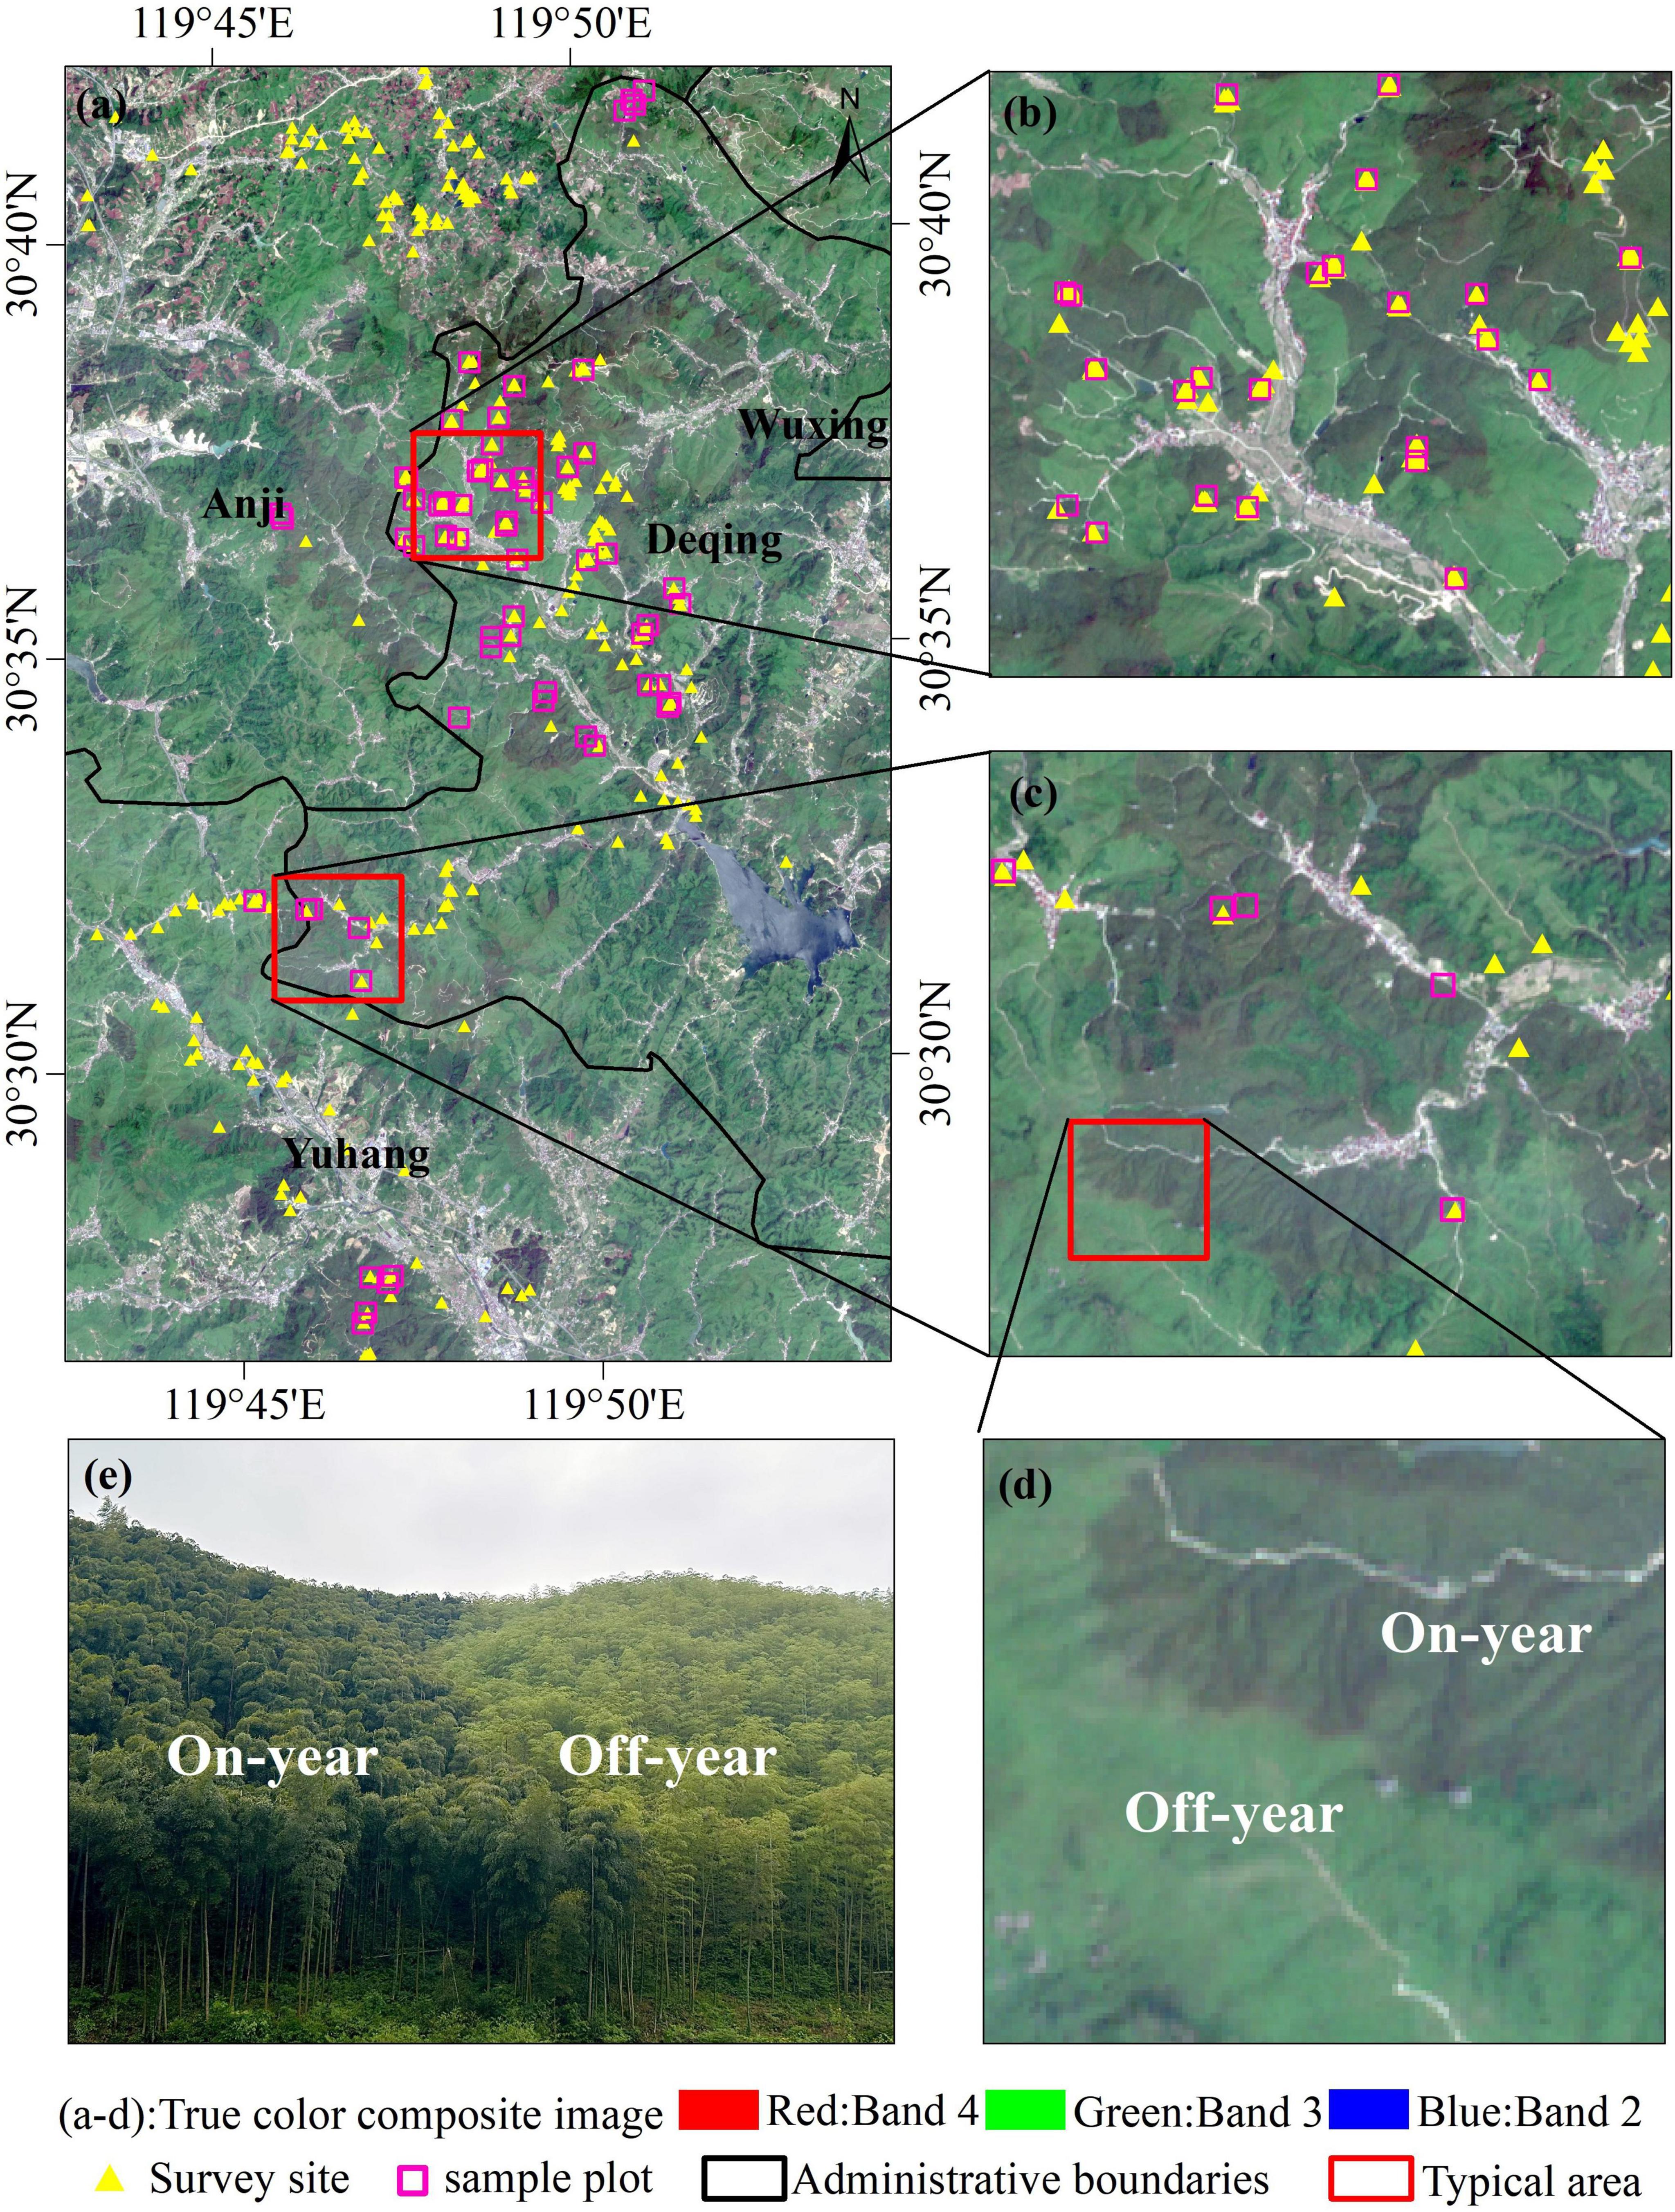
Figure 1. Overview of the study area: (A) True color composites using red, green and blue spectral bands of Sentinel-2 imagery captured on 4 May 2018; (B,C) Typical area; (D) On-year and off-year Moso bamboo forests as depicted in Sentinel-2 imagery; (E) A photograph illustrating on-year and off-year Moso bamboo forests.
2.2 Data preparation
2.2.1 Remote sensing data and preprocessing
The L1C products of Sentinel-2 (orbit number: T50RQU) for 2018 and 2019, obtained from the ESA website.1 Four scenes of Sentinel-2 multispectral images (Cloud coverage lower than 5%), with acquisition dates (4 May 2018, 10 November 2018, 17 December 2018, 14 May 2019) were selected for Moso bamboo mapping and AGB estimation. These images are based on a Universal Transverse Mercator coordinate system, specifically, Zone 50 North. The images span 13 spectral bands that encompass the visible/near-infrared and shortwave infrared spectral ranges, including three vegetation red-edge bands, which are particularly effective for monitoring vegetation (Li et al., 2019). The Sen2cor plug-in released by the ESA was employed for radiometric calibration and atmospheric correction, transforming the L1C-level data into bottom of atmosphere reflectance data at the L2A level. Additionally, 20 m-spatial-resolution Sentinel-2 imagery was used, and the improved C-correction model (Reese and Olsson, 2011) along with digital elevation model (DEM) data were applied for topographic correction.
The ancillary data used in this study included topographic data and administrative boundary vectors. The topographic data were DEM, derived slope and aspect directional data. The 20 m-spatial-resolution DEM data were obtained from the Geospatial Data Cloud,2 and the coordinate projection system employed was UTM Zone 50. The administrative boundary vector data included provincial-, city- and county-level vector data for all of Zhejiang Province. Initially, the DEM data were spatially aligned with the remote sensing data, ensuring accuracy within one image element, followed by terrain correction.
2.2.2 Field data
A total of 63 sample plots were surveyed twice, in May 2018 and February 2019, and their spatial distributions are illustrated in Figure 1A. Each plot measured 20 × 20 m (Figure 2B) to align with the spatial resolution of the remote sensing imagery (Figure 2A). A compass was employed to determine the direction, and four control points were established, with PVC pipes buried at these locations for precise reference. For plots with sloping sides, the side lengths were adjusted according to the slope angle. Within each plot, the diameter at breast height (DBH) of the Moso bamboo samples greater than 5 cm was measured, and their age (degree) was recorded (Figure 2C). For detailed information, please refer to the Supplementary material. The first-year Moso bamboo is designated as 1st-degree bamboo. The second and third-year Moso bamboo is categorized as 2nd-degree bamboo, and the fourth and fifth-year Moso bamboo is termed as 3rd-degree bamboo. This classification system provides a structured way to distinguish Moso bamboo based on its age, which is crucial for various studies and management practices related to Moso bamboo forests.
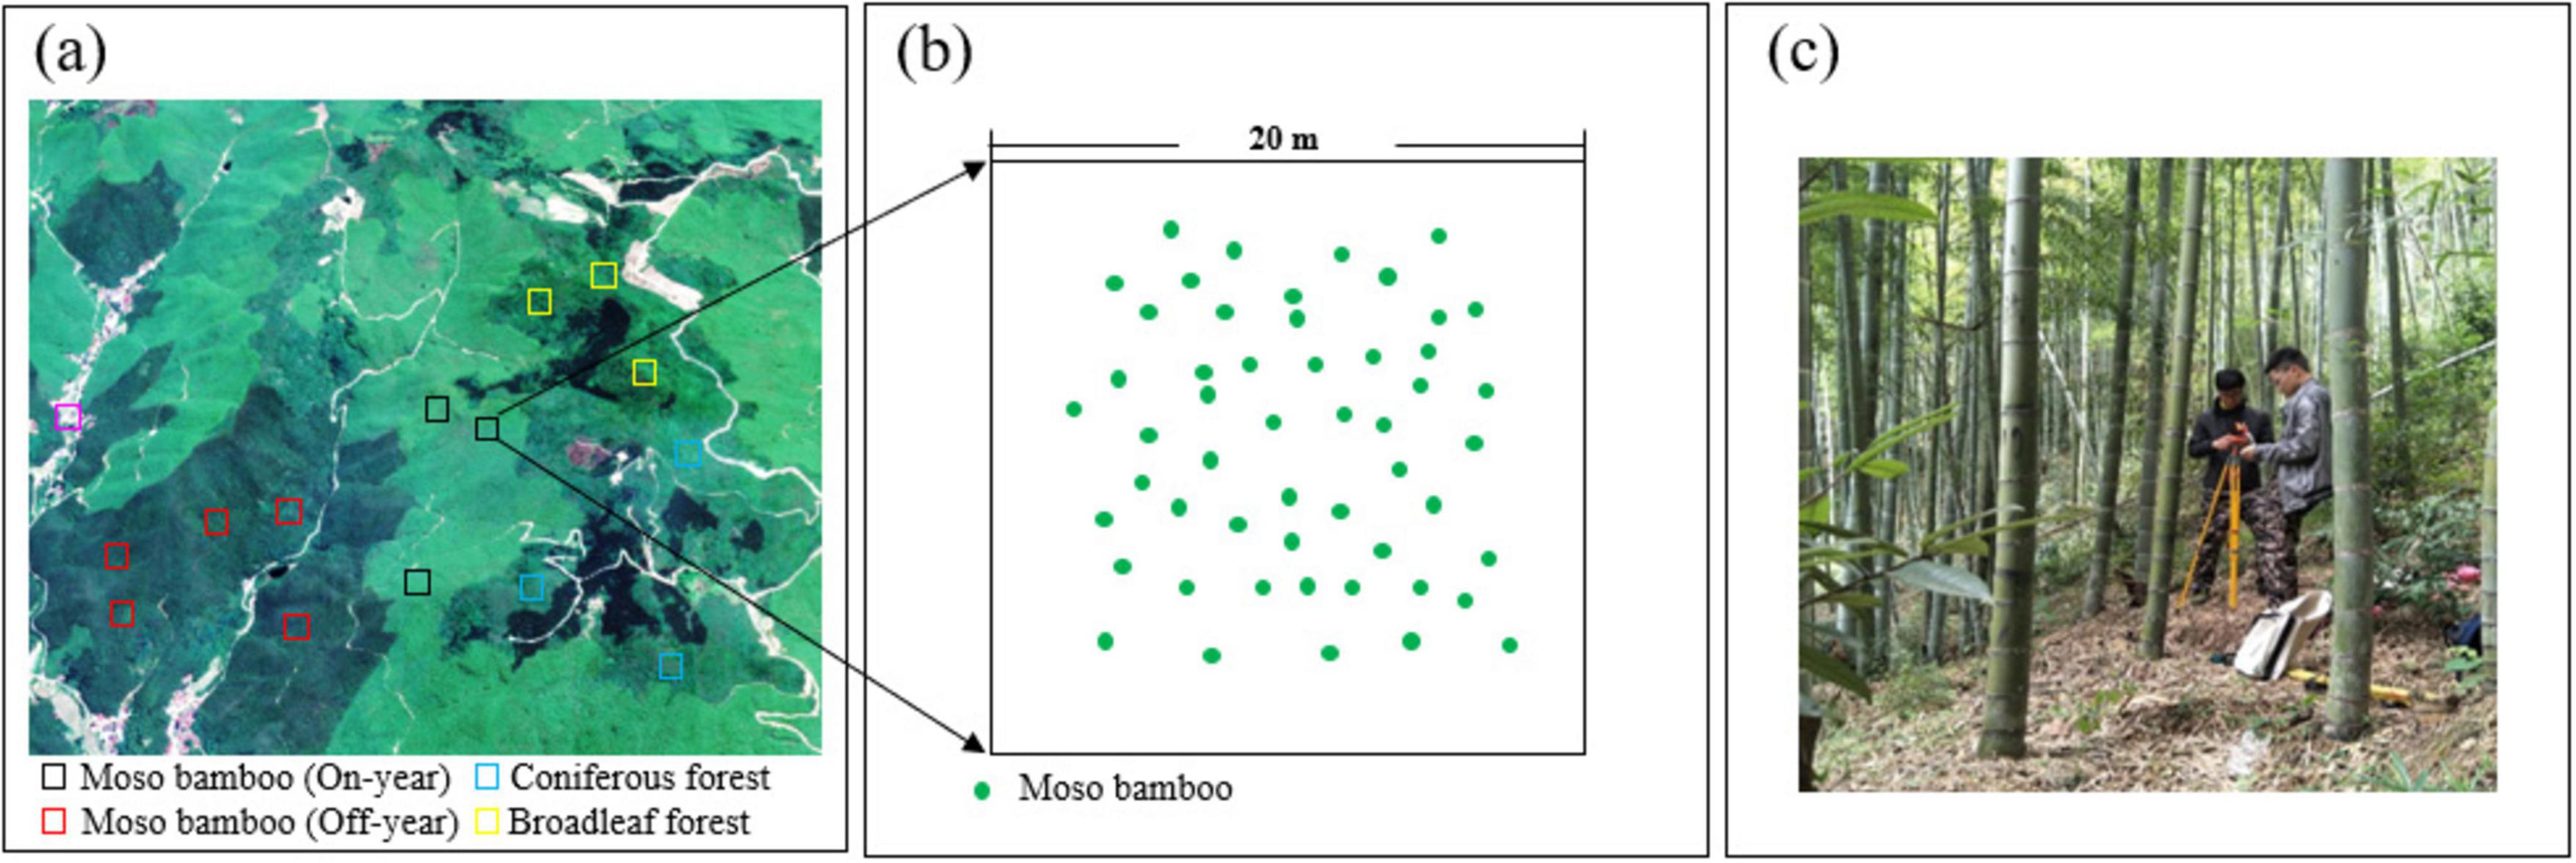
Figure 2. Schematic layout of the sample plots. (A) On-year MBFs, off-year MBFs, broadleaf forests and coniferous forests, depicted in Sentinel-2 imagery; (B) sample plots presented at a 20 × 20 m scale; (C) photograph of data collection within a sample plot.
The statistical information regarding the sample plots is presented in Table 1. A total of 31 sample plots of on-year MBFs and 32 sample plots of off-year MBFs were analyzed. The DBH of Moso bamboo ranged from 8.5 to 11.8 cm, whereas the tree height varied from 8 to 12.1 m. Notably, the average DBH and average tree height for both on-year and off-year MBFs were largely comparable.
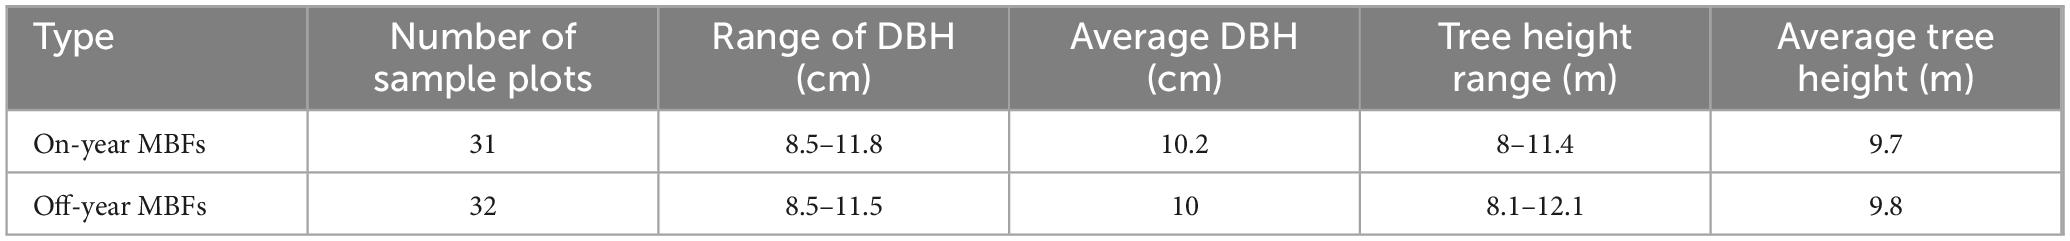
Table 1. Statistical information for the sample plots.
2.3 Methods
The framework for estimating AGB dynamics is illustrated in Figure 3 and involves four key steps: (1) calculating the AGB of each individual Moso bamboo plant and detecting AGB changes in MBFs at the plot level between 2018 and 2019; (2) mapping the spatial distributions of on-year and off-year MBFs via a hierarchical classifier; (3) estimating the AGB of MBFs in May by integrating Sentinel-2 data with sample plot information; and (4) characterizing AGB dynamics in November and December and evaluating the modeling results.
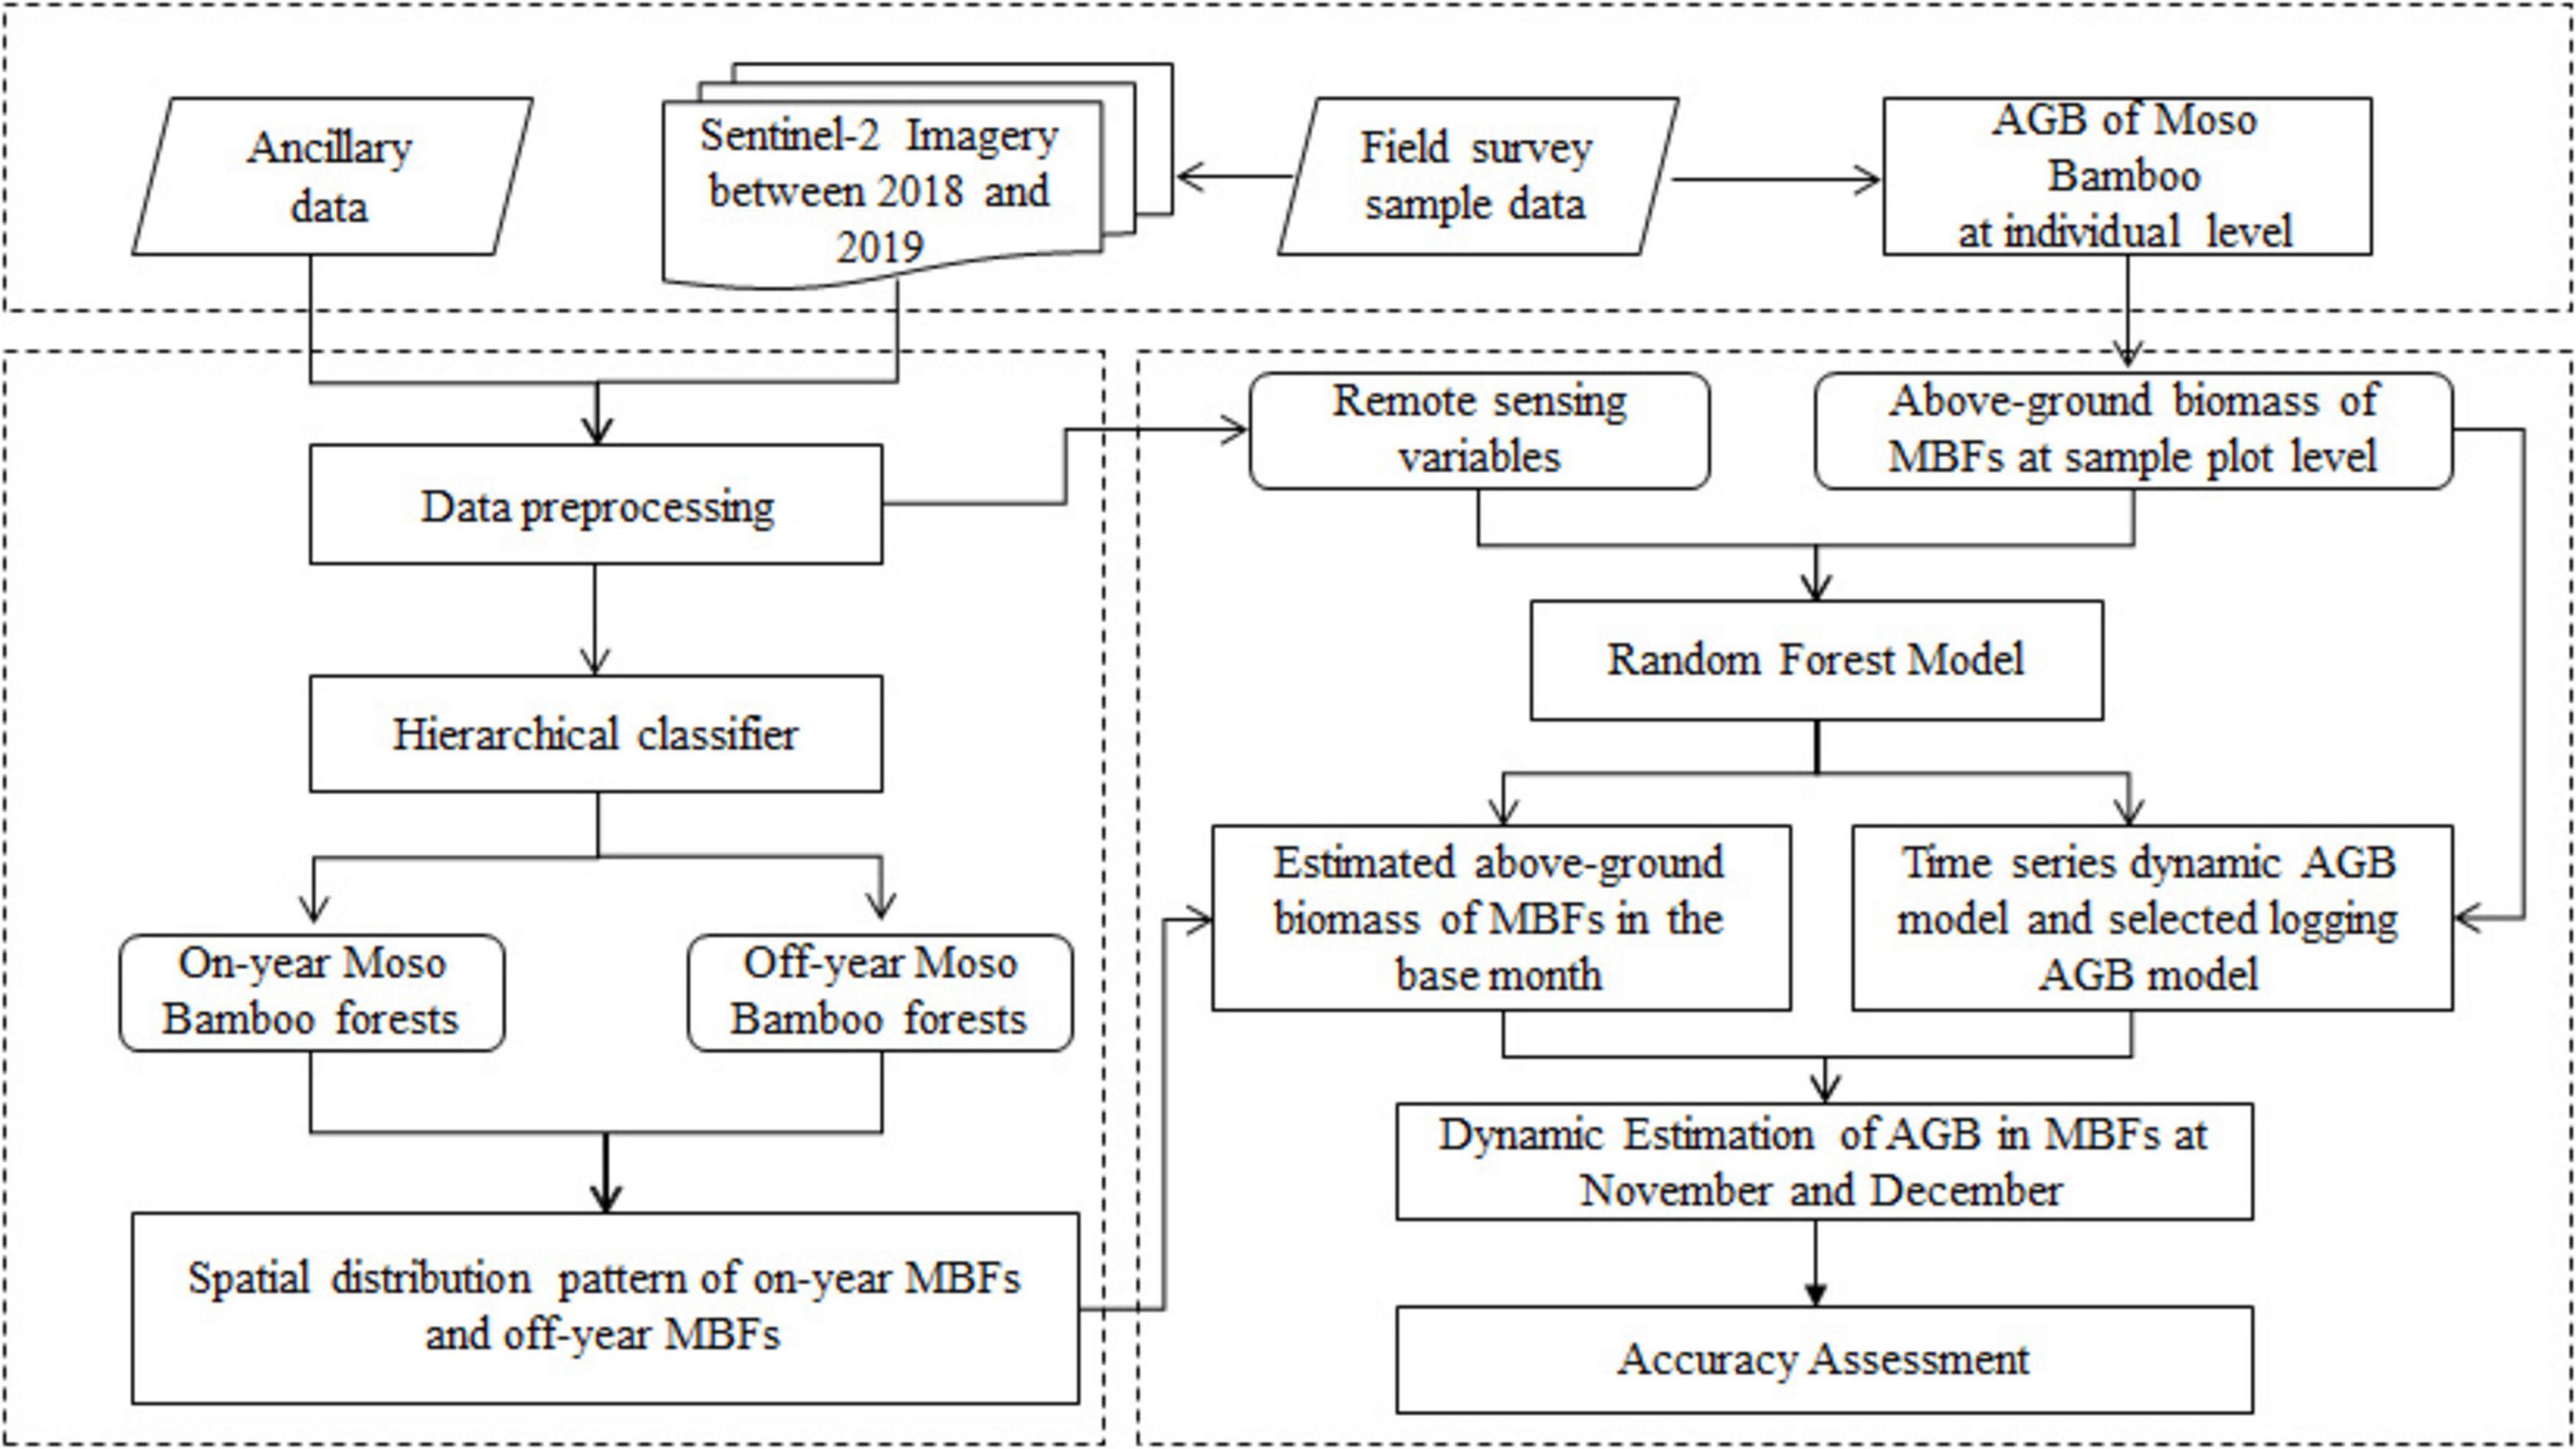
Figure 3. Framework for mapping the aboveground biomass dynamics of Moso bamboo forests.
2.3.1 Calculation of AGB in the MBF sample plots
Moso bamboo rapidly grows following shoot emergence, reaching a growth rate of nearly 1 meter per day at its peak. During this initial period, the height of Moso bamboo continues to rise, while the DBH remains relatively constant, and biomass accumulates rapidly. Both the height and DBH of Moso bamboo subsequently experience a near cessation of growth, with the biomass increasing slowly and steadily as secondary cell walls continue to form. A time series three-stage model (Li, 2020) was employed to calculate the dynamic AGB of individual Moso bamboo plants (Equation 1). The first stage encompasses the rapid growth phase of bamboo shoots (Liu et al., 2009), which occurs from shoot emergence until the height stabilizes, typically within 100 days postemergence. The biomass during this stage is correlated with the height and DBH of Moso bamboo. The second stage occurs when the bamboo height remains unchanged until May of the following year; during this period, biomass is linked to the leaf photosynthesis of Moso bamboo forests (Li, 2020). The third stage begins after May of the following year, when biomass is associated with the age and DBH of individual Moso bamboo (Zhou, 2006). With Equation 1, the AGB value of an individual Moso bamboo plant can be calculated at any time t.
Where AGBsinglet is the AGB (in kg) of an individual Moso bamboo plant, D is the DBH, H is the height of the Moso bamboo, t is the number of days after shoot emergence, A0 is the maximum value of AGB in the first 100 days, A1 is the difference between A0 and the minimum value of biomass after 365 days, A2 is the number of days corresponding to the bamboo leaf growth, range from 200 to 227, this study is set at 217, A3 is the general coefficient set as 0.011, and y is the age “degree” of the bamboo.
The aboveground biomass of each plot was calculated via Equation 2, following the determination of the aboveground biomass value of an individual Moso bamboo at any time t (Li, 2020). A total of 63 plots were classified as either on-year MBF samples or off-year MBF samples, and the changes in AGB for each plot were statistically analyzed over the course of one year.
where AGBsampleIT is the biomass (in Mg/ha) of the Ith sample site. AGBsingleiT represents the individual biomass of the ith Moso bamboo plant at time T, n represents the total number of Moso bamboo plants in the Ith sample plot, Areasample represents the area of the sample plot (400 m2), and m is the biomass unit conversion factor (converted from kg/m2 to Mg/ha, with a value of 10).
2.3.2 Extraction of on-year and off-year MBF spatial distributions
Determining the seasonal spectral differences between on-year and off-year MBFs is a prerequisite for their differentiation. May was the most pronounced season for the spectral differences between the on-year and off-year MBFs. The spectral differences between MBFs and other forests were mainly concentrated in the wavelength range of 740–865 nm, with the red-edge band and the near-infrared band identified as the most significant bands for distinguishing MBFs from other forests in terms of remote sensing classification (Li et al., 2019). Additionally, the annual variations in the yearly change bamboo index (YCBI) were used to distinguish on-year and off-year MBFs (Li et al., 2019). In this study, we extracted the on-year and off-year MBFs in the study area for 2018 via a hierarchical classifier. First, the normalized vegetation index (NDVI) was calculated from two periods of winter remote sensing images, with a threshold of 0.3 selected to isolate the vegetated portions of both images, thereby obtaining information on evergreen vegetation. Second, the YCBI was calculated on the basis of images from May 2018 and 2019, where forest portions with a threshold value exceeding 1.2 were classified as on-year MBFs and those with a value below 0.8 were classified as off-year MBFs. 100 survey sites were randomly selected in each classification result (on-year, off-year, and other types), respectively. These points were combined with Google Earth and high-resolution remote sensing images to verify their authenticity through visual interpretation and filled into the confusion matrix. The accuracy of the results was evaluated using overall accuracy (OA), user’s accuracy (UA), and producer’s accuracy (PA).
2.3.3 Estimation of the AGB of MBFs in the base month
In this study, May was selected as the base month because of its significance in the onset of bamboo shoot growth and the clear spectral difference in on/off-year MBFs. A random forest model was developed using the random Forest package in R by integrating measured sample plot biomass data with remote sensing variables. The selection of this package was based on its wide recognition and rich functionality within the R community, allowing for extensive customization and optimization to suit the specific characteristics of our forestry data. Its computational efficiency and stability in handling large datasets, along with the comprehensive diagnostic and evaluation metrics it provides, were also crucial factors in our choice, ensuring the reliable performance and quality of the model for estimating forest parameters. Given that the base month influences the accuracy of subsequent dynamic estimations, the factors associated with on-year and off-year variations were thoroughly considered, and spatial distributions were utilized to stratify the remote sensing estimation of the AGB of MBFs. The remote sensing variables primarily comprised original bands, vegetation indices and texture indices. The original bands included all bands from the Sentinel data, whereas the vegetation indices included the NDVI, EVI, SAVI, GNDVI, SRre, MTCI, and NDVIre (Table 2). The texture variables consisted of eight statistical features derived from texture information associated with the first principal component using a 3 × 3, 5 × 5, 7 × 7 window, such as the mean, variance, homogeneity, contrast, heterogeneity, information entropy, second-order moments, and correlation. The random forest method was used to rank the importance of a total of 232 candidate variables, including the original spectral bands, texture, and vegetation indices (Supplementary Table 2). The feature importance was determined by the degree of decrease in out-of-bag accuracy, the increment of relative importance in the model, and the influence on node purity. The variables most closely related to biomass were selected for modeling. The two most critical parameters were the number of trees (ntree) and the number of variables in the binary tree (mtry). The final modeling parameters were established by iteratively testing different values of ntree and mtry until the root mean square error stabilized. In this study, ntree was set to 1,000, and mtry was set to 7.
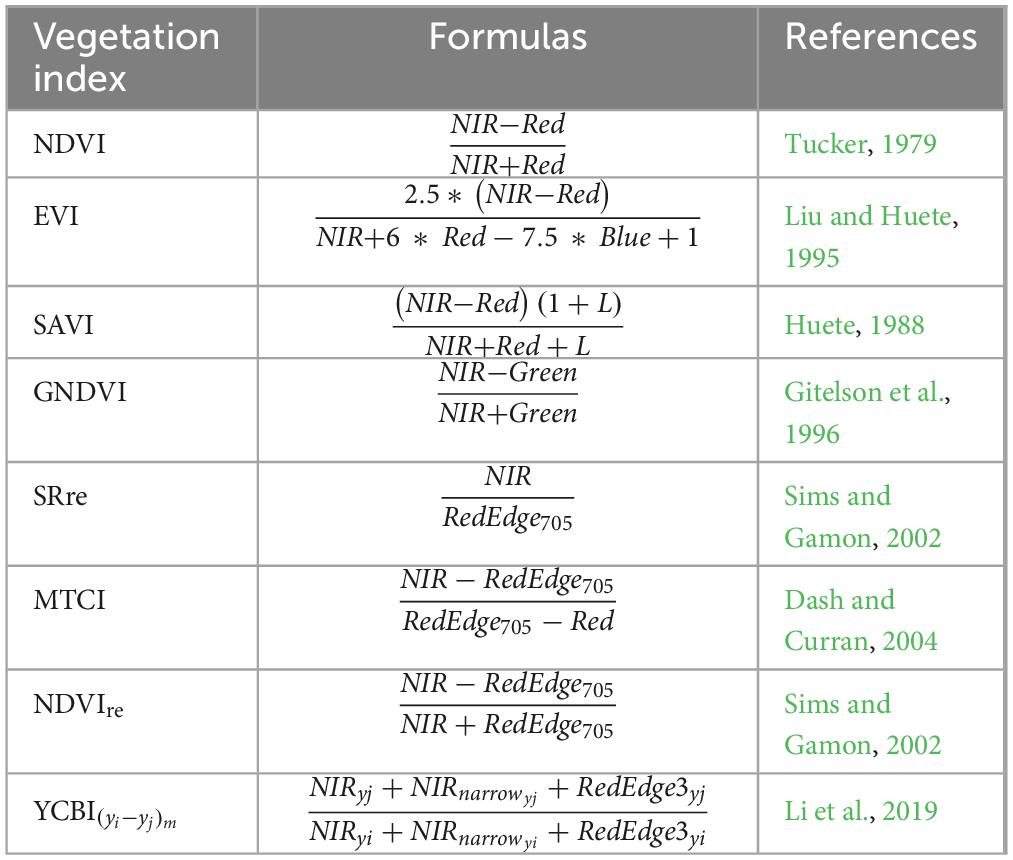
Table 2. The vegetation indices used in this study.
2.3.4 Dynamic estimation of AGB in MBFs
Owing to the linear accumulation process of AGB in MBFs, the dynamic estimation model employed in this study is based on a linear framework given the spatial distribution of ABG in the base month. This model accounts for the effects of new bamboo growth, old bamboo logging, and on/off-year phenomena. The time series-based dynamic AGB model (Equation 3) was constructed using AGB values from 63 sample plots. The AGB in the target month was estimated via Equation 3 and the spatial distribution of the AGB from the base month. In this study, May 2018 was selected as the base month of the AGB of the MBFs, serving as the reference for calculating the AGB of the MBFs in November according to Equation 3, with coefficients a and b set to 1.55 and 1.85, respectively.
The selected logging AGB model (Equation 4) was developed through a logging analysis of sample plots. Moso bamboo logging typically occurs in the winter for year-round plots, as these plots yield substantial new bamboo growth in the spring. A distinct pattern of selective logging is evident, where bamboo plants exceeding 3rd-degree are harvested; these 3rd-degree bamboo plants represent approximately one-third of the entire sample plot. Consequently, it is assumed that logging occurs in December, with one-third of the bamboo plants in one-year sample plots selected for logging. Thus, the coefficient c was established as 2/3 for on-year MBFs and 1 for off-year MBFs.
where AGBi is the AGB in the base month, AGBj is the AGB in the estimation month, j is the target month, i is the base month, AGBl is the AGB after selected logging, and a, b, and c are the model coefficients.
2.3.5 Accuracy assessment
The coefficient of determination (R2), root mean square error (RMSE), and relative root mean square error (RMSEr) are effective metrics for assessing the predictive capability of a model (Guan et al., 2023). These metrics (Equations 1–5) were employed to evaluate the accuracy of the biomass model in this study. The leave-one-out cross-validation method was utilized, which involves leaving one sample out for later testing while using the remaining samples for training. Consequently, if there are k samples, the model is trained and tested k times. This method is not influenced by the manner in which random samples are divided, and the resulting evaluation is often regarded as more reliable than that based on other methods (Sammut and Webb, 2010).
where is the estimated value; yi is the actual value; is the average of the actual values; and n is the number of samples.
3 Results
3.1 Time series variation in the AGB of Moso bamboo forests at the plot level
The AGB of month-by-month sample plots over a two-year period was calculated via Equations 1, 2. Figure 4 shows the time series distribution of the AGB for the 63 sample plots during this period. During the one-year growth stage, the AGB of the Moso bamboo forest rapidly increased, increasing from 52 to 65 Mg/ha during the shoot growth phase (May–November). The AGB of the MBFs subsequently sharply decreased from 65 to 41 Mg/ha during the selected logging period (December), resulting in a total biomass reduction of approximately one-third. This decline was followed by a steady growth rate during the shoot-bearing phase (January–April). In the same year, the MBFs entered the off-year stage, characterized by a slow increase in biomass, with no new bamboo shoots or selective logging occurring throughout the year. The AGB variations between the on-year and off-year stages were markedly different, with the AGB of the on-year MBFs generally exceeding that of the off-year MBFs, primarily due to the accumulation of new bamboo biomass. Thus, the AGB of the Moso bamboo forest samples dynamically varies, and these dynamic changes, as captured by the time series of AGB in this study, can be integrated into remote sensing-based AGB estimation.
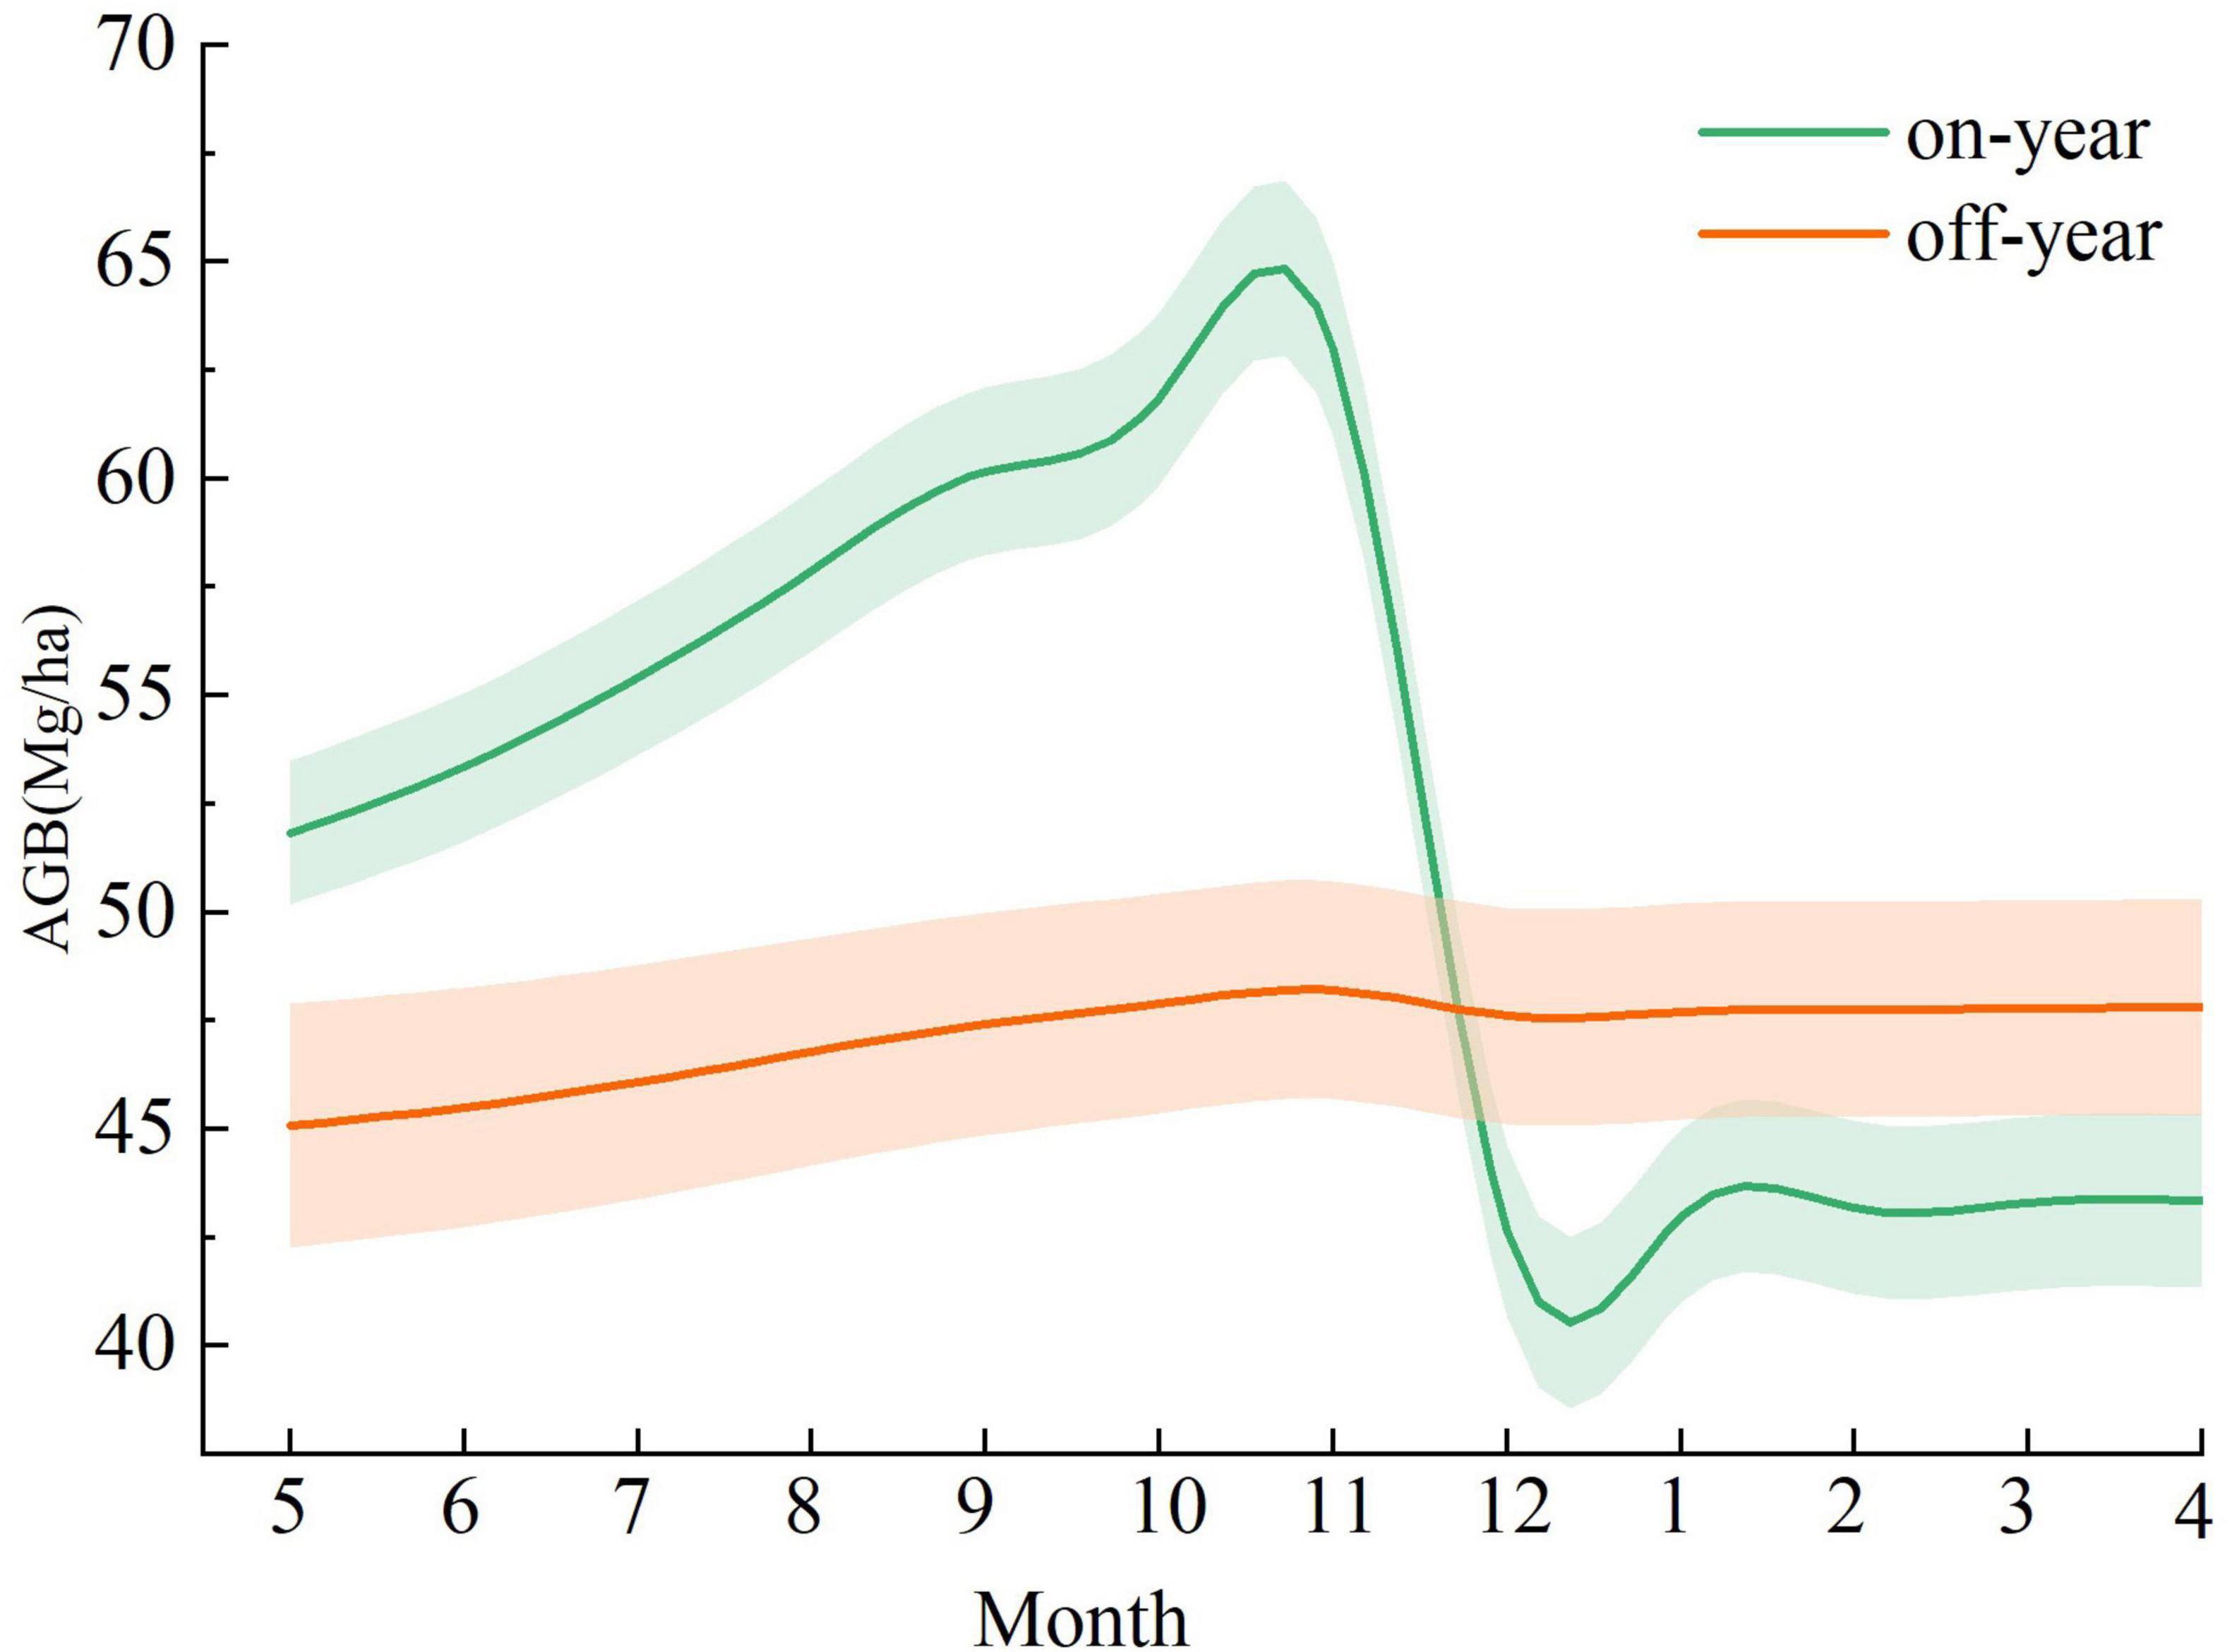
Figure 4. Time series of the AGB of the MBF sample plots.
3.2 Spatial distribution of on/off-year Moso bamboo forests and AGB estimation in May
The hierarchical classifier method based on the YCBI achieved high accuracy in classifying the 2018 on-year and off-year MBFs, with both producer and user accuracies exceeding 93%. MBFs are the most widely distributed bamboo forests in the study area and are predominantly located in the central region, extending in the northeast-southwest direction of the mountain range (Figure 5A). The distribution of on-year and off-year MBFs is heterogeneous, with the total area of MBFs at approximately 26,000 ha, accounting for 48% of the study area. The area of off-year MBFs is approximately 20,000 ha, which is 3.5 times larger than that of on-year MBFs. Elevation and topographic information can be used to explore the distinct distribution characteristics of MBFs across different regions. For example, in the high-elevation areas of the central mountain range, the MBFs are more homogeneous, whereas in lower-elevation areas, such as those in the northwest, south, and east, Moso bamboo is sparsely distributed. The MBFs are primarily found on slopes ranging from 10 to 40°, with forests on slopes in the 20–25° range being the most prevalent.
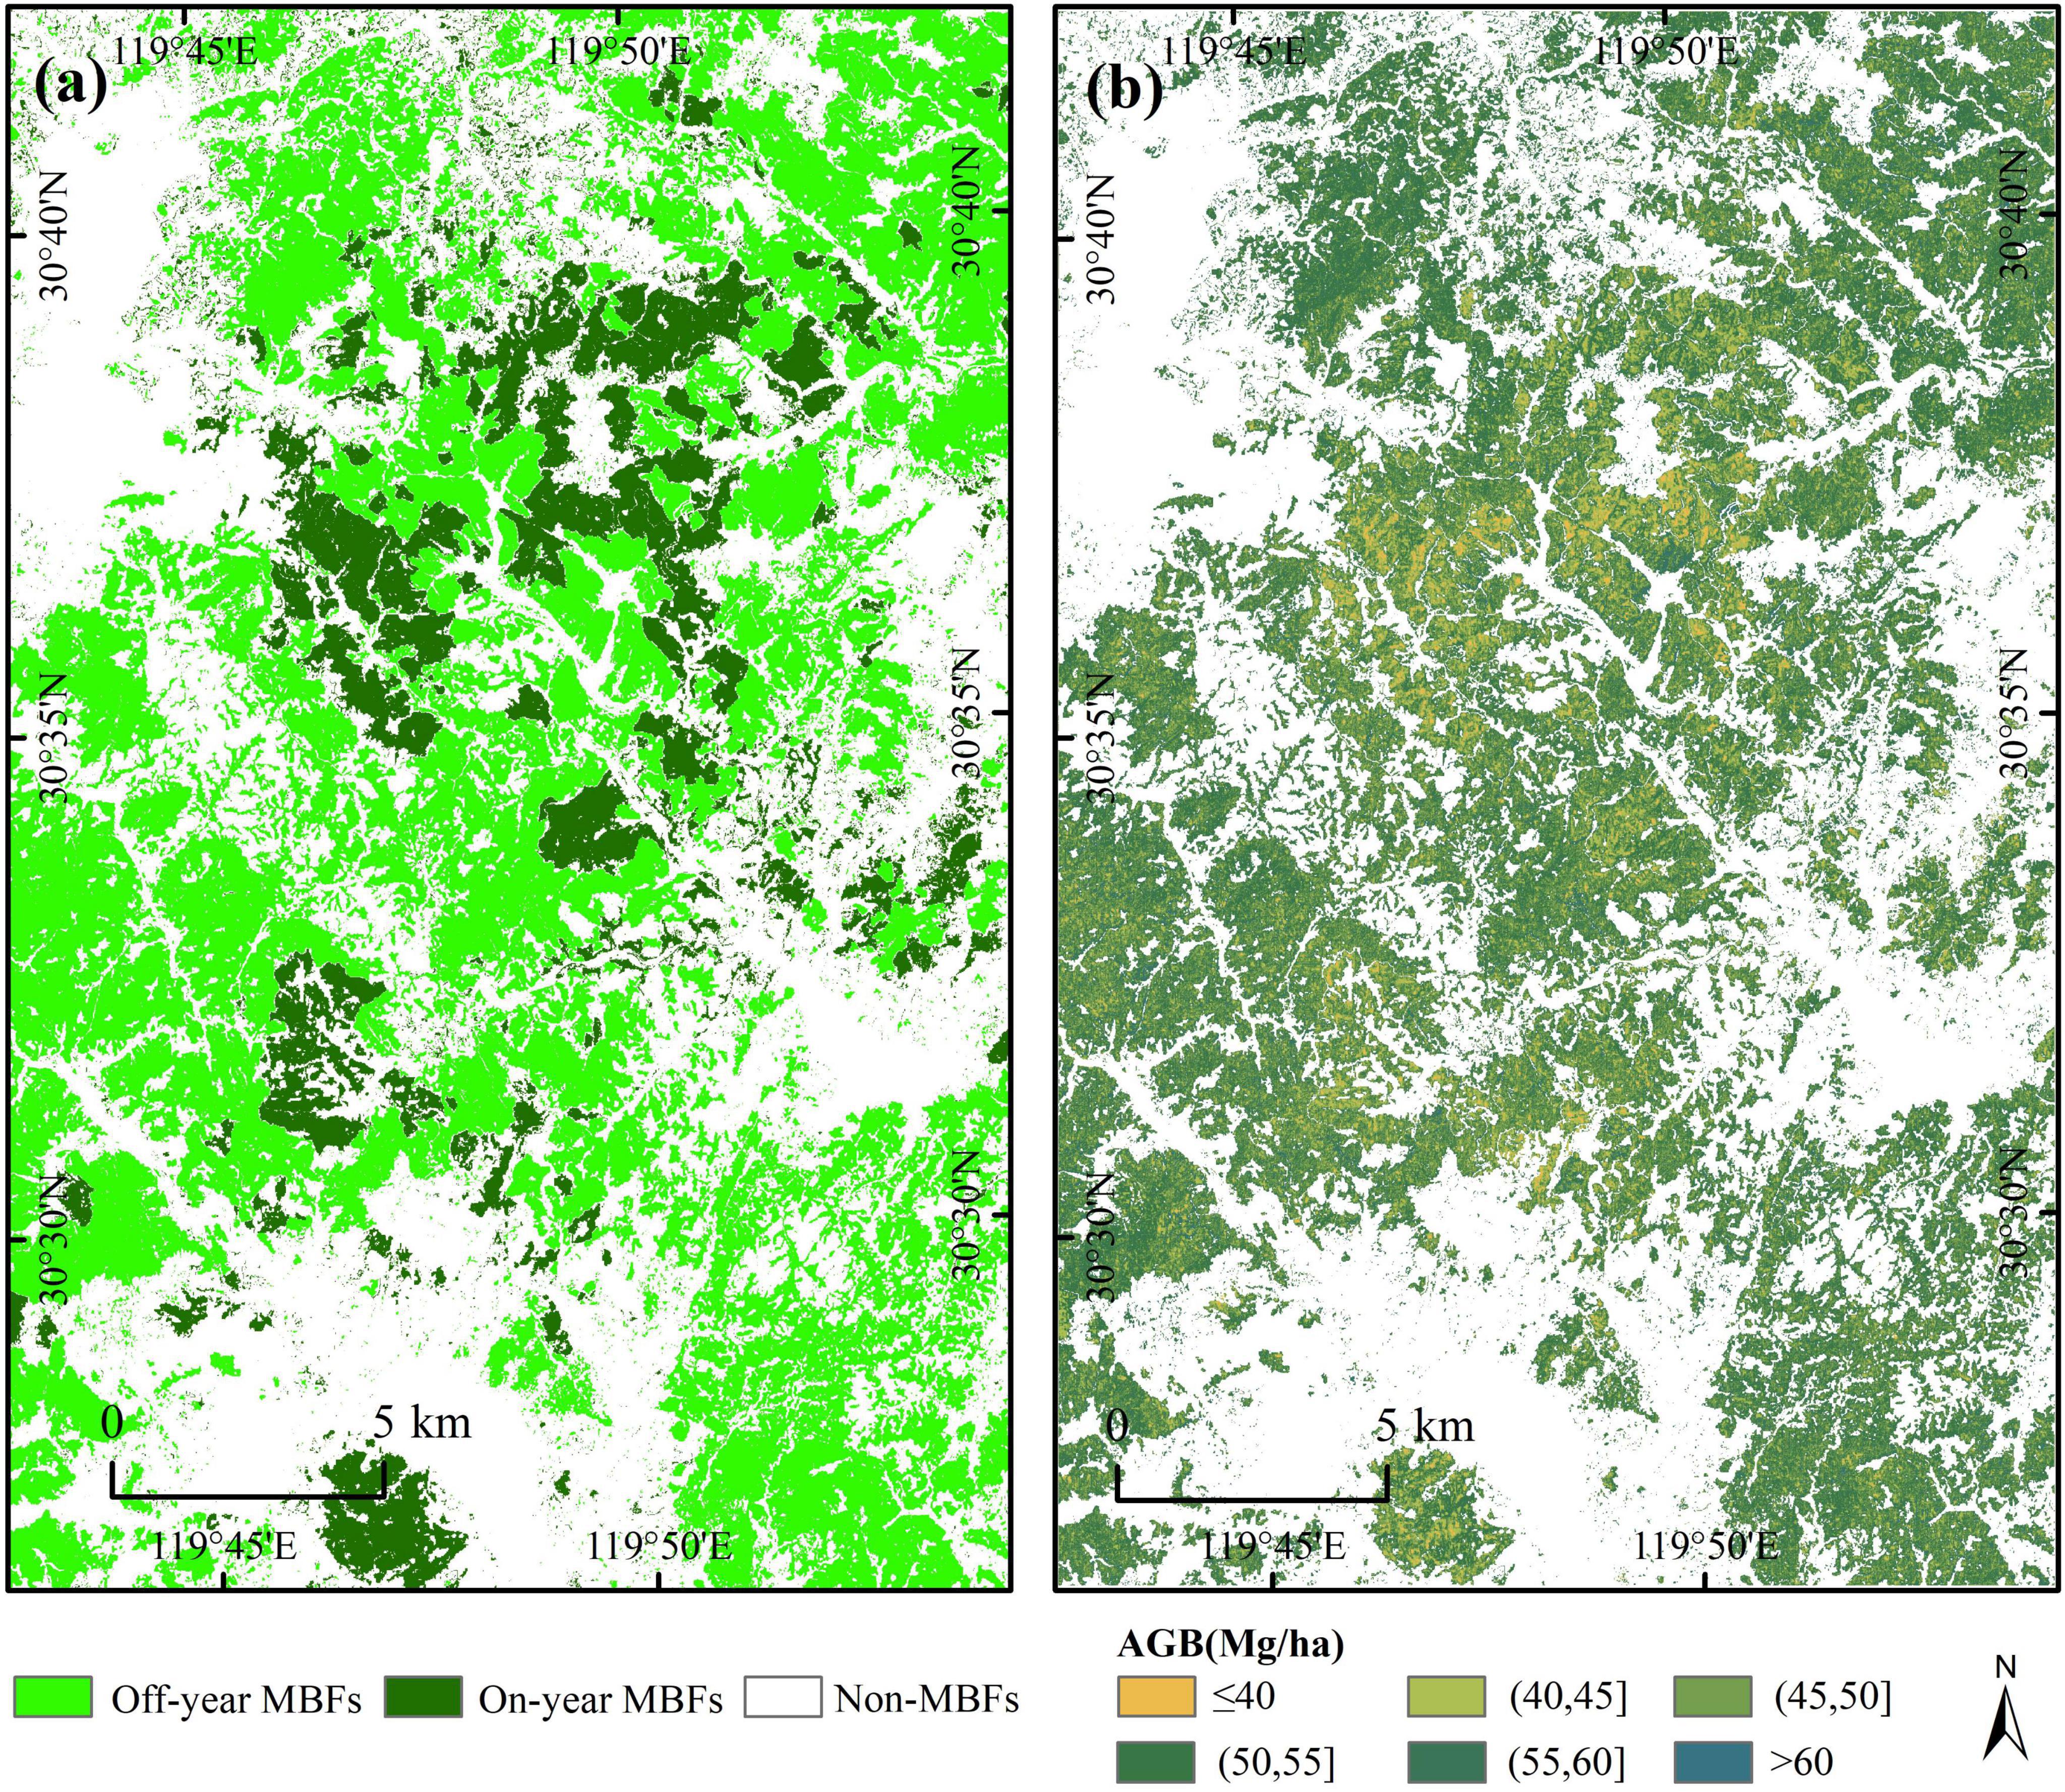
Figure 5. Classification results for on-year and off-year MBFs as well as AGB on 4 May 2018. (A) Classification results of on-year and off-year MBFs on 4 May 2018; (B) spatial distribution of the above-ground biomass of MBFs on 4 May 2018.
All remote sensing variables were ranked by random forest method, and ten variables with high importance value, such as 5 * 5 texture dissimilarity in green band, vegetation SRre, etc (see Supplementary material), were selected to build AGB model of MBFs. SRre can sensitively reflect the photosynthetic capacity of Moso bamboo leaves. Therefore, it can serve as an excellent indicator of biomass in the modeling process. Under a 5*5 window, the texture dissimilarity in the green band can provide intuitive spatial structure information of the Moso bamboo forest, thus playing a unique role in biomass modeling. The AGB results for the MBFs in May, derived from Sentinel-2 data, are illustrated in Figure 5B. Accuracy validation indicated that the RMSE of on-year MBFs was 16.59, whereas for off-year MBFs, it was 11.76. The AGB of on-year MBFs in May was generally greater than that of off-year MBFs, with on-year AGB primarily concentrated in the 45–50 Mg/ha range, occasionally exceeding 60 Mg/ha. In contrast, the AGB of the off-year MBFs was predominantly within the 40–50 Mg/ha range.
3.3 Estimation of AGB dynamics in MBFs
By integrating the AGB estimation results from May with the time series dynamic AGB model (Equation 3), the AGB of the MBFs was estimated for November (Figures 6A, C, D). The difference in AGB between the on-year and off-year MBFs in November was relatively small. The AGB of on-year MBFs was primarily concentrated in the range of 50–60 Mg/ha, whereas off-year MBFs in the western and southeastern regions predominantly presented AGB values within the 40–55 Mg/ha range.

Figure 6. AGB spatial distributions of the MBFs in November and December. (A) AGB of the MBFs on 15 November; (B) AGB of the MBFs in December; (C–F) typical spatial distribution of AGB.
On the basis of the AGB results from November and the selected logging AGB model (Equation 4), the spatial distribution of the AGB in the MBFs in December was determined. In December, after the harvest of mature bamboo, a marked difference in AGB between on-year and off-year MBFs became evident (Figures 6B, E, F). The aboveground biomass in the northern central on-year MBFs was generally less than 40 Mg/ha, with sporadic distributions in the 40–45 Mg/ha range, indicating a significant decrease compared with the ABG in November. In contrast, the AGB of the off-year MBFs remained primarily concentrated in the 50–60 Mg/ha range, showing no significant changes from that in November.
Given the differences between on-year and off-year conditions, the results of the AGB accuracy validation for the MBFs in November demonstrated superior performance. The R2 values for the AGB of the MBFs in the on-year and off-year periods were 0.82 and 0.85, respectively, indicating a strong linear relationship between the estimated and actual values. The RMSEs of AGB estimation for the on-year and off-year MBFs in November ranged from 6.56 to 11.88 Mg/ha, with RMSEr values between 13.61 and 19.03%. The prediction results were evaluated via scatter plots of the estimated versus actual values (Figure 7). The biomass of the MBFs tended toward low-value overestimation and high-value under-estimation. Specifically, the AGB of on-year MBFs in November was underestimated when it exceeded 50 Mg/ha, whereas the AGB of off-year MBFs was overestimated when it surpassed 40 Mg/ha (Figure 7A). In December, the R2 of validation for the AGB of off-year MBFs was 0.60, whereas that for on-year MBFs was only 0.11, indicating a poor relationship between the estimated and actual values, with the linear relationship no longer holding (Figure 7B). This was particularly evident in the severe overestimation of above-ground biomass below 25 Mg/ha.
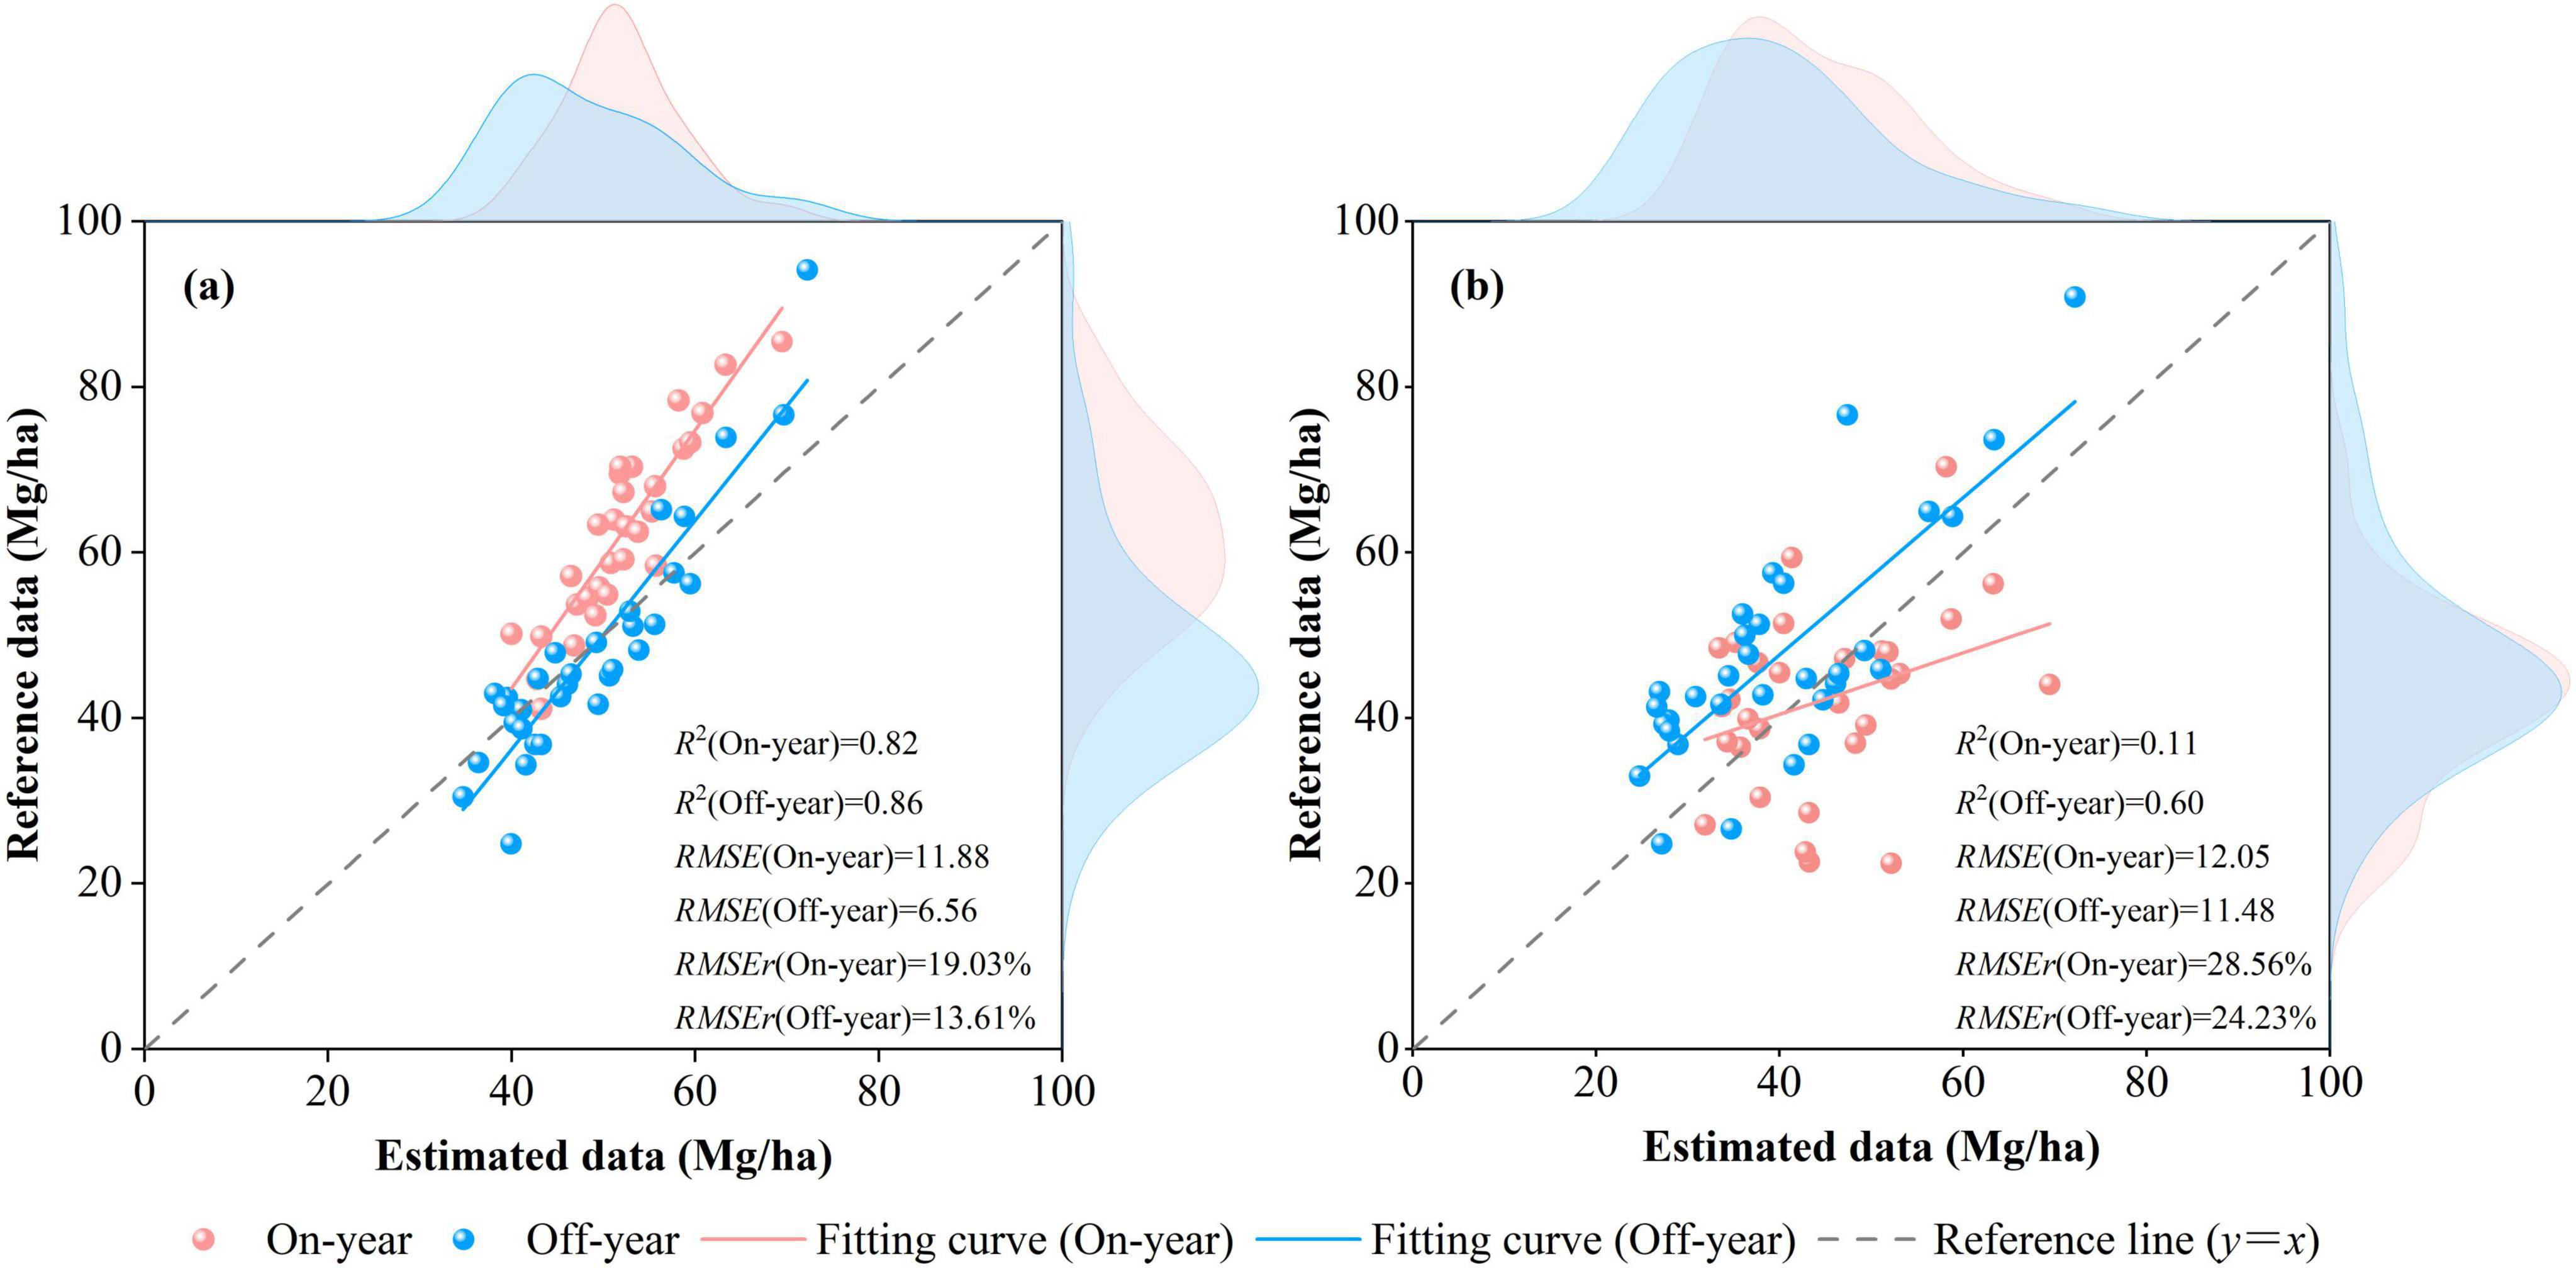
Figure 7. Validation results of the AGB of the MBFs in November and December. (A) Scatter plot between the on-year and off-year MBFs in November; (B) scatter plot between the on-year and off-year MBFs in December.
4 Discussion
4.1 Impact of ecological characteristics and human management on the AGB dynamics of MBFs
MBFs exhibit unique ecological characteristics, such as on/off-year cycles and biennial leaf-shedding processes, which lead to significant fluctuations in AGB. The on/off-year cycles are characterized by alternating periods of high and low bamboo shoot production, which directly influence biomass accumulation within these forests. In addition to these natural cycles, human management practices—such as selective logging, bamboo shoot harvesting, and culm top cutting—play crucial roles in shaping the AGB dynamics of MBFs (Chen et al., 2019). As a monocotyledon species, bamboo lacks a vascular cambium, resulting in relatively stable DBH and plant height over time. Consequently, the AGB accumulation in MBFs differs from that in other forest types, as the biomass of individual bamboo plants is related primarily to age and DBH. Furthermore, the on/off-year phenomena, along with the annual growth of new bamboo and the selective logging of older bamboo, contribute to significant AGB variations within a single year. Thus, on/off-year phenomena and human-driven selective logging are the primary factors influencing the dynamic estimation of aboveground biomass in MBFs. Accurately determining the AGB variation pattern of MBFs at the plot scale is essential for achieving accurate large-scale remote sensing-based AGB estimation. The results of this study indicate that the AGB in the on-year plots displays a wider range, between 42.1 and 61.9 Mg/ha, than that in off-year plots, ranging between 45.7 and 48.7 Mg/ha. Stratified modeling based on on-year and off-year phenomena represents a potential method to improve the accuracy of large-scale dynamic AGB estimation (Chen et al., 2019).
4.2 Error sources in AGB estimation models
Currently, the estimation of AGB in MBFs at the local or regional scale requires the integration of remote sensing data and plot data (Lu et al., 2014; Jurjeviæ et al., 2020). Ensuring temporal consistency between these data sources is crucial for achieving satisfactory results, particularly given the high canopy density and significant dynamic characteristics of MBFs. The AGB estimation results for MBFs remain suboptimal because of the saturation effect of optical remote sensing data. MSFs’ spectral saturation value is approaching around 75 Mg/ha, which is lower than other forests, such as Pine forests with 159 Mg/ha, broadleaf forests with 123 Mg/ha, mixed forests with 152 Mg/ha (Zhao et al., 2016b). Although some researchers have attempted to synchronize the timing of data collection between remote sensing data and sample plots (Chen et al., 2019; Li, 2020), the accuracy of the estimation results has only improved slightly, and the problem of spectral saturation has not been solved. In this study, a simplified ecological growth model was employed to monitor dynamic changes. The model estimates AGB via remote sensing data from May and subsequently projects AGB for November and December on the basis of the dynamic AGB patterns of MBFs. Overall, the fitting results for November were more favorable than those for December. The poor estimates of AGB following the thinning of bamboo forests in December was largely attributed to the actual distribution of three-year-old bamboo in the sample plots, as the assumed 1/3 thinning was insufficient to accurately reflect the true age distribution and the corresponding reduction in aboveground biomass. To further improve the accuracy of biomass simulations, this approach should be enhanced through the integration of growth simulation models that encompass the entire growth process of MBFs, including individual bamboo growth and human management practices. Meanwhile, deep learning models can be enhance the accuracy of remote sensing variable selection in the future study, and the dynamics of AGB should be investigated via high-resolution remote sensing products.
Relying solely on models that integrate remote sensing and plot data to estimate the AGB of MBFs may not be the effective approach. The analysis conducted at the plot level in this study revealed a strong correlation between bamboo stand density and AGB. Specifically, bamboo stand density is highly related to the AGB distribution within a bamboo forest. Furthermore, postharvest biomass changes are predominantly influenced by the number of three-year-old bamboo plants, making the age distribution within the forest a critical factor for accurate AGB estimation. Hence, identifying the number of Moso bamboo plants from remote sensing data, whether it is optical data or LiDAR data, is a better choice for AGB estimation of MBFs. For example, methods based on Airborne LiDAR or handheld LiDAR are promising for acquiring three-dimensional information about individual bamboo plants, such as their height and age (Cao et al., 2019; Campbell et al., 2021; Xu et al., 2022). Unmanned aerial vehicle (UAV) is a good platform for estimating the number of Moso bamboo plants at the regional scale (Lu et al., 2023; Lv et al., 2024). The theoretical feasibility of integrating drone-based LiDAR measurements with optical data for estimating AGB has been demonstrated (Duncanson et al., 2020; Talebiesfandarani and Shamsoddini, 2022; Lu and Jiang, 2024). In the future, combining these technologies with Sentinel-2 data could enable their application over larger areas, thereby enhancing the accuracy of AGB estimation in Moso bamboo forests (Zhang et al., 2024).
5 Conclusion
In this study, Sentinel-2 data and field survey data were integrated to capture dynamic changes and develop a dynamic model for estimating the AGB of MBFs in north-western Zhejiang Province. The distributions of on-year and off-year bamboo forests are spatially heterogeneous. The AGB of the MBFs exhibited a distinct dynamic cycle characterized by the rapid accumulation of new bamboo and significant reductions due to selective harvesting during the on-year period, whereas a steady accumulation of lignified bamboo occurs during the off-year period. The AGB of Moso bamboo forests in the on-year and off-year cycles ranged from 30 to 80 Mg/ha. By incorporating the specific characteristics of the on-year and off-year phenomena into the initialization process of the biomass model and integrating these factors with the linear equation derived from sample plot-measured biomass, it was possible to accurately estimate the AGB and its dynamic changes in Moso bamboo forests.
Data availability statement
The original contributions presented in this study are included in this article, further inquiries can be directed to the corresponding author.
Author contributions
NL: Formal analysis, Funding acquisition, Methodology, Writing – original draft. MH: Investigation, Methodology, Software, Writing – original draft. JX: Investigation, Software, Writing – review and editing. LW: Data curation, Writing – review and editing. TW: Validation, Writing – review and editing. WZ: Visualization, Writing – review and editing. SG: Funding acquisition, Writing – review and editing. LL: Formal analysis, Funding acquisition, Writing – original draft.
Funding
The authors declare that financial support was received for the research, authorship, and/or publication of this article. This research was funded by the National Natural Science Foundation of China (grant no. 42101387), the Anhui Province Universities Outstanding Talented Person Support Project (grant no. YQZD2024045), the Natural Science Research Project for Anhui Universities (grant nos. 2023AH030094, 2022AH051111, and 2023AH051614), the Chuzhou University Research and Development Fund for the Talent Startup Project (grant no. 2022XJZD08), the Anhui Province Key Laboratory of Physical Geographic Environment (grant no. 2022PGE004), and the National College Student Innovation and Entrepreneurship Training Project (grant no. 202310377002).
Conflict of interest
The authors declare that the research was conducted in the absence of any commercial or financial relationships that could be construed as a potential conflict of interest.
Generative AI Statement
The authors declare that no Generative AI was used in the creation of this manuscript.
Publisher’s note
All claims expressed in this article are solely those of the authors and do not necessarily represent those of their affiliated organizations, or those of the publisher, the editors and the reviewers. Any product that may be evaluated in this article, or claim that may be made by its manufacturer, is not guaranteed or endorsed by the publisher.
Supplementary material
The Supplementary Material for this article can be found online at: https://www.frontiersin.org/articles/10.3389/ffgc.2025.1515767/full#supplementary-material
Footnotes
References
Ahmad, A., Gilani, H., and Ahmad, S. R. (2021). Forest aboveground biomass estimation and mapping through high-resolution optical satellite imagery—A literature review. Forests 12:914. doi: 10.3390/f12070914
Campbell, M., Dennison, E. P., Kerr, L. K., and Anderegg, R. L. W. (2021). Scaled biomass estimation in woodland ecosystems: Testing the individual and combined capacities of satellite multispectral and lidar data. Remote Sens. Environ. 262:112511. doi: 10.1016/j.rse.2021.112511
Cao, L., Coops, C. N., Sun, Y., Ruan, H., Wang, G., and Dai, J. (2019). Estimating canopy structure and biomass in bamboo forests using airborne LiDAR data. ISPRS J. Photogramm. Remote Sens. 148, 114–129. doi: 10.1016/j.isprsjprs.2018.12.006
Chen, X. G., Zhang, Y. P., Zhang, X. Q., and Guo, Y. (2008). Carbon stock changes in bamboo stands in China over the last 50 years. Acta Ecol. Sini. 28, 5218–5227.
Chen, Y. Y., Li, L. W., Lu, D. S., and Li, D. Q. (2019). Exploring bamboo forest aboveground biomass estimation using Sentinel-2 data. Remote Sens. 11:7. doi: 10.3390/rs11010007
Dash, J., and Curran, P. J. (2004). MTCI: The meris terrestrial chlorophyll index. Int. J. Remote Sens. 25, 151–161. doi: 10.1109/IGARSS.2004.1369009
Duncanson, L., Neuenschwander, A., Hancock, S., Thomas, N., Fatoyinbo, L., Simard, M., et al. (2020). Biomass estimation from simulated GEDI, ICESat-2 and NISAR across environmental gradients in Sonoma County, California. Remote Sens. Environ. 242:111779. doi: 10.1016/j.rse.2020.111779
Fang, W., Gui, R. Y., Ma, L. F., Jin, A. W., Lin, X. C., Yu, X. J., et al. (2015). Economic Bamboo in China. Beijing: Science Press.
Gao, Y. K., Lu, D. S., Li, G. Y., Wang, G. X., Chen, Q., Liu, L. J., et al. (2018). Comparative analysis of modeling algorithms for forest aboveground biomass estimation in a subtropical region. Remote Sens. 10:627. doi: 10.3390/rs10040627
Gitelson, A. A., Kaufman, Y. J., and Merzlyak, M. N. (1996). Use of a green channel in remote sensing of global vegetation from EOS-MODIS. Remote Sens. Environ. 58, 289–298. doi: 10.1016/S0034-4257(96)00072-7
Guan, Y., Tian, X., Zhang, W. F., Marino, A., Huang, J. M., Mao, Y. W., et al. (2023). Forest canopy cover inversion exploration using multi-source optical data and combined methods. Forests 14:1527. doi: 10.3390/F14081527
Guo, X. Y., Sun, Y. J., and Liu, J. (2015). Compatible single-tree biomass models with measurement error for moso bamboo. Acta Agric. Univer. Jiangxiensis 37, 849–858.
Han, N., Du, H. Q., Zhou, G. M., Xu, X. J., Cui, R. R., and Gu, C. Y. (2013). Spatiotemporal heterogeneity of Moso bamboo aboveground carbon storage with landsat thematic mapper images: A case study from Anji county. China. Int. J. Remote Sens. 34, 4917–4932. doi: 10.1080/01431161.2013.782115
Huete, A. R. (1988). A soil-adjusted vegetation index (SAVI). Remote Sens. Environ. 25, 295–309. doi: 10.1016/0034-4257(88)90106-X
Jurjeviæ, L., Liang, X. L., Gasparovic, M., and Balenoviæ, I. (2020). Is field-measured tree height as reliable as believed – part II, a comparison study of tree height estimates from conventional field measurement and low-cost close-range remote sensing in a deciduous forest. ISPRS J. Photogramm. Remote Sens. 169, 227–241. doi: 10.1016/j.isprsjprs.2020.09.014
Li, L. (2020). Phenology Examination, Classification and Aboveground Biomass Estimation of Moso Bamboo Forests Using Time Series Remote Sensing Data. Master’s thesis. Hangzhou: Zhejiang A&F University.
Li, L. W., Li, N., Lu, D. S., and Chen, Y. (2019). Mapping Moso bamboo forest and its on-year and off-year distribution in a subtropical region using time-series Sentinel-2 and Landsat 8 data. Remote Sens. Environ. 231:111265. doi: 10.1016/j.rse.2019.111265
Li, P. H., Zhou, G. M., Du, H. Q., Lu, D. S., Mo, L. F., Xu, X. J., et al. (2015). Current and potential carbon stocks in Moso bamboo forests in China. J. Environ. Manag. 156, 89–96. doi: 10.1016/j.jenvman.2015.03.030
Li, X. J., Du, H. Q., Mao, F. J., Zhou, G. M., Chen, L., Xing, L. Q., et al. (2018). Estimating bamboo forest aboveground biomass using EnKF-assimilated MODIS LAI spatiotemporal data and machine learning algorithms. Agric. For. Meteorol. 256, 445–457. doi: 10.1016/j.agrformet.2018.04.002
Liu, E. B., Zhou, G. M., Jiang, P. K., Ge, H. L., and Du, H. Q. (2009). Construction of biomass unite model with nonlinear partial least squares regression: A case of study for bamboo biomass. Acta Ecol. Sini. 29, 5561–5569.
Liu, H. Q., and Huete, A. (1995). A feedback based modification of the NDVI to minimize canopy background and atmospheric noise. IEEE Trans. Geosci. Electron. 33, 457–465. doi: 10.1109/TGRS.1995.8746027
Lu, D. S., and Jiang, X. D. (2024). A brief overview and perspective of using airborne Lidar data for forest biomass estimation. Int. J. Image Data Fusion 15, 1–24. doi: 10.1080/19479832.2024.2309615
Lu, D. S., Chen, Q., Wang, G. X., Liu, L. J., Li, G. Y., and Moran, E. (2014). A survey of remote sensing-based aboveground biomass estimation methods in forest ecosystems. Int. J. Digital Earth 9, 63–105. doi: 10.1080/17538947.2014.990526
Lu, X. T., Deng, Y. B., Song, X. F., Yan, X. F., Yu, K. Y., and Liu, J. (2023). Effect of spatial resolution of unmanned aerial vehicle (UAV) visible light remote sensing image on recognition accuracy of Phyllostachys edulis stand density. J. Northeast Forestry Univ. 51, 79–83. doi: 10.13759/j.cnki.dlxb.2023.03.014
Lv, L. J., Zhao, Y. Y., Li, X. J., Yu, J. C., Song, M. X., Huang, L., et al. (2024). UAV-based intelligent detection of individual trees in Moso bamboo forests with complex canopy structure. IEEE J. Sel. Top. Appl. Earth Obs. Remote Sens. 17, 11915–11930. doi: 10.1109/JSTARS.2024.3422390
Marchesan, J., Alba, E., Schuh, S. M., Favarin, J. A. S., Fantinel, R., Marchesan, L., et al. (2023). Aboveground biomass stock and change estimation in amazon rainforest using airborne light detection and ranging, multispectral data, and machine learning algorithms. J. Applied Remote Sens. 17:024509. doi: 10.1117/1.JRS.17.024509
Nath, A. J., Lal, R., and Das, A. K. (2015). Managing woody bamboos for carbon farming and carbon trading. Glob. Ecol. Conserv. 3, 654–663. doi: 10.1016/j.gecco.2015.03.002
National Forestry and Grassland Administration (2023). Forest and Grass Ecology Monitoring Report in China, 2021. Beijing: China Forestry Publishing House.
Navarro, J. A., Tomé, L. J., Marino, E., Guillen, L. M., and Fernández, A. (2020). Assessing the transferability of airborne laser scanning and digital aerial photogrammetry derived growing stock volume models. Int. J. Appl. Earth Obs. Geoinf. 91:102135. doi: 10.1016/j.jag.2020.102135
Reese, H., and Olsson, H. (2011). C-correction of optical satellite data over alpine vegetation areas: A comparison of sampling strategies for determining the empirical c-parameter. Remote Sens. Environ. 115, 1387–1400. doi: 10.1016/j.rse.2011.01.019
Sammut, C., and Webb, G. I. (2010). “Leave-one-out cross-validation,” in Encyclopedia of Machine Learning, eds C. Sammut and G. I. Webb (Boston, MA: Springer), 600–601. doi: 10.1007/978-0-387-30164-8_469
Sims, D., and Gamon, J. A. (2002). Relationships between leaf pigment content and spectral reflectance across a wide range of species, leaf structures and developmental stages. Remote Sens. Environ. 81, 337–354. doi: 10.1016/S0034-4257(02)00010-X
Song, X. Z., Zhou, G. M., Jiang, H., Yu, S. Q., Fu, J. H., Li, W. Z., et al. (2011). Carbon sequestration by Chinese bamboo forests and their ecological benefits: assessment of potential, problems, and future challenges. Environ. Rev. 19, 418–428. doi: 10.1139/a11-015
Talebiesfandarani, S., and Shamsoddini, A. (2022). Global-scale biomass estimation based on machine learning and deep learning methods. Remote Sens. Appli. Soc. Environ. 28:100868. doi: 10.1016/jrsase.2022.100868
Tucker, C. J. (1979). Red and photographic infrared linear combinations for monitoring vegetation. Remote Sens. Environ. 8, 127–150. doi: 10.1016/0034-4257(79)90013-0
Xu, W. B., Fang, Z. H., Fan, S. Y., and Deng, S. S. (2022). Evaluation of the moso bamboo age determination based on laser echo intensity. Remote Sens. 14:2550. doi: 10.3390/rs14112550
Xu, X. J., Du, H. Q., Zhou, G. M., Ge, H. L., Shi, Y. J., Zhou, Y. F., et al. (2011). Estimation of aboveground carbon stock of Moso bamboo (Phyllostachys heterocycla var. pubescens) forest with a Landsat Thematic Mapper image. Int. J. Remote Sens. 32, 1431–1448. doi: 10.1080/01431160903551389
Yu, C. L., Du, H. Q., Zhou, G. M., Xu, X. J., and Gui, Z. Y. (2012). Transferability of remote sensing-based models for estimating Moso bamboo forest aboveground biomass. Chin. J. Appl. Ecol. 23, 2422–2428.
Zeng, Z. Q., Tian, Y. X., Dai, C. D., Peng, P., Meng, Y., Huang, Z. R., et al. (2016). Study on biomass model of Phyllostachys heterocycla cv pubescens in Hunan Province. Hunan For. Sci. Technol. 43, 56–59.
Zhang, L. J., Zhao, Y. Y., Chen, C., Li, X. J., Mao, F. J., Lv, L. J., et al. (2024). UAV-LiDAR Integration with Sentinel-2 Enhances Precision in AGB Estimation for Bamboo Forests. Remote Sens. 16:705. doi: 10.3390/rs16040705
Zhang, Y. (2016). Carbon Storage Estimation and dynamic change of Phyllostachys edulis forest in Fujian Province. Master’s thesis. Beijing: Chinese Academy of Forestry.
Zhao, P. P., Lu, D. S., Wang, G. X., Wu, C. P., Huang, Y. J., and Yu, S. Q. (2016a). Forest aboveground biomass estimation in Zhejiang province using the integration of Landsat TM and ALOS PALSAR data. Int. J. Appl. Earth Obs. Geoinf. 53, 1–15. doi: 10.1016/j.jag.2016.08.007
Zhao, P. P., Lu, D. S., Wang, G. X., Wu, C. P., Huang, Y. J., and Yu, S. Q. (2016b). Examining spectral reflectance saturation in landsat imagery and corresponding solutions to improve forest aboveground biomass estimation. Remote Sens. 8:469. doi: 10.3390/rs8060469
Keywords: aboveground biomass estimation, Moso bamboo forests, on-year and off-year, remote sensing, random forest
Citation: Li N, Hu M, Xie J, Wei L, Wu T, Zhang W, Gu S and Li L (2025) Enhancing aboveground biomass estimation in Moso bamboo forests: the role of on-year and off-year phenomena in remote sensing. Front. For. Glob. Change 8:1515767. doi: 10.3389/ffgc.2025.1515767
Received: 23 October 2024; Accepted: 13 January 2025;
Published: 03 February 2025.
Edited by:
Walter Mattioli, Council for Agricultural Research and Agricultural Economy Analysis | CREA, ItalyReviewed by:
Antonio Tomao, University of Udine, ItalyGiovanni D’Amico, University of Florence, Italy
Copyright © 2025 Li, Hu, Xie, Wei, Wu, Zhang, Gu and Li. This is an open-access article distributed under the terms of the Creative Commons Attribution License (CC BY). The use, distribution or reproduction in other forums is permitted, provided the original author(s) and the copyright owner(s) are credited and that the original publication in this journal is cited, in accordance with accepted academic practice. No use, distribution or reproduction is permitted which does not comply with these terms.
*Correspondence: Longwei Li, bGlsd0BjaHp1LmVkdS5jbg==
†These authors have contributed equally to this work