- State Key Laboratory of Tree Genetics and Breeding, Key Laboratory of Tree Breeding and Cultivation of National Forestry and Grassland Administration, Research Institute of Forestry, Chinese Academy of Forestry, Beijing, China
Assessing the quality of forest sites is crucial for evaluating the potential productivity of forests and formulating effective management strategies. Therefore, it is essential to understand how environmental variables affect the site quality. This study focuses on quantifying the effects of 44 different environmental variables including climate, topography, and soil properties on the site index of Larix kaempferi plantations in three different climate regions in China, utilizing the random forest algorithm. L. kaempferi site index was determined from stem analysis data by felling dominant trees from 51 even-aged stands. The results indicated that the proposed random forest model explained ~59.47% of site index variations. Among many environmental variables, available phosphorus, pH, degree-days above 5°C (DD5), and spring mean maximum temperature (Tmax_MAM) had significant effects on the site index (P < 0.05), and the importance of soil chemical properties generally exhibits relatively larger effects on the site index than climate variables and topography variables. The partial dependence analysis revealed that the L. kaempferi plantations had maximum values at ~30 mg/kg of available phosphorus in the first soil layers, 30 mg/kg of available phosphorus in the second soil layers, 20 mg/kg of available phosphorus in the third soil layers, the DD5 between 2,600and 3,000°C, and Tmax_MAM ~15°C. Our findings attempt to provide a better understanding of the site–growth relationship.
Introduction
A forest site is the environmental condition in which trees grow and develop. The identification of site quality offers the opportunity to assess the potential productivity of a given forest or other vegetation type under a certain site condition, which is mainly evaluated by the impact of forest natural attributes on forest utilization capacity or suitability (Fonweban et al., 1995; Shen et al., 2018; Zhu et al., 2019). Site quality assessment is a prerequisite for the management measures of suitable land and trees and plays a very important role and significance for the realization of scientific afforestation and forest management (Mäkinen et al., 2017; Mensah et al., 2022; Lee and Choi, 2022). Because of more concerns on current climate change with projections of warmer temperatures, increased carbon dioxide concentrations, and longer growing seasons, it is necessary to consider climate and topography factors for site quality assessment.
The most common methods of site quality assessment are based on the site index, which corresponds to the dominant height at a reference age for forest stands (Martín-Benito et al., 2008; Sabatia and Burkhart, 2014; Oddi et al., 2022). The dominant tree height of the stand is responsive to the site conditions, and the growth competition in the upper layer of the stand is less affected by human activities (Li and Zhang, 2010; Shen et al., 2018; Sharma, 2022). Estimation of the stand site index is generally accomplished by utilizing the top height growth curves determined for particular species (Duan et al., 2022). However, the height growth curve of dominant trees under different site conditions is not isomorphic, that is, the growth speed, curve shape, and asymptote maximum of dominant trees under different site conditions may be different (Wang et al., 2007; Albayrak et al., 2020). A reasonable site index model should meet the characteristics of different asymptotes and polymorphisms at the same time (Calegario et al., 2005).
Alternative site index determination methods based on relationships between site index and environmental factors have been widely used in forest productivity studies and had varying degrees of success (Ercanli et al., 2008; Bravo-Oviedo et al., 2011). The models of the relationship between site index and ecological factors may be applied in the estimation of the potential productivity, particularly for non-forest areas in which the use of the traditional site index estimation method is impossible or more difficult (Klinka and Chen, 2003; Seynave et al., 2005; Gülsoy and Cinar, 2019). Traditional statistical models, for example, correlation analysis and multiple regressions, have been widely used to establish a quantitative link between site index and ecological variables in many of the early modeling studies (Li et al., 2022). Due to the rapid development of artificial intelligence, there has been growing interest in using different machine-learning algorithms (e.g., artificial neural network—ANN, random forest model—RF, boosted regression tree—BRT) to explore the complex interactions between site index and the potential driving factors due to the non-linear trends and variable variances displayed by many ecological variables without requiring statistical assumptions and predetermined mathematical equations (Moisen and Frescino, 2002; Aertsen et al., 2010; Gavilán-Acuña et al., 2021). Many studies have proved that machine-learning algorithms are better suited for predicting site indexes than traditional statistical models (Aertsen et al., 2011).
Climate, topography, and soil factors have been found to be important drivers of forest productivity and related to site index because ecological factors such as water availability, nutrient content, temperature, and other environmental conditions play a crucial role in the growth and functioning of forest trees (Wang and Klinka, 1996; Wang et al., 2004; Paulo et al., 2015; Özel et al., 2021). Climatic factors are important site factors influencing the site index (Monserud et al., 2006; Bravo-Oviedo et al., 2010; Hemingway and Kimsey, 2020). Topography can influence climate, which together with geological substratum affects soil-forming processes. The most commonly used topography factors are aspect and slope, which have a significant impact on factors limiting plant growth, such as light, heat, and water (Lindgren et al., 1994; Socha, 2008). Site index has also been found to be related to soil physical properties such as soil depth, soil drainage, coarse fragment, and chemical properties such as pH, potassium, and phosphorus (Curt et al., 2001; Subedi and Fox, 2016). Due to the differences in regions and species, the site factors that are critical to explaining site index variation are different.
Larix kaempferi (Lamb.) Carr. is native to the mountainous areas of central Honshu and has been one of the most successful introduced tree species for wood production and pulp and paper (Hoshi, 2004). Because of L. kaempferi rapid growth, wide adaptability, fast forestation, and wide use of wood, it has wide ecological amplitude, growing successfully across a range of climatic conditions and site types. The growth of L. kaempferi is generally better than that of local larch in the same area and shows greater growth advantages (Jose-Maldia et al., 2009). Considering the changes in climatic patterns among the regions in the study, it is crucial to develop a site index model for L. kaempferi based on the correlated site factors and helps to evaluate site quality of non-forest land. In the previous studies, researchers conducted site classification study of L. kaempferi in the region and compiled a site index table (Li, 2011). However, the fundamental relationship between site productivity and site quality variables of L. kaempferi across various climatic regions is not well understood, and the effects of climatic factors and soil chemical properties at different soil depths have not been thoroughly explored. Therefore, we attempted to integrate different influencing factors to quantify their impact on the site index of L. kaempferi. The main objectives of this study were to (1) estimate site index for plots based on dynamic site index models; (2) employ the random forest model based on a total of 44 potential driving factors including climate, topography, and soil chemical properties; and (3) clarify the relative importance on the site index and partial dependences of these variables. The results of the study will try to provide a basis for the evaluation of the site quality and the improvement of the site quality of the L. kaempferi plantation.
Materials and methods
Study area
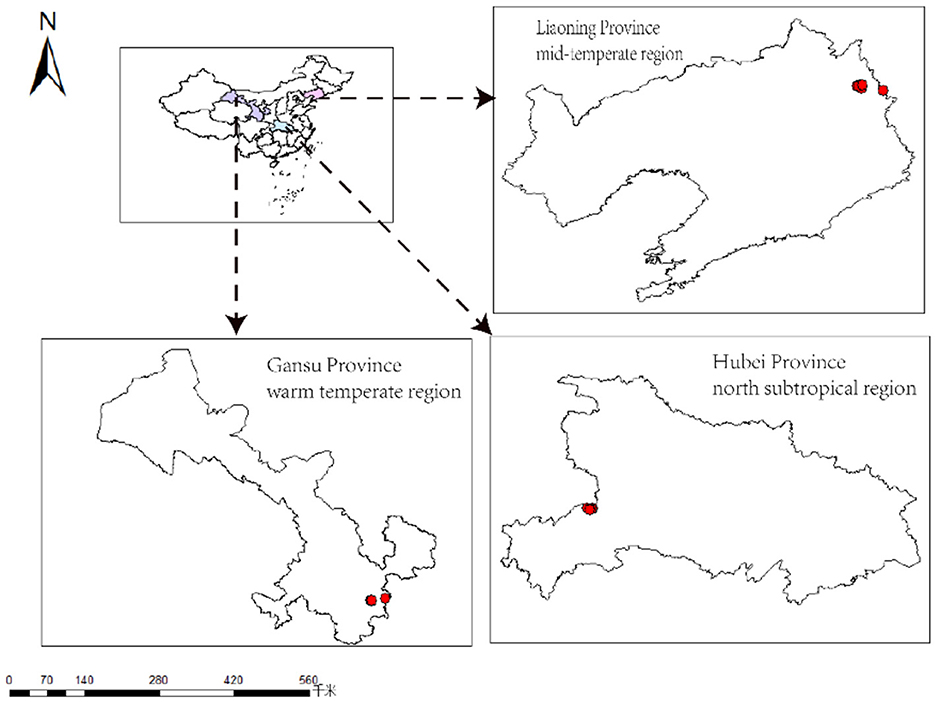
Study sites in three different climate regions in China are located in Liaoning province (mid-temperate region), Gansu province (warm temperate region), and Hubei province (north subtropical region) (Figure 1). The three zones have various precipitation and temperature regimes. Dagujia Forest Farm in Qingyuan County, Liaoning Province (42°22′-44°16′N, 124°47′-125°12′E), has a mid-temperate East Asian continental monsoon climate, with an average annual temperature of 5.4–7.2°C, an average annual precipitation of 400–800 mm, and a frost-free period of 125–150 days. The Xiaolong Mountain forest area is located in the southeast of Gansu Province (33°30′-34°49′N, 104°22′-106°43′E), which is located in the western Qinling Mountains and belongs to the warm temperate zone. Most of the regions belong to the warm temperate humid to medium-temperature subhumid continental monsoon climate, with an average annual temperature of 7–12°C, an average annual precipitation of 460–800 mm, and a frost-free period of 140–218 days. The forest area has a mild climate and superior natural conditions. The zonal soil in the north of the Qinling Mountains is gray-brown soil, and the south is yellow-brown soil; Hubei Jianshi County state-owned Changlinggang Forest Farm (30°47′-30°50′N, 110°00′-110°04′E) is in the eastern margin of Yunnan–Guizhou Plateau, Wushan Mountain range, with the elevation of 1,500–1,920 m. The area is a north subtropical monsoon mountain humid climate, with an average annual temperature of 11.0–16.0°C, a frost-free period of 200–300 days, and an average annual precipitation of 1,400–1,800 mm.
Data source
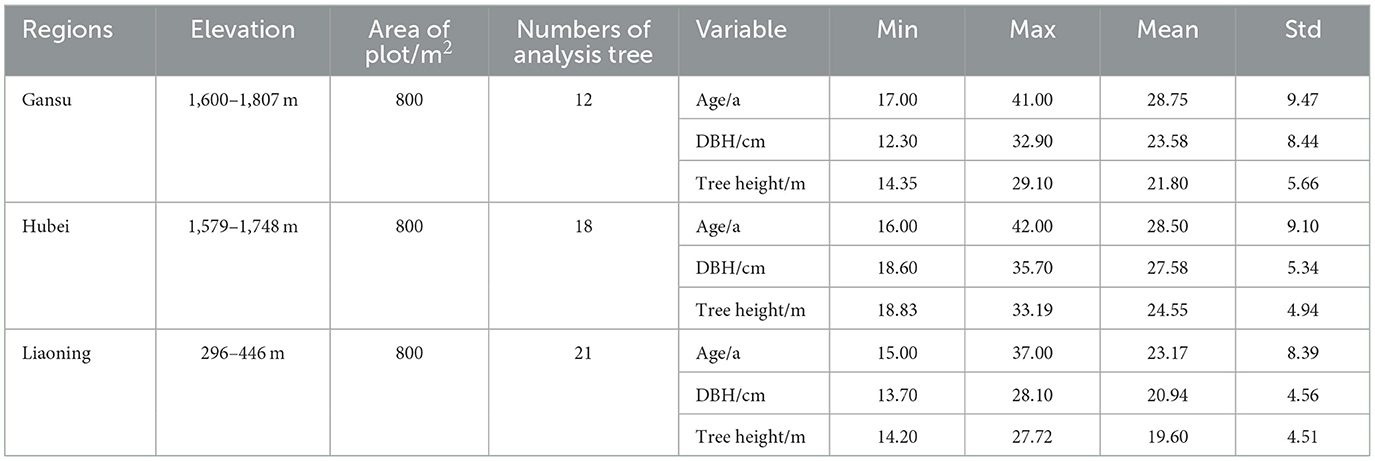
In three provinces, namely, Liaoning province, Gansu province, and Hubei province, 51 long-term positioning plantations of L. kaempferi were selected for this study. Each standard permanent sample plot was 28.3 × 28.3 m. The trees (DBH ≥ 5 cm) in the sample plot were investigated, and the tree species, slope, aspect, altitude, and other topography factors were recorded. DBH, tree height, height under branches, and crown width of each tree were investigated. The five largest trees (at DBH) of L. kaempferi were selected in the sample plot, from which one tree was selected for stem analysis based on the arithmetic mean of diameter surveyed between 2018 and 2020. In total, 12 stem analysis data were surveyed from Gansu Province, 18 stem analysis data were surveyed from Hubei Province, and 21 stem analysis data were surveyed from Liaoning Province. Trees free of past suppression, visible deformities such as forks, major stem injuries, and dead or broken tops were included in the sample. Disks were cut at 1-m intervals, including a disk at DBH from each felled tree. A unique code was assigned to each sampled tree and disk, and all disks were placed into a large breathable bag and transported to a laboratory for analysis. The major and minor axes (diameters) that were perpendicular to one another and passed through the pith were measured. The geometric mean radius (r) was calculated from each disk from the major (r1) and minor (r2) axes. The basic statistics of analysis tree survey factors are shown in Table 1.
Site index evaluation
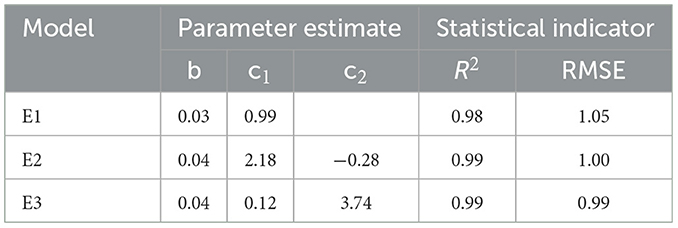
Function-based Richards model in forestry has been widely used, which can well-simulate the relationship between the growth of dominant trees and stand age (Socha, 2008). The basic Richards model expression is H = a(1–e−bt)c, where a is the horizontal asymptote as age approaches to infinity, representing the maximum height growth of trees under certain site conditions, b is a parameter related to both the rate of alienation and the rate of change of assimilation rate, and c is a parameter related to the decay rate of assimilation rate. Based on the Richards model, difference equations have better modeling effects and good biological basis. The study adopted difference equations to build the polymorphic site index equations (Duan and Zhang, 2004). Due to the fact that the growth rate of trees represented by parameter b is an inherent attribute of plants and is not closely related to the site, parameters a and c in the Richards equation are designated as site-dependent parameter (SDP). For the algebraic difference approach (ADA) model, assuming parameter a = x0, base Richards model converts to difference model Equation 1 (E1). For the generalized algebraic difference approach (GADA) model, assuming parameter a = ex0, c = c1 + c2X0/c = c1 + c2/X0, base Richards model converts to difference model Equation 2 (E2) and Equation 3 (E3) (Table 2). In the study, the stem analysis data are organized into a dual-tree height dual age form for fitting the three difference model. The nlsLM function is used in the minpack.lm package of R for model fitting.
Climate, topography, and soil data collection
To quantify the effects of various variables on the site index of L. kaempferi plantations, 14 climate variables, 24 soil variables, and five topography variables were collected from sample plots (Table 3). Climate factors in this study were obtained from ClimateAP (2019) (Wang et al., 2012), which extracts and downscales gridded (4 × 4 km) monthly climate data for the reference normal period and calculates monthly, seasonal, and annual climate variables in the Asia Pacific region between 1901 and 2100. Climatic data of each site were extracted from ClimateAP according to the sample site's latitude and longitude coordinates and altitude information. In this study, two groups of climate factors are considered, namely, temperature and precipitation variables. Temperature variables include mean annual temperature (MAT), mean warmest month temperature (MWMT), mean coldest month temperature (MCMT), temperature difference between MWMT and MCMT (TD), degree-days above 5°C (DD5), winter mean maximum temperature (Tmax_DJF), spring mean maximum temperature (Tmax_MAM), summer mean maximum temperature (Tmax_JJA), and autumn mean maximum temperature (Tmax_SON). Five precipitation variables, namely, mean annual precipitation (MAP), winter precipitation (PPT_DJF), spring precipitation (PPT_MAM), summer precipitation (PPT_JJA), and autumn precipitation (PPT_SON), were chosen as candidate variables for the site index model.
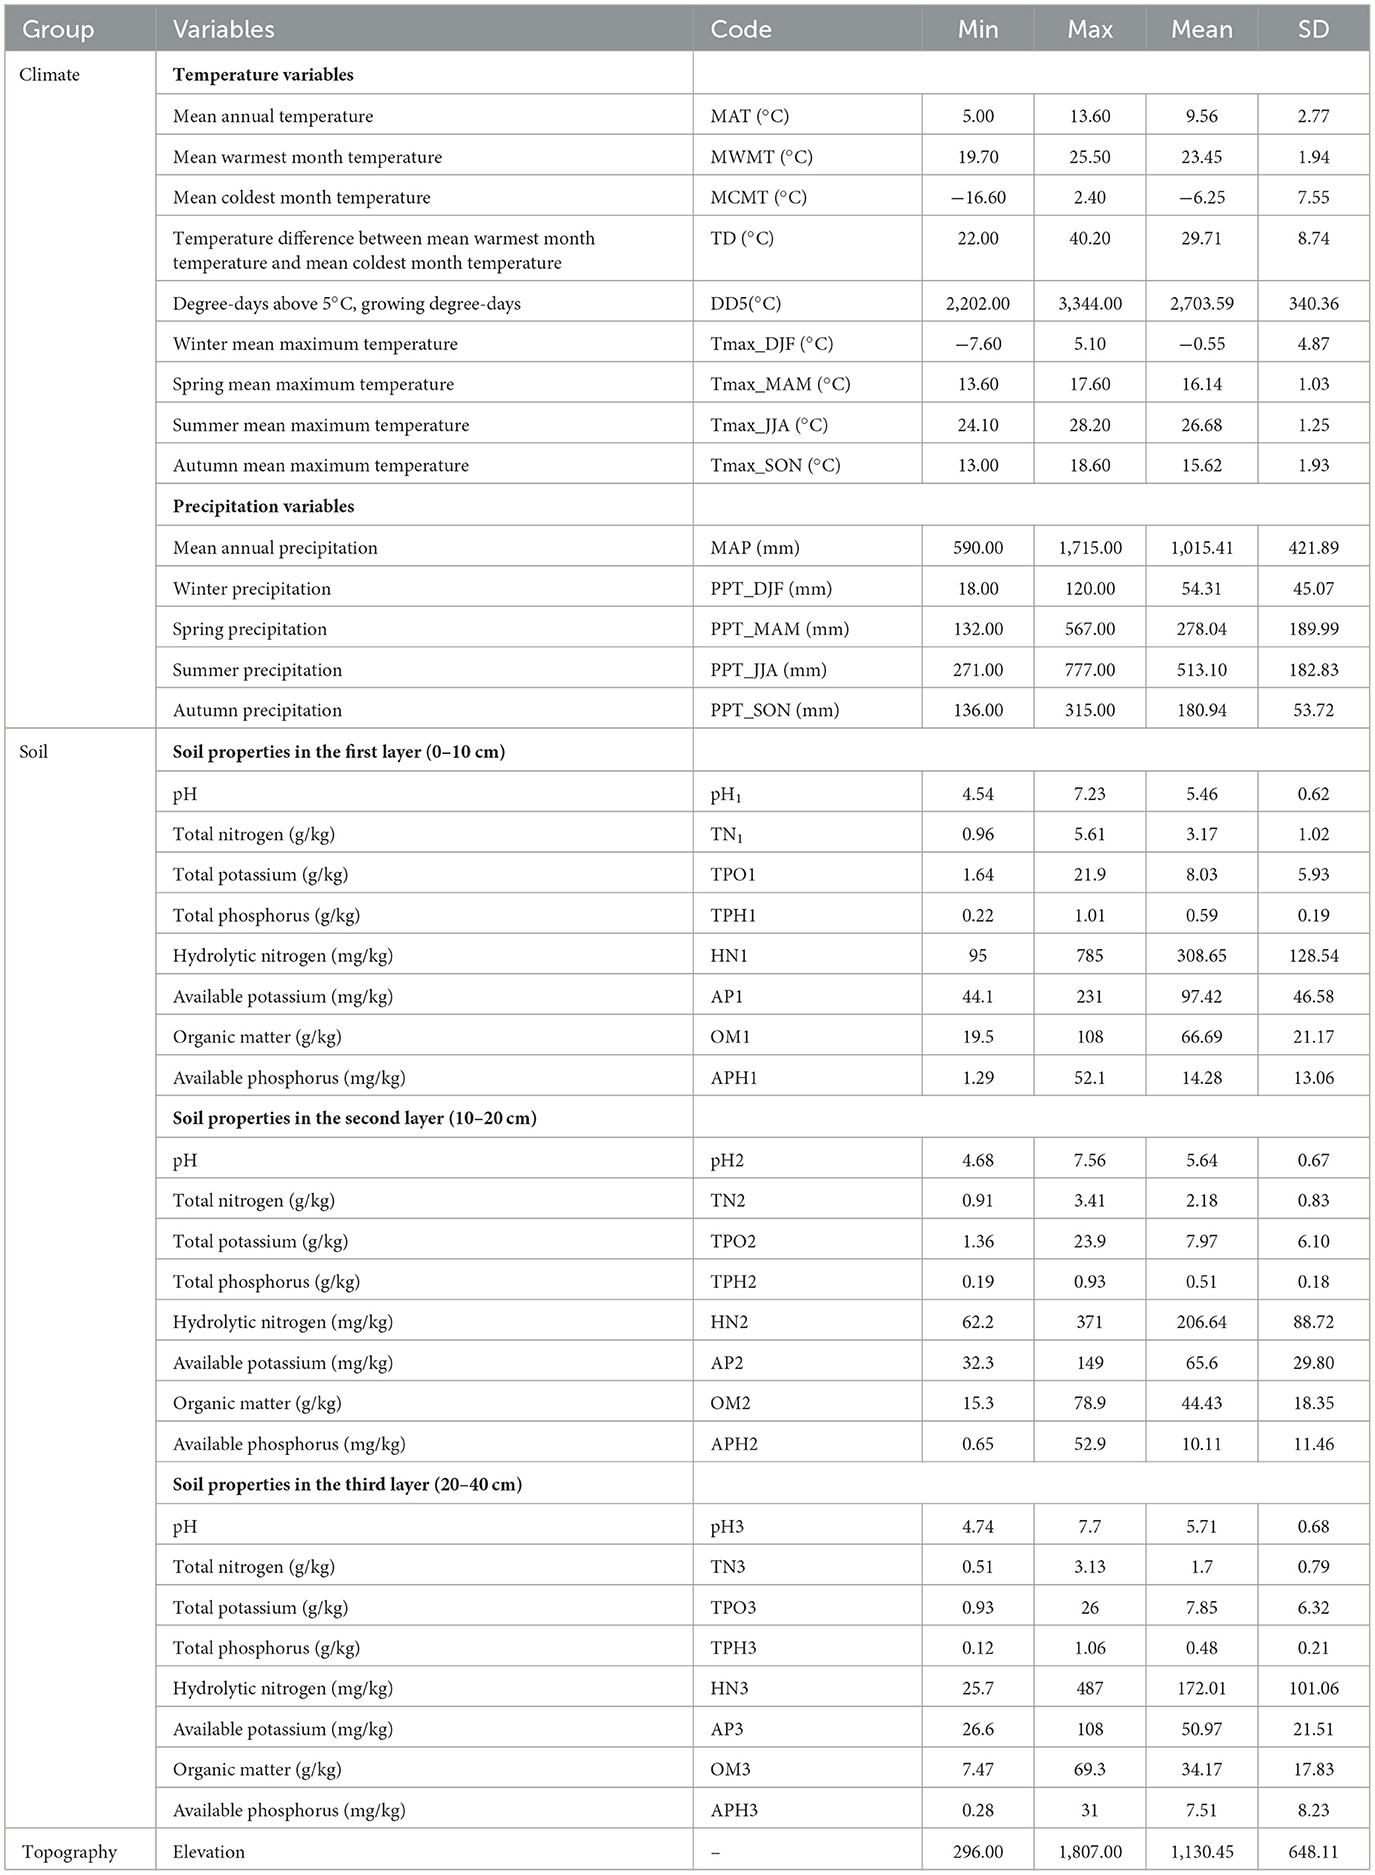
Table 3. Descriptive statistics of all categories of quantitative variables of L. kaempferi 51 long-term positioning plantations.
Soil properties were measured from L. kaempferi plots by digging soil profiles, and randomly selected samples collected in five locations were mixed in the plots to represent the average condition of the soil. Each soil profile was 1 m deep and divided into three soil depths: 0–10 cm, 10–20 cm, and 20–40 cm. Approximately 1 kg of soil was sampled at each depth, stored in bags, and transported to the laboratory. Soil samples were air-dried, ground, and analyzed for pH, total nitrogen, total potassium, total phosphorus, hydrolytic nitrogen, available potassium, organic matter, and available phosphorus. The pH value of the soil was measured by the electric potential method. Total N was determined using the Kjeldahl method and alkali-hydrolyzable N using the alkaline hydrolysis method. Total potassium was determined by acid dissolution flame photometry, and available potassium was determined by ammonium acetate extraction flame photometry. Total phosphorus was determined by molybdenum antimony resistance colorimetry, and available phosphorus was extracted by sodium bicarbonate leaching method. Soil organic matter was measured by the K2Cr2O7-H2SO4 oxidation external heating method (Venanzi et al., 2016).
Topography characteristics including elevation above sea level, slope, aspect, slope position, soil depth, and soil type were measured in the field. According to the Chinese forest site classification system, the topography factors in the sample plot are divided and assigned values (Table 4). Slope was divided into five groups: 1 = slope < 5°, 2 = slope is 5°-14°, 3 = slope is 15°-24°, 4 = slope is 25–34°, and 5 = slope ≥ 35°. Aspect was divided into four groups: 1 = sunny slope, 2 = semi-sunny slope, 3 = shady slope, and 4 = semi-shady slope. Slope position was divided into three groups: 1 = plots located in the uphill slope, 2 = plots located in the middle slope, and 3 = plots located in the downhill slope. Soil depth was divided into three groups: 1 = thin (< 40 cm), 2 = medium (40–79 cm), and 3 = thick (≥80 cm). The soil type across the regions was classified as follows: 1 = cinnamon soil, 2 = brown soil, and 3 = yellow-brown soil.
Random forest model
The study also attempts to use machine-learning algorithms (random forest model) to explore the complex interactions between site index and the potential driving factors. Random forest (RF) is a machine-learning algorithm that operates on the principle of decision trees (Torre-Tojal et al., 2022). It is a supervised learning regression algorithm that takes random samples of input data and builds decision trees to predict output variables. The selection of hyperparameters sets the maximum achievable accuracy of machine-learning models. The machine-learning algorithm involved cross-validation using a grid search approach to identify the best combination of hyperparameters, thus enhancing the model's performance and predictive accuracy. The algorithm combines multiple decision trees and requires two parameters: the number of regression trees based on a bootstrap sample of the training data (ntree) and the number of different predictors tested at each node (mtry) (Ding et al., 2022). It does this by randomly selecting a subset of features from the dataset and decision trees based on these features. During the testing phase, the algorithm takes the average of the predictions of all the trees to generate a final output. This helps to minimize errors caused by overfitting and reduce the variance of the model by averaging the predictions of multiple trees. Overall, the random forest regression model provides a robust and efficient way of building regression models with high accuracy. The RF models were accomplished using the “randomForest” package in the R software environment.
The data in this study were randomly divided into fitting data (80%) and testing data (20%). The coefficient of determination (R2), mean square error (MAE), and root mean square error (RMSE) values were calculated to evaluate the performance of the random forest model. The closer the coefficient of determination (R2) is to 1, the smaller the root mean square error (RMSE) and mean square error (MAE) are, and the better the model performance is. The calculation formula is as follows:
where yi is the measured value, ŷi is the estimated value, is the average measured value of the measured value, and n is the number of samples.
Results
The first phase of the calculation process was the estimation of site index by site index curve equations. Based on the data from the stem analysis, it was concluded that the determination coefficient (R2) and root mean square error (RMSE) of the ADA and GADA models constructed perform better with R2 reaching above 0.98 (Table 5) since the GADA model (E3) was also characterized by a smaller value of root mean square error (0.99) and applied in the further site index estimation.
After calculating the parameters of the GADA model (E3), a generalized difference site index model was obtained:
where
where h2 is the height of the tree at the predicted age t2, and h1 is the height of the tree at the known age t1. X0 and F are new parameters introduced.
A cluster of site index curves was generated with a base age of 20 years (Wang et al., 2015; Niu et al., 2020) and an exponential distance of 2 meters, with a site index range of 12–22 meters using the GADA model. From Figure 2, E3 models were found to meet the conditions of polymorphism and multiple horizontal asymptotes and perform residual analysis on the GADA model, and the residual values of the model are randomly distributed around y = 0.
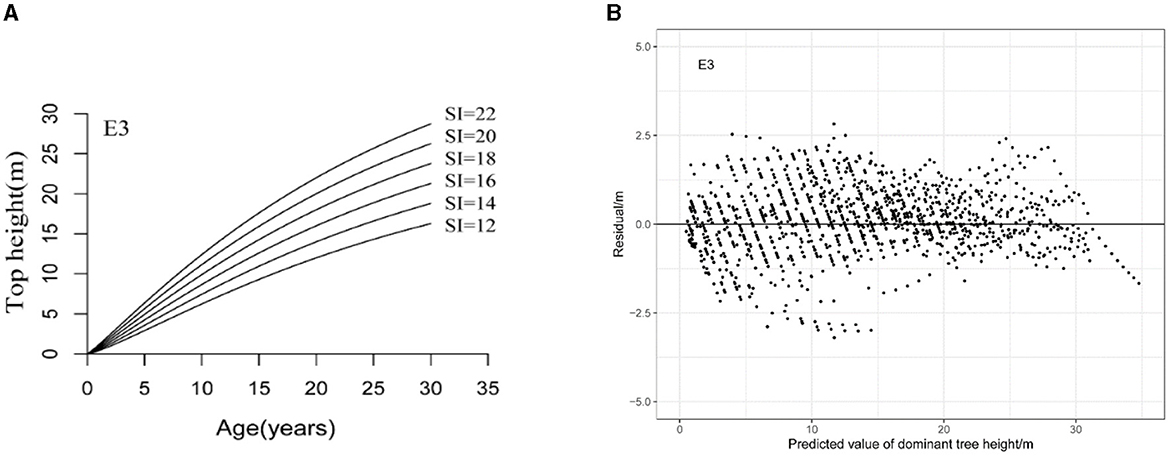
Figure 2. Site index curves generated with the GADA model (A) and residuals against predicted dominant tree height for the generalized difference site index models (B).
For each plot, the site index was calculated at a reference age of 20 years from the GADA model (E3). The site index of L. kaempferi varies among the three climatic regions, from 13.4 to 23.1 m (Figure 3). The difference in the site index of L. kaempferi among the three climate regions is significant. There are significant differences in site index among the three climatic regions, with Hubei region (SI = 20.51) having a significantly higher site index than the Liaoning region (SI = 18.76) and Gansu region (SI = 17.31).
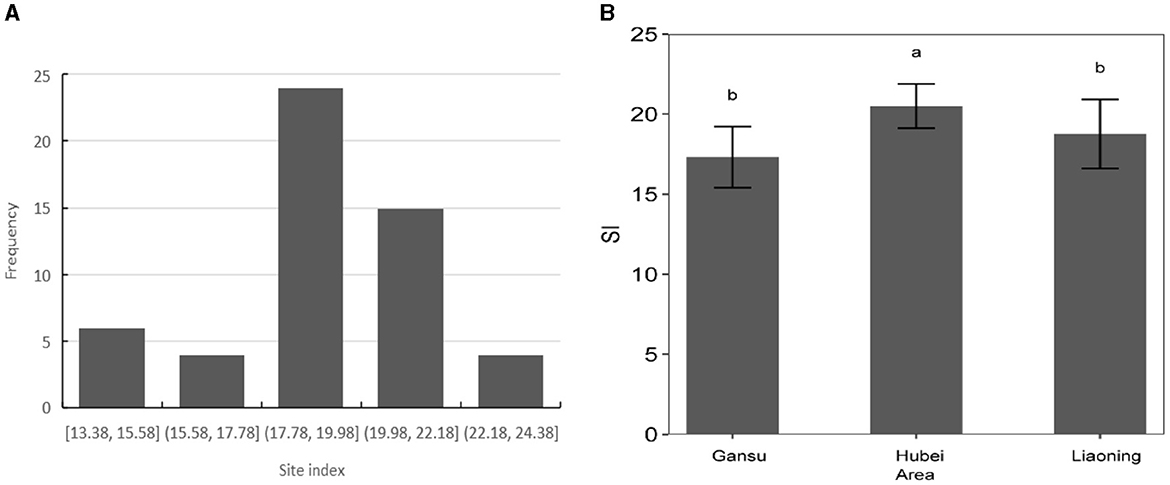
Figure 3. Site index calculated at reference age (A) and variation in L. kaempferi site index among different climatic regions (B). Data represent mean ± standard error of the mean (SEM). Different lowercase letters indicate significant differences (P < 0.05).
The effects of different values of mtry and ntree were tested in the study (Figure 4). The results indicated that when ntree = 100, the error within the random forest model is basically stable. As the mtry increases, the RMSE of the model significantly decreases and reaches its lowest point at mtry = 34. Considering the variations of RMSE and the error within the random forest model, the optimal settings for ntree and mtry were 100 and 34.

Figure 4. Changes in RMSE for each mtry (A) and ntree (B) of the random forest model, where RMSE is root mean square error, mtry represents the number of different predictors tested at each node, and ntree represents the number of regression trees.
The random forest model with the optimal settings (ntree = 100, mtry = 34) explained ~59.47% of the variation in site index, and MAE and RMSE for the RF model were 1.0212 and 1.3214, respectively. The results (R2 = 0.4881, MAE = 1.3851, and RMSE = 1.7679) were also observed for that on the test data. The relative importance of each variable according to the IncNodePurity of the RF model is illustrated in Figure 5. Among all potential 44 variables, available phosphorus, pH, DD5, and Tmax_MAM had significant effects on the site index (P < 0.05), while topography variables were not significant in the model and the relative importance of soil type and aspect based on the IncNodePurity is minimal, almost zero. Therefore, soil type and aspect are not reflected in Figure 5. The results suggest that the importance of soil variables had relatively larger effects on the site index than climate variables and topography variables. In addition, the importance of available phosphorus and pH varied with the soil depth, indicating that soil factors at different depths had different effects on the site index. The predicted values versus observed values of site index of fitting and testing data for L. kaempferi plantations are presented in Figure 6, respectively.
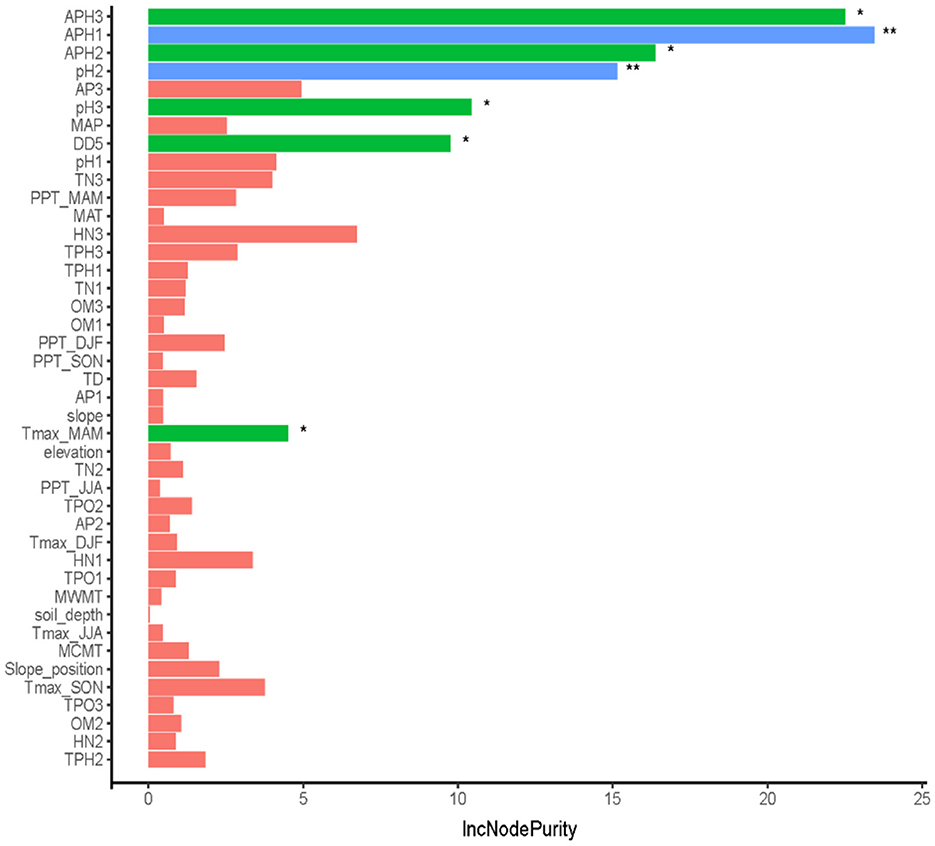
Figure 5. Relative importance of various factors based on the IncNodePurity of the random forest model, where the different colors mean the different relative importance of various factors. The blue color means the relative importance was significant at α = 0.01 level, the green color means the relative importance was significant at α = 0.05 level, and the red color means the importance was not significant. While ** and * indicated the relative importance was significant at α = 0.01 or α = 0.05 level, respectively.
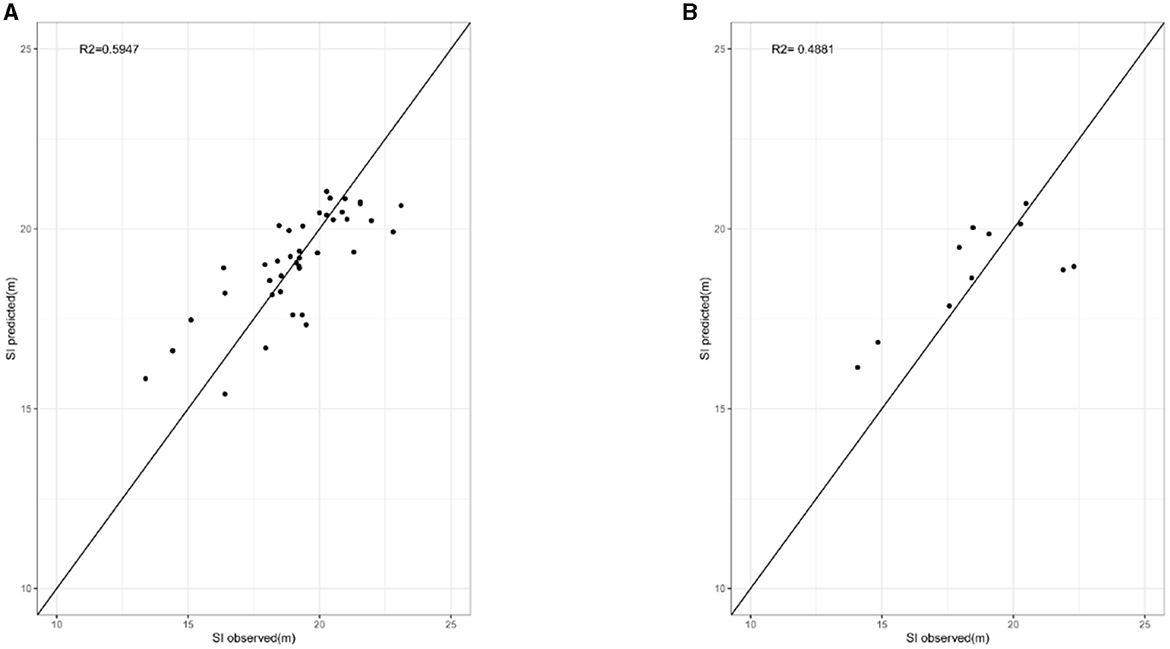
Figure 6. Predicted values vs. observed values of site index of fitting (A) and testing (B) data for L. kaempferi plantations, where the solid line is the 1:1 line.
The partial dependences of the seven relatively important variables for predicting site index are illustrated in Figure 7. The trajectories of available phosphorus in three soil layers all initially increased with the increases in the content and converged to maximum values at ~30 mg/kg of available phosphorus in the first soil layers, 30 mg/kg of available phosphorus in the second soil layers, and 20 mg/kg of available phosphorus in the third soil layers. The trajectories of pH2 and pH3 initially decreased with the increases in the variables. The curves of partial dependence on DD5 and Tmax_MAM were different from available phosphorus and exhibited inverted U-shaped forms. They indicate that a larger site index appears in DD5 between 2,600 and 3,000°C and Tmax_MAM ~15°C.
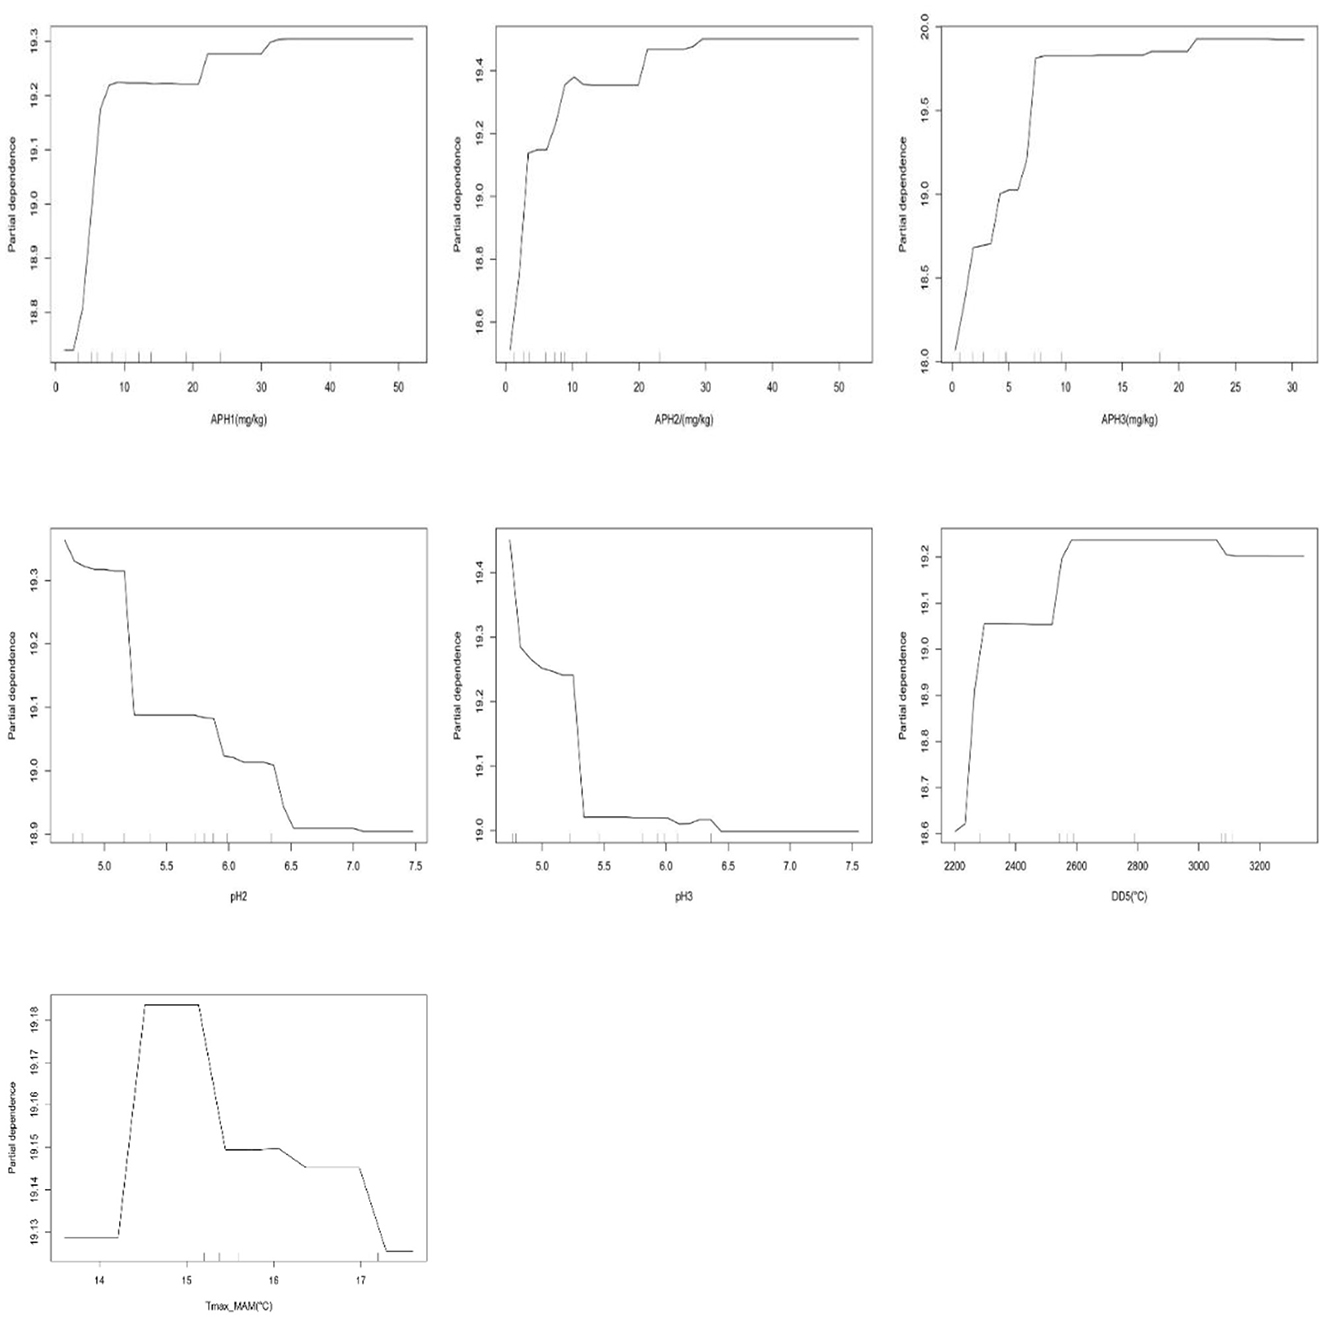
Figure 7. Partial dependence plots of seven predictor variables on the random forest model for predicting site index of L. kaempferi.
Discussion
Predictive site index model
Data used for developing site index equations are derived from height–age development patterns for individual trees obtained using stem analysis. Three equations have been considered to develop a site index system for L. kaempferi and the GADA E3 behaved better in the estimation than the algebraic difference approach. Based on the Richards growth equation, the difference method can be used to meet the conditions of polymorphism and multiple horizontal asymptotes with a good biological foundation. Martín-Benito et al. (2008) compared several site-dependent height–age models (generalized algebraic difference approach) of black pine in three regions and proved the reduced model with a single set of parameters for the three regions performed as well as the full model with different sets of parameters of whole region. Duan and Zhang (2004) proved that difference equations are more suitable for fitting large-scale data than basic equations and when the data are at the regional level, the fitting effect is significantly better. Cao and Sun (2017) developed six dynamic site index models for Chinese fir plantations based on permanent sample plots and stem analysis data and proved the model is accurate and effective for estimation.
In the study, we performed the random forest model to quantify the effects of 44 different accessible environmental variables including climate, topography, and soil chemical properties on the site index of L. kaempferi plantations and the proposed RF model explained ~59.47% of site index variations. The random forest model can provide the most precise predictions as they can accommodate complex functional forms and variable interactions, are relatively unaffected by the inclusion of many collinear variables in the model, and are particularly effective for datasets containing a large number of environmental predictors. We introduced many variables because we attempted to explain the variation of site index more accurately considering the response of plants to soil factors is different in the topsoil and deeper soil layers. Li et al. (2022) explored the relationship between the site index of Chinese fir site index with climatic and soil factors in three climatic regions in southern China and found the key soil factors varied among climatic regions and different soil depths. This means that the strength of correlation between site index and soil factors changes with the thickness of the soil layer. Therefore, we attempt to investigate the influence of soil chemical properties in different soil layers on the site index, and the results also indicate that the influence of nutrient content in different soil layers is different such as available phosphorus.
Many previous studies have established regression models to establish a quantitative link between site index and various ecological variables. These models constructed were based on the assumption that site index is a function of climate variables, topography variables, and soil variables. Klinka and Chen (2003) developed a site index model for three principal species in British Columbia based on climatic and edaphic conditions and the models accounted for 63–70% of the variation of site index. Grant et al. (2010) proved the available water storage capacity of the soil, rainfall, and altitude accounted for 62% of the variation in site index. For equations to be of practical value, they should be capable of explaining at least 50% of the variation in site index and should be based on a few easily measurable variables (Blyth and Macleod, 1981). Due to the rapid development of artificial intelligence, there has been growing interest in using different machine-learning algorithms that outperformed traditional parametric models (Strobl et al., 2009). Aertsen et al. (2011) evaluated five modeling techniques in the site index of three important species and found GAM outperformed all other techniques. Watt et al. (2021) found the two non-parametric models, namely, eXtreme Gradient Boosting (XGBoost) and random forest, delivered the most accurate predictions for Site Index and 300 Index, significantly surpassing both parametric and geospatial models. Shen et al. (2015) developed a climate-sensitive site index model of Larix olgensis using the generalized additive model because GAM does not assume any prior relationships about the underlying data and enables the visualization of the additive impact of each predictor variable on the dependent variables. Weiskittel et al. (2011) used random forest to predict SI and GPP from climate and repeated the RF regression procedure, eliminating the least influential variable at each stage until only two predictors remained.
Effects of soil factors on the site index
Our results showed that site index of L. kaempferi varied significantly among different climatic regions. Hubei (SI = 20.51) has a significantly higher site index than the Liaoning region (SI = 18.76) and Gansu region (SI = 17.31), which reflects L. kaempferi can be more suitable for growing in warm and humid places.
Site index model based on accessible various ecological variables can help in silvicultural and forest management when there is a need for indirect estimation in some unforested zones. In the study, available phosphorus, pH, DD5, and Tmax_MAM had significant effects on the site index (P < 0.05) and the importance of soil variables had relatively larger effects on the site index than climate variables and topography variables, confirming the importance of including soil chemical variables in the SI model (Yang and Meng, 2022). The trajectories of available phosphorus in three soil layers all initially increased with the increases in these variables but then converged to their maximum values at ~30 mg/kg of available phosphorus in the first soil layers, 30 mg/kg of available phosphorus in the second soil layers, and 20 mg/kg of available phosphorus in the third soil layers. The positive significance of available phosphorus was attributed to the fact that these elements promote the growth of L. kaempferi. Several previous research studies have indicated that the growth of trees is mainly constrained by the availability of phosphorus and that augmenting the use of P fertilizer can substantially enhance the growth of stands and the productivity of the site (Bai et al., 2020). Li (2011) performed a partial correlation analysis between site index and soil nutrients using age as a control variable of L. kaempferi and site index is positively correlated with alkali-hydrolyzable N, available P, available K, total N, total P, total K, and organic matter. Li et al. (2022) explored the relationship between site index of Chinese fir site index with climatic and soil factors at three climatic regions in southern China and found the key soil factor available P that affected site index varied among climatic regions at different soil depth. In addition, a negative correlation was detected between the three regions' site index and total potassium in all soil layers. Farrelly et al. (2011) examined the correlation between soil chemical variables and site index and showed the amounts of available K, Mg, and P were all significantly negatively correlated with site index, with the strongest association found with available K.
The pH, another important soil chemical property, exhibited a negative correlation with the SI, which aligns with the slightly acidic soil conditions prevalent in L. kaempferi forests. Li (2011) performed partial correlation analysis between site index and soil nutrients, using multiple linear regression method and found site index negatively correlated with pH. Farrelly et al. (2011) examined the correlation between soil chemical variables and site index, and pH was positively correlated with site index of Sitka spruce. Bergès et al. (2005) used stepwise multiple regressions to explain the variance in site index based on different factors and found the relationship between SI100 and pH was parabolic, with an optimum value of ~50% for S/T. Seynave et al. (2005) noticed that Picea abies growth depends on both acidity and nitrogen availability, and lower productivity is the site with high pH and high C/N ratio. In the study, the inclusion of soil chemical variables in the model led to a substantial decrease in the significance of the topography variables, indicating that factors related to the soil such as its pH and elemental composition were more contributory than the topography.
Effects of climate variables on the site index
Climate factors represent the macroenvironment that affects the growth of the forest and can directly affect physiological processes such as photosynthesis and transpiration of plants, which in turn will affect the change of site index. DD5 and Tmax_MAM are the key climate factors responsible for the variation in site index among different regions. In this study, the curves of partial dependence on DD5 and Tmax_MAM exhibited inverted U-shaped forms, indicating that a larger site index could be observed when the DD5 was between 2,600 and 3,000°C and Tmax_MAM was ~15°C. Monserud et al. (2006) showed the strongest predictors of site index are all measures of heat: the Julian date when GDD5 reaches 100 (D100), growing degree-days > 5°C (GDD5), and July mean temperature (MTWM). Hamel et al. (2004) captured the variability in the productivity of black spruce and Jack pine stands and also found that the site index increased with increasing degree-days estimated with BIOSIM for black spruce and Jack pine. Although other temperature variables and precipitation variables are correlated with site index, they are not significant in the random forest model perhaps because they are highly intercorrelated. In a related study covering site index, Fries et al. (1998) also found temperature variables were strongly correlated with each other, and combinations of them did not increase predictive power. Sharma (2022) introduced two groups of climate variables (temperature and precipitation) to the model sequentially from each group, mean diurnal temperature range (MDTR) turned out to produce the best fit, and other precipitation and site variables were not significant for either species. Nevertheless, our result showed that the site index was not closely correlated with various precipitation factors (MAP, PPT_DJF, PPT_MAM, PPT_JJA, and PPT_SON), indicating that the response of Chinese fir plantations to these precipitation-related factors was low in the study area.
Limitations in the study
Prior research concentrated on the impact of stand age, topography, and soil physical characteristics on the SI but do not account for the collaborative impact of climatic situations and soil chemistry. We introduced the random forest algorithm to enhance the accuracy of SI prediction. Nonetheless, this study has certain limitations. First, in total, more than 40% of SI variance remains unexplained. Additional research is necessary to elucidate the primary factors behind the unexplained deviation of site index resulting from ecological variables, particularly genetic variability, age-related effects, and silvicultural practices. In addition, the study only considered the chemical properties of the soil and did not take into account the physical properties of the soil (the capillary porosity, maximum moisture capacity, bulk density, etc.), which are also important for site index (Ritchie and Hamann, 2008; Grigal, 2009). In addition, many studies show that soil C/N ratio is reportedly an important index of N-use efficiency and a significant predictor of site index. The increase in other variables will enhance the fitting effect of the random forest model. Second, the proposed RF model explained ~59.47% of site index variations maybe because the explanatory power of the machine-learning models could have been impacted by the correlation among the variables. In addition, to further confirm the accuracy and applicability of the machine-learning approach, we plan to carry out national-scale studies in the future, seeking additional research samples and stem analysis data.
Application for forest management
The models of site index constructed in the study based on ecological variables may help in future management, with consideration of local growth conditions. The presented relationships between L. kaempferi and the easily obtained climate, topography variables, and soil variables may be applied in the estimation of the potential productivity of L. kaempferi, particularly for non-forest areas, in which the use of the traditional site index estimation method is even difficult.
Conclusion
The present study aims to quantify the impact of climate, topography, and soil factors on the site index of L. kaempferi plantations in three climatic regions in China. The proposed RF model explained ~59.47% of site index variations. Among many environmental variables, available phosphorus, pH, DD5, and Tmax_MAM had significant effects on the site index (P < 0.05). The trajectories of available phosphorus in three soil layers all initially increased with the increases in the content and converged to maximum values at ~30 mg/kg of available phosphorus in the first soil layers, 30 mg/kg of available phosphorus in the second soil layers, and 20 mg/kg of available phosphorus in the third soil layers. A larger site index appears in DD5 between 2,600 and 3,000°C and Tmax_MAM ~15°C. L. kaempferi site index can be reliably predicted by the ecological variables and improved the applicability among different regions.
Data availability statement
The raw data supporting the conclusions of this article will be made available by the authors, without undue reservation.
Author contributions
HW: Writing – original draft, Formal analysis, Data curation. DC: Writing – review & editing. CW: Writing – review & editing, Software, Data curation. XS: Writing – review & editing, Methodology, Conceptualization. SZ: Writing – review & editing, Supervision, Resources, Funding acquisition.
Funding
The author(s) declare financial support was received for the research, authorship, and/or publication of this article. Site collection and field data collection was funded by the National Key Research and Development Program of China (2023YFD2200801). Lab work was funded by the Fundamental Research Funds for the Central Non-profit Research Institution of CAF (CAFYBB2022ZC001, LYSZX202002) and the National Key Research and Development Program of China (2022YFD2200103).
Conflict of interest
The authors declare that the research was conducted in the absence of any commercial or financial relationships that could be construed as a potential conflict of interest.
Publisher's note
All claims expressed in this article are solely those of the authors and do not necessarily represent those of their affiliated organizations, or those of the publisher, the editors and the reviewers. Any product that may be evaluated in this article, or claim that may be made by its manufacturer, is not guaranteed or endorsed by the publisher.
References
Aertsen, W., Kint, V., Van Orshoven, J., and Muys, B. (2011). Evaluation of modelling techniques for forest site productivity prediction in contrasting ecoregions using stochastic multicriteria acceptability analysis (SMAA). Environ. Modell. Softw. 26, 929–937. doi: 10.1016/j.envsoft.2011.01.003
Aertsen, W., Kint, V., Van Orshoven, J., Özkan, K., and Muys, B. (2010). Comparison and ranking of different modelling techniques for prediction of site index in Mediterranean mountain forests. Ecol. Modell. 221, 1119–1130. doi: 10.1016/j.ecolmodel.2010.01.007
Albayrak, R. F., Post, C. J., Mikhailova, E. A., Schlautman, M. A., Zurqani, H. A., Green, A. R., et al. (2020). Age and site index evaluations for loblolly pine in urban environments. Urban. For. Urban. Green. 47:126517. doi: 10.1016/j.ufug.2019.126517
Bai, Y., Chen, S., Shi, S., Qi, M., Liu, X., Wang, H., et al. (2020). Effects of different management approaches on the stoichiometric characteristics of soil C, N, and P in a mature Chinese fir plantation. Sci. Total Environ. 723:137868. doi: 10.1016/j.scitotenv.2020.137868
Bergès, L., Chevalier, R., Dumas, Y., Franc, A., and Gilbert, J.-M. (2005). Sessile oak (Quercus petraea Liebl.) site index variations in relation to climate, topography and soil in even-aged high-forest stands in northern France. Ann. For. Sci. 62, 391–402. doi: 10.1051/forest:2005035
Blyth, J. F., and Macleod, D. A. (1981). Sitka spruce (Picea sitchensis) in North-East Scotland II. Yield prediction by regression analysis. Forestry 54, 63–73. doi: 10.1093/forestry/54.1.63
Bravo-Oviedo, A., Gallardo-Andres, C., del Río, M., and Montero, G. (2010). Regional changes of Pinus pinaster site index in Spain using a climate-based dominant height model. Can. J. For. Res. 40, 2036–2048. doi: 10.1139/X10-143
Bravo-Oviedo, A., Roig, S., Bravo Oviedo, F., Montero, G., and del-Rio, M. (2011). Environmental variability and its relationship to site index in Mediterranean maritine pine. For. Syst. 20, 50–64. doi: 10.5424/fs/2011201-9106
Calegario, N., Daniels, R. F., Maestri, R., and Neiva, R. (2005). Modeling dominant height growth based on nonlinear mixed-effects model: a clonal Eucalyptus plantation case study. For. Ecol. Manage. 204, 11–21. doi: 10.1016/j.foreco.2004.07.051
Cao, Y. S., and Sun, Y. J. (2017). Generalized algebraic difference site index model for Chinese fir plantation. J. Nanjing. For. Univ. 60, 79–84 (in Chinese). doi: 10.3969/j.issn.1000-2006.201611054
Curt, T., Bouchaud, M., and Agrech, G. (2001). Predicting site index of Douglas-Fir plantations from ecological variables in the Massif Central area of France. For. Ecol. Manage. 149, 61–74. doi: 10.1016/S0378-1127(00)00545-4
Ding, L., Li, Z., Shen, B., Wang, X., Xu, D., Yan, R., et al. (2022). Spatial patterns and driving factors of aboveground and belowground biomass over the eastern Eurasian steppe. Sci. Total Environ. 803:149700. doi: 10.1016/j.scitotenv.2021.149700
Duan, A. G., and Zhang, J. G. (2004). Modeling of dominant height growth and building of polymorphic site index equations of chinese fir plantation. Sci. Silvae. Sin. 40, 13–19 (in Chinese). doi: 10.3321/j.issn:1001-7488.2004.06.003
Duan, G., Lei, X., Zhang, X., and Liu, X. (2022). Site index modeling of Larch using a mixed-effects model across regional site types in Northern China. Forests 13:815. doi: 10.3390/f13050815
Ercanli, I., Gunlu, A., Altun, L., and Baskent, E. Z. (2008). Relationship between site index of oriental spruce [Picea orientalis (L.) Link] and ecological variables in Maçka, Turkey. Scand. J. For. Res. 23, 319–329. doi: 10.1080/02827580802249100
Farrelly, N., Ní Dhubháin, Á., and Nieuwenhuis, M. (2011). Site index of Sitka spruce (Picea sitchensis) in relation to different measures of site quality in Ireland. Can. J. For. Res. 41, 265–278. doi: 10.1139/X10-203
Fonweban, J. N., Tchanou, Z., and Defo, M. (1995). Site index equations for Pinus kesiya in Cameroon. J. Trop. For. Sci. 8, 24–32.
Fries, A., Ruotsalainen, S., and Lindgren, D. (1998). Effects of temperature on the site productivity of Pinus sylvestris and lodgepole pine in Finland and Sweden. Scand. J. For. Res.13, 128–140. doi: 10.1080/02827589809382969
Gavilán-Acuña, G., Olmedo, G. F., Mena-Quijada, P., Guevara, M., Barría-Knopf, B., and Watt, M. S. (2021). Reducing the uncertainty of radiata pine site index maps using an spatial ensemble of machine learning models. Forests 12:77. doi: 10.3390/f12010077
Grant, J. C., Nichols, J. D., Smith, R. G. B., Brennan, P., and Vanclay, J. K. (2010). Site index prediction of Eucalyptus dunnii Maiden plantations with soil and site parameters in sub-tropical eastern Australia. Aust. For. 73, 234–245. doi: 10.1080/00049158.2010.10676334
Grigal, D. F. (2009). A soil-based aspen productivity index for Minnesota. For. Ecol. Manage. 257, 1465–1473. doi: 10.1016/j.foreco.2008.12.022
Gülsoy, S., and Cinar, T. (2019). The relationships between environmental factors and site index of Anatolian black pine (Pinus nigra Arn. subsp. pallasiana (Lamb.) Holmboe) stands in Demirci (Manisa) district, Turkey. Appl. Ecol. Env. Res. 17, 1235–1246. doi: 10.15666/aeer/1701_12351246
Hamel, B. T., Bélanger, N., and Paré, D. (2004). Productivity of black spruce and Jack pine stands in Quebec as related to climate, site biological features and soil properties. For. Ecol. Manage. 191, 239–251. doi: 10.1016/j.foreco.2003.12.004
Hemingway, H., and Kimsey, M. (2020). Estimating forest productivity using site characteristics, multipoint measures, and a nonparametric approach. For. Sci. 66, 645–652. doi: 10.1093/forsci/fxaa023
Hoshi, H. (2004). Forest Tree Genetic Resources Conservation Stands of Japanese Larch (Larix kaempferi (Lamb.) Carr.). Forest Tree Breeding Center, Japan.
Jose-Maldia, L. S., Uchida, K., and Tomaru, N. (2009). Mitochondrial DNA variation in natural populations of Japanese larch (Larix kaempferi). Silvae Genet. 58, 234–241. doi: 10.1515/sg-2009-0030
Klinka, K., and Chen, H. Y. H. (2003). Potential productivity of three interior subalpine forest tree species in British Columbia. For. Ecol. Manage. 175, 521–530. doi: 10.1016/S0378-1127(02)00184-6
Lee, D., and Choi, J. (2022). Development of variable-density yield models with site index estimation for Korean Pines and Japanese Larch. Forests 13:1150. doi: 10.3390/f13071150
Li, C., and Zhang, H. (2010). Modeling dominant height for Chinese fir plantation using a nonlinear mixed-effects modeling approach. Sci. Silvae Sin. 46, 89–95 (in Chinese). doi: 10.11707/j.1001-7488.20100314
Li, X., Duan, A., and Zhang, J. (2022). Site index for Chinese fir plantations varies with climatic and soil factors in southern China. J. For. Res. 33, 1765–1780. doi: 10.1007/s11676-022-01469-2
Li, Z. G. (2011). Site Classification and Evaluation of Larix kaempferi (Lamb.)Carr.in Northern Sub-tropical Medium High Area (Master's thesis). Chinese Academy of Forestry, China.
Lindgren, D., Ying, C. C., Elfving, B., and Lindgren, K. (1994). Site index variation with latitude and altitude in IUFRO Pinus contorta provenance experiments in western Canada and northern Sweden. Scand. J. For. Res. 9, 270–274. doi: 10.1080/02827589409382840
Mäkinen, H., Yue, C., and Kohnle, U. (2017). Site index changes of Scots pine, Norway spruce and larch stands in southern and central Finland. Agric. For. Meteorol. 237, 95–104. doi: 10.1016/j.agrformet.2017.01.017
Martín-Benito, D., Gea-Izquierdo, G., del Río, M., and Cañellas, I. (2008). Long-term trends in dominant-height growth of black pine using dynamic models. For. Ecol. Manage. 256, 1230–1238. doi: 10.1016/j.foreco.2008.06.024
Mensah, A. A., Holmstrom, E., Nystrom, K., and Nilsson, U. (2022). Modelling potential yield capacity in conifers using Swedish long-term experiments. For. Ecol. Manage. 512:120162. doi: 10.1016/j.foreco.2022.120162
Moisen, G. G., and Frescino, T. S. (2002). Comparing five modelling techniques for predicting forest characteristics. Ecol. Model. 157, 209–225. doi: 10.1016/S0304-3800(02)00197-7
Monserud, R. A., Huang, S., and Yang, Y. (2006). Predicting lodgepole pine site index from climatic parameters in Alberta. For. Chron. 82, 562–571. doi: 10.5558/tfc82562-4
Niu, Y. L., Dong, L. H., and Li, F. R. (2020). Site index model for Larix olgensis plantation based on generalized algebraic difference approach derivation. J. Beijing For. Univ. 42, 9–18 (in Chinese). doi: 10.12171/j.1000-1522.20190036
Oddi, F. J., Casas, C., Goldenberg, M. G., Langlois, J. P., Landesmann, J. B., Gowda, J. H., et al. (2022). Modeling potential site productivity for Austrocedrus chilensis trees in northern Patagonia (Argentina). For. Ecol. Manage. 524:120525. doi: 10.1016/j.foreco.2022.120525
Özel, C., Güner, S. T., Türkkan, M., Akgül, S., and Sentürk, Ö. (2021). Modelling the site index of Pinus pinaster plantations in Turkey using ecological variables. J. For. Res. 32, 589–598. doi: 10.1007/s11676-020-01113-x
Paulo, J. A., Palma, J. H., Gomes, A. A., Faias, S. P., Tomé, J., and Tomé, M. O. (2015). Predicting site index from climate and soil variables for cork oak (Quercus suber L.) stands in Portugal. New. For. 46, 293–307. doi: 10.1007/s11056-014-9462-4
Ritchie, M. W., and Hamann, J. D. (2008). Individual-tree height-, diameter-and crown-width increment equations for young Douglas-fir plantations. New For. 35, 173–186. doi: 10.1007/s11056-007-9070-7
Sabatia, C. O., and Burkhart, H. E. (2014). Predicting site index of plantation loblolly pine from biophysical variables. For. Ecol. Manage. 326, 142–156. doi: 10.1016/j.foreco.2014.04.019
Seynave, I., Gégout, J.-C., Hervé, J.-C., Dhôte, J.-F., Drapier, J., Bruno, E., et al. (2005). Picea abies site index prediction by environmental factors and understorey vegetation: a two-scale approach based on survey databases. Can. J. For. Res. 35, 1669–1678. doi: 10.1139/x05-088
Sharma, M. (2022). Climate effects on black spruce and trembling aspen productivity in natural origin mixed stands. Forests 13:430. doi: 10.3390/f13030430
Shen, C., Lei, X., Liu, H., Wang, L., and Liang, W. (2015). Potential impacts of regional climate change on site productivity of Larix olgensis plantations in northeast China. iForest 8:642. doi: 10.3832/ifor1203-007
Shen, J. B., Lei, X. D., Lei, Y. C., and Li, Y. (2018). Comparison between site index and site form for site quality evaluation of Larix olgensis plantation. J. Beijing For. Univ. 40, 1–8 (in Chinese). doi: 10.13332/j.1000-1522.20170400
Socha, J. (2008). Effect of topography and geology on the site index of Picea abies in the West Carpathian, Poland. Scand. J. For. Res. 23, 203–213. doi: 10.1080/02827580802037901
Strobl, C., Malley, J., and Tutz, G. (2009). An introduction to recursive partitioning: rationale, application, and characteristics of classification and regression trees, bagging, and random forests. Psychol. Methods 14:323. doi: 10.1037/a0016973
Subedi, S., and Fox, T. R. (2016). Predicting loblolly pine site index from soil properties using partial least-squares regression. For. Sci. 62, 449–456. doi: 10.5849/forsci.15-127
Torre-Tojal, L., Bastarrika, A., Boyano, A., Lopez-Guede, J. M., and Graña, M. (2022). Aboveground biomass estimation from LiDAR data using random forest algorithms. J. Comput. Sci. 58:101517. doi: 10.1016/j.jocs.2021.101517
Venanzi, R., Picchio, R., and Piovesan, G. (2016). Silvicultural and logging impact on soil characteristics in Chestnut (Castanea sativa Mill.) Mediterranean coppice. Ecol. Eng. 92, 82–89. doi: 10.1016/j.ecoleng.2016.03.034
Wang, D.-Z., Zhang, D.-Y., Jiang, F.-L., Bai, Y., Zhang, Z.-D., and Huang, X.-R. (2015). A site index model for Larix principis-rupprechtii plantation in Saihanba, north China. Chin. J. Appl. Ecol. 26, 3413–3420 (in Chinese). doi: 10.13287/j.1001-9332.20150915.003
Wang, G., and Klinka, K. (1996). Use of synoptic variables in predicting white spruce site index. For. Ecol. Manage. 80, 95–105. doi: 10.1016/0378-1127(95)03630-X
Wang, G. G., Huang, S., Monserud, R. A., and Klos, R. J. (2004). Lodgepole pine site index in relation to synoptic measures of climate, soil moisture and soil nutrients. For. Chron. 80, 678–686. doi: 10.5558/tfc80678-6
Wang, T., Hamann, A., Spittlehouse, D. L., and Murdock, T. Q. (2012). ClimateWNA—high-resolution spatial climate data for western North America. J. Appl. Meteorol. Climatol. 51, 16–29. doi: 10.1175/JAMC-D-11-043.1
Wang, Y., LeMay, V. M., and Baker, T. G. (2007). Modelling and prediction of dominant height and site index of Eucalyptus globulus plantations using a nonlinear mixed-effects model approach. Can. J. For. Res. 37, 1390–1403. doi: 10.1139/X06-282
Watt, M. S., Palmer, D. J., Leonardo, E. M. C., and Bombrun, M. (2021). Use of advanced modelling methods to estimate radiata pine productivity indices. For. Ecol. Manage. 479:118557. doi: 10.1016/j.foreco.2020.118557
Weiskittel, A. R., Crookston, N. L., and Radtke, P. J. (2011). Linking climate, gross primary productivity, and site index across forests of the western United States. Can. J. For. Res. 41, 1710–1721. doi: 10.1139/x11-086
Yang, R., and Meng, J. (2022). Using advanced machine-learning algorithms to estimate the site index of masson pine plantations. Forests 13:1976. doi: 10.3390/f13121976
Keywords: Larix kaempferi, site index, environmental variables, climate, topography
Citation: Wei H, Chen D, Wu C, Sun X and Zhang S (2024) Soil available phosphorus and pH are key factors affecting the site index of Larix kaempferi plantations in China. Front. For. Glob. Change 7:1456882. doi: 10.3389/ffgc.2024.1456882
Received: 29 June 2024; Accepted: 18 September 2024;
Published: 09 October 2024.
Edited by:
Jinghui Meng, Beijing Forestry University, ChinaReviewed by:
Yifu Wang, Beijing Forestry University, ChinaYixiang Wang, Zhejiang Agriculture and Forestry University, China
Copyright © 2024 Wei, Chen, Wu, Sun and Zhang. This is an open-access article distributed under the terms of the Creative Commons Attribution License (CC BY). The use, distribution or reproduction in other forums is permitted, provided the original author(s) and the copyright owner(s) are credited and that the original publication in this journal is cited, in accordance with accepted academic practice. No use, distribution or reproduction is permitted which does not comply with these terms.
*Correspondence: Xiaomei Sun, eG1zdW5AY2FmLmFjLmNu; Shougong Zhang, bGFyY2hfcmlmQDE2My5jb20=
†These authors have contributed equally to this work and share first authorship
 Hongyang Wei
 Dongsheng Chen†