 Yanfei Cai
 Ting Jia
 Wanlong Zhu
- 1Key Laboratory of Ecological Adaptive Evolution and Conservation on Animals-Plants in Southwest Mountain Ecosystem of Yunnan Province Higher Institutes College, Yunnan Normal University, Kunming, China
- 2School of Life Sciences, Yunnan Normal University, Kunming, China
- 3Key Laboratory of Yunnan Province for Biomass Energy and Environment Biotechnology, Yunnan Normal University, Kunming, China
Eothenomys miletus is an endemic species that inhabits the Hengduan Mountain regions (HDR) and serves as one of the primary hosts for plague and hantaviruses. While the physiological characteristics of E. miletus have been extensively studied, the molecular aspects, particularly the migration direction of E. miletus, remain unclear. In the present study, we utilized genomic data to investigate the migration direction of four populations: Ailaoshan (ALS), Jiangchuan (JC), Lijiang (LJ), and Deqin (DQ), which are distributed from south to north within the HDR. Our results indicated that the ALS population is positioned at the base of the phylogenetic tree, and admixture analysis revealed that the ALS population is more closely related to the JC and DQ populations. Integrate the molecular genetic structure, fossil records of E. miletus as well as the results of our research, we inferred that the migration direction of E. miletus may have been from south to north, suggesting that the DQ and JC populations may have originated from the migration of ALS. However, the migration patterns and origins of the LJ population require further investigation and discussion. Additionally, we focused on identifying genomic signatures of selection and local adaptation among the different populations. We identified three selected genes associated with the olfactory placode in DQ: Six1, Six4, and Sox2. We hypothesized that these genes may be linked to the DQ population’s adaptation to the region’s microclimate. In summary, the present study is the first to employ genomics to explore the migration direction of E. miletus, which is crucial for future research on the origins of Eothenomys.
1 Introduction
Among the numerous mountain ecosystems, the Hengduan Mountain regions (HDR) are located in the southeastern corner of the Qinghai-Tibetan Plateau (QTP), in northwestern Yunnan Province, China (Yue et al., 2024). Its latitude and longitude range extends from 24°–34°N and from 96°–104°E (Fu et al., 2006). These regions have been uplifted since the late Miocene, and due to their relatively small size and rich biodiversity, they represent a unique and enigmatic biodiversity hotspot (Boufford, 2014; Xing and Ree, 2017; Mi et al., 2021). The HDR are among the richest areas in the world in terms of temperate flora and fauna, boasting approximately 12,000 species of vascular plants and 1,500 species of terrestrial vertebrates (Boufford, 2014). Eothenomys miletus belongs to the genus Eothenomys, which is endemic to HDR in China. Previous studies on the energy metabolism of E. miletus had focused on physiological characteristics, such as it had low body temperature and high thermogenic properties (Zhu et al., 2008b). Unlike the body mass regulation of northern small mammals, E. miletus had low body mass in winter and high body mass in summer (Zhu et al., 2008a). It found that there was no significant effect of different photoperiods on body mass regulation in E. miletus (Zhu et al., 2011). Moreover, E. miletus did not show any overfeeding behaviors after refeeding (Gao et al., 2013a). Therefore, we speculated that this could be attributed to the large daily temperature difference, the nonsignificant variation in photoperiod, and the relatively abundant food resources in the HDR. Consequently, E. miletus had evolved inherent characteristics that were adapted to the HDR.
Previous studies in our group on the molecular ecology of E. miletus had been on the differences between molecular genetics and quantitative traits in different populations (Ren et al., 2023), the complete mitochondrial genome and its phylogeny (Mu et al., 2019), but the study on the migration problem of E. miletus has not been reported. In the present study, we collected samples from four regions—ALS (24°90’30˝N,100°42’49˝E), JC (26°43’95˝N,99°75’03˝E), LJ (26°87’53˝N, 100°22’90˝E), and DQ (28°35´14˝N, 99°03´15˝E)—successively from south to north. The latitude range of these regions spans from 24° to 28°, which corresponds to the southernmost and northernmost points in HMR of Yunnan Province. So, we combined with the results of previous physiological and ecological studies and molecular genetic structure, fossil distribution records, as well as our studies related to Eothenomys, we hypothesized that E. miletus in the Yunnan region may have originated from the HDR and then spread northward. Moreover, we were also studying population differentiation of E. miletus in different habitats and the effects of genetic evolutionary potential on different populations.
2 Materials and methods
2.1 Samples and sequences
A total of 79 E. miletus specimens were collected from September 2018 to January 2019 in Yunnan Province, including ALS (n = 15), JC (n = 22), LJ (n = 20), and DQ (n = 22). The geographic location, climatic characteristics, and sample number of each collection site were shown in Table 1. We euthanize E. miletus using the anesthesia method. And then employed the phenol/chloroform method to extract genomic DNA from the liver (Arnason et al., 2018). We selected the reference genome of Microtus ochrogaster for electron enzyme digestion. We used SLAF-seq genomic data of 79 individuals collected from four regions and re-sequencing data of one individual from each region. 79 DNA samples were digested with Rsal, and sequenced with fragment lengths of 464–494 bp were defined as SLAFtag, and the obtained SLAFtag was purified by PCR amplification and then selected as a target fragment using 1.5% agarose gel electrophoresis and sequenced using pair-end sequencing on the Illumina HiSeq 2500 platform. A DNA small fragment library with an insert fragment size of 300–400 bp was constructed for resequencing in one randomly selected E. miletus from each population.
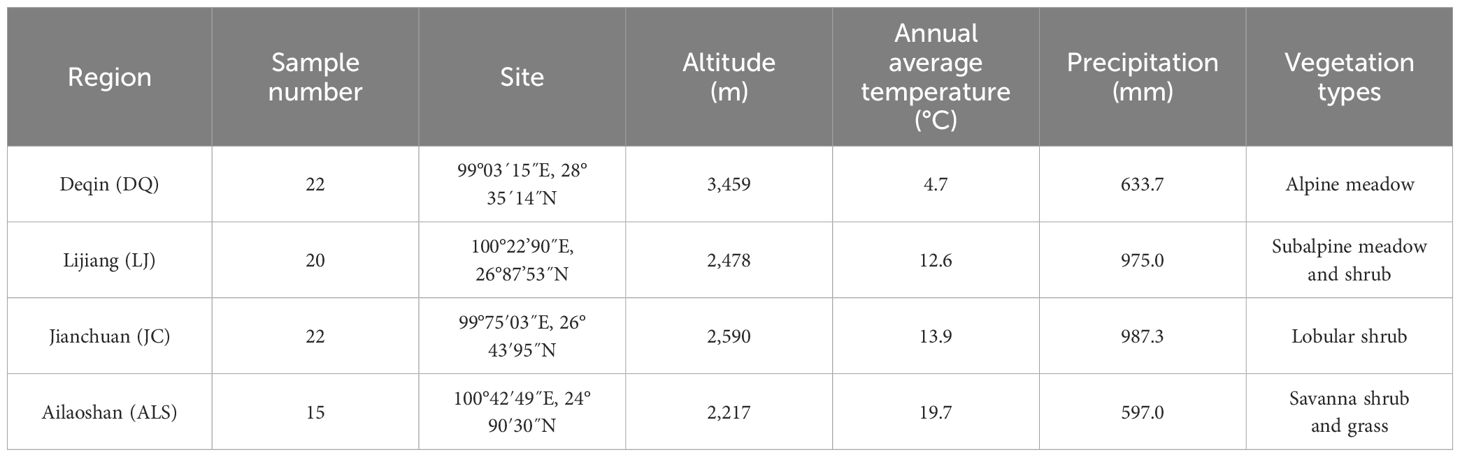
Table 1. Sampling site information.
2.2 DNA quality control and mapping
Reads containing more than 10% unrecognized nucleotides (N) were removed from the SLAF-seq genome, and reads with over 50% low-quality bases (Phred quality score ≤ 5) were discarded. For re-sequencing data, the raw short read sequences were filtered using SOAPnuke v.1.5.6 software (Li et al., 2009). Using M. ochrogaster as the reference genome, the re-sequencing data and SLAF-seq genomic data were mapped to the reference genome using the MEM module of BWA v.0.7.17-r1188 with default parameters (Bennett et al., 2022), respectively. The SAM files were subsequently generated using Samtools v.1.13 with default parameters (Li et al., 2009) for sorting and duplication in Picard v.3.1.1 (https://github.com/broadinstitute/picard/releases).
2.3 SNP calling and filtering
The Select Variants method in GATK v.4.4.0.0 software was used for SNP calling with default parameters across the all individuals (McKenna et al., 2010). We performed a filtering step with the following set of parameters: QD < 2.0, MQ < 40.0, FS > 60.0, SOR > 3.0, MQ Rank Sum < −12.5, Read Pos Rank Sum < −8.0 (Yuan et al., 2023). To obtain more reliable SNP loci, we further filtered using vcftools –max-missing with the parameter size set to 0.2 (Danecek et al., 2011).
2.4 Phylogenetic analysis
We constructed the phylogenetic tree based on SLAF-seq genomic data and re-sequencing data using the maximum likelihood method implemented in RAxML v8.2.4, with the ascertainment bias correction and M. ochrogaster as the outgroup (Stamatakis, 2014). Before constructing the phylogenetic tree, we used the Python script vcf2pliphy.py for alignment and converted to a pliphy format recognizable by RAxML (Ortiz, 2019). We performed a Bayesian approach using re-sequencing data with M. ochrogaster as the outgroup in MrBayes v.3.2.7 with MCMC runs, iterated 1,000,000 times, and sampled every 1000 generations (Ronquist et al., 2012). The vcf file was converted to nexus format using the Python script vcf2pliphy.py before constructing the Bayesian tree, and then the nexus was converted to nexus format recognized by MyBayes v.3.2.7 using ALTER v.1.3.4 (Glez-Peña et al., 2010). The ML tree and the Bayesian tree obtained from the SLAF-seq genomic data and re-sequencing data were visualized in Figtree v.1.4.4 (Ngugi et al., 2023).
2.5 Admixture analysis
We employed several methods to test for admixture and genetic affinity among various populations. Outgroup f3-statistics were calculated using M. ochrogaster as the outgroup with the qp3pop program in Admixtools v.7.0.2, in the form of f3 (Pop1, ALS; M. ochrogaster), to assess the relative genetic similarity of ALS populations to other populations (Patterson et al., 2012; Raghavan et al., 2014). High f3 values indicate a strong degree of shared genetic history between populations (Patterson et al., 2012). Subsequently, we conducted an admixture f3-statistical analysis using the 3pop module in TreeMix v.1.13 (Alexander et al., 2009; Pickrell and Pritchard, 2012; Harris and DeGiorgio, 2017). The f3-statistic explicitly tests whether a taxon of interest (C) is the result of admixture between two others (A and B), considering the product of allelic differentials between (c − a)(c − b). Negative values suggest that the allelic frequencies of c are intermediate across many populations, which is consistent with admixture (Lopes et al., 2023). F4-statistics can visualize genetic drift shared between taxa (Harris and DeGiorgio, 2017). For an f4 (A, B; C, D) topology, without invoking admixture, the allele frequency difference between A and B (a − b) and between C and D (c − d) should be unrelated and hence results in f4 = [(a − b)(c − d)] = 0. Significantly positive f4 implies gene flow between A and C or B and D. Significantly negative f4 implies gene flow between A and D or B and C (Lopes et al., 2023). As used here, when D is an outgroup, it allows testing past introgression between A and either B or C (Lopes et al., 2023). A significantly positive f4 implies gene flow between A and C, and a significantly negative f4 implies gene flow between B and C (Patterson et al., 2012; Hu et al., 2024). The significance of the f4-statistics and f3-statistic is based on z-scores, significance positive (z > 3) and significance negative (z < −3) (Harris and DeGiorgio, 2017). Significant f4 and f3 values can also be interpreted as a rejection of a given topology (Peter, 2016; Zheng and Janke, 2018). Finally, we performed D-statistics analyses using qpDstat in the Admixtools v.7.0.2 package to detect gene flow events between the four populations in the form of D (Pop1, Pop2; Pop3, M. ochrogaster) (Patterson et al., 2012). We performed the following tests: (i) (ALS, DQ; LJ, M. ochrogaster); (ii) (ALS, DQ; JC, M. ochrogaster); (iii) (ALS, LJ, JC; M. ochrogaster); (iv) (DQ, LJ; ALS, M. ochrogaster); (v) (JC, LJ; ALS, M. ochrogaster). A significant positive value of D (z > 3) indicates high affinity between Pop1 and Pop3. If D is significantly negative (z < −3), it indicates high affinity between Pop2 and Pop3 (Zhang et al., 2020).
2.6 Grantham Score
The deleteriousness of the missense mutations was also diagnosed using the Grantham Score (GS)—a measure of the physical/chemical properties of amino-acid changes (Grantham, 1974). Use the Python program “Grantham_score_calculator.py” to calculate the Grantham Score for each missense mutation site (Grantham, 1974). Additionally, count the sites with a score greater than 150, as these are defined as the genetic load of deleterious missense mutations (Li et al., 1984).
2.7 Genomic signatures of selection and local adaptation
In general, positive selection gives rise to lower genetic diversity within populations and higher genetic differentiation between populations (Wu et al., 2014). The genetic differentiation index FST and the average proportion of pairwise mismatches over all compared sequences have been widely used to detect selection (Tajima, 1983; Weir and Cockerham, 1984). To detect selection signals possibly associated with local adaptation, we used a sliding-window method (10kb window, 1kb step) to calculate the genome-wide distribution of FST values and θπ ratios for the two populations, implemented in vcftools v0.1.14 (Hu et al., 2020). We applied Z transformation for FST values and log2 transformation for θπ ratios and considered the windows with the top 5% Z (FST) and log2 (θπ ratio) values simultaneously as the candidate outliers under strong selection (Hu et al., 2020). All outlier windows were assigned to the corresponding snp and gene. We used Metascape to analyze the enrichment of selected genes located in specific regions (Zhou et al., 2019). Each significantly enriched category contained at least three genes, and a hypergeometric test was used to estimate significance (p < 0.05).
3 Results
3.1 Sequencing and SNP filtering
The SLAF-seq genomic data, with an average genome coverage of 10.21x, and the re-sequencing data, with an average genome coverage of 39.87x (Supplementary Table S1), have been uploaded to NCBI. The SLAF-seq genomic data and re-sequencing data were mapped using BWA v.0.7.17-r1188. The raw SNPs underwent quality control using stringent filtering criteria, resulting in a total of 130,769,878 high-quality SNPs datasets for the re-sequencing data and 151,301 high-quality population SNPs datasets for the SLAF-seq genomes (Supplementary Table S1).
3.2 Phylogenetic relationship
ML tree constructed using SLAF-seq genomic data showed that E. miletus in ALS and JC basically cluster into separate clade, while E. miletus in DQ and LJ form sister clades. Among these four groups, ALS was the first to diverge and occupied a basal position, followed by JC, and the last two to diverge, DQ and LJ, were clustered into sister branches (Figure 1A). We then used the re-sequencing data to construct a ML and Bayesian tree (Figures 1B, C), and the phylogenetic tree constructed using the re-sequencing data also supported the existence of significant differences between the groups, and the results showed that the first to differentiate was still the ALS, followed by JC, and lastly DQ and LJ that were clustered into sister branches. Meanwhile, our results were also confirmed in the previous study on the genetic structure analysis from five regions in E. miletus, when k = 2, ALS was the first to be separated, and k = 3, JC were separated (Ren et al., 2023). And it was found that in the principal component analysis, using of PC1 and PC2 differentiated between ALS and JC, and it was the use of PC1 and PC3 that separated DQ and LJ (Ren et al., 2023). Therefore, based on the phylogenetic tree results, genetic structure and PCA analyses, we suggested that the ALS was the earliest to diverge from the common ancestor, whereas the divergence of the DQ and LJ was a notable recent event.
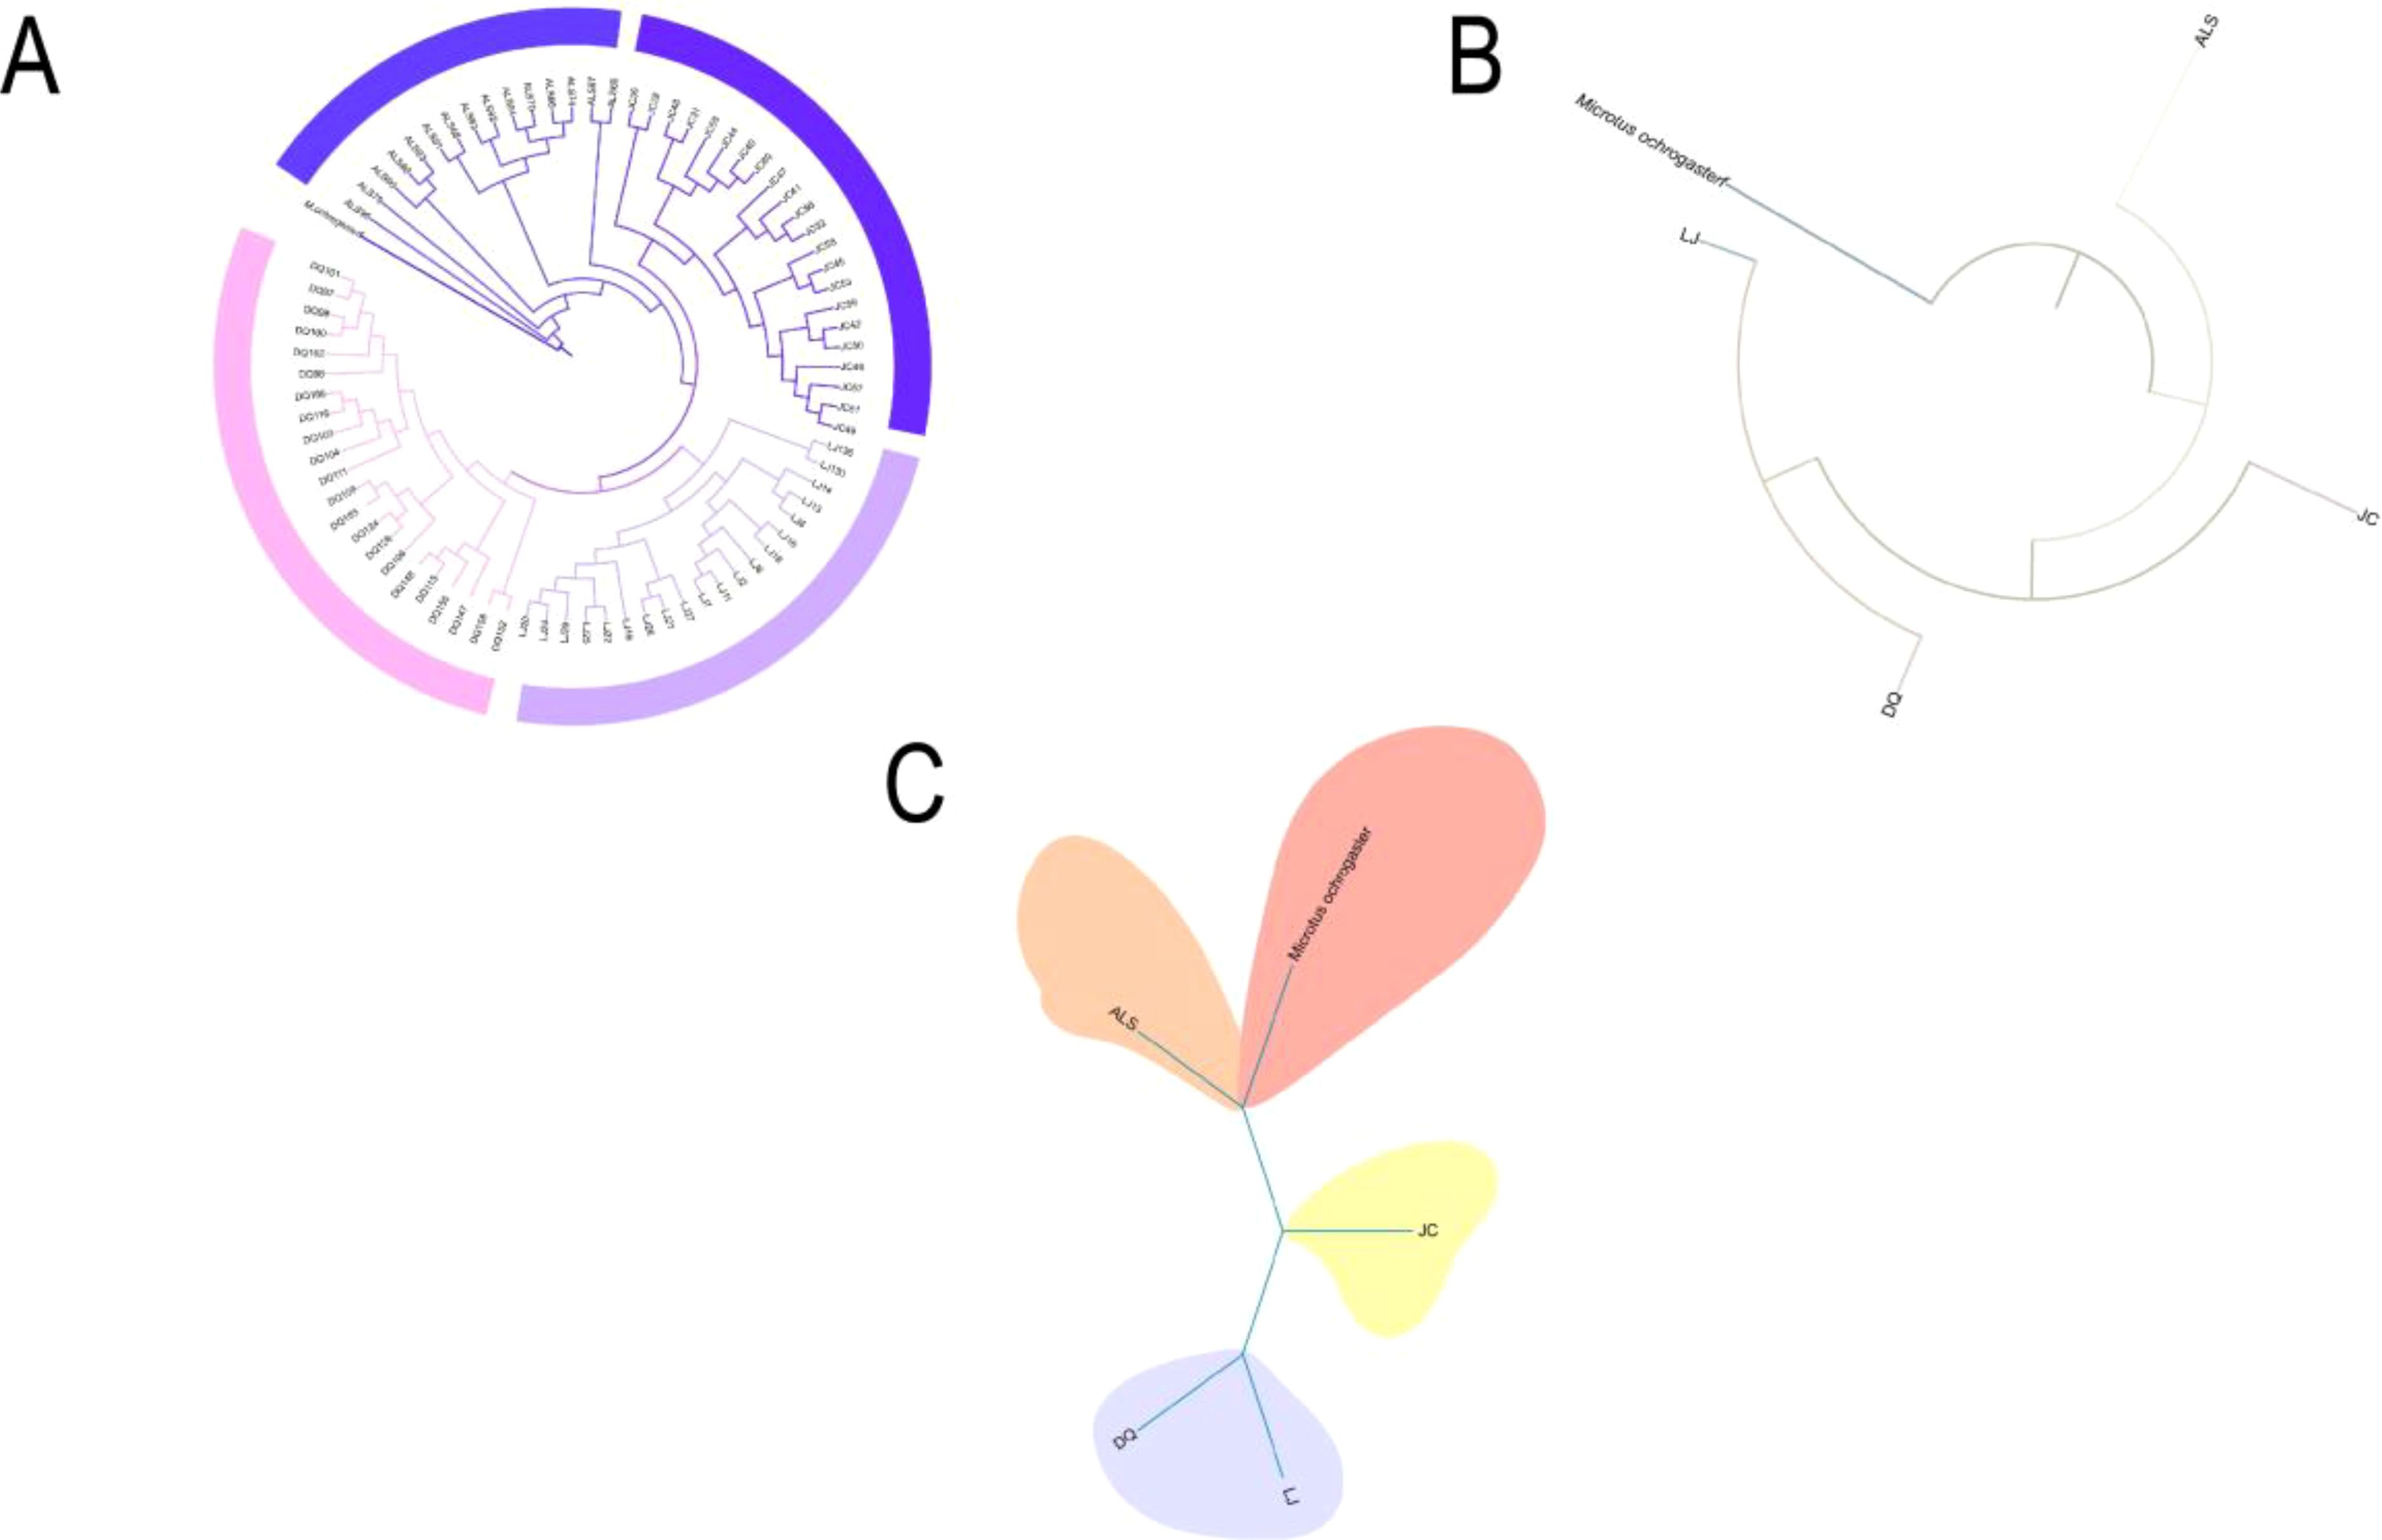
Figure 1. Phylogenetic relationships: (A) Phylogenetic tree of all 80 individuals including outgroups; (B) Maximum likelihood tree of four populations constructed from re-sequencing data; (C) Bayesian tree constructed from re-sequencing data.
3.3 Genomic introgression among populations
In order to assess the relative genetic similarity between ALS and other populations, we selected LJ, DQ, and JC as the reference populations, with M. ochrogaster serving as the outgroup. The f3 results indicated a significant positive value, with ALS exhibiting the highest f3 value in comparison to DQ, which suggests the greatest degree of shared genetic history between them. This was followed by ALS with JC, and finally ALS with LJ (Figure 2A). To explore the potential ancestral origin of the groups the admixture f3 (A, B; C) analyses were conducted, and the f3 were all significant positive values, indicating that there was no admixture event between the four regions (Figure 2B). The f4-statistics use four-taxa topologies in the form (A, B; C, D). Here, D represents M. ochrogaster. Taking turns in order, ALS, DQ, JC, and LJ serve as A, B, and C respectively. We found that significant gene flow was detected between all groups except between ALS and LJ (Figure 2C). Although these statistics cannot discern the direction of the introgressions nor distinguish between a scenario of continuous gene flow, the f4-statistics results strongly supported that ALS had been involved in past gene flow events in DQ and JC. In order to better understand the intergroup introgression signals, we performed D-statistics analysis using qpDstat in the Admixtools software package to test events of gene flow between the four groups. From the results of the D-statistics analysis, we found that the D values of all possible events detected when Pop1 was in ALS were significantly negative (z < −3), which suggested that the other three groups besides ALS had a high affinity. When Pop3 is ALS and Pop1 is DQ and JC, respectively, the D value showed a significant positive value, which indicated that ALS had a high affinity with DQ and JC (Figure 2D). The results of both f4-statistics and D-statistics analyses supported the existence of strong gene flow and high affinity between the ALS and both DQ and JC. E. miletus in Yunnan is mainly concentrated in the eastern part of the HDR, and its fossils had only been found in the Quaternary Pleistocene strata in China (Young, 1935). Some studies had shown that Eothenomys originated in the northern part of the subcontinental monsoon zone, and its ancestors entered the HDR from the northeastern part of the subcontinental monsoon zone to live mainly in the HDR with an altitude of 2,000–2,500 m sea level (Wang et al., 2022). Therefore, by integrating previous studies with data from our sampling sites, along with phylogenetic analyses and gene introgression between groups, as well as findings from earlier research on the genetic differentiation of E. miletus, we hypothesize that JC and DQ may have formed a group that continued to migrate to higher elevations after migrating to ALS from a common ancestor. But the question of whether the LJ was formed by the diffusion of ALS or evolved from an ancient ancestor needs to be followed up with a more detailed analysis.
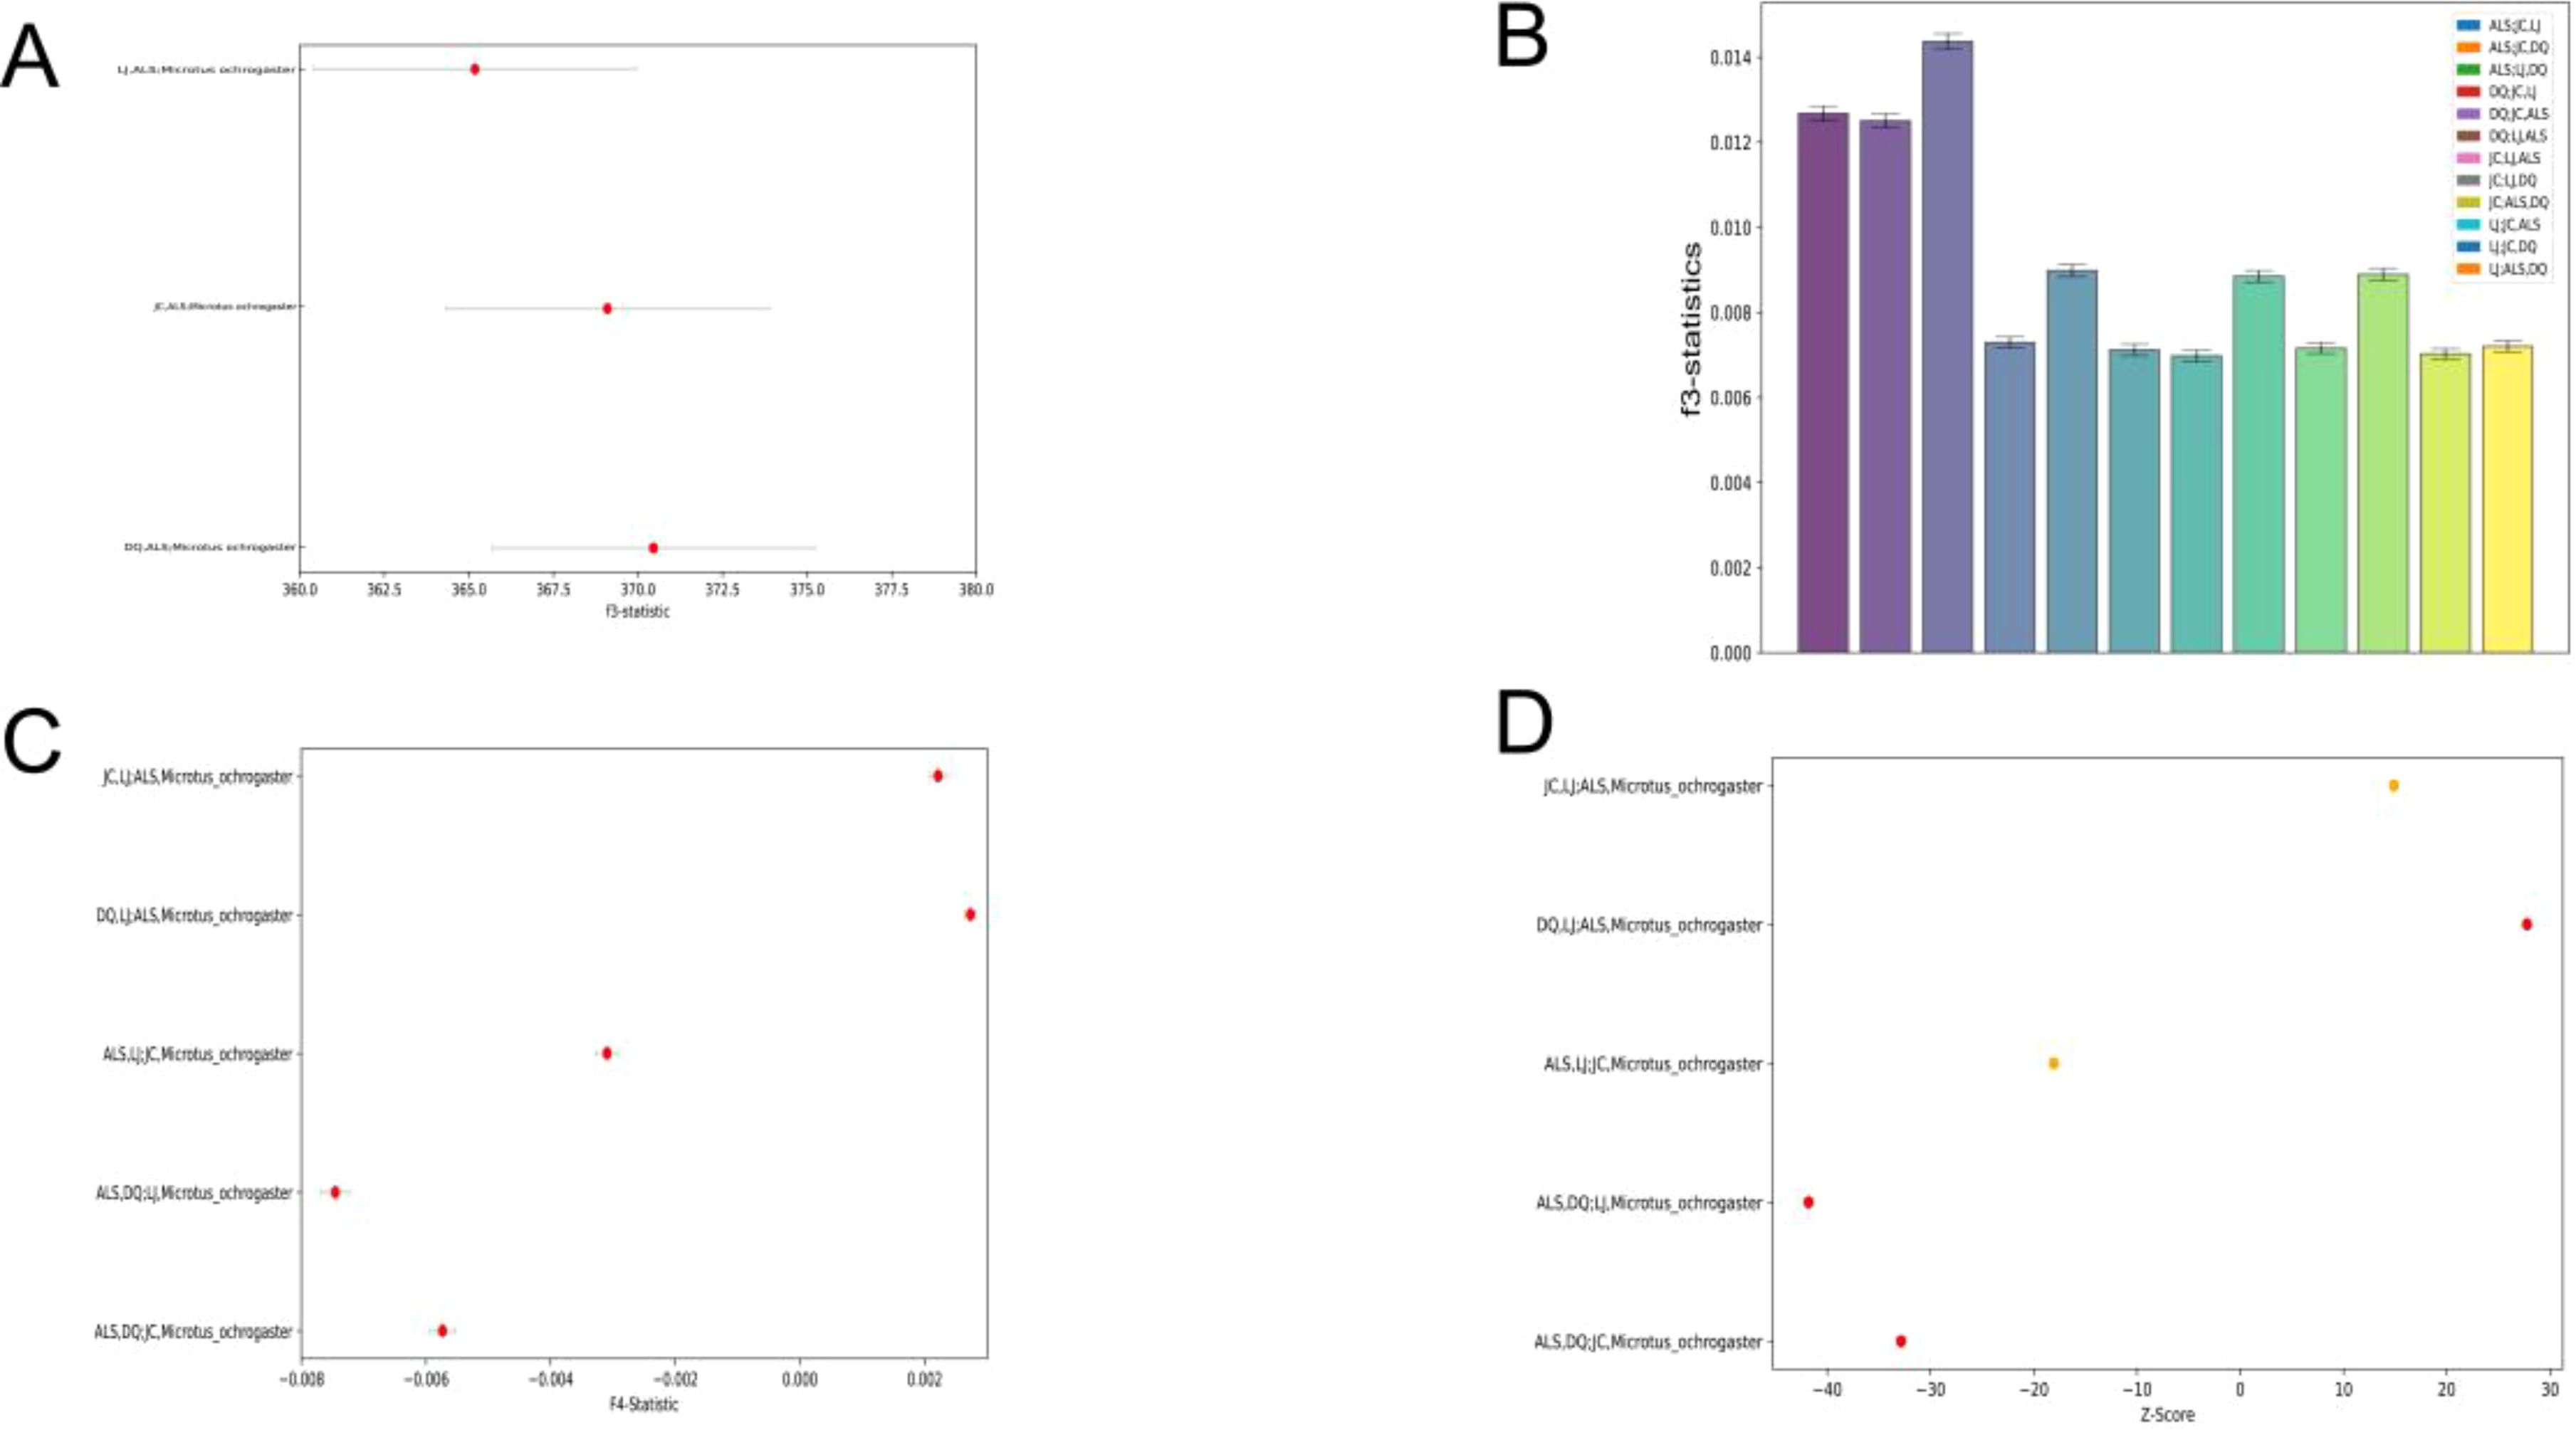
Figure 2. Gene penetration between populations: (A) Results of Outgroup f3-statistic; (B) Results of admixture f3-statistic; (C) Between-population results of f4-statistics; (D) Population D-statistics.
3.4 Grantham Score
We performed Grantham Score evaluation, we found that the maximum Grantham Score of all missense mutation sites in the four populations was 145, which was less than 150; there were no deleterious mutations in the missense mutation sites we detected (Figure 3; Supplementary Table S2).
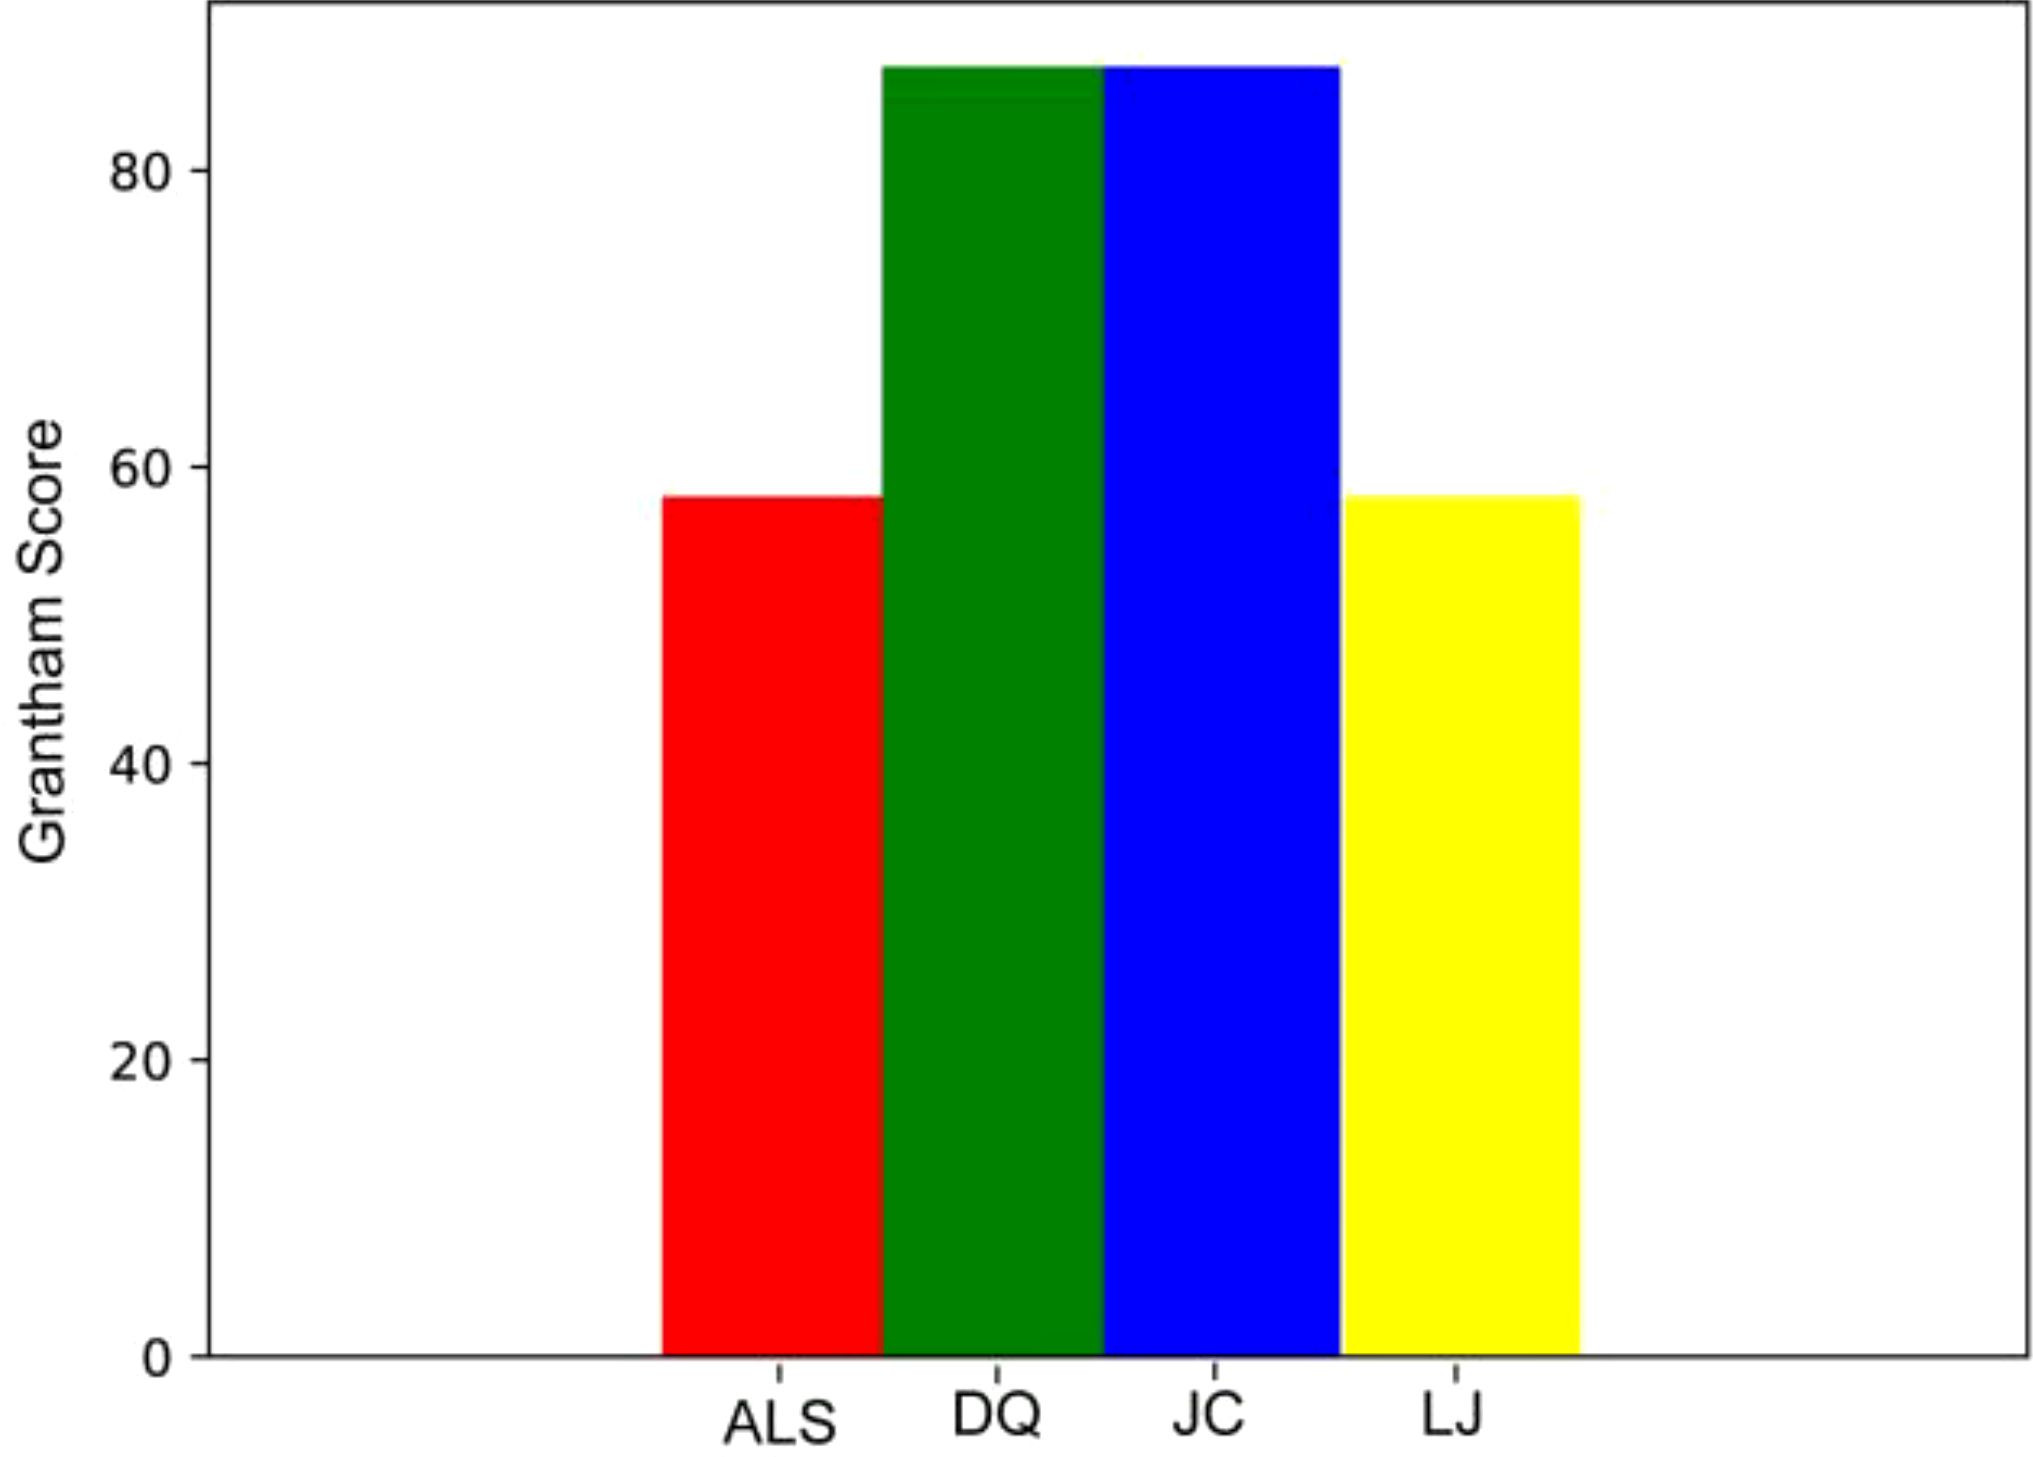
Figure 3. Mean of Grantham Score for four populations.
3.5 Genomic signatures of selection and local adaptation
Considering that E. miletus lived in different geographical ranges and climatic environments and underwent a certain period of genetic differentiation, we focused mainly on the identification of selection and local adaptation between the two populations. Based on environmental differences, we selected the DQ population, which was relatively more rigorous compared to the other three populations, as our subject of study. Using FST and θπ methods, between DQ and ALS, DQ and JC, as well as DQ and LJ, we selected 428, 452, and 429 genes in DQ, respectively (Supplementary Table S3). The functional enrichment found that some genes were enriched in the Kyoto Encyclopedia of Genes and Genomes (KEGG) pathways of cancer pathway (ko05200, p < 0.01), renal cell carcinoma (ko05211, p < 0.01), choline metabolism in cancer (ko05231, p < 0.01), phospholipase D signaling pathway (ko04072, p < 0.01), chronic granulocyte leukemia (ko05220, p < 0.01), RAS signaling pathway (ko04014, p < 0.01), Rap1 signaling pathway (ko04015, p < 0.01), sphingolipid signaling pathway (ko04071, p < 0.01), Chagas disease (ko05142, p < 0.01), amoebiasis (ko05146, p < 0.01), toxoplasmosis (ko05146, p < 0.01), amoebiasis (ko05146, p < 0.01), and toxoplasmosis pathways (ko05145, p < 0.01) (Figure 4; Supplementary Table S1) and the gene ontology (GO) term of olfactory placode formation (GO:0030910, p < 0.01), olfactory placode development (GO:0071698, p < 0.01), and olfactory placode morphogenesis pathways (GO:0071699, p < 0.01) (Figure 5; Supplementary Table S1). We identified three selected genes associated with the olfactory placode in DQ: Six1, Six4, and Sox2.
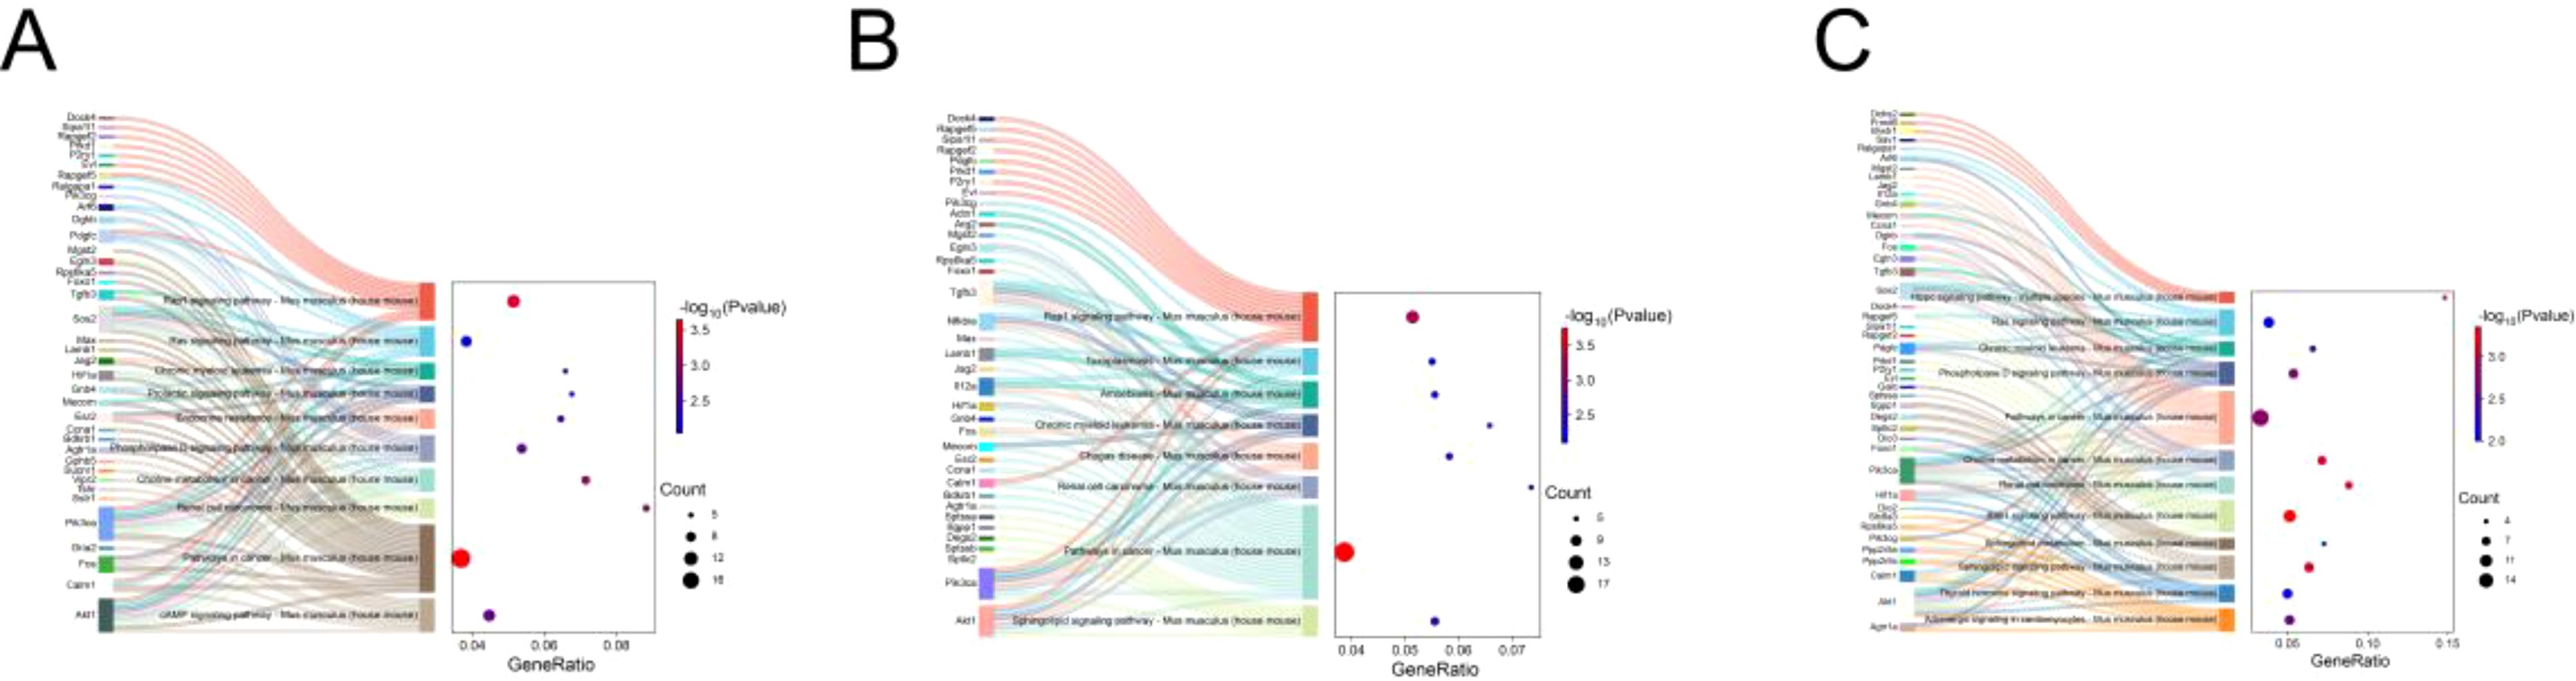
Figure 4. KEGG enrichment: (A) KEGG pathway enriched by selected genes in the DQ population in DQ/ALS; (B) KEGG pathway enriched by selected genes in the DQ population in DQ/JC; (C) KEGG pathway enriched by selected genes in the DQ population in DQ/LJ.
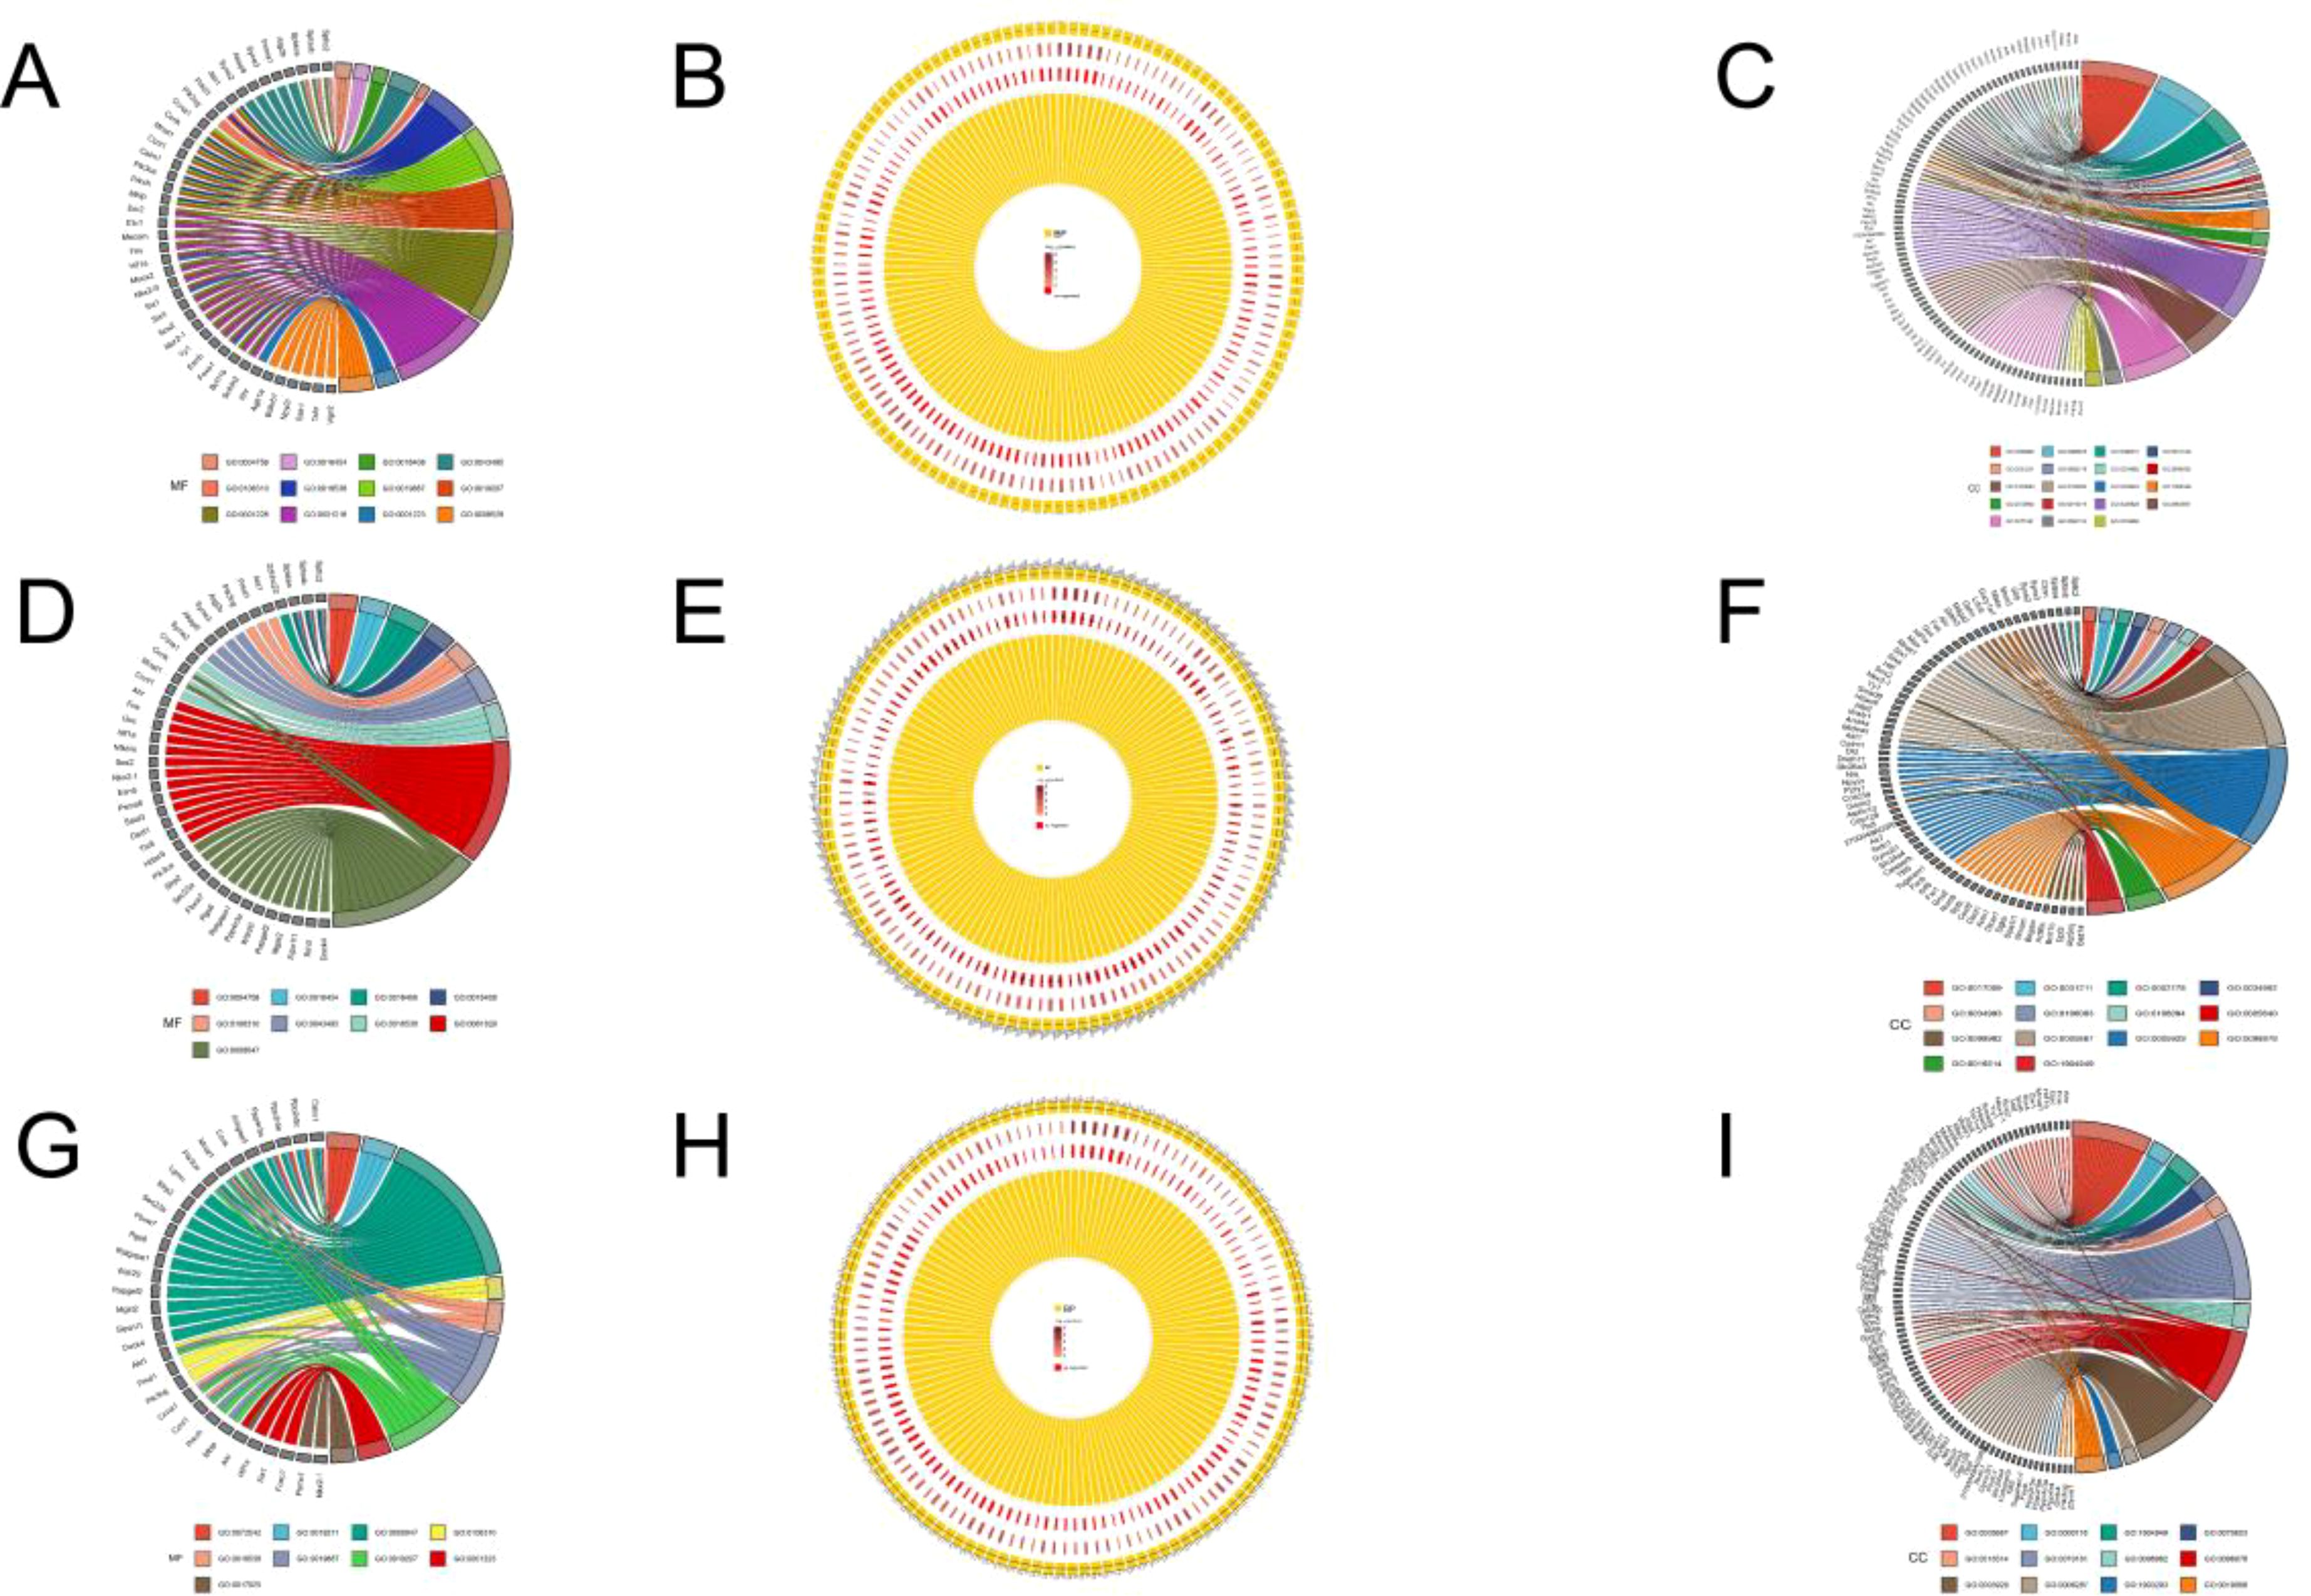
Figure 5. GO enrichment: (A) Molecular functions annotated to selected genes in the DQ population in DQ/ALS; (B) Biological processes annotated to selected genes in the DQ population in DQ/ALS; (C) Cellular components annotated to selected genes in the DQ population in DQ/ALS; (D) Molecular functions annotated to selected genes in the DQ population in DQ/JC; (E) Biological processes annotated to selected genes in the DQ population in DQ/JC; (F) Cellular components annotated to selected genes in the DQ population in DQ/JC; (G) Molecular functions annotated to selected genes in the DQ population in DQ/LJ; (H) Biological processes annotated to selected genes in the DQ population in DQ/LJ; (I) Cellular components annotated to selected genes in the DQ population in DQ/LJ.
4 Discussion
We utilized SLAF-seq genomic data and re-sequencing data to investigate the migration patterns of ALS, DQ, JC, and LJ in E. miletus. Although phylogenetic analyses and previous analyses of the genetic structure of E. miletus supported that ALS was the first to diverge (Ren et al., 2023). However, we further conducted intergroup introgression analyses, and the results showed that there was high genetic affinity between ALS and DQ, JC. Moreover, it showed that ALS was involved in the past gene flow events of DQ and JC (Figure 2). Considering the fossil record and the migration of Eothenomys, we speculated that DQ and JC may have been formed by the spread of ALS (Wang et al., 2022).
In the study of Eothenomys species from Sichuan and Yunnan, it was found that samples of Sichuan (sampled in southern Sichuan) clustered with Yunnan in the phylogenetic tree (sampled in Yangbi, Wulianshan, and Ailaoshan, Yunnan), and that the K2P between Sichuan and Yunnan populations was only 0.35% (Liu et al., 2019). Additionally, the penis bone morphology of the Sichuan populations was similar to that of the Yunnan populations, as indicated by principal component analysis (PCA) of morphological traits (Liu et al., 2019). Therefore, these samples were considered to belong to the same species (Liu et al., 2019). Based on the above analyses, it is hypothesized that the ancestor of E. miletus may have dispersed from northern Asia to Sichuan, with some individuals remaining in southern Sichuan and some continuing to spread to the HDR (e.g., ALS), and then some of E. miletus in HDR spreading to the north to higher altitudes, but whether this hypothesis is true or not needs to be analyzed by collecting more samples to analyze (Luo et al., 2004).
How exactly did E. miletus originate? The reasons may be varied. Mountain building movements create a wide variety of environmental conditions, including the generation of climatic ecological niches, new habitats or food resources, and migration barriers, all of which contribute to biological species formation (Hoorn et al., 2013; Xing and Ree, 2017; He et al., 2021). It has been posited that the ancestor of Eothenomys initiated its evolution in Northern Asia, undergoing a major southward migration between 2.08 and 2.70 million years ago (Mya), a period coinciding with the most intense uplift events of the Tibetan Plateau from 2.6 to 3.6 Mya, which precipitated pronounced orogeny, exacerbating climatic changes in East Asia, particularly those associated with the intensity of summer and winter monsoons, a time also marked by extensive glaciations in the Northern Hemisphere; the molecular data-estimated divergence time suggested Eothenomys arose approximately 2.70 Mya, fitting precisely within the latter temporal framework of these aforementioned paleogeographical and paleoclimatic events, indicating that the early speciation of Eothenomys might have been associated with tectonic orogeny; E. miletus originally considered a subspecies of E. melanogaster, was elevated to a distinct subspecies due to its unique physiological traits, and studies revealed that Eothenomys is the most represented with around 17 species among voles in the HDR, displaying a high degree of ancient admixture across different lineages (Osgood, 1941; Zhi et al., 2001; Zhang and Liu, 2010; Hoorn et al., 2013; Wang et al., 2022). Based on findings from previous research and our own investigations, we hypothesize that E. miletus may have originated through one of three potential scenarios: (1) evolving from a subspecies of E. melanogaster, but over time and due to differences in habitat environments, E. miletus diverged in characteristics distinct from E. melanogaster, developing unique traits suited to its habitat, and eventually evolving into a separate subspecies; (2) E. miletus itself is a new species formed by the admixture of several different species within Eothenomys; (3) E. miletus has existed since the inception of Eothenomys, being one of the ancient species within this genus. Of course, unraveling the true origin of E. miletus species would likely require us to gather more genomic samples from species within Eothenomys for further detailed analysis.
Furthermore, considering the differences in the survival environments of the ALS, DQ, JC, and LJ populations of E. miletus, we selected DQ, which presents the most challenging environment, for our analysis. Three genes—Six1, Six4, and Sox2—were found to be enriched in DQ, associated with the pathways of olfactory placode formation (GO:0030910, p < 0.01), olfactory placode development (GO:0071698, p < 0.01), and olfactory placode morphogenesis pathways (GO:0071699, p < 0.01). Previous studies have demonstrated that in mice, embryos lacking Six1 and Six4 fail to form the olfactory placode (Chen et al., 2009). Six1 proteins are highly expressed in the peripheral region where stem cells are located, and that Six1 is overlapping expressed with Sox2 (Chen et al., 2009). Research has discovered that olfactory placodes arise by anterior convergence of a field of lateral neural plate cells, rather than by localized separation and proliferation of a discrete group of cells (Whitlock and Westerfield, 2000). Moreover, foxg1-Cre mediated early deletion of Sox2 eradicates all olfactory placode development (Dvorakova et al., 2020). Importantly, the olfactory placode is critical for olfactory bulb development (Wang et al., 2001). By using high-throughput sequencing technology to measure their feeding habits and the types of fungi in their stomachs, we found that E. miletus primarily fed on Poaceae, Oxalidaceae, Asteraceae, and Fabaceae (Yan and Zhu, 2023). We found that food diversity in DQ was relatively high, and we hypothesized that the relatively low mean annual temperature and scarcity of vegetation types in the DQ area might have forced the greater sage-grouse to search for more complex food sources to satisfy their survival needs (Yan and Zhu, 2023). As a result, E. miletus in DQ needs a more sensitive sense of smell for finding food, so three genes related to olfactory placode, Six1, Six4, and Sox2 were fixed.
In conclusion, SLAF-seq genome and re-sequencing genome analyses revealed genetic differences among four populations of E. miletus, providing more comprehensive genetic evidence for the origin and migration of E. miletus. Combining the fossil record, as well as the molecular phylogeny, biogeography, and morphology of Eothenomys with our previously results, we hypothesized that the DQ and JC groups may have been formed by the migration of the ALS group (Luo et al., 2004; Liu et al., 2019). However, to develop a more specific and precise understanding of the migration patterns and the formation of E. miletus, it is essential to expand the sampling range and conduct further research.
Data availability statement
The datasets presented in this study can be found in online repositories. The names of the repository/repositories and accession number(s) can be found in the article/Supplementary Material.
Ethics statement
The animal study was approved by All animal procedures were within the rules of Animals Care and Use Committee of School of Life Science, Yunnan Normal University. This study was approved by the Committee (13-0901-011). The study was conducted in accordance with the local legislation and institutional requirements.
Author contributions
YC: Investigation, Methodology, Writing – original draft. TJ: Investigation, Methodology, Writing – original draft. WZ: Conceptualization, Funding acquisition, Investigation, Writing – review & editing.
Funding
The author(s) declare financial support was received for the research, authorship, and/or publication of this article. This work was financially supported by the National Natural Scientific Foundation of China (32160254, 32060115), Yunnan Fundamental Research Projects (202401AS070039).
Conflict of interest
The authors declare that the research was conducted in the absence of any commercial or financial relationships that could be construed as a potential conflict of interest.
The author(s) declared that they were an editorial board member of Frontiers, at the time of submission. This had no impact on the peer review process and the final decision.
Generative AI statement
The author(s) declare that no Generative AI was used in the creation of this manuscript.
Publisher’s note
All claims expressed in this article are solely those of the authors and do not necessarily represent those of their affiliated organizations, or those of the publisher, the editors and the reviewers. Any product that may be evaluated in this article, or claim that may be made by its manufacturer, is not guaranteed or endorsed by the publisher.
Supplementary material
The Supplementary Material for this article can be found online at: https://www.frontiersin.org/articles/10.3389/fevo.2025.1533205/full#supplementary-material
References
Alexander D. H., Novembre J., Lange K. (2009). Fast model-based estimation of ancestry in unrelated individuals. Genome Res. 19, 1655–1664. doi: 10.1101/gr.094052.109
Arnason U., Lammers F., Kumar V., Nilsson M. A., Janke A. (2018). Whole-genome sequencing of the blue whale and other rorquals finds signatures for introgressive gene flow. Sci. Adv. 4, eaap9873. doi: 10.1126/sciadv.aap9873
Bennett E. A., Weber J., Bendhafer W., Champlot S., Peters J., Schwartz G. M., et al. (2022). The genetic identity of the earliest human-made hybrid animals, the kungas of Syro-Mesopotamia. Sci. Adv. 8, eabm0218. doi: 10.1126/sciadv.abm0218
Boufford D. E. (2014). Biodiversity hotspot: China’s Hengduan mountains. Arnoldian 72, 24–35. doi: 10.5962/p.253573
Chen B., Kim E. H., Xu P. X. (2009). Initiation of olfactory placode development and neurogenesis is blocked in mice lacking both Six1 and Six4. Dev. Biol. 326, 75–85. doi: 10.1016/j.ydbio.2008.10.039
Danecek P., Auton A., Abecasis G., Albers C. A., Banks E., DePristo M. A., et al. (2011). The variant call format and VCFtools. Bioinformatics 27, 2156–2158. doi: 10.1093/bioinformatics/btr330
Dvorakova M., Macova I., Bohuslavova R., Anderova M., Fritzsch B., Pavlinkova G. (2020). Early ear neuronal development, but not olfactory or lens development, can proceed without SOX2. Dev. Biol. 457, 43–56. doi: 10.1016/j.ydbio.2019.09.003
Fu C. Z., Hua X., Li J., Chang Z., Pu Z. C., Chen J. K. (2006). Elevational patterns of frog species richness and endemic richness in the Hengduan Mountains, China: geometric constraints, area and climate effects. Ecography 29, 919–927. doi: 10.1111/j.2006.0906-7590.04802.x
Gao W. R., Zhu W. L., Cao N., Meng L. H., Wang Z. K., Yu T. T., et al. (2013a). Effects of fasting and refeeding on body mass, thermogenesis and serum leptin in Eothenomys miletus. J. Acta Theriologica Sin. 33, 106–112. doi: 10.16829/j.slxb.2013.02.002
Glez-Peña D., Gómez-Blanco D., Reboiro-Jato M., Fdez-Riverola F., Posada D. (2010). ALTER: program-oriented conversion of DNA and protein alignments. Nucleic Acids Res. 38, W14–W18. doi: 10.1093/nar/gkq321
Grantham R. (1974). Amino acid difference formula to help explain protein evolution. Science 185, 862–864. doi: 10.1126/science.185.4154.862
Harris A. M., DeGiorgio M. (2017). Admixture and ancestry inference from ancient and modern samples through measures of population genetic drift. Hum. Biol. 89, 21–46. doi: 10.13110/humanbiology.89.1.02
He J. K., Lin S. L., Ding C. C., Yu J. H., Jiang H. S. (2021). Geological and climatic histories likely shaped the origins of terrestrial vertebrates endemic to the Tibetan Plateau. Global Ecol. Biogeography 30, 1116–1128. doi: 10.1111/geb.13286
Hoorn C., Mosbrugger V., Mulch A., Antonelli A. (2013). Biodiversity from mountain building. Nat. Geosci. 6, 154. doi: 10.1038/ngeo1742
Hu J. Y., Hao Z. Q., Frantz L., Wu S. F., Chen W., Jiang Y. F., et al. (2020). Genomic consequences of population decline in critically endangered pangolins and their demographic histories. Natl. Sci. Rev. 7, 798–814. doi: 10.1093/nsr/nwaa031
Hu Q. L., Zhuo J. C., Fang G. Q., Lu J. B., Ye Y. X., Li D. T., et al. (2024). The genomic history and global migration of a windborne pest. Sci. Adv. 10, 17. doi: 10.1126/sciadv.adk3852
Hu Y., Thapa A., Fan H., Ma T., Wu Q., Ma S., et al. (2020). Genomic evidence for two phylogenetic species and long-term population bottlenecks in red pandas. Sci. Adv. 6, eaax5751. doi: 10.1126/sciadv.aax5751
Li H., Handsaker B., Wysoker A., Fennell T., Ruan J., Homer N., et al. (2009). The sequence alignment/map format and SAMtools. Bioinformatics 25, 2078–2079. doi: 10.1093/bioinformatics/btp352
Li R. Q., Yu C., Li Y. R., Lam T. W., Yiu S. M., Kristiansen K., et al. (2009). SOAP2: an improved ultrafast tool for short read alignment. Bioinformatics 25, 1966–1967. doi: 10.1093/bioinformatics/btp336
Li W. H., Wu C. I., Luo C. C. (1984). Nonrandomness of point mutation as reflected in nucleotide substitutions in pseudogenes and its evolutionary implications. J. Mol. Evol. 21, 58–71. doi: 10.1007/bf02100628
Liu S. Y., Chen S. D., He K., Tang M. K., Liu Y., Jin W. (2019). Molecular phylogeny and taxonomy of subgenus Eothenomys (Cricetidae: Arvicolinae: Eothenomys) with the description of four new species from Sichuan, China. Zoological J. Linn. Soc. 186, 569–598. doi: 10.1093/zoolinnean/zly071
Lopes F., Oliveira L. R., Beux Y., Kessler A., Cárdenas-Alayza S., Majluf P., et al. (2023). Genomic evidence for homoploid hybrid speciation in a marine mammal apex predator. Sci. Adv. 9, eadf6601. doi: 10.1126/sciadv.adf6601
Luo J., Yang D. M., Suzuki H., Wang Y. X., Chen W. J., Campbell K. L. (2004). Molecular phylogeny and biogeography of Oriental voles: genus Eothenomys (Muridae, Mammalia). Mol. Phylogenet. Evol. 33, 349–362. doi: 10.1016/j.ympev.2004.06.005
McKenna A., Hanna M., Banks E., Sivachenko A., Cibulskis K., Kernytsky A., et al. (2010). The Genome Analysis Toolkit: A MapReduce framework for analyzing next-generation DNA sequencing data. Genome Res. 20, 1297–1303. doi: 10.1101/gr.107524.110
Mi X. C., Feng G., Hu Y. B., Zhang J., Chen L., Corlett R. T., et al. (2021). The global significance of biodiversity science in China: an overview. Natl. Sci. Rev. 8, nwab032. doi: 10.1093/nsr/nwab032
Mu Y., Duan Y. Q., Di Z., Wang Z. K., Zhu W. L. (2019). The complete mitochondrial genome of the Yunnan red-backed vole (Eothenomys miletus) (Rodentia: Cricetidae) and its phylogeny. Mitochondrial DNA Part B-Resources 4, 1424–1425. doi: 10.1080/23802359.2019.1598801
Ngugi D. K., Salcher M. M., Andrei A. S., Ghai R., Klotz F., Chiriac M. C., et al. (2023). Postglacial adaptations enabled colonization and quasi-clonal migration of ammonia-oxidizing archaea in modern European large lakes. Sci. Adv. 9, eadc9392. doi: 10.1126/sciadv.adc9392
Ortiz E. M. (2019). Vcf2phylip v2. 0: convert a VCF matrix into several matrix formats for phylogenetic analysis. Zenodo, 2540861. doi: 10.5281/zenodo.2540861
Osgood W. H. (1941). The mammals of China and Mongolia. J. Mammalogy 22, 206–208. doi: 10.2307/1374920
Patterson N., Moorjani P., Luo Y., Mallick S., Rohland N., Zhan Y., et al. (2012). Ancient admixture in human history. Genetics 192, 1065–1093. doi: 10.1534/genetics.112.145037
Peter B. M. (2016). Admixture, population structure, and f-statistics. Genetics 202, 1485–1501. doi: 10.1534/genetics.115.183913
Pickrell J. K., Pritchard J. K. (2012). Inference of population splits and mixtures from genome-wide allele frequency data. PloS Genet. 8, e1002967. doi: 10.1371/journal.pgen.1002967
Raghavan M., Skoglund P., Graf K. E., Metspalu M., Albrechtsen A., Moltke I., et al. (2014). Upper Palaeolithic Siberian genome reveals dual ancestry of Native Americans. Nature 505, 87–91. doi: 10.1038/nature12736
Ren Y., Jia T., Cai Y., Zhang L., Zhang H., Wang Z. K., et al. (2023). Molecular genetics and quantitative traits divergence among populations of Eothenomys miletus from Hengduan Mountain region. Ecol. Evol. 13, e10370. doi: 10.1002/ece3.10370
Ronquist F., Teslenko M., van der Mark P., Ayres D. L., Darling A., Höhna S., et al. (2012). MrBayes 3.2: Efficient bayesian phylogenetic inference and model choice across a large model space. Systematic Biol. 61, 539–542. doi: 10.1093/sysbio/sys029
Stamatakis A. (2014). RAxML version 8: a tool for phylogenetic analysis and post-analysis of large phylogenies. Bioinformatics 30, 1312–1313. doi: 10.1093/bioinformatics/btu033
Tajima F. (1983). Evolutionary relationship of DNA sequences in finite populations. Genetics 105, 437–460. doi: 10.1093/genetics/105.2.437
Wang X., Gao C., Norgren R. B. (2001). Cellular interactions in the development of the olfactory system: an ablation and homotypic transplantation analysis. J. Neurobiol. 49, 29–39. doi: 10.1002/neu.1063
Wang X. Y., Liang D., Wang X. M., Tang M. K., Liu Y., Liu S. Y., et al. (2022). Phylogenomics reveals the evolution, biogeography, and diversification history of voles in the Hengduan Mountains. Commun. Biol. 5, 1124. doi: 10.1038/s42003-022-04108-y
Weir B. S., Cockerham C. C. (1984). Estimating f-statistics for the analysis of population structure. Evolution 38, 1358–1370. doi: 10.1111/j.1558-5646.1984.tb05657.x
Whitlock K. E., Westerfield M. (2000). The olfactory placodes of the zebrafish form by convergence of cellular fields at the edge of the neural plate. Dev. (Cambridge England) 127, 3645–3653. doi: 10.1242/dev.127.17.3645
Wu Q., Zheng P. P., Hu Y. B., Wei F. W. (2014). Genome-scale analysis of demographic history and adaptive selection. Protein Cell 5, 99–112. doi: 10.1007/s13238-013-0004-1
Xing Y. W., Ree R. H. (2017). Uplift-driven diversification in the Hengduan Mountains, a temperate biodiversity hotspot. Proc. Natl. Acad. Sci. United States America 114, E3444–E3451. doi: 10.1073/pnas.1616063114
Yan B. W., Zhu W. L. (2023). Research on feeding habits and stomach fungi in Eothenomys miletus from Hengduan mountain regions. Life Res. 6, 7–11. doi: 10.53388/LR20230011
Young C. G. (1935). Note on a mammalian migrofauna from Yenchingkou Near Wanhsien, Szechuan. Bull. Geological Soc. China 14, 247–248. doi: 10.1111/j.1755-6724.1935.mp14002007.x
Yuan J. Q., Wang G. Q., Zhao L., Kitchener A. C., Sun T., Chen W., et al. (2023). How genomic insights into the evolutionary history of clouded leopards inform their conservation. Sci. Adv. 9, 9143. doi: 10.1126/sciadv.adh9143
Yue W. P., Chen F., Davi N. K., Zhang H. L., Chen Y. P., Zhao X. E., et al. (2024). Little ice age cooling in the western Hengduan mountains, China: a 600-year warm-season temperature reconstruction from tree rings. Climate Dynamics 62, 773–790. doi: 10.1007/s00382-023-06932-2
Zhang R., Liu X. D. (2010). The effects of tectonic uplift on the evolution of Asian summer monsoon climate since Pliocene. Chin. J. Geophysics Chin. Edition 53, 2817–2828. doi: 10.3969/j.issn.0001-5733.2010.12.004
Zhang S. J., Wang G. D., Ma P. C., Zhang L. L., Yin T. T., Liu Y. H., et al. (2020). Genomic regions under selection in the feralization of the dingoes. Nat. Commun. 11, 671. doi: 10.1038/s41467-020-14515-6
Zheng Y., Janke A. (2018). Gene flow analysis method, the D-statistic, is robust in a wide parameter space. BMC Bioinf. 19, 10. doi: 10.1186/s12859-017-2002-4
Zhi S. A., Kutzbach J. E., Prell W. L., Porter S. C. (2001). Evolution of Asian monsoons and phased uplift of the Himalaya-Tibetan plateau since Late Miocene times. Nature 411, 62–66. doi: 10.1038/35075035
Zhou Y. Y., Zhou B., Pache L., Chang M., Khodabakhshi A. H., Tanaseichuk O., et al. (2019). Metascape provides a biologist-oriented resource for the analysis of systems-level datasets. Nat. Commun. 10, 1523. doi: 10.1038/s41467-019-09234-6
Zhu W. L., Cai J. H., Xiao L., Wang Z. K. (2011). Effects of photoperiod on energy intake, thermogenesis and body mass in Eothenomys miletus in Hengduan Mountain region. J. Thermal Biol. 36, 380–385. doi: 10.1016/j.jtherbio.2011.06.014
Zhu W. L., Jia T., Liu C. Y., Xiao L., Wang Z. K. (2008a). Seasonal changes in body mass and energy contents in Eothenomys miletus in Hengduan mountain region. Chin. J. Zoology 43, 134–138. doi: 10.13859/j.cjz.2008.05.016
Keywords: Eothenomys miletus, phylogenetic analysis, admixture, migration, adaptation
Citation: Cai Y, Jia T and Zhu W (2025) Exploration of migration directions in different populations of Eothenomys miletus in the Hengduan Mountains of Yunnan Province: a genome-based analysis. Front. Ecol. Evol. 13:1533205. doi: 10.3389/fevo.2025.1533205
Received: 23 November 2024; Accepted: 13 January 2025;
Published: 28 January 2025.
Edited by:
Ran Tian, Nanjing Normal University, ChinaCopyright © 2025 Cai, Jia and Zhu. This is an open-access article distributed under the terms of the Creative Commons Attribution License (CC BY). The use, distribution or reproduction in other forums is permitted, provided the original author(s) and the copyright owner(s) are credited and that the original publication in this journal is cited, in accordance with accepted academic practice. No use, distribution or reproduction is permitted which does not comply with these terms.
*Correspondence: Wanlong Zhu, endsXzgzMDdAMTYzLmNvbQ==
†These authors have contributed equally to this work