 Uğur Çabuk
 Ulrike Herzschuh
 Lars Harms
 Barbara von Hippel1
 Kathleen R. Stoof-Leichsenring
- 1Alfred Wegener Institute, Helmholtz Centre for Polar and Marine Research, Polar Terrestrial Environmental Systems, Potsdam, Germany
- 2Institute of Biochemistry and Biology, University of Potsdam, Potsdam, Germany
- 3Institute of Environmental Science and Geography, University of Potsdam, Potsdam, Germany
- 4Alfred Wegener Institute, Helmholtz Centre for Polar and Marine Research, Data Science Support, Bremerhaven, Germany
Sedimentary ancient DNA (sedaDNA) provides valuable insights into past ecosystems, yet its functional diversity has remained unexplored due to potential limitations in gene annotation for short-read data. Eukaryotes, especially, are typically underrepresented and have low coverage in complex metagenomic datasets from sediments. In this study, we evaluate the potential of eukaryotic gene annotation in sedimentary ancient DNA (sedaDNA) time-series data covering the last 23,000 years. We compared four gene annotation pipelines (GAPs) that apply Prodigal (ProkGAP) and MetaEuk (EukGAP) with and without taxonomic pre-classification. We identify ProkGAP as the pipeline which recovers the largest gene catalog with 6,568,483 functional genes and the highest number of eukaryotic functional genes (5,895 unique KEGG orthologs). Our findings show that ProkGAP, originally invented for prokaryotic gene prediction, yields the largest share of functional genes among all GAPs tested. At the same time, it allows the analysis of prokaryotic and eukaryotic gene functions in parallel and predicts most gene diversity. Interestingly, in our time-series data the gene catalog size and diversity show an increasing trend towards recent times indicating a more complex eukaryotic functional community during the Holocene. However, all gene annotation pipelines are limited by incomplete functional reference databases, which hamper the link between taxonomic-functional relationships when considering lower taxonomic levels. Future research on functional gene prediction from short read sedaDNA data should focus on expanding the eukaryotic databases and increasing sequencing depth to explore eukaryotic and prokaryotic functional composition and diversity in past ecosystems and their relationships to environmental change.
1 Introduction
Sedimentary ancient DNA (sedaDNA) is an established approach in paleoecology providing community compositions for the reconstruction of past ecosystems across decadal to millennial timescales (Parducci et al., 2019; Capo et al., 2021; Huang et al., 2021; Jia et al., 2024). In recent years, the short read metagenomic data derived from sedaDNA has convincingly been shown to identify temporal variation in eukaryotic communities using k-mer classifiers such as Kraken2 (Courtin et al., 2022; Perfumo et al., 2023; Zimmermann et al., 2023) or alignment-based classification tools (Pedersen et al., 2016; Wang et al., 2021; Liu et al., 2024). While the analysis of taxonomic dynamics from sedaDNA is increasingly understood, the potential to recover temporal functional dynamics is not fully explored. Characteristics such as short read length and low coverage of metagenomes, particularly in eukaryotic DNA derived from sediment DNA, challenge the prediction of functional genes. While micro-eukaryotes (Derelle et al., 2006) have a smaller genome size than multicellular eukaryotes, such as plants (Leushkin et al., 2013; Stevens et al., 2016), very few studies have focused on micro-eukaryotes, such as phytoplankton, to recover their functional repertoire from metagenomic data collected from surface ocean samples (Carradec et al., 2018; Sunagawa et al., 2020; Delmont et al., 2022; Duncan et al., 2022). However, testing gene prediction pipelines for functional composition of eukaryotes in general has not yet been applied to highly fragmented sedimentary ancient DNA data.
Basically, gene annotation pipelines (GAP) require longer DNA fragments to infer functional genes and their corresponding proteins from full or partial gene sequences (Tamames et al., 2019; Belliardo et al., 2022). Although some tools can directly predict short reads by translating them into amino acids, short read-based predictions are limited in detecting distant protein homologs (Wommack et al., 2008; Tamames et al., 2019) and gene prediction accuracy rate increases as the fragment length increases (Trimble et al., 2012; Zhang et al., 2017). To overcome these limitations, it is necessary to apply de novo assembly approaches that reconstruct longer sequences (contigs) using short DNA reads. For instance, MEGAHIT (Li et al., 2015) features a fast and memory-efficient approach making it ideal for large and complex metagenomic datasets with low coverage (Li et al., 2015; Georganas et al., 2018; Emiola and Oh, 2018). It also has a lower rate of misassembly than other assembler tools (van der Walt et al., 2017; Forouzan et al., 2018) or fewer errors with short contigs in the assembly for modern (Olson et al., 2019) and higher coverage for ancient DNA data (Klapper et al., 2023). Compared to short read data, assembly based tools such as PyDamage (Borry et al., 2021) can be applied for post-mortem damage analysis on the contig level providing estimates on their ancient origin.
The functional gene annotation of assemblies from metagenomic data is primarily focused on prokaryotes (Meyer et al., 2008; Kim et al., 2016; Chen et al., 2019; Morais et al., 2022). The prominent prokaryotic gene prediction tool Prodigal, stands out as a best-overall ranking tool for gene prediction in metagenomic data, particularly when dealing with short contigs (>=300 nucleotide) (DiMonaco et al., 2022) and for the discovery of eukaryotic genes (Delmont et al., 2022; Patin and Goodwin, 2022). Prodigal predicts genes by evaluating factors such as GC content and start codons, without relying on extrinsic data like reference databases (Hyatt et al., 2010; Hyatt et al., 2012). On the other hand, MetaEuk aims to improve eukaryotic gene detection by searching all possible reading frames (6-frame translation) of translated DNA fragments within contigs using reference databases (Levy Karin et al., 2020) and its reliance on the reference databases can limit the prediction of novel genes not presented in the databases. However, a direct comparative analysis between Prodigal and MetaEuk has yet to be undertaken. Eukaryotic sequences (even in low abundance) in metagenomic datasets (Delmont et al., 2011; Jacquiod et al., 2016; Delmont et al., 2022; Gabrielli et al., 2023), allow searching for eukaryotic genes in metagenomic data. Although kingdom-specific prediction algorithms are available, the shared ancestry between bacteria and eukaryotic mitochondria or chloroplasts (Zimorski et al., 2014) and the uneven abundance of eukaryotic and prokaryotic sequences in metagenomic data (Delmont et al., 2022) may require a pre-classification prior to the prediction step. Recently, pre-classification tools such as Tiara (Karlicki et al., 2022) and Eukrep (West et al., 2018) were developed. Tiara appears to outperform Eukrep because it manages more efficiently sequences of inter-kingdom ancestral complexity (Gabrielli et al., 2023).
Although the precision of eukaryotic gene prediction improved remarkably with new tools (Scalzitti et al., 2020; Bruna et al., 2024), the functional classification is still limited by existing databases. The eggNOG database (Huerta-Cepas et al., 2019) stands out as a comprehensive resource for functionally annotated proteins and includes diverse functional gene databases (Kyoto Encyclopedia of Genes and Genomes (KEGG) with orthologs (KO), Gene Ontology (GO), Protein Families (Pfam), etc.). Although the EggNOG database includes a limited number of eukaryotic taxa (477 genomes) compared to prokaryotes (25,038 genomes), it links the functional information to biological and metabolic pathways defined in the KEGG database (Kanehisa and Goto, 2000). Identifying functional and metabolic diversity in eukaryotes, such as carbon and nitrogen cycling (Stein, 2018; Alexander et al., 2023) or secondary metabolism, through time can provide substantial insights into the ecological role of taxa in changing ecosystems such as the terrestrial Arctic.
Our study exemplifies the investigation of functional dynamics in eukaryotes in a sediment record from Lake Lama, Siberia, Russia. Lake Lama is located in the tundra-taiga transition zone and the lake sediment core covers approximately the last 23,000 years, which includes the transition from the Last Glacial Maximum (LGM) to the Holocene (Andreev et al., 2004; von Hippel et al., 2023). Recently, a sedaDNA study from Lake Lama highlighted a shift in plant and fungal community composition due to increasing temperatures from the LGM to Holocene (von Hippel et al., 2022), suggesting a change in the eukaryotic functional diversity through time.
We compare four different functional gene annotation pipelines for their use in detecting functional eukaryotic genes in metagenomic shotgun sequencing from a sedaDNA dataset retrieved from Lake Lama spanning the last 23,000 years. Our investigation focuses on the (1) overall evaluation of the metagenome assembly and the potential of gene prediction tools using highly fragmented sedaDNA, (2) temporal diversity changes of functional genes from eukaryotic organisms, and (3) the validation of temporal taxonomic changes recovered by eukaryotic functional genes. Our study takes the initial steps towards adjusting functional gene annotation pipelines for sedaDNA metagenomic data.
2 Materials and methods
2.1 Study site
The sediment core samples were collected from Lake Lama, which is located on the Taymyr Peninsula, north-central Siberia, Russia (69.32°N, 90.12°E). The sediment core PG1341 was recovered from 66 m water depth and spans a composite core length of 18.85 m. Radiocarbon dating and age-depth modeling estimated an age of about 23,000 years for basal sediment samples of the core (von Hippel et al., 2023). Modern environmental and climatic conditions at the lake are characterized by long, severe winters and short summers. The annual precipitation ranges between 300 and 800 mm at different elevations and the modern temperatures are on average 12°C in July and −33°C in January (Volochanka weather station, distance to the lake: 147 km; Russian Institute of Hydrometeorological Information: World Data Center, 2021). The lake remains ice-covered from October to May with thawing commencing in May and taking approximately one month to complete. Based on this, winter is defined as lasting from October to May, while summer conditions are limited to the period from June to August (Kumke et al., 2005). The current catchment vegetation around Lake Lama is predominantly classified as taiga vegetation characterized by the prevalence of trees including Picea, Larix, and Betula, and shrubs including Alnus, and Salix, as well as dwarf shrubs (von Hippel et al., 2022).
2.2 SedaDNA extraction and sequencing
The core collection and subsampling procedure are described in detail in a previous study (von Hippel et al., 2022). DNA extraction and library preparation were conducted under stringent contamination control in a dedicated paleogenetic laboratory at the Alfred Wegener Institute, Helmholtz Centre for Polar and Marine Research in Potsdam, Germany. All sedaDNA was extracted with DNAeasy PowerMax Soil Kit (Qiagen, Germany) and the single strand DNA libraries were prepared following the Gansauge protocol (Gansauge and Meyer, 2013; Gansauge et al., 2017) with slight modifications of the protocol as described in (Schulte et al., 2021). The study encompassed four sequencing runs in total. Among these, the pools APMG37-38 underwent sequencing using the NovaSeq (2x100 bp) platform at Fasteris SA (Switzerland) while the remaining two runs were processed using the NextSeq 2000 (2x100 bp) platform at AWI Bremerhaven (Germany). In total, 77 libraries, including 42 samples, 6 extraction controls, and 13 library controls were sequenced. Sixteen samples out of 42 were sequenced twice (depth, age, and library information provided in Supplementary Table S1) and the raw sequencing results were merged for bioinformatic processing. Illumina paired-end sequencing of 42 samples (including resequencing) resulted in raw sequencing data with a total size of 2.77 billion paired-end reads. The raw read statistics are provided in Supplementary Table S2.
2.3 Data preprocessing
Raw sequencing data was filtered for low quality reads using FastQC v0.11.9 (Andrews, 2010) and paired-end reads were merged with Fastp v0.20.1 (Chen et al., 2018). PCR duplicates were removed using clumpify from BBtools v38.87 (Bushnell, 2014). The quality of reads before and after preprocessing was evaluated using FastQC v0.11.9 (Andrews, 2010). The resulting quality-checked merged and paired reads were used as input for the metagenome assembly. Subsequently, paired and merged reads were taxonomically classified using Kraken2 (Wood et al., 2019) and the nucleotide (nt) database (download in 2022) at a confidence threshold of 0.8 and a k-mer minimizer of 31nt. The taxonomic classifications were later used to compare taxonomic composition of short reads with the taxonomic origin of functional proteins identified by the annotation pipelines.
2.4 Metagenome assembly
For improving the assembly quality, an additional error-correction of quality-checked reads was performed using tadpole from BBtools v38.87 (Bushnell, 2014). After this, reads were assembled into contigs using MEGAHIT v1.2.9 (Li et al., 2015) with deviations from the default mode including: -minimum contig length: 300 and preset: meta-large and with the default k-mer. Subsequently, QUAST v5.2.0 (Gurevich et al., 2013) was used to obtain contigs statistics per sample including total number of contigs, contig length, and median length (N50).
2.5 Assessment of post mortem damage patterns
We used PyDamage v0.72 (Borry et al., 2021) to analyze damage patterns in contigs derived from de novo assemblies. PyDamage is specifically designed to identify and estimate characteristic damage in de novo assembly data, using a likelihood ratio test to distinguish between ancient and modern DNA (Borry et al., 2021). Initially, all quality-checked merged and paired reads were aligned to the assembly data using BWA-MEM v0.7.17 (Li and Durbin, 2009) with default parameters, followed by data conversion with Samtools v1.16.1 (Danecek et al., 2021) and BamTools 2.5.2 (Barnett et al., 2011). PyDamage was then executed with the analyze function, taking the final alignment output (BAM file) as input.
The contigs from each sample assembly were taxonomically classified using Kraken2 with the nt database at a 0-confidence threshold. Subsequently, the outputs from PyDamage and Kraken2 were combined in R. Eukaryotic and Streptophyta contigs with a length of min. 600 and a prediction accuracy of min. 0.5 were selected for further analysis. The mean frequency of C-to-T substitutions across positions was calculated for all samples. Additionally, the first positions of C-to-T substitutions in the contigs were extracted, and linear regression at the first position changes over time was performed using the R vegan package (Oksanen et al., 2022). All figures are visualized in R.
2.6 Gene prediction
After the metagenome assembly step, we applied four different gene prediction pipelines for the downstream analysis. The pipelines are 1. ProkGAP without any prior taxonomic pre-classification of the contigs, 2. ProkGAP including a pre-classification of contigs into pro- or (called hereafter: Pre-class ProkGAP), 3. EukGAP without any prior taxonomic pre-classification of the contigs and 4. EukGAP including a pre-classification of contigs into pro- or eukaryotic contigs (called hereafter: Pre-class EukGAP).
2.6.1 ProkGAP
The ProkGAP pipeline uses the gene prediction tool Prodigal v2.6.3 (Hyatt et al., 2012) with parameters -g 1 -p meta. The p parameter defines the metagenomic data and parameter g incorporates the translation table in gene prediction. We used ‘the standard code’ for parameter g, adhering to the National Center for Biotechnology Information (NCBI) genetic code guidelines, where Adenine-Uracil-Guanine (AUG) defines the initial codon.
2.6.2 EukGAP
The EukGAP pipeline uses MetaEuk v6-a5d39d9 (Levy Karin et al., 2020) for gene prediction. MetaEuk is a reference-based tool to discover protein-coding genes, both single- and multi-exon, within eukaryotic metagenomic datasets. We used the Uniref50 database, which was built using the following parameters –min-ungapped-score 35 –min-exon-aa 20 –min-length 40 (default setting: –min-exon-aa 11, –min-length 15, –min-ungapped-score 15). The Uniref50 database was selected as it improves sensitivity in identifying distant proteins, which makes it particularly advantageous for large-scale analyses or when dealing with poorly characterized organisms (Suzek et al., 2015).
2.6.3 Contig pre-classification-based GAP
Tiara v1.0.3 (Karlicki et al., 2022) was used to pre-classify the assembly into prokaryotic (bacteria and archaea) and eukaryotic contigs. Tiara is a deep learning-based classification tool that performs a classification approach for the eukaryotic origin of contigs. It classifies contigs to kingdom level (Archaea, Bacteria, Prokarya, nuclear and organelle Eukaryotes) or as unknown taxonomy. Tiara was run with default parameters except for –min_len 300 (default 3000). We aggregated all contigs classified as eukaryotes and both pipelines (ProkGAP and EukGAP) were implemented on eukaryotic and prokaryotic bins.
2.7 Functional gene/protein catalog
The four functional redundant catalogs were generated from the prediction pipelines (Figure 1) and present the functional diversity at gene and protein level aggregated from all sediment core samples. The non-redundant protein catalogs were built by clustering the proteins at a similarity threshold of 95% and an alignment coverage rate of 85% using CD-HIT v4.8.1 (Li and Godzik, 2006) with the default parameters except for -c 0.95 -G 0 -aS 0.85 -d 0 (default parameter: -c 0.9 -aS 0 -G 1 -d 20). Recent benchmarking studies have demonstrated that CD-HIT provides a reliable clustering algorithm for protein sequences and outcompetes UCLUST, VSEARCH, LinClust and others (Zou et al., 2020; Wei et al., 2023).
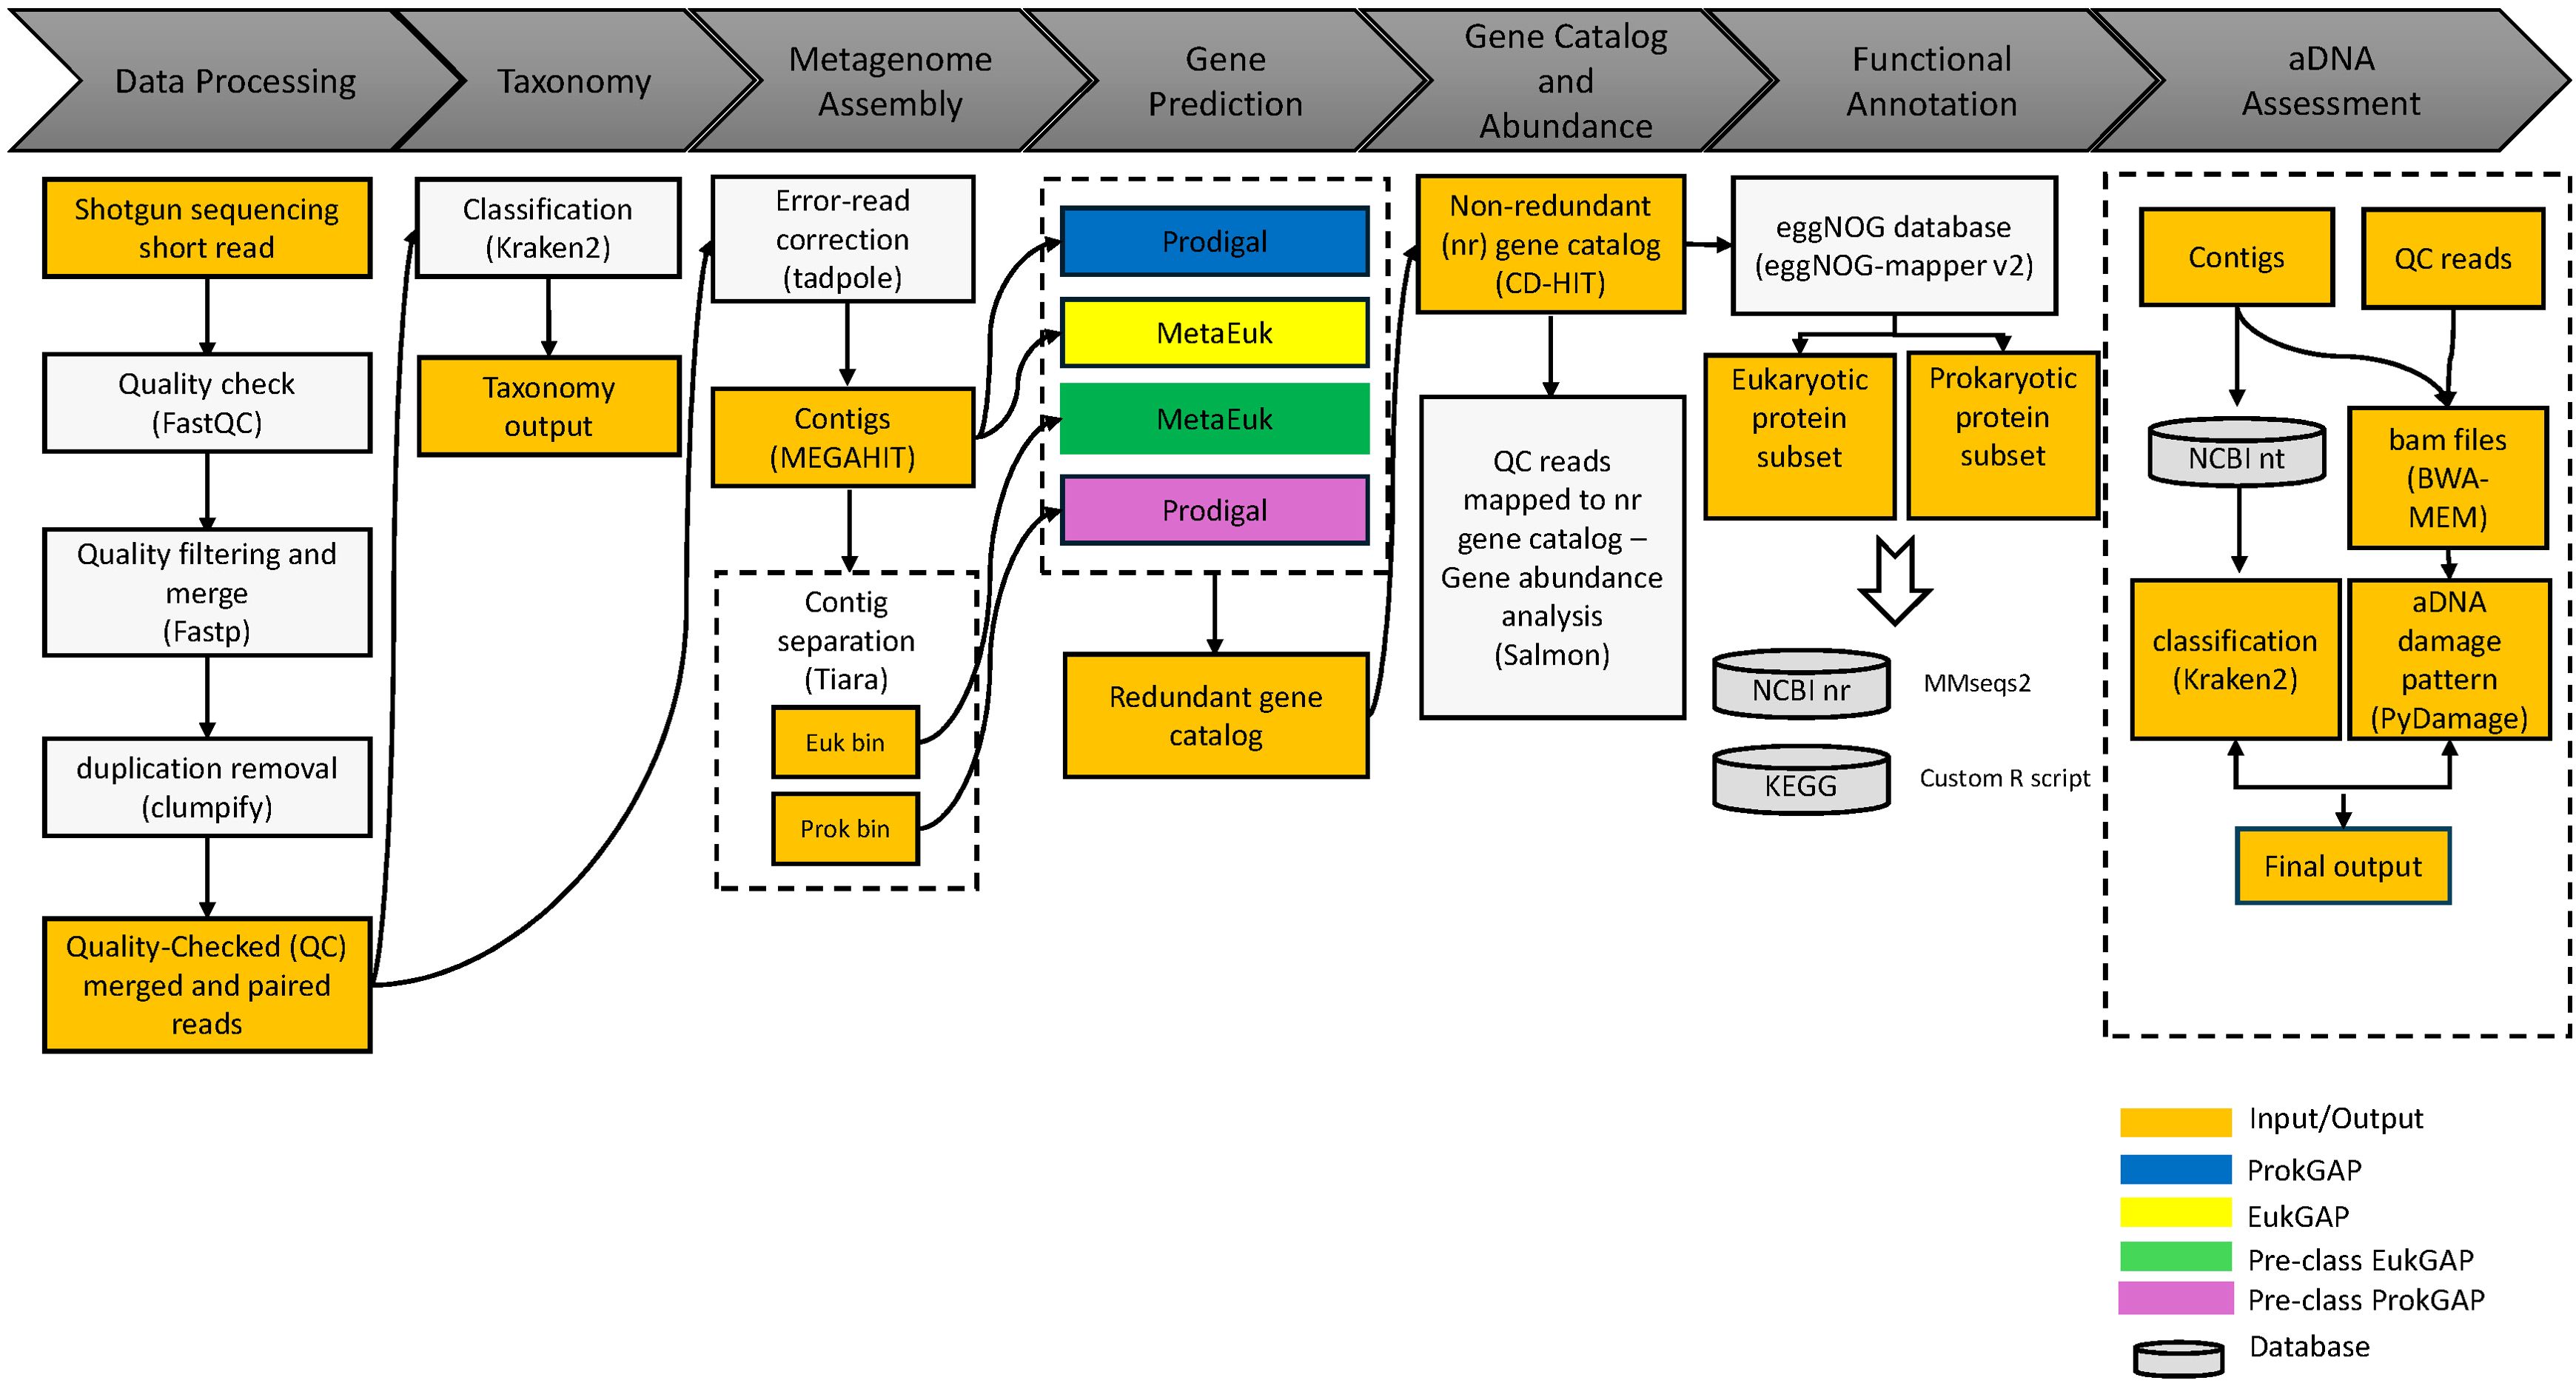
Figure 1. Metagenomic data processing using four functional gene annotation pipelines. Following metagenome assembly, the pipelines were identified as ProkGAP (blue), EukGAP (yellow), Pre-class EukGAP (green), and Pre-class ProkGAP (purple). The workflow started with the data processing: initial short-read quality checks using FASTQC (Andrews, 2010), followed by quality filtering and read merging with fastp (Chen et al., 2018), and deduplication using clumpify (Bushnell, 2014). Taxonomy classification of short reads was performed using Kraken2 (Wood et al., 2019), and error correction utilized tadpole (Bushnell, 2014) before metagenome assembly with MEGAHIT (Li et al., 2015). For the pre-classification prediction pipelines, Tiara (Karlicki et al., 2022) was performed for the contig separation. Gene prediction tools included Prodigal (Hyatt et al., 2012) for ProkGAP and Pre-class ProkGAP pipelines, and MetaEuk (Levy Karin et al., 2020) for EukGAP and Pre-class EukGAP pipelines. A non-redundant protein catalog was constructed using CD-HIT (Li and Godzik, 2006) from all predicted genes in each prediction pipelines. Gene abundances were estimated using Salmon (Patro et al., 2017) across the pipelines. Functional annotation was performed using eggNOG (Cantalapiedra et al., 2021) and eukaryotic protein taxonomy was re-assigned using MMseqs2 (Steinegger and Söding, 2017). Additionally, aDNA post-mortem damage workflow including bwa (Li and Durbin, 2009), PyDamage (Borry et al., 2021), and Kraken2 (Wood et al., 2019) was applied to the assemblies.
2.8 Gene abundance estimation
The corresponding four non-redundant gene catalogs were used to estimate the gene abundance for each sample using the tool Salmon v1.10.1 (Patro et al., 2017) with the parameter –meta –libType IU for the quality-checked paired-reads and –meta –libType U for the quality-checked merged reads. Subsequently, the gene counts based on paired and merged reads were aggregated per sample. The gene abundance was normalized by calculating normalized gene count (NGC) values using the formula 1 (: reads mapped to ith gene, : ith gene length, N: total number of genes in the non-redundant catalog). To standardize the different gene catalog sizes across the pipelines, the formula was used to multiply by the number of genes in the dataset instead of one million.
2.9 Functional and taxonomic annotation
Protein functions from the four non-redundant protein catalogs were annotated using eggNOG-mapper v2.1.12 (Cantalapiedra et al., 2021) with the default parameter and Diamond mode against the eggNOG Orthologous Groups database v5.0 (Huerta-Cepas et al., 2019). The eggNOG-mapper offers three searching modes, Diamond, HMMER3, and MMseqs2. The default Diamond mode offers the best selection for speed and memory consumption amongst the modes (Cantalapiedra et al., 2021). The eggNOG database contains protein data from 4,445 representative bacteria, 168 archaea, 477 eukaryotic genomes, and 2,502 viruses. It integrates several annotations from multiple sources, including Kyoto Encyclopedia of Genes and Genomes (KEGG) including KEGG Orthologs (KO) (Kanehisa and Goto, 2000), Carbohydrate-active enzymes (CAZy) database (Drula et al., 2022), Pfam (Sonnhammer et al., 1997; Mistry et al., 2021), Gene Ontology (GO) (The Gene Ontology Consortium et al., 2023), and Cluster of Orthologous Groups (COG) categories (Galperin et al., 2021) and thus provides the currently most comprehensive functional database available. The eggNOG-mapper (Cantalapiedra et al., 2021) is integrated into the eggNOG database to perform query searches in the database and provides fast and highly accurate information based on several benchmarks (Yang et al., 2021).
The four gene annotation pipelines resulted in four datasets of proteins, which were finally assigned to eukaryotes in the eggNOG annotation step. In order to confirm the taxonomic assignment, we cross-checked the four protein datasets against the NCBI protein database, because taxonomic assignments in eggNOG are likely incomplete for eukaryotes. Therefore, a NCBI nr database (version September 2023) was built using MMseqs2 v14.7e284 (Steinegger and Söding, 2017) and eukaryotic proteins were searched using MMseqs2 with the parameters: mmseqs taxonomy -e 0.00001 –lca-mode 3 -s 5 –taxon-list 2759 (default setting: -e 1 -s 2).
Further, the four eggNOG outputs were analyzed according to their KEGG ortholog (KO) annotations. Proteins associated with multiple KO identifiers were discarded to reduce ambiguous annotations. Eukaryotic and prokaryotic proteins based on the eggNOG taxonomy for each of the four pipelines, a total of eight datasets, were used for the KO diversity and pathway time-series analysis. The number of unique KOs from the eight datasets was used as an estimate of the KO diversity. Total diversity of the eight datasets and their intersection are visualized using Venn diagrams. Sample-wise, eukaryotic KO richness was resampled to correct for differences in gene abundance and visualized in a bar plot showing changes in KO richness over time.
The relative abundance of KOs over time from the eight datasets was calculated using the NGC values from the gene abundance estimation. Further, we inferred KEGG pathways from KO annotations by using the KEGG database (Kanehisa and Goto, 2000) with a custom R script. KEGG pathways related to human diseases were discarded from the datasets. KOs associated with Streptophyta phylum from the KEGG Photosynthesis pathway were extracted. A heatmap of the KOs in the photosynthesis pathway was plotted across the four prediction pipelines. Subsequently, their normalized gene counts (NGC) were summed up based on gene abundance estimations and aggregated at the pathway level and visualized using a bar plot over time.
2.10 Numerical analysis
Numerical analyses and graphics were conducted with the open-source software R v4.3.1 and Python v3.6.8. Venn and bar plots were prepared using the R packages ggplot2 v3.4.2 (Wickham, 2016), and ggvenn v0.1.10 (Yan, 2024). The NGC formula which was used to calculate the relative gene abundance from the non-redundant gene catalogs was implemented with a custom python script. Richness was calculated with resampling using the iNext v3 package (Hsieh et al., 2024) in R. Correlation tests between the resampled eukaryotic KO richness and the assembly statistics were performed with a Spearman correlation analysis in R providing correlation coefficient and p-values using the function ggpairs in the R package GGally v2.2.1 (Schloerke et al., 2024).
The correlation analysis was applied to the results of the taxonomic classification with Kraken2 and the protein classification based on the nr NCBI database using MMSeq2. The relative abundance of plant family datasets was calculated on the total subset of Streptophyta taxonomic assignments. The correlation of plant family taxonomy from the pipelines was assessed by a Spearman correlation analysis using the function cor, and the matrix was constructed using corrplot v0.92 (Wei and Simko, 2021).
3 Results
3.1 DNA sequencing results and assembly statistics
In this study, 42 sediment samples collected from the Lake Lama sediment core (PG1341) spanning the last 23,000 yr were prepared for shotgun sequencing using a single-stranded DNA library preparation (von Hippel, 2024). The 42 time slices can be distinguished into Glacial (11,501 to 23,000 yr) and Holocene (50 to 11,500 yr) samples. The raw sequencing output of the 42 samples comprises 5.54 billion reads in total. The extraction blanks yielded 18.75 million total read counts and the library blanks 74.90 million. After deduplication, the dataset accounts for 4.59 billion total reads. After quality filtering of merged and paired reads, the total sum of reads is 2.94 billion (Figure 2, Supplementary Figure S1, Supplementary Figure S2, and Supplementary Table S2). The de novo assembly of short read data into contigs (concatenated short reads into longer DNA contigs) is similar for the four different gene annotation pipelines (Figure 1) applied. After de novo assembly and error-correction of quality-checked and deduplicated merged and paired reads, 6,910,228 contigs in total are recovered across all 42 sample depths. Although the sequence depths were normalized when calculating abundance of genes, there is no significant difference in the raw read and assembly statistics between the different sequencing platforms (Wilcoxon rank sum test; p<0.05) (Supplementary Figure S3). The total sum of reads mapped to the contigs is 2.02 billion (Supplementary Figure S1).
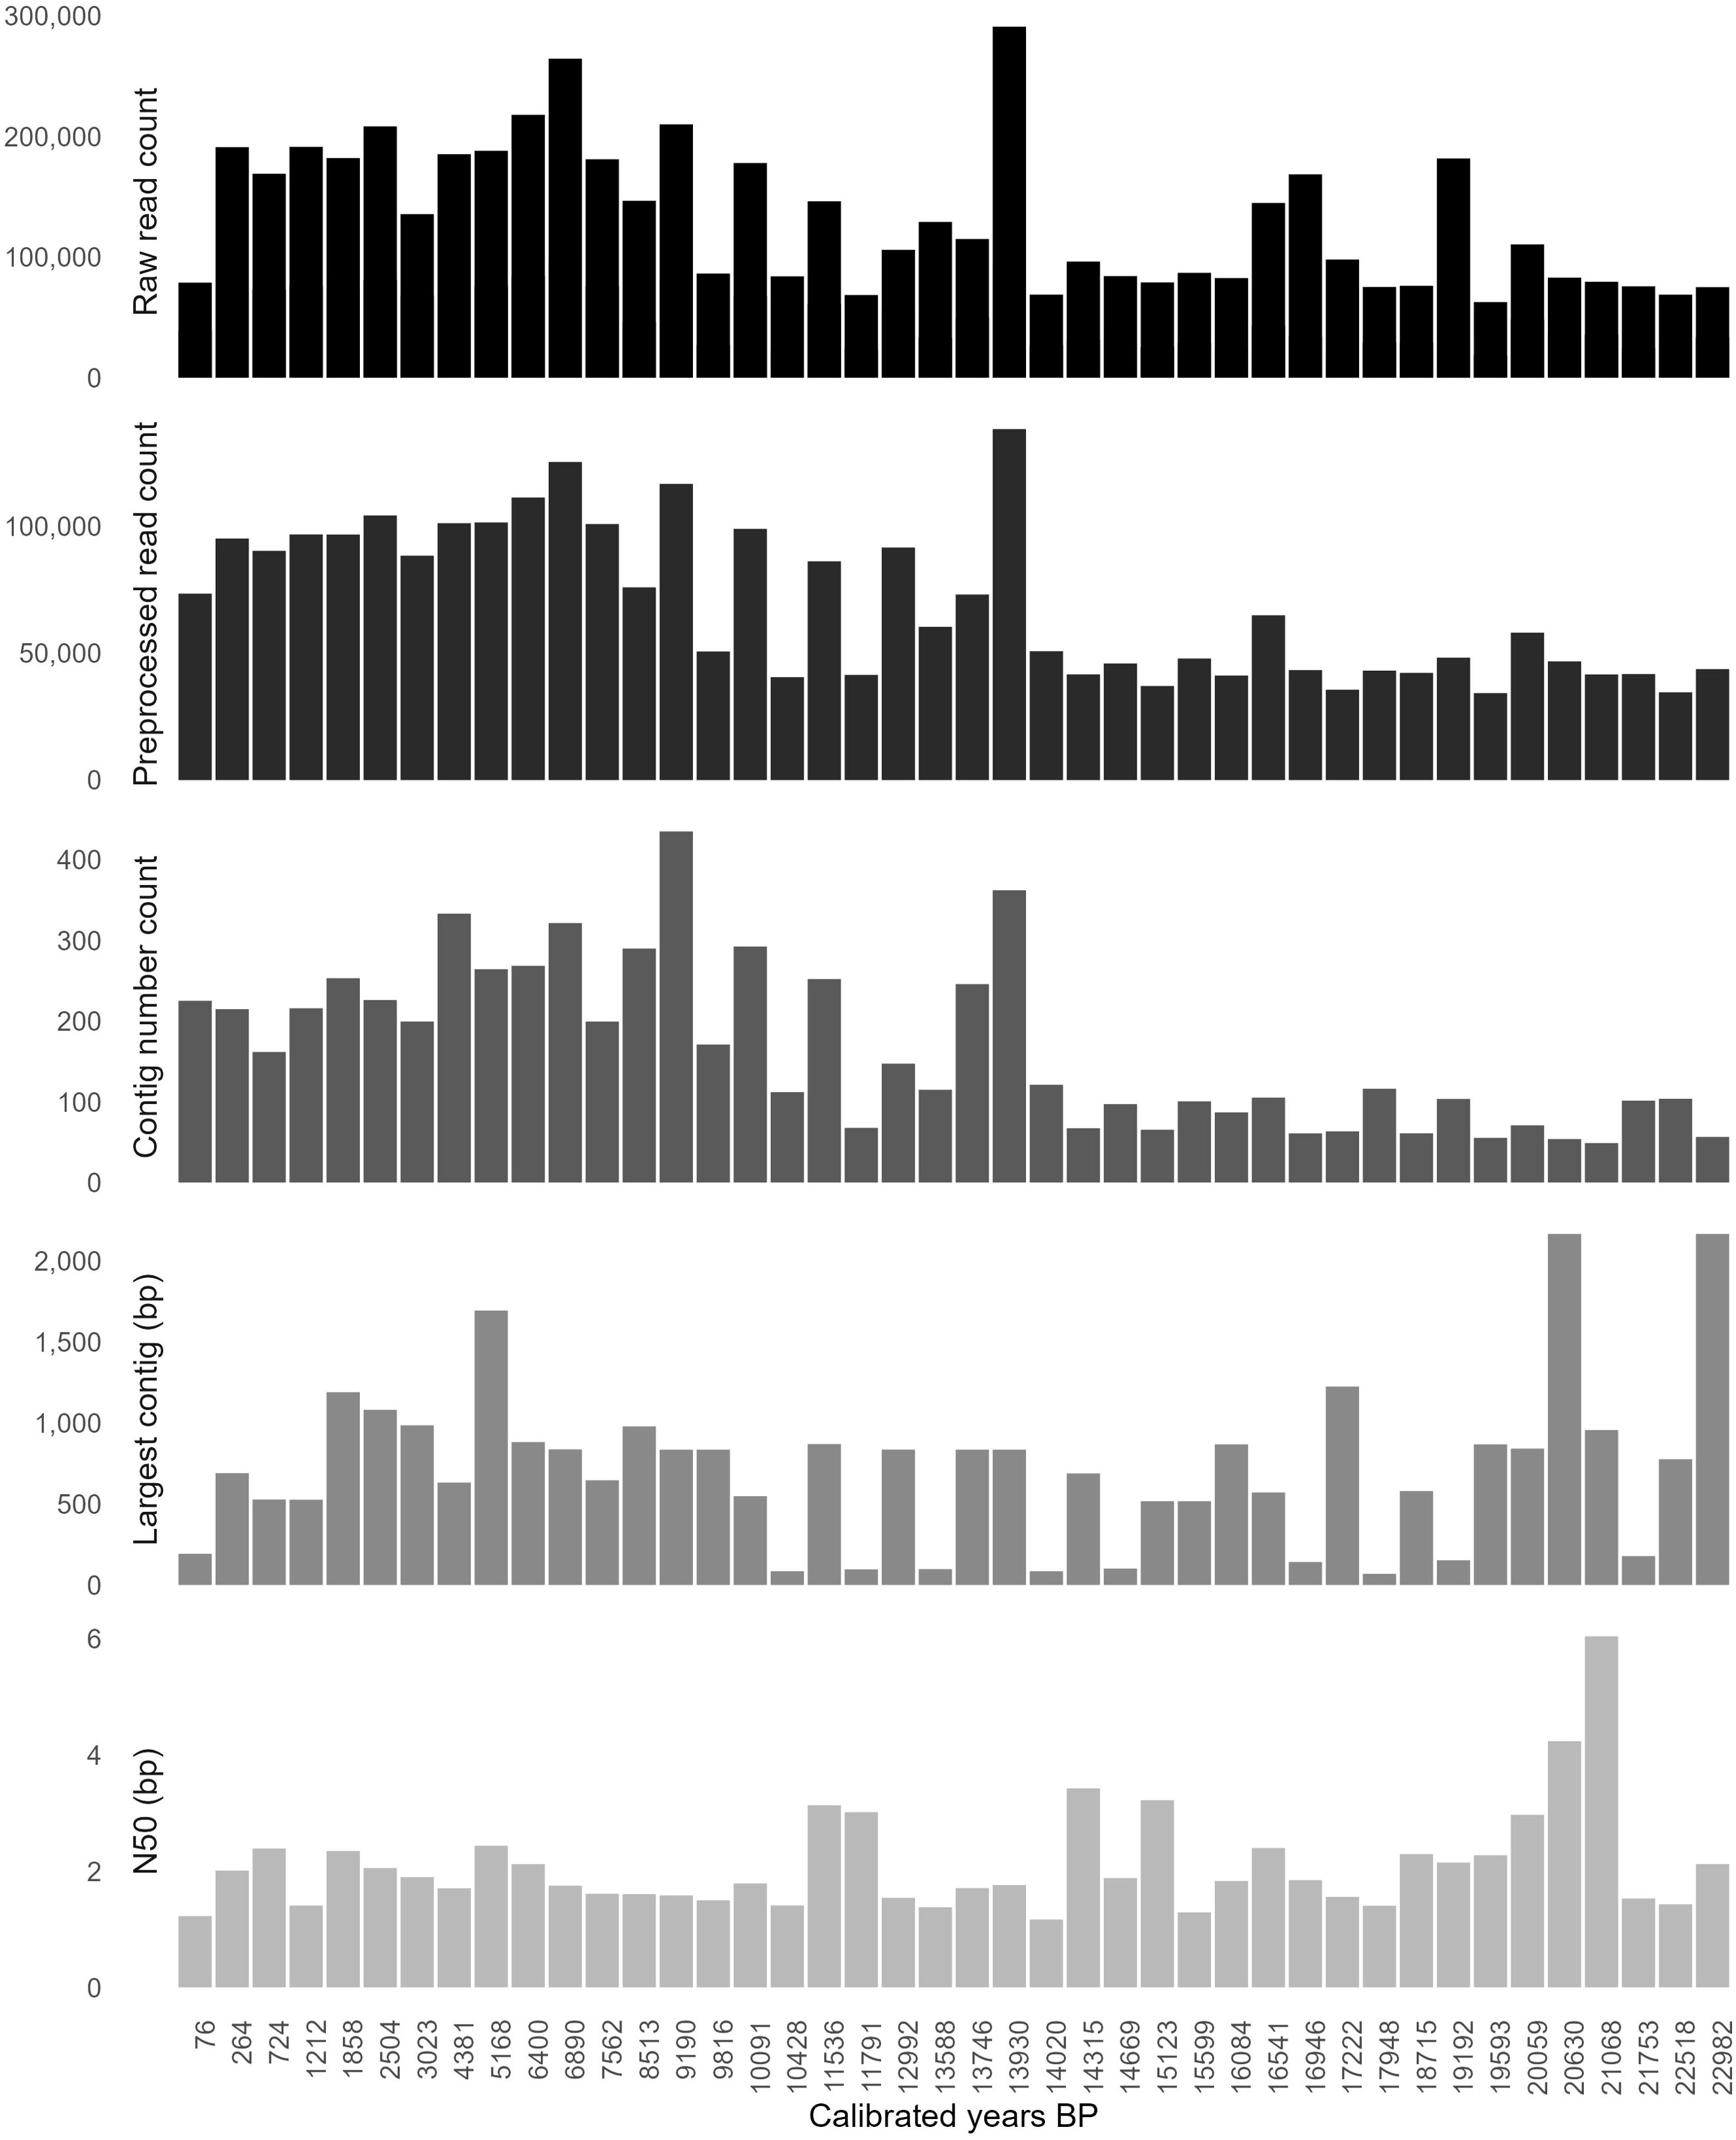
Figure 2. Raw sequencing results and assembly statistics in thousands (K). Raw sequencing counts, filtered counts, total contig number, largest contig length and median contig length (N50) in base-pairs (bp) are given across sample ages of the Lake Lama sediment core.
The assembly step for the extraction and library blanks failed due to the expected low quality of the sequencing data. Assembly statistics per lake sediment-core sample, summarizing number of contigs, contig length, and median contig length distribution (N50) are given in Figure 2, Supplementary Figure S1, and Supplementary Table S3. Generally, a higher number of raw reads and contigs is detected for the Holocene compared to the Glacial sediment samples, but slightly longer contigs with fewer raw read counts are detected in the Glacial samples. The median contig length over all samples is 565 bp.
3.2 Gene annotation pipelines and gene catalogs
After de novo assembly and four gene prediction pipelines, four functional catalogs (Figure 3) were created. The largest functional catalog comprising 12,878,757 redundant predicted proteins resulted from the ProkGAP. Of these, 6,568,483 proteins (51% of total) are clustered into the non-redundant functional catalog, which at this stage includes prokaryotic and eukaryotic proteins. A smaller functional catalog comprising 9,251,484 redundant proteins is recovered by the EukGAP. About 50% of proteins (4,631,120 proteins) cluster into a non-redundant catalog. The prediction pipelines that include taxonomic pre-classification, pre-classify eukaryotic and prokaryotic contigs from the de novo assembly step. Pre-class ProkGAP was then applied on the prokaryotic bin resulting in a functional catalog containing 11,715,853 redundant predicted proteins whereof 5,930,831 proteins (50% of total) cluster into a non-redundant functional catalog. The Pre-class EukGAP, which was applied to the eukaryotic bin, resulted in 494,779 redundant proteins, whereof 76% (380,105 proteins) cluster into a non-redundant functional catalog. The results show that the largest non-redundant functional catalog is created by ProkGAP compared to EukGAP and the predictions based on pre-classified contigs. The smallest functional catalog is retrieved from the Pre-class EukGAP.
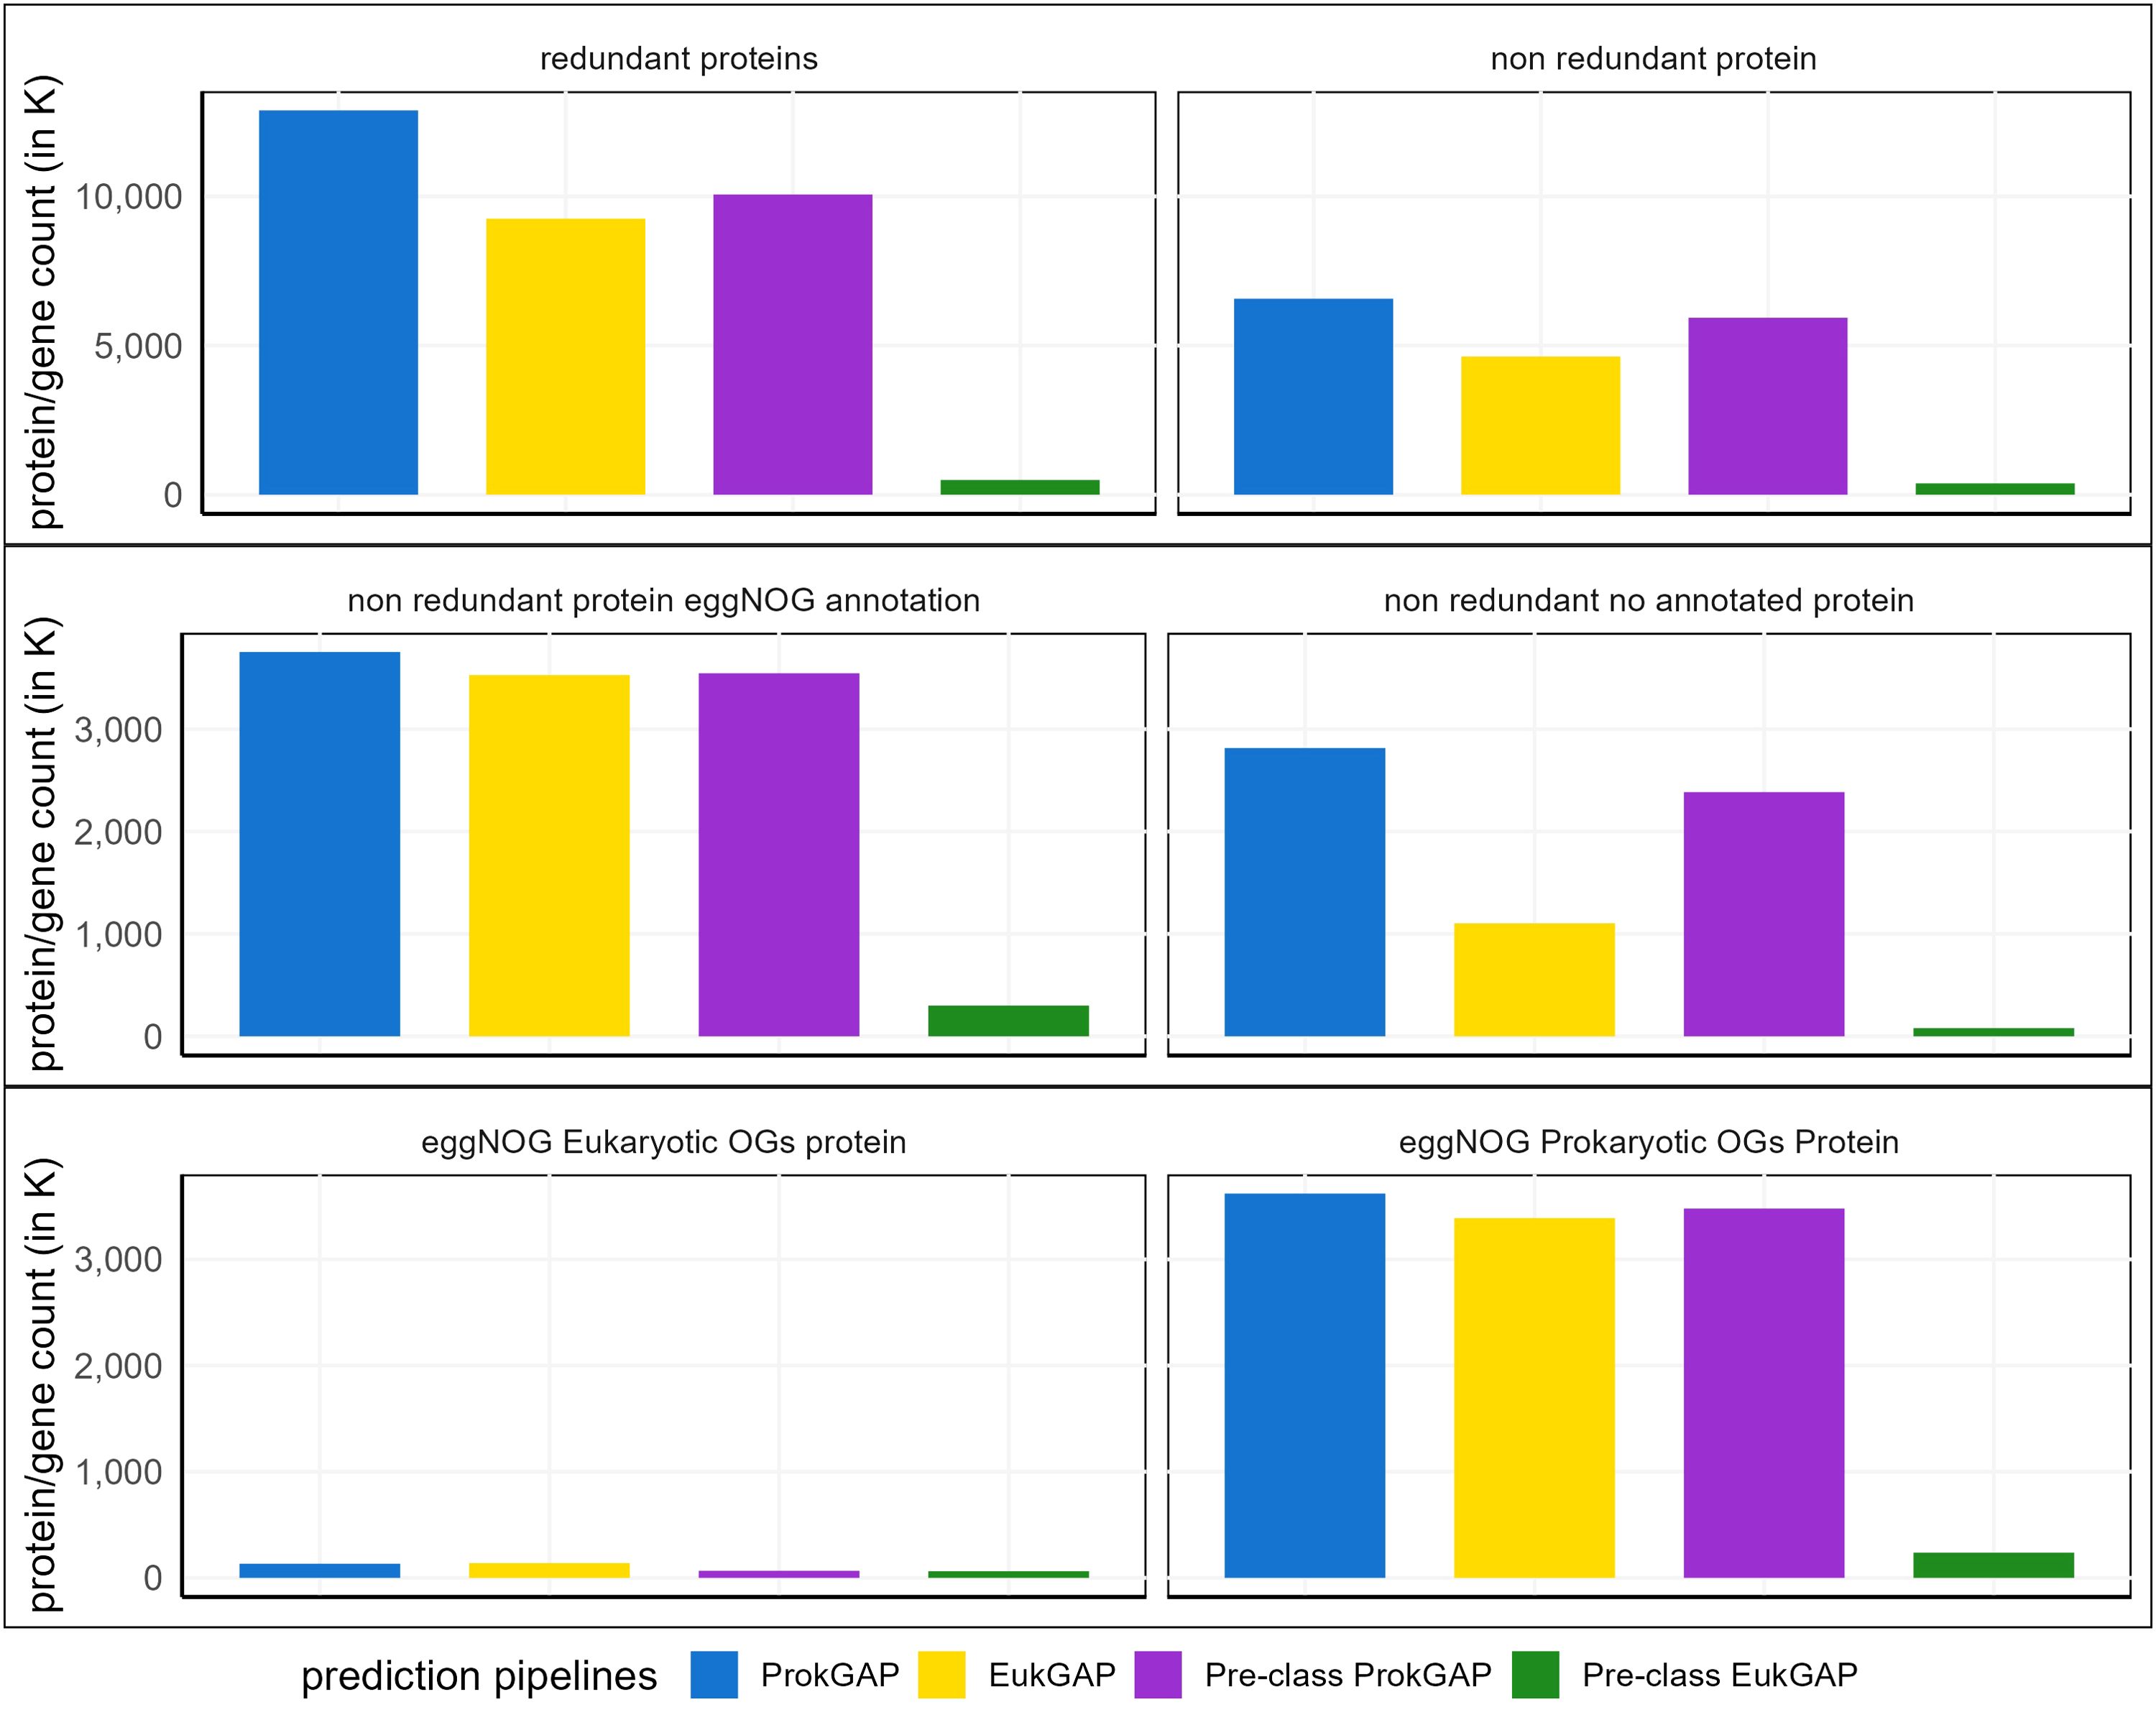
Figure 3. Functional protein catalogs derived from four prediction pipelines. The bar plot in thousands (K) compares the total protein/gene counts of redundant proteins vs non-redundant gene catalog, the total count of the eggNOG annotated vs unannotated proteins of the non-redundant gene catalog and the total count of eukaryotic vs prokaryotic orthologous genes (OG) from the eggNOG annotated catalog. Overall, ProkGAP predicted more proteins than the other pipelines in all comparisons while EukGAP predicted slightly more eukaryotic OG proteins than ProkGAP and the other prediction pipelines.
3.3 EggNOG annotation and gene abundance estimation
The total gene abundance was calculated by mapping short reads of each sample to the non-redundant gene catalogs (Supplementary Figure S4). Then, the gene abundance per sample was normalized by calculating the normalized gene count (NGC) (Figure 4, Supplementary Table S5). The normalized gene abundances were extracted for eukaryotic and prokaryotic datasets derived from the four prediction pipelines and its taxonomic identity based on the eggNOG assignments. The gene abundance variations through time for the gene annotation pipelines are visualized in Figure 4. The annotation steps using eggNOG reduce the size of the initial functional catalogs of the four prediction pipelines (Figure 3). For ProkGAP, 57.14% (3,753,367) of the non-redundant functional catalog is annotated with eggNOG, whereof 3.56% are eukaryotic and 96.44% prokaryotic proteins. For EukGAP, 76.17% (3,527,719 proteins) of the non-redundant functional catalog is annotated with eggNOG. Of these annotated proteins, 3.95% are eukaryotic, while 96.05% are prokaryotic. For the Pre-class ProkGAP, 59.79% (3,545,757 proteins) of the non-redundant functional catalog is annotated with eggNOG. Although this uses only prokaryotic contigs, still 1.89% of the annotated proteins are of eukaryotic origin. For the Pre-class EukGAP, 78.99% (300,240 proteins) of the non-redundant functional catalog is annotated with eggNOG. Although using only eukaryotic contigs in this pipeline, 79.10% of the annotated proteins originate from prokaryotes. The normalized gene abundance of annotated proteins within eggNOG resulting from prediction pipelines was calculated by weighting the abundance value based on their respective non-redundant gene catalog sizes. Across all datasets (including eggNOG, Gene, and KO subsets), with the exception of the eukaryotic gene subset, ProkGAP consistently yields the highest abundance values compared to EukGAP, Pre-class ProkGAP, and Pre-class EukGAP (Figure 4, Supplementary Figure S5). In contrast, within the eukaryotic gene subset, EukGAP shows slightly higher abundance than the other pipelines (Supplementary Figure S5).
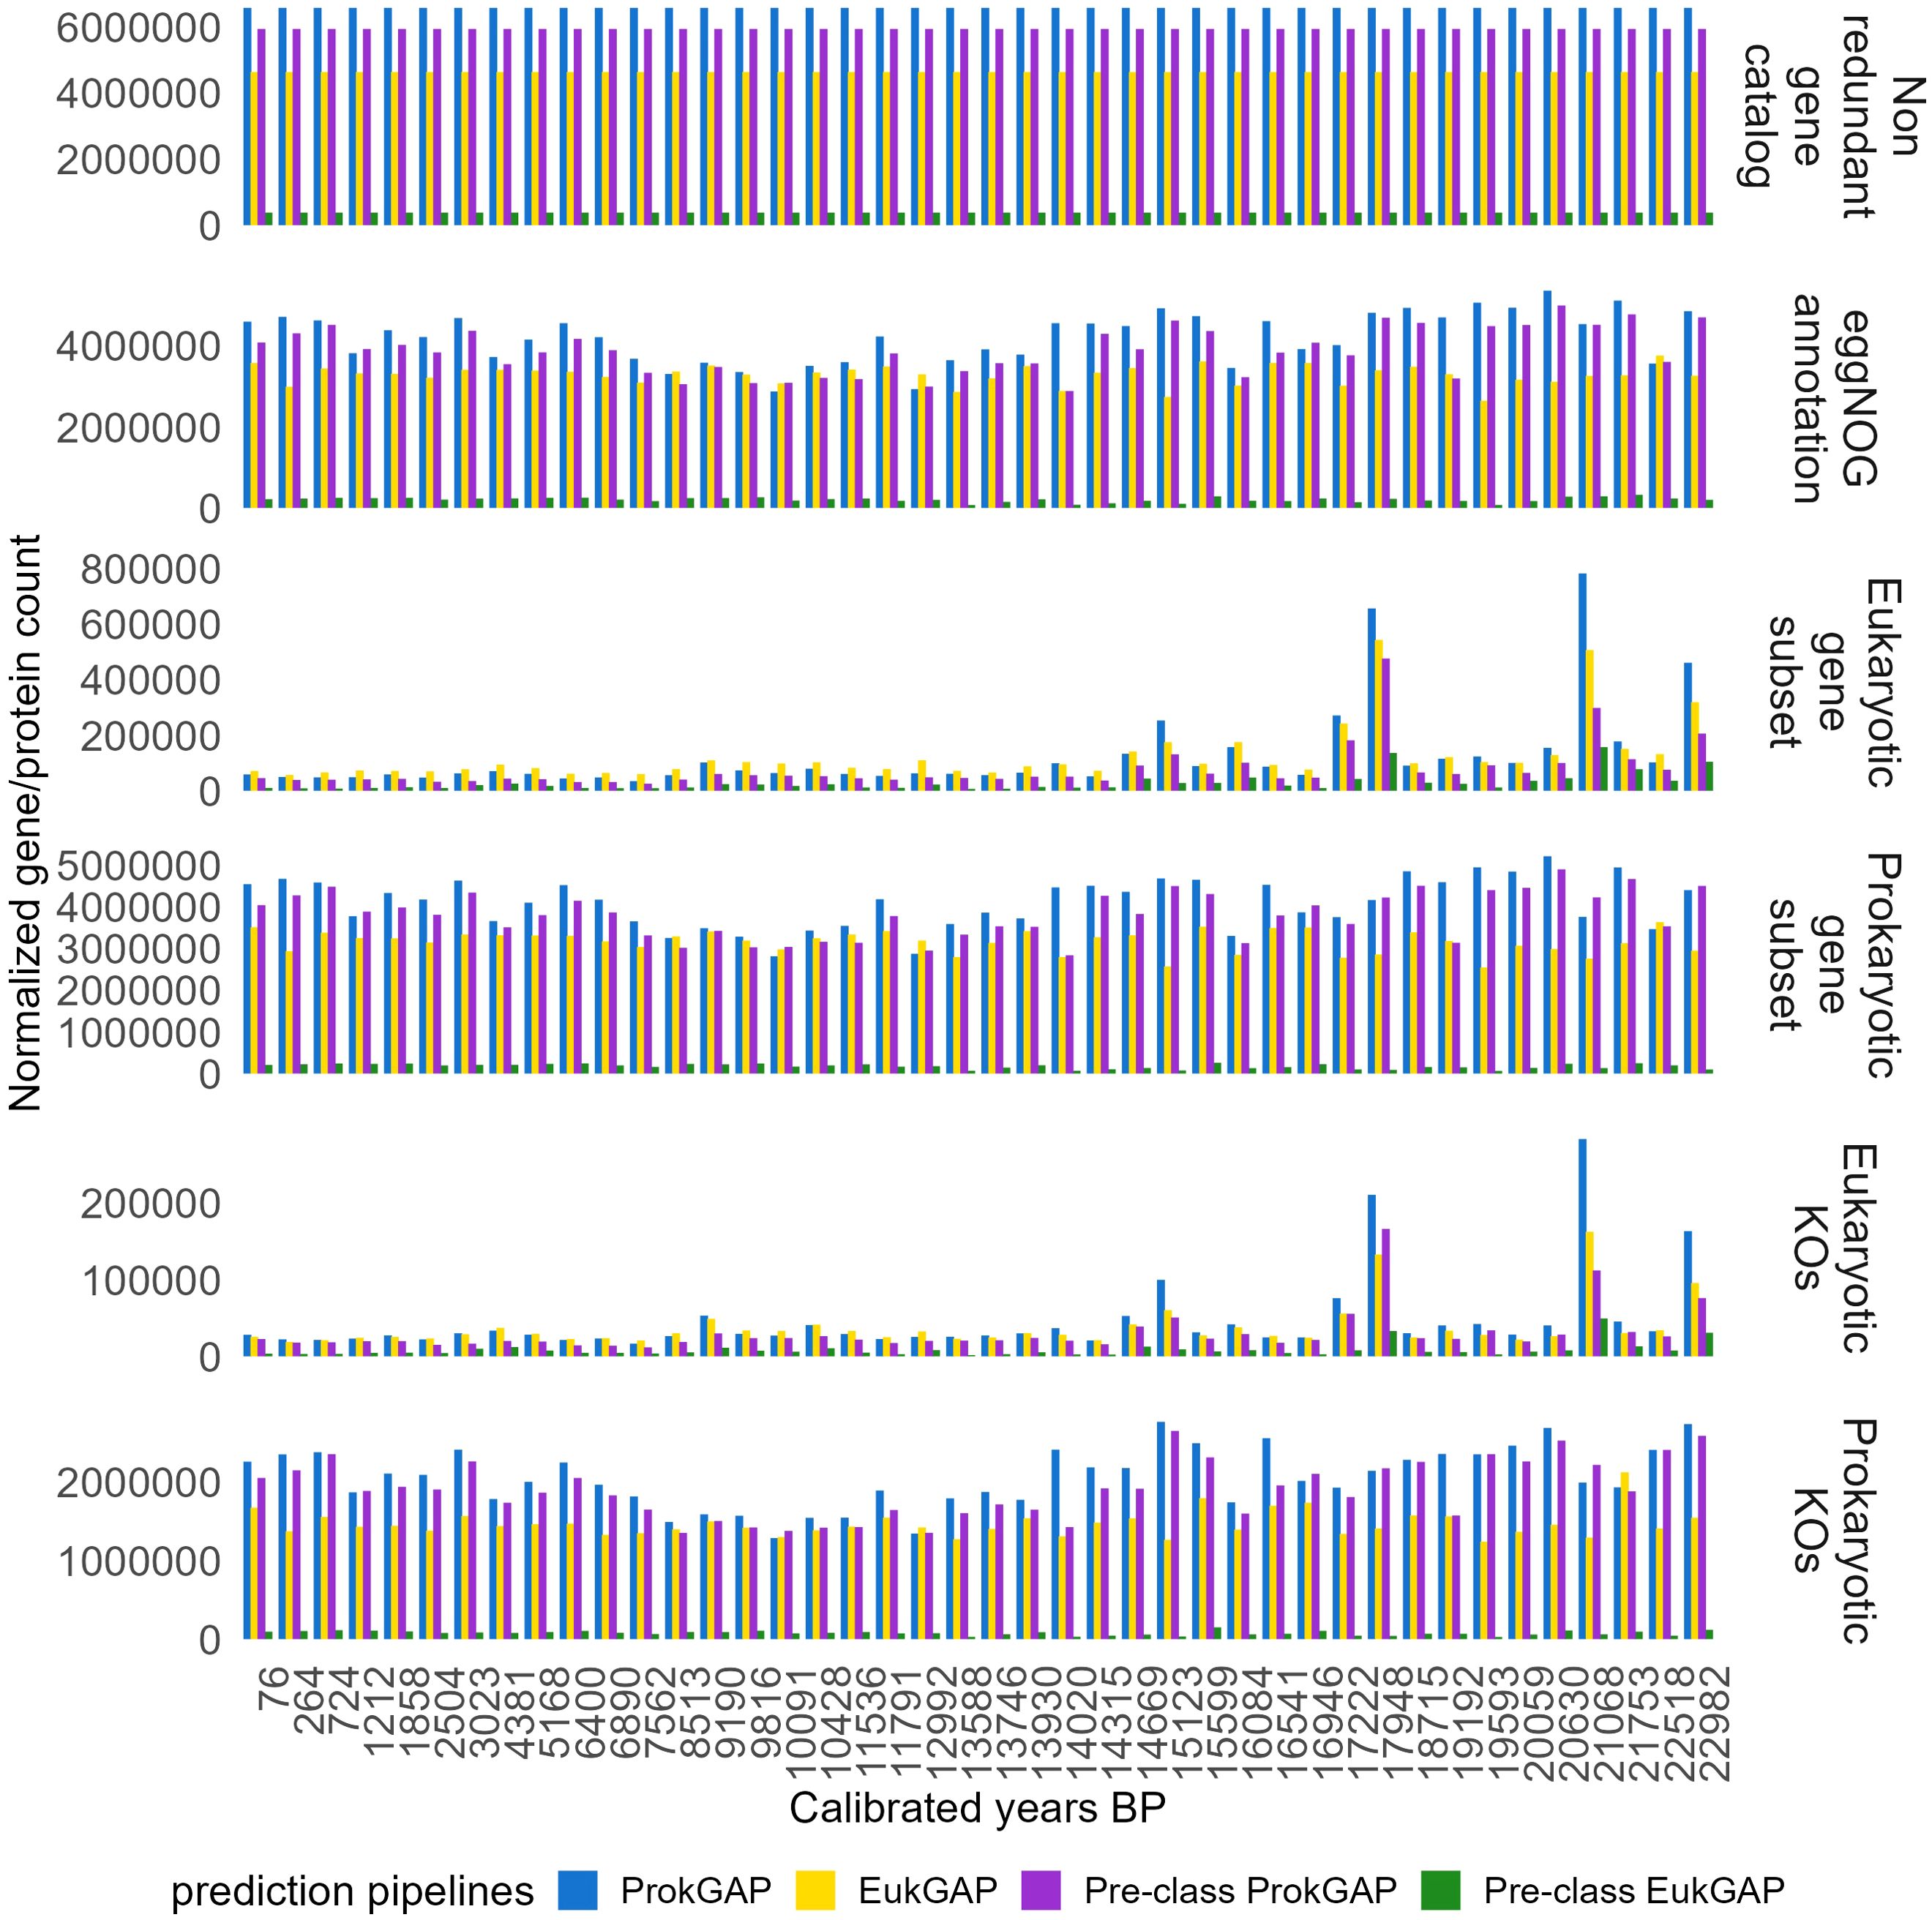
Figure 4. Gene abundances normalized to their gene catalog size. The temporal normalized gene count is given for the four prediction pipelines. The gene abundance was normalized by calculating normalized gene count (NGC) in the non-redundant gene catalog in each prediction pipeline and all subsets were derived from this abundance, respectively. In the ProkGAP, the normalized gene/protein counts resulted in the highest abundance across the pipelines based on their catalog size and showed a similar pattern in the subsets derived from the non-redundant gene catalog, with Glacial samples generally showing higher abundance compared to Holocene samples across all prediction pipelines.
3.4 KEGG ortholog annotation and diversity
KEGG ortholog (KO) diversity of annotated proteins was extracted from the eggNOG output. KOs of eukaryotic and prokaryotic protein subsets were compared and visualized in a Venn diagram (Figures 5A, B) and details are given in Supplementary Table S4. For ProkGAP, 47% of annotated proteins result in 1,756,228 KOs whereof 5,895 unique KOs relate to eukaryotes and 7,431 unique KOs to prokaryotes. In EukGAP, 46% of annotated proteins yield 1,609,173 KOs including 5,853 unique KOs related to eukaryotes and 7,377 unique KOs to prokaryotes. For the Pre-class ProkGAP, 47% of annotated proteins result in 1,662,141 KOs whereof 4,753 unique KOs relate to eukaryotes and 7,397 unique KOs to prokaryotes. Regarding the Pre-class EukGAP, 44% of annotated proteins result in 130,678 KOs, comprising 5,139 unique KOs related to eukaryotes and 5,212 unique KOs to prokaryotes.

Figure 5. (A) Eukaryotic and prokaryotic KEGG ortholog (KO) diversity compared between the four prediction pipelines. The Venn diagram shows the shared and unique proportions of KO diversity in the eukaryotic (total KOs=6244) vs prokaryotic (total KOs=7481) bin. (B) Share of KOs between all eukaryotic and prokaryotic datasets.
In total, 6,244 unique KOs are identified for the eukaryotic datasets whereof 3,911 KOs (62.6%) are detected in all prediction pipelines. ProkGAP covers the largest proportion of all KOs identified (94.41% of total KOs). EukGAP covers fewer KOs (93.74% of total KOs). Still the highest number of unique KOs is recovered by ProkGAP (2.7%, 171 KOs) while EukGAP, Pre-class EukGAP, and Pre-class ProkGAP reveal 83 (1.13%), 36 (0.6%), and 6 (0.1%) unique KOs, respectively. The comparison between ProkGAP and EukGAP reveals a higher number of unique KOs (348, 5.5%) in ProkGAP, whereas 306 (4.8%) unique KOs are found using EukGAP.
In the Venn diagram representing prokaryotic protein subsets, a total of 7,481 unique KOs is identified (Figure 5). Of these, 5,172 KOs (69.1%) are identified across all pipelines. ProkGAP covers 99.3% of all identified KOs, while EukGAP covers 98.6%. The Pre-class ProkGAP and Pre-class EukGAP include fewer KOs at 98.9% and 69.7%, respectively. Among these pipelines, EukGAP identifies the highest number of unique KOs (0.5%, 35 KOs), followed by ProkGAP (0.1%, 11 KOs), Pre-class ProkGAP (0.01%, 1 KO), and Pre-class EukGAP (0.1%, 4 KOs). The comparison between ProkGAP and EukGAP reveals a higher number of unique KOs (99,1.2%) in ProkGAP than in EukGAP (45 0.6%). In total, the dataset derived from all prediction pipelines shows that 1,465 (11.9%) KOs are shared among eukaryotes and prokaryotes. In contrast, 4,779 (39%) unique KOs are found only in the eukaryotic subset, while 6,016 KOs (49.1%) belong exclusively to the prokaryotic subset. Both KO subsets of normalized gene abundance over time among the pipelines show that ProkGAP has a higher normalized abundance (Figure 4, Supplementary Figure S5). For the KO richness of eukaryotic protein subsets from the prediction pipelines, ProkGAP gives higher richness than the EukGAP and pre-class pipelines. ProkGAP outperforms other prediction tools for the recovery of eukaryotic KO diversity (Figure 6, Supplementary Figure S6). Pairwise Spearman correlations reveal a strong positive correlation between resampled eukaryotic KO richness and contig number (R=0.498, p<0.001). All the prediction pipelines (except Pre-class EukGAP) show a strong positive correlation trend for resampled eukaryotic KOs richness with contig number (Supplementary Figure S7). A Wilcoxon rank sum test on the ProkGAP data indicated a higher resampled eukaryotic KO richness in the Holocene (median= 2792.98) compared to the Glacial (median=2095.56) (p=0.00115).
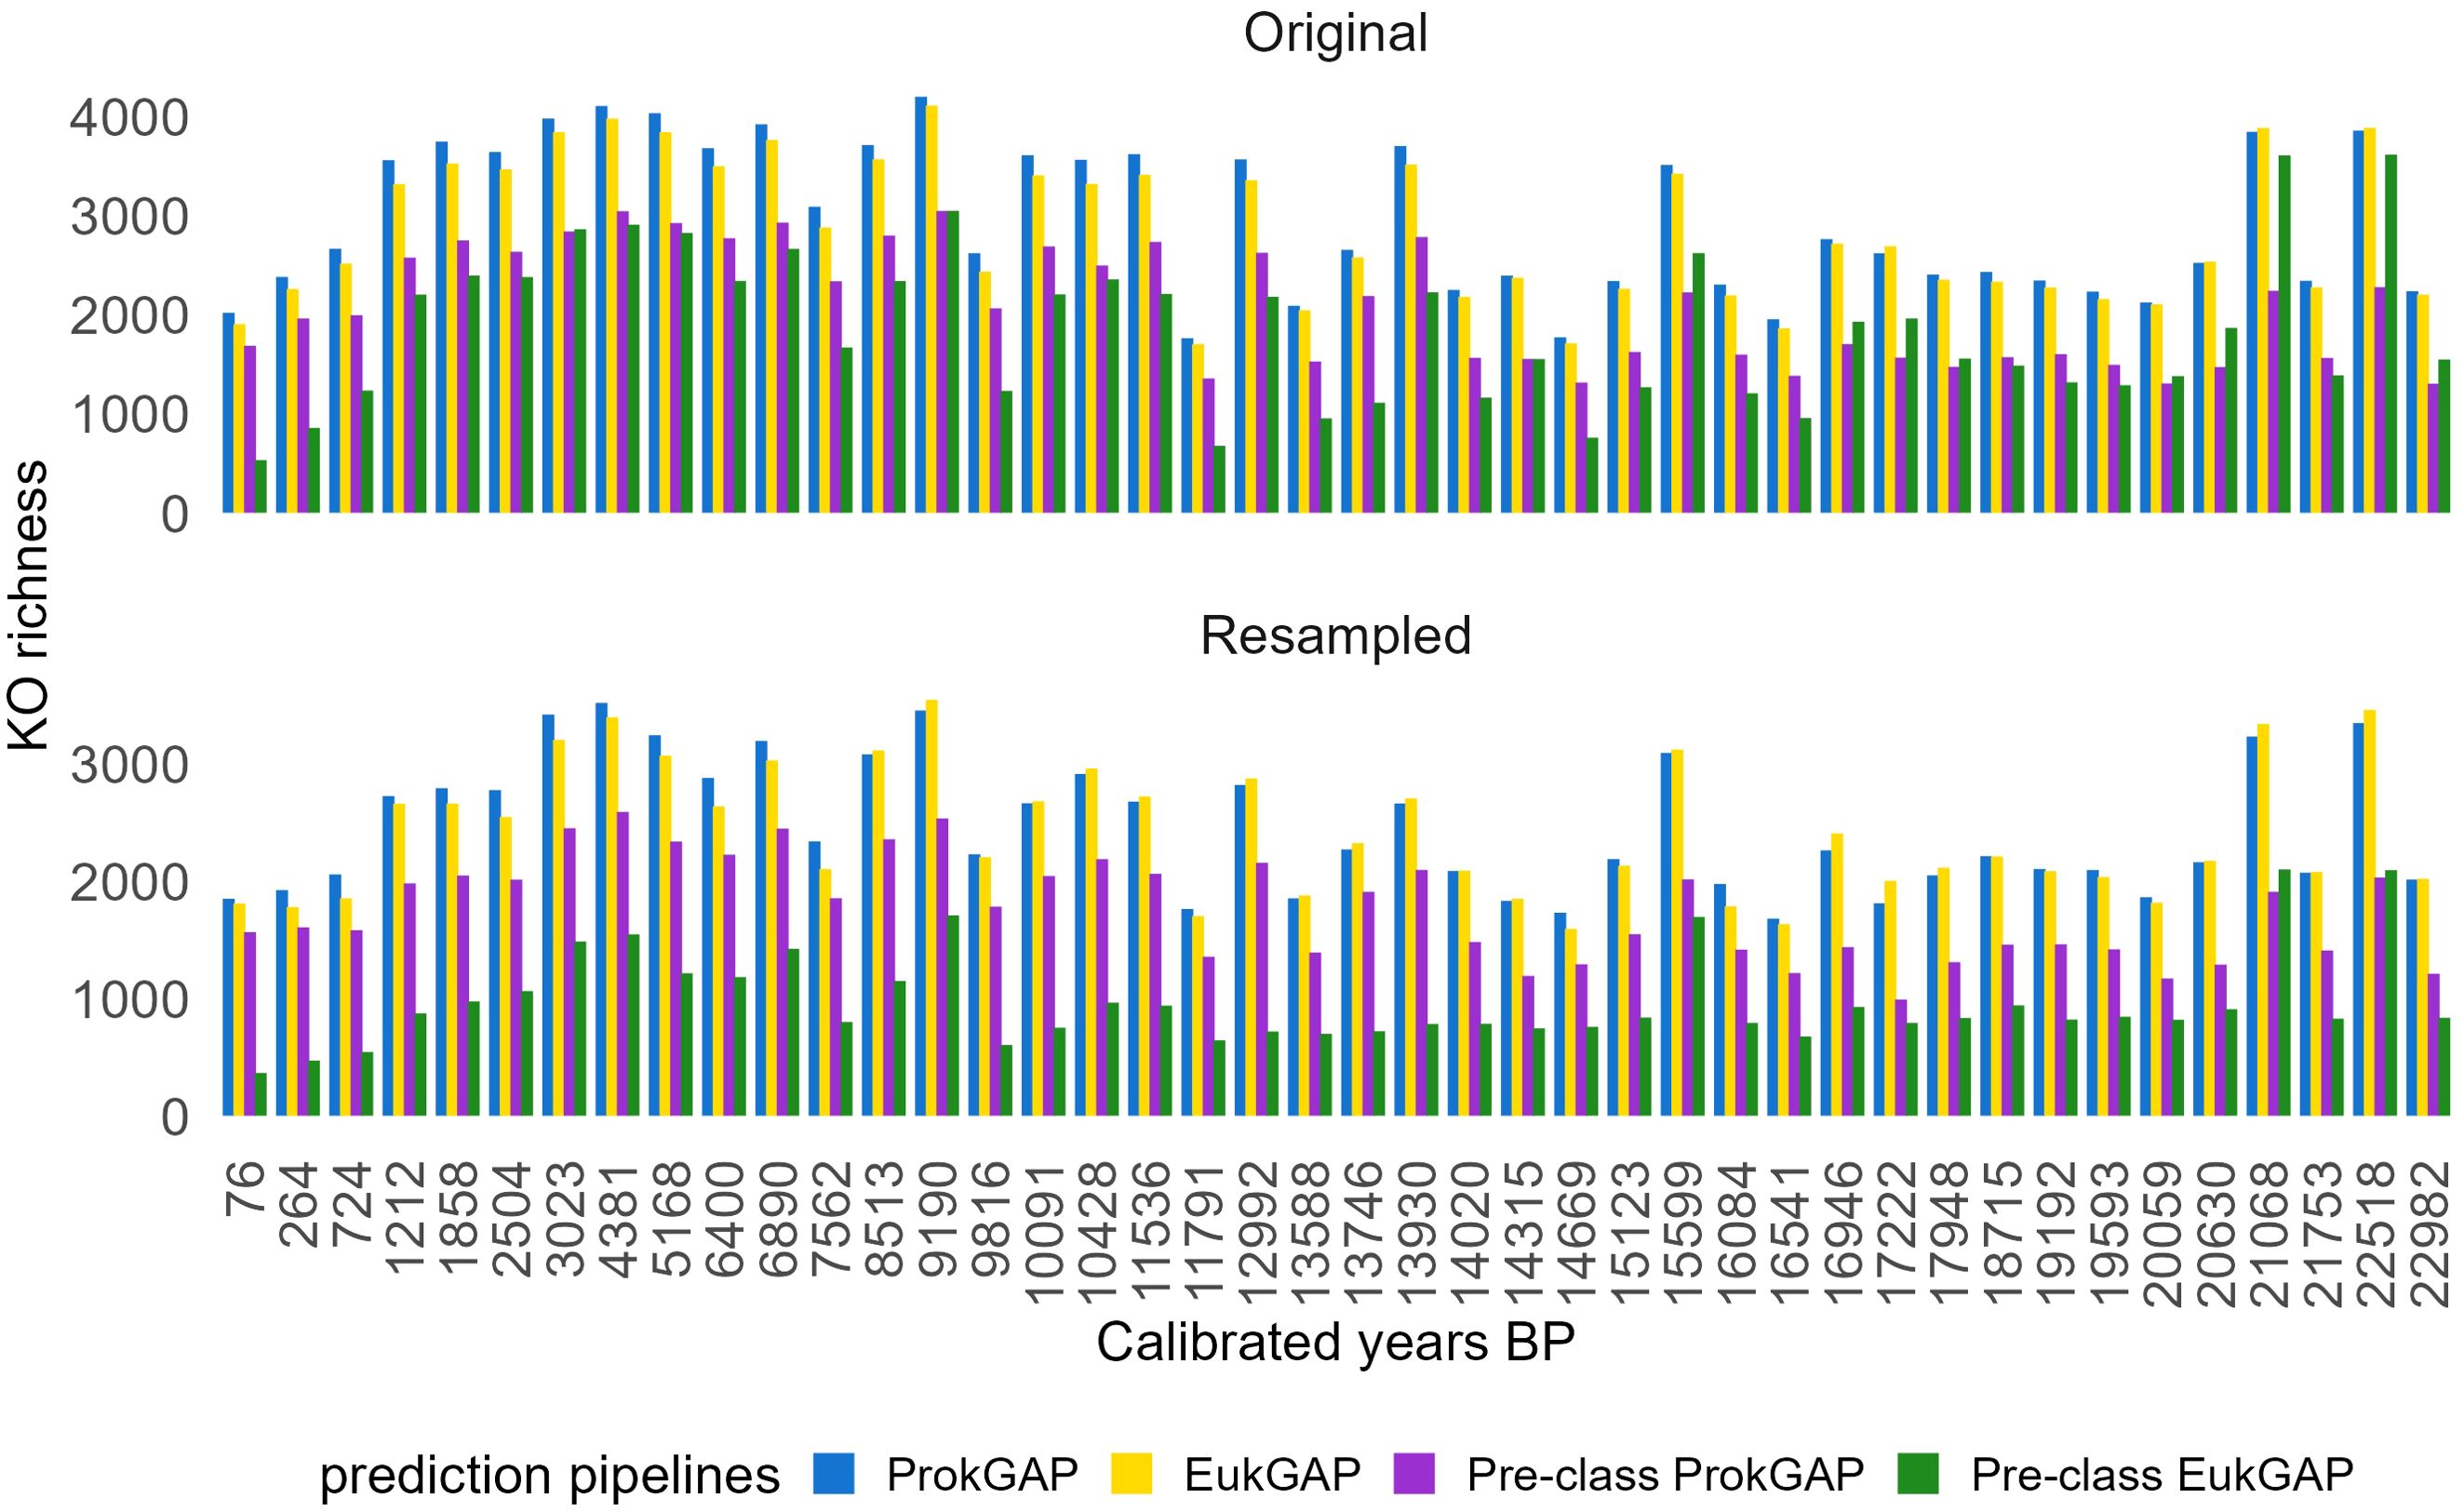
Figure 6. Temporal richness changes (with original and resampled data) of eukaryotic KEGG orthologs (KOs) derived from the four prediction pipelines. For resampling a minimum base count of 46,564 (ProkGAP), 63,945 (EukGAP), 41,075 (Pre-class ProkGAP), and 5628 (Pre-class EukGAP) was applied.
3.5 KEGG pathway analysis
We performed KEGG pathway analysis using KO abundance over time and focused on the Photosynthesis pathway in the Streptophyta phylum from the eukaryotic protein subsets across the pipelines. All the pipelines show a decreasing trend for the abundance of KO related to the KEGG3 Photosynthesis pathway over time (Supplementary Figure S8). The normalized gene abundance is higher in ProkGAP compared to EukGAP and pre-class pipelines. The coverage of KEGG3 Photosynthesis (29 KOs recovered in total dataset) varies across the prediction pipelines showing the highest coverage of 93% (n=27) by ProkGAP and Pre-class ProkGAP, followed by EukGAP with 86% (n=25) and Pre-class EukGAP with 62% (n=18) (Supplementary Figure S9).
3.6 Taxonomic assignments of eukaryotic proteins
A comparative analysis of plant protein (MMseq2) and short read (Kraken2) taxonomic classification was used to validate the taxonomic origin of the annotated proteins in the sediment core. The comparison between the datasets was restricted to the relative abundance of Streptophyta families represented in both datasets. The predominant families, for example Betulaceae, Salicaceae, and Rosaceae show a positive relationship between the abundances derived from ProkGAP and Kraken2 (Betulaceae R=0.23, p<0.001, Salicaceae R=0.76, p<0.001; Rosaceae R=0.93, p<0.001) (Supplementary Table S6).
3.7 Ancient DNA authentication using PyDamage
We evaluated a total of 6,910,228 contigs using PyDamage. Eukaryotic and Streptophyta contigs were filtered out, resulting in 600 contig lengths with a prediction accuracy of 0.5 for further filtering. After applying these filters, 238,327 eukaryotic contigs and 29,883 Streptophyta contigs remained in the dataset. The filtered subsets comprise 3,629 eukaryotic taxa and 647 Streptophyta taxa, respectively. A total of 179,682,955 reads were mapped to the eukaryotic contigs, while 15,003,880 reads were mapped to the Streptophyta contigs. The mean 5′ damage results for these contigs are shown in Supplementary Figures S1OA, B. Additionally, we analyzed the first position of C-to-T substitution frequency and performed a linear regression analysis over time, as shown in Supplementary Figures S10C, D. Our analysis reveals a weak but significant relationship between C-to-T substitution frequency at the first position over time for both datasets (Eukaryotes: R=0.11, p<0.001; Streptophyta: R=0.1, p<0.001).
4 Discussion
4.1 Size variation of the assembly and the functional gene catalogs
The high abundance of short reads and low coverage of eukaryotic genomes in the metagenomic assembly is challenging for gene annotation. In our pipeline, we used a minimum contig length of 300 bp compared to 600 (or even higher) in modern DNA assemblies (Chen et al., 2021; Karlicki et al., 2022). This allows us to keep the majority of contigs in our dataset (54.80% contigs from total contigs are between 300 and 600 bp). Short contigs (<1000 bp) in modern data are typically excluded prior to eukaryotic gene annotation due to a higher likelihood of mis-annotations (Belliardo et al., 2022), because the median protein length of eukaryotes is about 350 amino acids (Nevers et al., 2023). However, short amino acids (<100 bp) present partial conservative genes or small proteins of unknown relevance (Steinberg and Koch, 2021) that can still provide functional information. Our time-series data shows variation of N50 and the largest contigs. The reason for the varying length of contigs can be explained by the DNA quality, which depends on the DNA preservation in the sediments. DNA preservation depends on the environmental conditions during the burial of DNA. After burial, DNA degrades with increasing age resulting in higher fragmentation (McGaughran, 2020) and modifications (post-mortem damage patterns) on the DNA strands (Briggs et al., 2007). Especially during glacial times, DNA preservation can be enhanced due to the presence of minerals facilitating the binding and stabilization of DNA onto sediment particles (Pedersen et al., 2015) Further, lower temperatures and slightly alkaline lake water conditions are beneficial for DNA preservation (Jia et al., 2022).
We demonstrate an increased contig number (Figure 2) in Holocene samples (r=0.7, p<0.001), assuming an increased community complexity. This is supported by the fact that more plant and fungal taxa were detected by metabarcoding data throughout the Holocene (von Hippel et al., 2022). Generally, soil metagenomes are complex (Naylor et al., 2020; Leite et al., 2022) due to their taxonomic richness compared to low-diversity environments such as extreme habitats including thermal springs (Pedron et al., 2019) or host-gut studies from modern (Ma et al., 2020; Qin et al., 2010) or ancient humans (Wibowo et al., 2021). Along with the contig size and abundance, the gene catalog size from complex soils is assumed to be larger than from low-diversity samples (Howe et al., 2014; Ma et al., 2023). However, the number of eukaryotic proteins from soil or sediment is largely unknown. In our data, we retrieved the largest non-redundant eukaryotic gene catalog (derived from all 42 sediment samples) from the EukGAP (139,026), while ProkGAP provides slightly fewer eukaryotic proteins (133,288). About half are identified in the Pre-class ProkGAP (67,015) and Pre-class EukGAP (63,050) approaches.
To date, only a few studies have considered eukaryotic functional gene diversity from modern metagenomic data (Zhu et al., 2021; Belliardo et al., 2022; Saraiva et al., 2023). More than 100 million eukaryotic gene clusters – the largest gene catalog dataset – from the global ocean is presented by Carradec et al. (2018). In comparison to our study, Zhu et al. (2021) report a dataset of 70,291 non-redundant marine eukaryotic genes from metagenomic samples taken from different water depths in the ocean, reaching a maximum of 10,500 meters. They used MetaEuk to predict eukaryotic genes instead of Prodigal, and also employed Eukrep, another eukaryotic contig separation tool. However, they also state that some non-eukaryotic proteins were found in those contigs later and removed them from their catalog. Notably, their non-redundant gene catalog was created using a 97% similarity threshold, while we used a minimum 95% similarity level to create our non-redundant gene catalog, consistent with previous catalog studies (Almeida et al., 2021; Chen et al., 2021; Commichaux et al., 2021).
To find the optimal gene prediction tool for sedaDNA data analysis, we implemented two different gene prediction tools in four bioinformatic pipelines. Despite being originally designed for prokaryotes, Prodigal within the ProkGAP was identified as the optimal choice for analyzing sedaDNA samples, exhibiting a better overall performance and yielding a greater number of potential predicted genes in total.
The deep learning-based contig classification (pre-classification GAPs) method shows promise but requires refinement for accurate segregation of short contigs. This is crucial before it can effectively be applied to sedaDNA data. We found missassignments at the contig separation level for 300 bp length which we assessed in the eggNOG annotation step. Although Tiara has demonstrated superior performance on longer contigs to separate eukaryotes (e.g., Karlicki et al., 2022; Gabrielli et al., 2023), our findings confirm the results of Karlicki et al. (2022) and indicate its suboptimal performance on predominantly short contig lengths.
4.2 Protein diversity in eukaryotes
To understand protein diversity, we annotated the non-redundant proteins using the eggNOG database in order to gain the KEGG ortholog (KO) diversity. The ProkGAP demonstrates better efficiency in recovering protein diversity in eukaryotes compared to the other prediction pipelines. The recovery of high protein diversity in KOs is highly important for inferring biogeochemical or biological pathways in the community and has been applied to understand, for example, soil-microbe systems and their response to plant organic carbon sources (Neal et al., 2020). We recovered 5,895 eukaryotic unique KOs using ProkGAP from 42 sample ages, which is comparable to prokaryotic KO diversity from spatially diverse soils (Neal et al., 2020). Using EukGAP for protein diversity estimates might result in lower KO orthologs diversity (Hoff et al., 2008) as it applies a homology-based approach, which uses pre-existing reference databases limiting the detection of potential KOs.
Besides KO diversity, protein diversity can be estimated by using protein family (Pfam) domains which are integrated into various bioinformatic annotation pipelines, such as eggNOG and InterproScan. InterproScan allows for the functional annotation of protein by searching sequences against multiple motifs and protein databases (Jones et al., 2014). It includes Pfam (Mistry et al., 2021), SMART (Letunic and Bork, 2018), TIGRFAMs (Haft et al., 2003), and SUPERFAMILY (Pandurangan et al., 2019), but does not allow for KEGG and CAZy annotations. A fully-integrative gene annotation procedure including all existing reference databases is still missing, but would allow the improvement of the identification of gene functions in general, giving better estimates of gene diversity especially from complex and fragmented environmental DNA.
Protein diversity in our data estimated by the resampled KO richness in our time-series data indicates an increasing KO diversity over time, which supports the appearance of a more taxonomic and functionally diverse eukaryotic community. Our results align with Zhu et al. (2021) who find a higher abundance of annotated genes in the deeper ocean zones characterized by more extreme conditions compared to surface zones. Our dataset shows concordance with these findings in Glacial samples, which represent more extreme conditions and, in contrast, we observe increased functional richness during the Holocene period, coinciding with changing environmental conditions.
Incomplete KEGG pathways resulting from losses during gene prediction (Supplementary Figure S9) can affect the quantitative representation of the pathway as a whole and this may lead to misinterpretation (Albright et al., 2019). Therefore, it is crucial to recover KOs within KEGG pathways to accurately interpret abundance changes in sedaDNA over time. We show all KOs recovered from the Streptophyta Photosynthesis pathway in Supplementary Figure S9 and obtain the most complete pathway from the ProkGAP and Pre-class ProkGAP compared to the other prediction pipelines.
4.3 Taxonomic identity of functional proteins
We used MMseqs2 to improve taxonomic classification, because eggNOG classifications may not be sensitive enough to taxonomically classify proteins. Functional protein databases such as eggNOG can provide insights into the functions of the organisms or community. However, because eggNOG focuses on well-characterized proteins from model organisms, and representative genomes may limit the taxonomy of the protein, especially for eukaryotes (Frioux et al., 2020), it still provides high confidence about the functions because the proteins are shared by different organisms defined as orthologs (Koonin and Galperin, 2003). In order to expand our taxonomic information for eukaryotic proteins from eggNOG, we used the NCBI nr database and focused on plant proteins. We applied the dual BLAST last common ancestor (2bLCA) to assign taxonomic labels to the eukaryotic functional proteins. This approach involves a two-step BLAST process, where the best hit is used in a second round of search to identify homologous sequences. The taxonomic classification is finally determined by the lowest common ancestor (LCA) of the homologous hits. We applied an E-value ≤ 10-5 (default = 1) for the initial search, and ≤ 10-12 (default) for the second search to increase the confidence of the taxonomic validation of the functional proteins (Hingamp et al., 2013; Steinegger and Söding, 2017).
To assess the similarity between our functional protein taxonomy from Mmseqs2 and short-read based DNA sequence taxonomy from Kraken2, we compared their respective abundances. The comparison reveals a strong positive correlation (for example, Rosaceae R=0.93, p<0.001, shown in Supplementary Table S6) over time between the ProkGAP and Kraken2 pipelines, specifically within the dominant plant families.
4.4 Improvements of GAP for sedaDNA data
Sequencing depth plays a crucial role in revealing low-abundance species or genes within sedaDNA data, particularly for assembly-based approaches (Ma et al., 2023) and their associated gene annotation pipelines. Our analysis of deeper sequenced samples demonstrates a positive correlation between raw read count and contig length (Figure 7), suggesting need for sufficient sequencing depth to capture a more comprehensive snapshot of the ancient community.
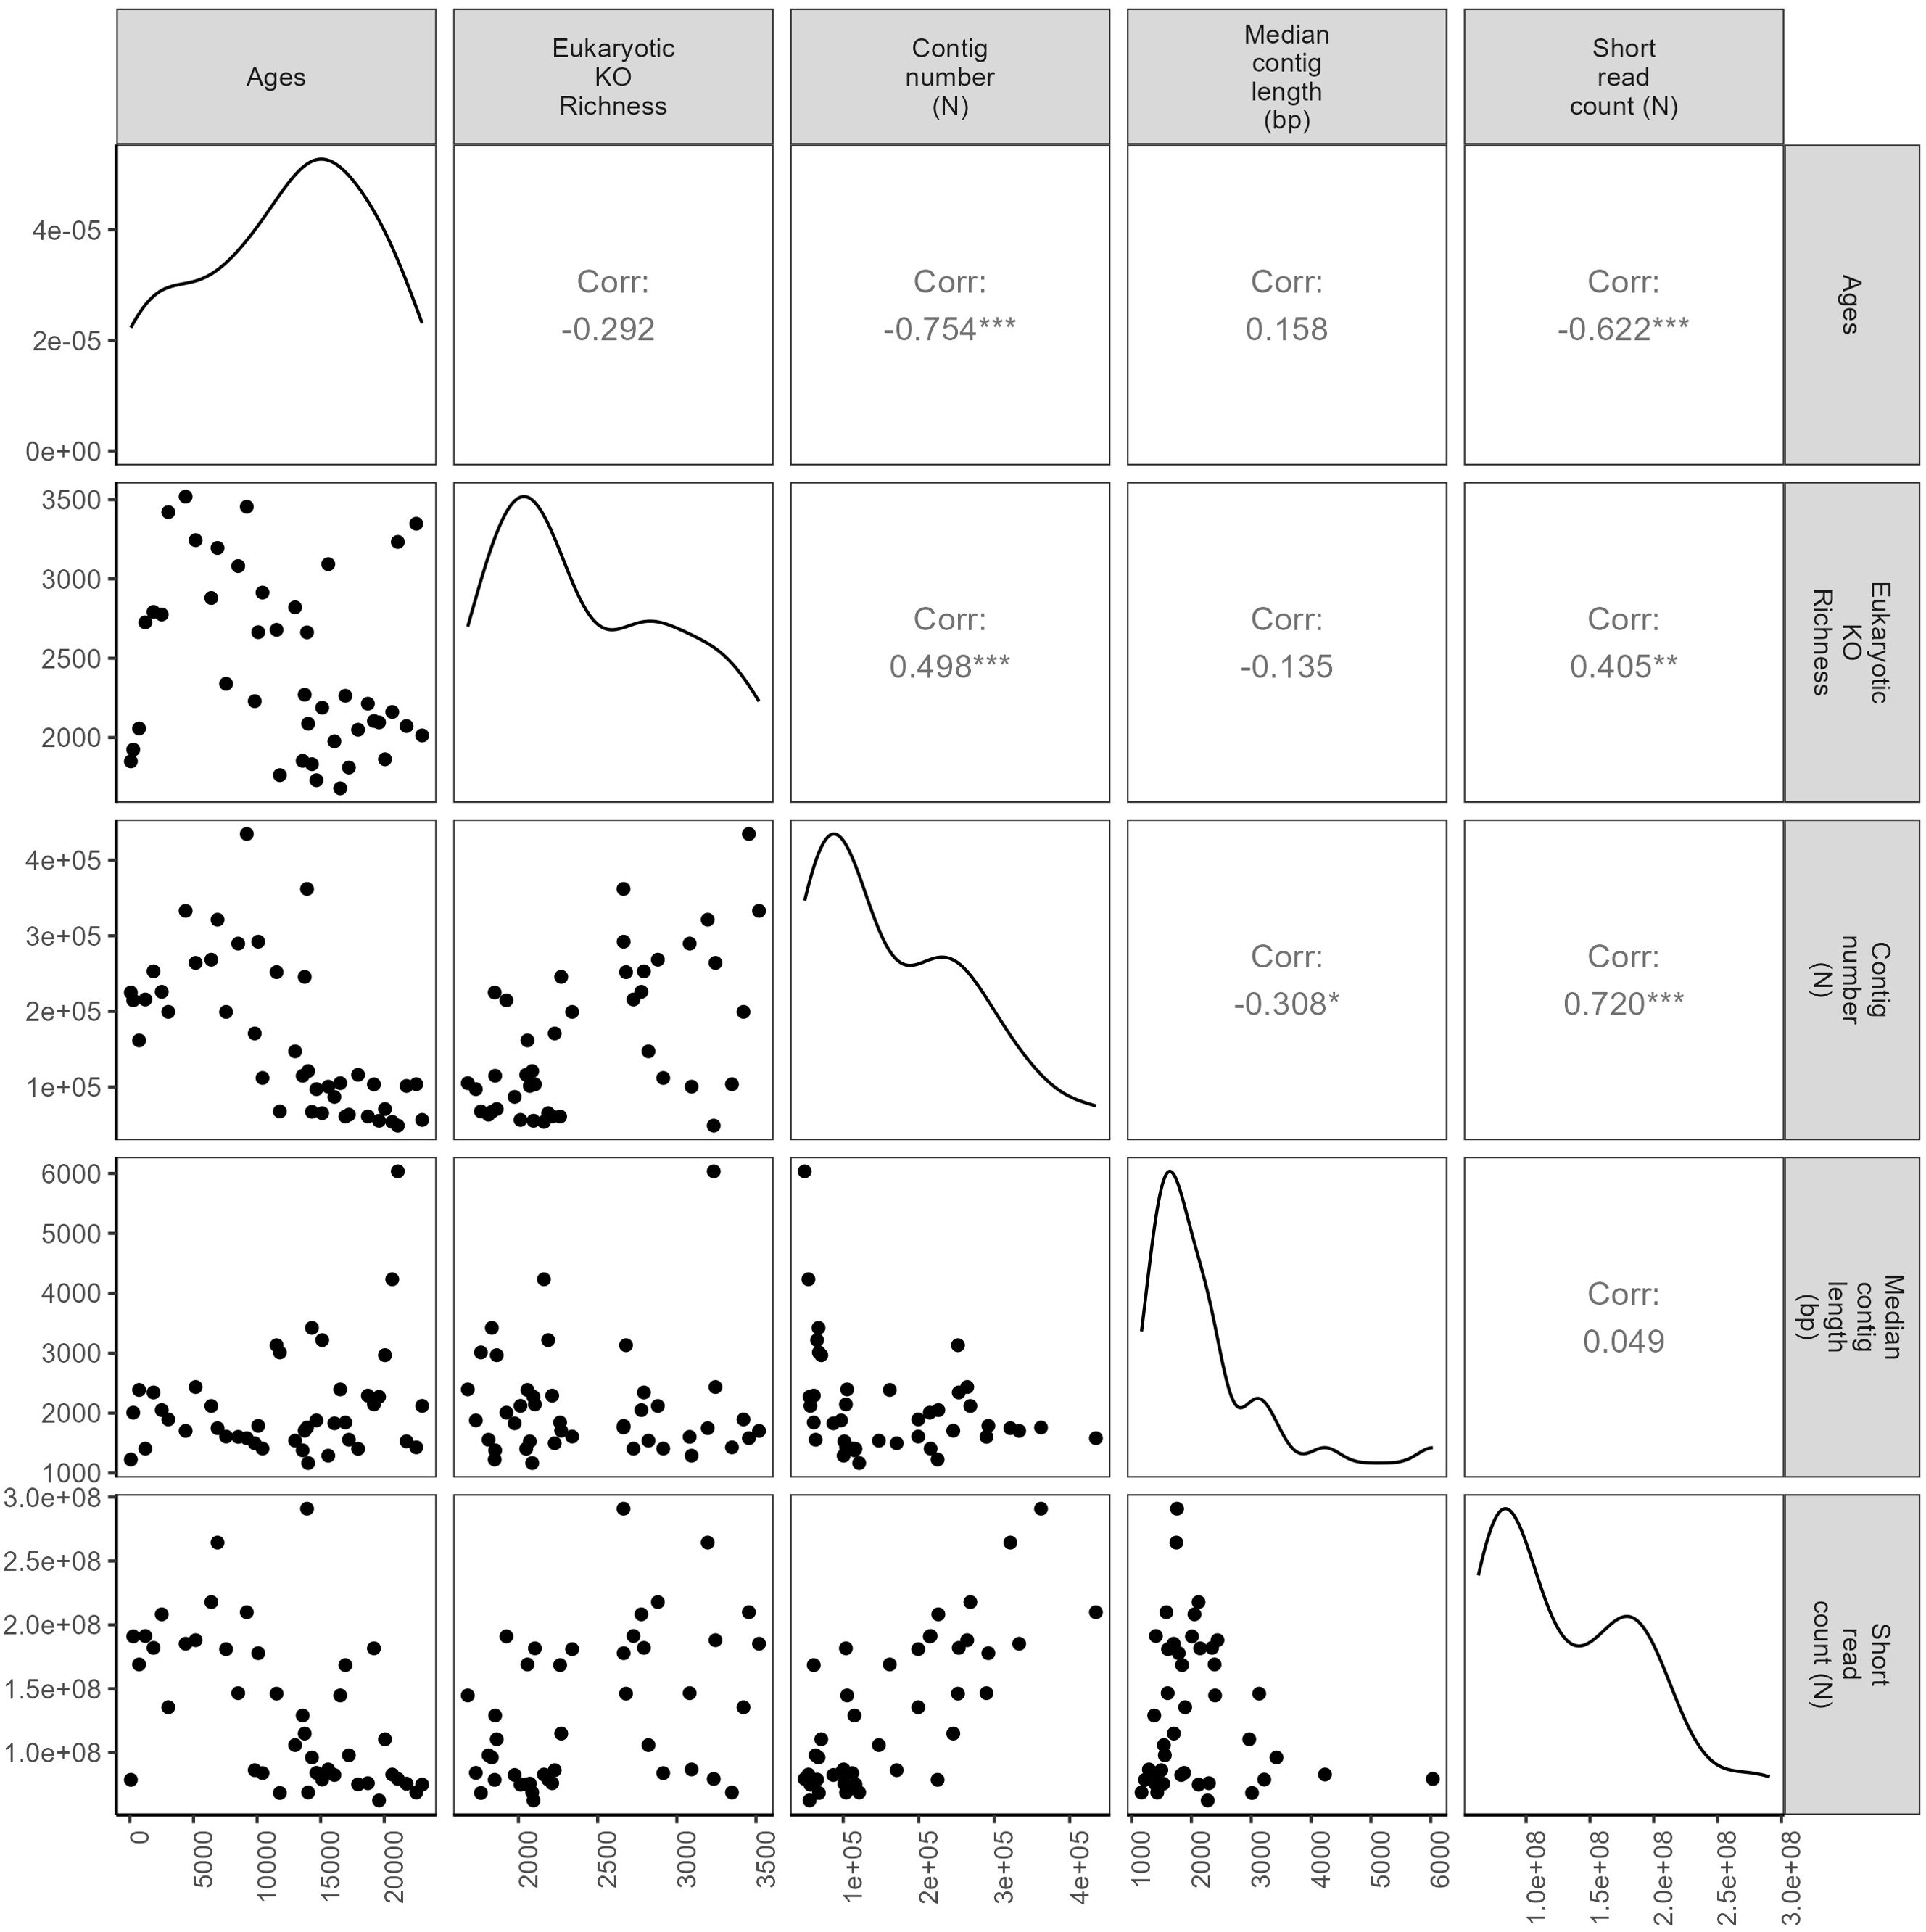
Figure 7. Pairwise Spearman correlations testing the relationship between age (cal years BP), resampled eukaryotic KEGG ortholog (KO) richness (ProkGAP prediction), number of contigs (N), median contig length (bp), and short read counts over time. Correlation coefficient and p-values (*0.05; **0.01; ***0.001; no star non-significant) are given in the upper right corner.
While the mapping and assembly approaches have their merits and drawbacks, assembly offers advantages such as more compact data, longer sequences, and the potential discovery of novel sequences absent from existing databases (Lapidus and Korobeynikov, 2021). However, in highly diverse sedaDNA datasets, the assembly process favors dominant taxa because their higher abundance results in more sequencing reads, which provide better coverage and overlap for assembly algorithms. This can lead to longer sequences from dominant taxa, while sequences from low-abundant taxa may be fragmented or poorly represented, hindering the detection of rare taxa with specific ecological roles (Lin et al., 2022). Although the focus of this study is not specifically on assemblers, it is important to point out that assembler selection plays an important role in metagenomic analyses (Zhang et al., 2023). Currently, there are multiple assembly approaches available (Liao et al., 2019), and the performance of each assembler can vary depending on the specific characteristics of the sample (Forouzan et al., 2018). Optimizing the choice of the assembler for each sample can be a challenging task (Mendes et al., 2023). One potential solution to address this issue is the application of machine learning techniques. By analyzing raw data features—such as GC content, repetitive sequences, sequencing depth, and fragment length variation in different k-mers—machine learning models could help identify the most suitable assembler for a given dataset. These models could enable the benchmarking of assemblers based on sedaDNA dataset-specific characteristics, thereby improving the efficiency and accuracy of the assembly process. Another challenge related to the assembly step is chimerism. Particularly, in complex communities with closely related taxa, genome similarities can result in insufficient coverage of individual genomes (Orakov et al., 2021; Chang et al., 2024). This can lead to erroneous joining of sequences into a single contig. MEGAHIT addresses chimerism by distinguishing reliable sequences (solid k-mers) from less common ones (mercy k-mers) and iteratively refining assemblies by removing errors such as disconnected branches, redundant paths, and low-quality connections. While stringent assembly parameters (k-mer occurrences, –min-count > 3, or –no-mercy) might mitigate chimerism, they risk significant data loss or low abundance species, especially for low-depth sequencing depth (Li et al., 2015). For eukaryotic contigs, direct chimerism assessment tools are lacking; manual evaluation using BLASTn (Camacho et al., 2009) against nucleotide databases can identify heterogeneity within contigs, allowing for filtering of potential chimeric sequences based on stringent similarity thresholds.
Generally, the detection of new genes using de novo assembly is promising, only 2.04% of the total predicted genes by ProkGAP are eukaryotic. Although there are specific prediction tools for eukaryotic genes, for example, AUGUSTUS (Stanke et al., 2004) and Gene-Mark (Bruna et al., 2020), the requirement of genome-specific models for high accuracy rates (DiMonaco et al., 2022) make them unsuitable for complex metagenomic data such as sedaDNA shotgun data. Therefore, improving gene prediction for complex and low-quality metagenomic data requires the applicability of taxon-specific prediction tools on big datasets and the completeness of reference databases, particularly for eukaryotic functions.
The combination of existing gene annotation tools selected according to their suitability for complex and low-quality data contributes to the implementation of a functional gene prediction pipeline suitable for ancient sedimentary DNA time-series data. Our approach is a first baseline for the analysis of functional diversity including prokaryotic and eukaryotic genes at the same time. However, future developments are needed to further improve prediction for low-abundant taxa allowing unbiased gene identification for understanding functional changes of past ecosystems.
Data availability statement
The raw sequencing data has been generated in the frame work of the doctoral thesis of Barbara von Hippel (2024) and is available at the European Nucleotide Archive (ENA) under the study accession number PRJEB80877. Bioinformatic, R and Python scripts along with a comprehensive documentation are provided at Zenodo, https://doi.org/10.5281/zenodo.14810762.
Author contributions
UÇ: Writing – original draft, Writing – review & editing, Conceptualization, Formal analysis, Investigation, Methodology, Visualization. UH: Writing – original draft, Writing – review & editing, Conceptualization, Funding acquisition, Investigation, Supervision. LH: Writing – review & editing, Methodology, Supervision. BH: Writing – review & editing, Methodology. KS-L: Writing – original draft, Writing – review & editing, Conceptualization, Investigation, Methodology, Supervision.
Funding
The author(s) declare that financial support was received for the research, authorship, and/or publication of this article. This project has received funding from the European Research Council (ERC) under the European Union’s Horizon 2020 Research and Innovation Program (Grant Agreement No. 772852, ERC Consolidator Grant ‘Glacial Legacy’).
Acknowledgments
We thank Janine Klimke and Luise Schulte for help with laboratory work. We thank Uwe John and Nancy Kühne for their technical support in DNA sequencing at AWI, Bremerhaven, Germany. We thank Cathy Jenks for English language proofreading.
Conflict of interest
The authors declare that the research was conducted in the absence of any commercial or financial relationships that could be construed as a potential conflict of interest.
The handling editor LP declared a past co-authorship with the authors UH and KS-L.
Publisher’s note
All claims expressed in this article are solely those of the authors and do not necessarily represent those of their affiliated organizations, or those of the publisher, the editors and the reviewers. Any product that may be evaluated in this article, or claim that may be made by its manufacturer, is not guaranteed or endorsed by the publisher.
Supplementary material
The Supplementary Material for this article can be found online at: https://www.frontiersin.org/articles/10.3389/fevo.2025.1459690/full#supplementary-material
References
Albright M. B.N., Timalsina B., Martiny J. B.H., Dunbar J. (2019). Comparative genomics of nitrogen cycling pathways in bacteria and archaea. Microbial Ecol. 77, 597–6065. doi: 10.1007/s00248-018-1239-4
Alexander H., Hu S. K., Krinos A. I., Pachiadaki M., Tully B. J., Neely C. J., et al. (2023). Eukaryotic genomes from a global metagenomic data set illuminate trophic modes and biogeography of ocean plankton. mBio 14, e01676–e01235. doi: 10.1128/mbio.01676-23
Almeida A., Nayfach S., Boland M., Strozzi F., Beracochea M., Shi Z. J., et al. (2021). A unified catalog of 204,938 reference genomes from the human gut microbiome. Nat. Biotechnol. 39, 105–114. doi: 10.1038/s41587-020-0603-3
Andreev A. A., Tarasov P. E., Klimanov V. A., Melles M., Lisitsyna O. M., Hubberten H. W. (2004). Vegetation and Climate Changes around the Lama Lake, Taymyr Peninsula, Russia during the Late Pleistocene and Holocene. Quaternary Int. 122, 69–84. doi: 10.1016/j.quaint.2004.01.032
Andrews S. (2010). FastQC: A quality control tool for high throughput sequence data. Available online at: http://www.bioinformatics.babraham.ac.uk/projects/fastqc/ (Accessed September 15, 2023).
Barnett D. W., Garrison E. K., Quinlan A. R., Strömberg M. P., Marth G. T. (2011). BamTools: A C++ API and toolkit for analyzing and managing BAM files. Bioinformatics 27, 1691–1925. doi: 10.1093/bioinformatics/btr174
Belliardo C., Koutsovoulos G. D., Rancurel C., Clément M., Lipuma J., Bailly-Bechet M., et al. (2022). Improvement of eukaryotic protein predictions from soil metagenomes. Sci. Data 9, 3115. doi: 10.1038/s41597-022-01420-4
Borry M., Hübner A., Rohrlach A. B., Warinner C. (2021). PyDamage: automated ancient damage identification and estimation for contigs in ancient DNA de novo assembly. PeerJ 9, e11845. doi: 10.7717/peerj.11845
Briggs A. W., Stenzel U., Philip L. F., Green J. R. E., Kelso J., Prüfer K., et al. (2007). Patterns of damage in genomic DNA sequences from a neandertal. Proc. Natl. Acad. Sci. 104, 14616–14621. doi: 10.1073/pnas.0704665104
Bruna T., Lomsadze A., Borodovsky M. (2020). GeneMark-EP+: eukaryotic gene prediction with self-training in the space of genes and proteins. NAR Genomics Bioinf. 2, lqaa026. doi: 10.1093/nargab/lqaa026
Bruna T., Lomsadze A., Borodovsky M. (2024). A new gene finding tool geneMark-ETP significantly improves the accuracy of automatic annotation of large eukaryotic genomes. bioRxiv, 01.13.524024. doi: 10.1101/2023.01.13.524024
Bushnell B. (2014). BBMap: A fast, accurate, splice-aware aligner. Available online at: https://sourceforge.net/projects/bbmap (Accessed September 16, 2023).
Camacho C., Coulouris G., Avagyan V., Ma N., Papadopoulos J., Bealer K., et al. (2009). BLAST+: architecture and applications. BMC Bioinf. 10, 4215. doi: 10.1186/1471-2105-10-421
Cantalapiedra C. P., Hernández-Plaza A., Letunic I., Bork P., Huerta-Cepas. J. (2021). eggNOG-Mapper v2: Functional Annotation, Orthology Assignments, and Domain Prediction at the Metagenomic Scale. Mol. Biol. Evol. 38, 5825–5295. doi: 10.1093/molbev/msab293
Capo E., Giguet-Covex C., Rouillard A., Nota K., Heintzman P. D., Vuillemin A., et al. (2021). Lake sedimentary DNA research on past terrestrial and aquatic biodiversity: overview and recommendations. Quaternary 4, 6. doi: 10.3390/quat4010006
Carradec Q., Pelletier E., Silva C. D., Alberti A., Seeleuthner Y., Blanc-Mathieu R., et al. (2018). A global ocean atlas of eukaryotic genes. Nat. Commun. 9, 373. doi: 10.1038/s41467-017-02342-1
Chang T., Gavelis G. S., Brown J. M., Stepanauskas a. R. (2024). Genomic representativeness and chimerism in large collections of SAGs and MAGs of marine prokaryoplankton. Microbiome 12, 1265. doi: 10.1186/s40168-024-01848-3
Chen C., Zhou Y., Fu H., Xiong X., Fang S., Jiang H., et al. (2021). Expanded catalog of microbial genes and metagenome-Assembled genomes from the pig gut microbiome. Nat. Commun. 12, 11065. doi: 10.1038/s41467-021-21295-0
Chen I.-M. A., Chu K., Palaniappan K., Pillay M., Ratner A., Huang J., et al. (2019). IMG/M v.5.0: an integrated data management and comparative analysis system for microbial genomes and microbiomes. Nucleic Acids Res. 47, D666–D677. doi: 10.1093/nar/gky901
Chen S., Zhou Y., Chen Y., Gu J. (2018). Fastp: an ultra-fast all-in-one FASTQ preprocessor. Bioinformatics 34, i884–i890. doi: 10.1093/bioinformatics/bty560
Commichaux S., Shah N., Ghurye J., Stoppel A., Goodheart J. A., Luque G. G., et al. (2021). A critical assessment of gene catalogs for metagenomic analysis. Bioinformatics 37, 2848–2575. doi: 10.1093/bioinformatics/btab216
Courtin J., Perfumo A., Andrei A., Opel A. T., Stoof-Leichsenring K. R., Edwards M. E., et al. (2022). Pleistocene glacial and interglacial ecosystems inferred from ancient DNA analyses of permafrost sediments from batagay megaslump, east siberia. Environ. DNA 4, 1265–1835. doi: 10.1002/edn3.336
Danecek P., Bonfield J. K., Liddle J., Marshall J., Ohan V., Pollard M. O., et al. (2021). Twelve years of SAMtools and BCFtools. GigaScience 10, giab008. doi: 10.1093/gigascience/giab008
Delmont T. O., Gaia M., Damien D., Frémont H. P., Vanni C., Fernandez-Guerra A., et al. (2022). Functional repertoire convergence of distantly related eukaryotic plankton lineages abundant in the sunlit ocean. Cell Genomics 2, 100123. doi: 10.1016/j.xgen.2022.100123
Delmont T. O., Robe P., Clark I., Simonet P., Vogel T. M. (2011). Metagenomic comparison of direct and indirect soil DNA extraction approaches. J. Microbiological Methods 86, 397–4005. doi: 10.1016/j.mimet.2011.06.013
Derelle E., Ferraz C., Rombauts S., Rouzé P., Worden A. Z., Robbens S., et al. (2006). Genome analysis of the smallest free-living eukaryote ostreococcus tauri unveils many unique features. Proc. Natl. Acad. Sci. 103, 11647–11652. doi: 10.1073/pnas.0604795103
DiMonaco N. J., Aubrey W., Kenobi K., Clare A., Creevey. C. J. (2022). No one tool to rule them all: prokaryotic gene prediction tool annotations are highly dependent on the organism of study. Bioinformatics 38, 1198–12075. doi: 10.1093/bioinformatics/btab827
Drula E., Garron M.-L., Dogan S., Lombard V., Henrissat B., Terrapon N. (2022). The carbohydrate-active enzyme database: functions and literature. Nucleic Acids Res. 50, D571–D577. doi: 10.1093/nar/gkab1045
Duncan A., Barry K., Daum C., Eloe-Fadrosh E., Roux S., Schmidt K., et al. (2022). Metagenome-assembled genomes of phytoplankton microbiomes from the arctic and atlantic oceans. Microbiome 10, 67. doi: 10.1186/s40168-022-01254-7
Emiola A., Oh J. (2018). High throughput in situ metagenomic measurement of bacterial replication at ultra-low sequencing coverage. Nat. Commun. 9, 49565. doi: 10.1038/s41467-018-07240-8
Forouzan E., Shariati P., Maleki M. S. M., Karkhane A. A., Yakhchali B. (2018). Practical evaluation of 11 de novo assemblers in metagenome assembly. . J. Microbiological Methods 151, 99–105. doi: 10.1016/j.mimet.2018.06.007
Frioux C., Singh D., Korcsmaros T., Hildebrand F. (2020). From bag-of-genes to bag-of-genomes: metabolic modelling of communities in the era of metagenome-assembled genomes. Comput. Struct. Biotechnol. J. 18, 1722–1734. doi: 10.1016/j.csbj.2020.06.028
Gabrielli M., Dai Z., Delafont V., Timmers P. H.A., Wielen P. W.J.J., Antonelli M., et al. (2023). Identifying eukaryotes and factors influencing their biogeography in drinking water metagenomes. Environ. Sci. Technol. 57, 3645–3605. doi: 10.1021/acs.est.2c09010
Galperin M. Y., Wolf Y. I., Makarova K. S., Alvarez R. V., Landsman D., Koonin E. V. (2021). COG database update: focus on microbial diversity, model organisms, and widespread pathogens. Nucleic Acids Res. 49, D274–D281. doi: 10.1093/nar/gkaa1018
Gansauge M.-T., Gerber T., Glocke I., Korlevic P., Lippik L., Nagel S., et al. (2017). Single-Stranded DNA library preparation from highly degraded DNA using T4 DNA ligase. Nucleic Acids Res. 45, e795. doi: 10.1093/nar/gkx033
Gansauge M.-T., Meyer M. (2013). Single-stranded DNA library preparation for the sequencing of ancient or damaged DNA. Nat. Protoc. 8, 737–748. doi: 10.1038/nprot.2013.038
Georganas E., Egan R., Hofmeyr S., Goltsman E., Arndt B., Tritt A., et al. (2018). Extreme scale de novo metagenome assembly. SC18: International Conference for High Performance Computing, Networking, Storage and Analysis, Dallas, TX, USA, 122–134. doi: 10.1109/SC.2018.00013
Gurevich A., Saveliev V., Vyahhi N., Tesler G. (2013). QUAST: quality assessment tool for genome assemblies. Bioinformatics 29, 1072–1755. doi: 10.1093/bioinformatics/btt086
Haft D. H., Selengut J. D., White O. (2003). The TIGRFAMs database of protein families. Nucleic Acids Res. 31, 371–735. doi: 10.1093/nar/gkg128
Hingamp P., Grimsley N., Acinas S. G., Clerissi C., Subirana L., Poulain J., et al. (2013). Exploring nucleo-cytoplasmic large DNA viruses in tara oceans microbial metagenomes. ISME J. 7, 1678–1695. doi: 10.1038/ismej.2013.59
Hoff K. J., Tech M., Lingner T., Daniel R., Morgenstern B., Meinicke P. (2008). Gene prediction in metagenomic fragments: A large scale machine learning approach. BMC Bioinf. 9, 217. doi: 10.1186/1471-2105-9-217
Howe A. C., Jansson J. K., Malfatti S. A., Tringe S. G., Tiedje J. M., Brown C.T. (2014). Tackling soil diversity with the assembly of large, complex metagenomes. Proc. Natl. Acad. Sci. 111, 4904–4995. doi: 10.1073/pnas.1402564111
Hsieh T. C., Ma K. H., Chao A. (2024). iNEXT: interpolation and extrapolation for species diversity. Available online at: http://chao.stat.nthu.edu.tw/wordpress/software_download/ (Accessed April 10, 2024).
Huang S., Stoof-Leichsenring K. R., Liu S., Courtin J., Andreev A. A., Pestryakova L. A., et al. (2021). Plant sedimentary ancient DNA from far east Russia covering the last 28,000 years reveals different assembly rules in cold and warm climates. Front. Ecol. Evol. 9. doi: 10.3389/fevo.2021.763747
Huerta-Cepas J., Szklarczyk D., Heller D., Hernández-Plaza A., Forslund S. K., Cook H., et al. (2019). eggNOG 5.0: A hierarchical, functionally and phylogenetically annotated orthology resource based on 5090 organisms and 2502 viruses. Nucleic Acids Res. 47, D309–D314. doi: 10.1093/nar/gky1085
Hyatt D., Chen G.-L., LoCascio P. F., Land M. L., Larimer F. W., Hauser L. J. (2010). Prodigal: prokaryotic gene recognition and translation initiation site identification. BMC Bioinf. 11, 1195. doi: 10.1186/1471-2105-11-119
Hyatt D., LoCascio P. F., Hauser L. J., Uberbacher E. C. (2012). Gene and translation initiation site prediction in metagenomic sequences. Bioinformatics 28, 2223–2305. doi: 10.1093/bioinformatics/bts429
Jacquiod S., Stenbæk J., Santos S. S., Winding A., Sørensen SJ., Priemé A. (2016). Metagenomes provide valuable comparative information on soil microeukaryotes. Res. Microbiol. 167, 436–505. doi: 10.1016/j.resmic.2016.03.003
Jia W., Biskaborn B. K., Stoof-Leichsenring K. R., Pestryakova L. A., Herzschuh U. (2024). Vegetation and glacier dynamics are sensitive to summer (Not winter) warming and the evidence for larch refugia in the ‘Northern pole of cold’ Inferred from sedimentary ancient DNA and geochemistry. Quaternary Sci. Rev. 331, 108650. doi: 10.1016/j.quascirev.2024.108650
Jia W., Liu X., Stoof-Leichsenring K. R., Liu S., Li K. (2022). Preservation of sedimentary plant DNA is related to lake water chemistry. Environ. DNA 4, 425–439. doi: 10.1002/edn3.259
Jones P., Binns D., Chang H.-Y., Fraser M., Li W., McAnulla C., et al. (2014). InterProScan 5: genome-scale protein function classification. Bioinformatics 30, 1236–1240. doi: 10.1093/bioinformatics/btu031
Kanehisa M., Goto S. (2000). KEGG: kyoto encyclopedia of genes and genomes. Nucleic Acids Res. 28, 27–305. doi: 10.1093/nar/28.1.27
Karlicki M., Antonowicz S., Karnkowska A. (2022). Tiara: deep learning-based classification system for eukaryotic sequences. Bioinformatics 38, 344–505. doi: 10.1093/bioinformatics/btab672
Kim J., Kim M. S., Koh A. Y., Xie Y., Zhan X. (2016). FMAP: functional mapping and analysis pipeline for metagenomics and metatranscriptomics studies. BMC Bioinf. 17, 4205. doi: 10.1186/s12859-016-1278-0
Klapper M., Hübner A., Ibrahim A., Wasmuth I., Borry M., Haensch V. G., et al. (2023). Natural products from reconstructed bacterial genomes of the middle and upper paleolithic. Science 380, 619–624. doi: 10.1126/science.adf5300
Koonin E. V., Galperin M. Y. (2003). Sequence - evolution - function: computational approaches in comparative genomics (Boston: Kluwer Academic). Available at: http://www.ncbi.nlm.nih.gov/books/NBK20260/.
Kumke T., Schoonderwaldt A., Kienel U. (2005). Spatial variability of sedimentological properties in a large siberian lake. Aquat. Sci. 67, 86–965. doi: 10.1007/s00027-004-0734-5
Lapidus A. L., Korobeynikov A. I. (2021). Metagenomic data assembly – the way of decoding unknown microorganisms. Front. Microbiol. 12. doi: 10.3389/fmicb.2021.613791
Leite M. F.A., Broek S. W.E.B., Kuramae E. E. (2022). Current challenges and pitfalls in soil metagenomics. Microorganisms 10, 19005. doi: 10.3390/microorganisms10101900
Letunic I., Bork P. (2018). 20 years of the SMART protein domain annotation resource. Nucleic Acids Res. 46, D493–D496. doi: 10.1093/nar/gkx922
Leushkin E. V., Sutormin R. A., Nabieva E. R., Penin A. A., Kondrashov A. S., Logacheva M. D. (2013). The miniature genome of a carnivorous plant genlisea aurea contains a low number of genes and short non-coding sequences. BMC Genomics 14, 4765. doi: 10.1186/1471-2164-14-476
Levy Karin E., Mirdita M., Söding J. (2020). MetaEuk—Sensitive, high-throughput gene discovery, and annotation for large-scale eukaryotic metagenomics. Microbiome 8, 485. doi: 10.1186/s40168-020-00808-x
Li H., Durbin R. (2009). Fast and accurate short read alignment with burrows–Wheeler transform. Bioinformatics 25, 1754–1605. doi: 10.1093/bioinformatics/btp324
Li W., Godzik A. (2006). Cd-Hit: A fast program for clustering and comparing large sets of protein or nucleotide sequences. Bioinformatics 22, 1658–1595. doi: 10.1093/bioinformatics/btl158
Li D., Liu C.-M., Luo R., Sadakane K., Lam T.-W. (2015). MEGAHIT: An Ultra-Fast Single-Node Solution for Large and Complex Metagenomics Assembly via Succinct de Bruijn Graph. Bioinformatics 31, 1674–1765. doi: 10.1093/bioinformatics/btv033
Liao X., Li M., Zou Y., Wu F.-X., Yi-Pan, Wang J. (2019). Current challenges and solutions of assembly. Quant. Biol. 7, 90–1095. doi: 10.1007/s40484-019-0166-9
Lin L., Jing X., Lucas-Borja M. E., Shen C., Wang Y., Feng W. (2022). Rare taxa drive the response of soil fungal guilds to soil salinization in the taklamakan desert. Front. Microbiol. 13. doi: 10.3389/fmicb.2022.862245
Liu S., Stoof-Leichsenring K. R., Harms L., Schulte L., Mischke S., Kruse S., et al. (2024). Tibetan terrestrial and aquatic ecosystems collapsed with cryosphere loss inferred from sedimentary ancient metagenomics. Sci. Adv. 10, eadn8490. doi: 10.1126/sciadv.adn8490
Ma B., France M. T., Crabtree J., Holm J. B., Humphrys M. S., Brotman R. M., et al. (2020). A comprehensive non-redundant gene catalog reveals extensive within-community intraspecies diversity in the human vagina. Nat. Commun. 11, 9405. doi: 10.1038/s41467-020-14677-3
Ma B., Lu C., Wang Y., Yu J., Zhao K., Xue R., et al. (2023). A genomic catalogue of soil microbiomes boosts mining of biodiversity and genetic resources. Nat. Commun. 14, 7318. doi: 10.1038/s41467-023-43000-z
McGaughran A. (2020). Effects of sample age on data quality from targeted sequencing of museum specimens: what are we capturing in time? BMC Genomics 21, 188. doi: 10.1186/s12864-020-6594-0
Mendes C. I., Vila-Cerqueira P., Motro Y., Moran-Gilad J., Carriço J., Ramirez M. (2023). LMAS: Evaluating Metagenomic Short de Novo Assembly Methods through Defined Communities. GigaScience 12, giac122. doi: 10.1093/gigascience/giac122
Meyer F., Paarmann D., D’Souza M., Olson R., Glass E. M., Kubal M., et al. (2008). The metagenomics RAST server – a public resource for the automatic phylogenetic and functional analysis of metagenomes. BMC Bioinf. 9, 386. doi: 10.1186/1471-2105-9-386
Mistry J., Chuguransky S., Williams L., Qureshi M., Salazar G. A., Sonnhammer E. L.L., et al. (2021). Pfam: the protein families database in 2021. Nucleic Acids Res. 49, D412–D419. doi: 10.1093/nar/gkaa913
Morais D. A.A., Cavalcante J.V.F., Monteiro S., Pasquali M. A.B., Dalmolin R. J.S. (2022). MEDUSA: A pipeline for sensitive taxonomic classification and flexible functional annotation of metagenomic shotgun sequences. Front. Genet. 13. doi: 10.3389/fgene.2022.814437
Naylor D., Fansler S., Brislawn C., Nelson W. C., Hofmockel K. S., Jansson J. K., et al. (2020). Deconstructing the soil microbiome into reduced-Complexity functional modules. mBio 11, 105.1128/mbio.01349–20. doi: 10.1128/mbio.01349-20
Neal A. L., Bacq-Labreuil A., Zhang X., Clark I. M., Coleman K., Mooney S. J., et al. (2020). Soil as an extended composite phenotype of the microbial metagenome. Sci. Rep. 10, 106495. doi: 10.1038/s41598-020-67631-0
Nevers Y., Glover N. M., Dessimoz C., Lecompte O. (2023). Protein length distribution is remarkably uniform across the tree of life. Genome Biol. 24, 1355. doi: 10.1186/s13059-023-02973-2
Oksanen J., Simpson G. L., Blanchet F.G., Kindt R., Legendre P., Minchin P. R., et al. (2022). Vegan: community ecology package. Available online at: https://CRAN.R-project.org/package=vegan (Accessed March 20, 2024).
Olson N. D., Treangen T. J., Hill C. M., Cepeda-Espinoza V., Ghurye J., Koren S., et al. (2019). Metagenomic assembly through the lens of validation: recent advances in assessing and improving the quality of genomes assembled from metagenomes. Briefings Bioinf. 20, 1140–1505. doi: 10.1093/bib/bbx098
Orakov A., Fullam A., Coelho L. P., Khedkar S., Szklarczyk D., Mende D. R., et al. (2021). GUNC: detection of chimerism and contamination in prokaryotic genomes. Genome Biol. 22, 1785. doi: 10.1186/s13059-021-02393-0
Pandurangan A. P., Stahlhacke J., Oates M. E., Smithers B., Gough J. (2019). The SUPERFAMILY 2.0 database: A significant proteome update and a new webserver. Nucleic Acids Res. 47, D490–D494. doi: 10.1093/nar/gky1130
Parducci L., Alsos I. G., Unneberg P., Pedersen M. W., Han L., Lammers Y., et al. (2019). Shotgun environmental DNA, pollen, and macrofossil analysis of lateglacial lake sediments from southern Sweden. Front. Ecol. Evol. 7. doi: 10.3389/fevo.2019.00189
Patin N. V., Goodwin K. D. (2022). Long-read sequencing improves recovery of picoeukaryotic genomes and zooplankton marker genes from marine metagenomes. mSystems 7, e00595–e00522. doi: 10.1128/msystems.00595-22
Patro R., Duggal G., Love M. I., Irizarry R. A., Kingsford C. (2017). Salmon: fast and bias-Aware quantification of transcript expression using dual-Phase inference. Nat. Methods 14, 417–195. doi: 10.1038/nmeth.4197
Pedersen M. W., Overballe-Petersen S., Ermini L., Sarkissian C. D., Haile J., Hellstrom M., et al. (2015). Ancient and modern environmental DNA. Philos. Trans. R. Soc. B: Biol. Sci. 370, 20130383. doi: 10.1098/rstb.2013.0383
Pedersen M. W., Ruter A., Schweger C., Friebe H., Staff R. A., Kjeldsen K. K., et al. (2016). Postglacial viability and colonization in north america’s ice-free corridor. Nature 537, 45–49. doi: 10.1038/nature19085
Pedron R., Esposito A., Bianconi I., Pasolli E., Tett A., Asnicar F., et al. (2019). Genomic and metagenomic insights into the microbial community of a thermal spring. Microbiome 7, 85. doi: 10.1186/s40168-019-0625-6
Perfumo A., Çabuk U., Schulte L., Courtin J., Harms L., Stoof-Leichsenring K. R., et al. (2023). Paleometagenomics reveals environmental microbiome response to vegetation changes in northern siberia over the millennia. Environ. DNA 5, 1252–1645. doi: 10.1002/edn3.446
Qin J., Li R., Raes J., Arumugam M., Burgdorf K. S., Manichanh C., et al. (2010). A human gut microbial gene catalogue established by metagenomic sequencing. Nature 464, 59–65. doi: 10.1038/nature08821
Russian Institute of Hydrometeorological Information: World Data Center (2021). Russian institute of hydrometeorological information Vol. 2021 (World Data Center). Available online at: http://meteo.ru/english/climate/temp.php (Accessed June 18, 2021).
Saraiva J. P., Bartholomäus A., Toscan R. B., Baldrian P., Rocha U. N. (2023). Recovery of 197 eukaryotic bins reveals major challenges for eukaryote genome reconstruction from terrestrial metagenomes. Mol. Ecol. Resour. 23, 1066–1765. doi: 10.1111/1755-0998.13776
Scalzitti N., Jeannin-Girardon A., Collet P., Poch O., Thompson J. D. (2020). A benchmark study of ab initio gene prediction methods in diverse eukaryotic organisms. BMC Genomics 21, 293. doi: 10.1186/s12864-020-6707-9
Schloerke B., Cook D., Larmarange J., Briatte F., Marbach M., Thoen E., et al. (2024). GGally: extension to ggplot2. Available online at: https://ggobi.github.io/ggally/ (Accessed March 15, 2024).
Schulte L., Bernhardt N., Kathleen R., Stoof-Leichsenring, Zimmermann H. H., Pestryakova L. A., et al. (2021). Hybridization capture of larch (Larix mill.) chloroplast genomes from sedimentary ancient DNA reveals past changes of siberian forest. Mol. Ecol. Resour. 21, 801–155. doi: 10.1111/1755-0998.13311
Sonnhammer E. L., Eddy S. R., Durbin R. (1997). Pfam: A comprehensive database of protein domain families based on seed alignments. Proteins 28, 405–420. doi: 10.1002/(sici)1097-0134(199707)28:3<405::aid-prot10>3.0.co;2-l
Stanke M., Steinkamp R., Waack S., Morgenstern B. (2004). AUGUSTUS: A web server for gene finding in eukaryotes. Nucleic Acids Res. 32, W309–W312. doi: 10.1093/nar/gkh379
Stein L. Y. (2018). Eukaryotic evolution: an ancient breath of nitrate. Curr. Biol. 28, R875–R877. doi: 10.1016/j.cub.2018.06.029
Steinberg R., Koch H.-G. (2021). The largely unexplored biology of small proteins in pro- and eukaryotes. FEBS J. 288, 7002–7245. doi: 10.1111/febs.15845
Steinegger M., Söding J. (2017). MMseqs2 enables sensitive protein sequence searching for the analysis of massive data sets. Nat. Biotechnol. 35, 1026–1285. doi: 10.1038/nbt.3988
Stevens K. A., Wegrzyn J. L., Zimin A., Puiu D., Crepeau M., Cardeno C., et al. (2016). Sequence of the sugar pine megagenome. Genetics 204, 1613–1626. doi: 10.1534/genetics.116.193227
Sunagawa S., Acinas S. G., Bork P., Bowler C., Eveillard D., Gorsky G., et al. (2020). Tara oceans: towards global ocean ecosystems biology. Nat. Rev. Microbiol. 18, 428–445. doi: 10.1038/s41579-020-0364-5
Suzek B. E., Wang Y., Huang H., McGarvey P. B., Wu. C. H. (2015). UniRef clusters: A comprehensive and scalable alternative for improving sequence similarity searches. Bioinformatics 31, 926–325. doi: 10.1093/bioinformatics/btu739
Tamames J., Cobo-Simón M., Puente-Sánchez F. (2019). Assessing the performance of different approaches for functional and taxonomic annotation of metagenomes. BMC Genomics 20, 9605. doi: 10.1186/s12864-019-6289-6
The Gene Ontology Consortium, Aleksander S. A., Balhoff J., Carbon S., Cherry J.M., Drabkin H. J., et al. (2023). The gene ontology knowledgebase in 2023. Genetics 224, iyad031. doi: 10.1093/genetics/iyad031
Trimble W. L., Keegan K. P., D’Souza M., Wilke A., Wilkening J., Gilbert J., et al. (2012). Short-read reading-frame predictors are not created equal: sequence error causes loss of signal. BMC Bioinf. 13, 183. doi: 10.1186/1471-2105-13-183
van der Walt A., van Goethem M. W., Ramond J.-B., Makhalanyane T. P., Reva O., Cowan D. A. (2017). Assembling metagenomes, one community at a time. BMC Genomics 18, 5215. doi: 10.1186/s12864-017-3918-9
von Hippel B. (2024). Long-term bacteria-fungi-plant associations in permafrost soils inferred from paleometagenomics. (doctoral thesis). Universität Potsdam. doi: 10.25932/publishup-63600
von Hippel B., Stoof-Leichsenring K. R., Melles M., Herzschuh U. (2023). Updated age-depth model of sediment core PG1341 from lake lama in northern-central siberia. PANGAEA. doi: 10.1594/PANGAEA.963262
von Hippel B., Stoof-Leichsenring K. R., Schulte L., Seeber P., Epp L. S., Biskaborn B. K., et al. (2022). Long-term fungus–plant covariation from multi-site sedimentary ancient DNA metabarcoding. Quaternary Sci. Rev. 295, 107758. doi: 10.1016/j.quascirev.2022.107758
Wang Y., Pedersen M. W., Alsos I. G., Sanctis B. D., Racimo F., Prohaska A., et al. (2021). Late quaternary dynamics of arctic biota from ancient environmental genomics. Nature 600, 86–92. doi: 10.1038/s41586-021-04016-x
Wei Z.-G., Chen X., Zhang X.-D., Zhang H., Fan X.-G., Gao H.-Y., et al. (2023). Comparison of methods for biological sequence clustering. IEEE/ACM Trans. Comput. Biol. Bioinf. 20, 2874–2885. doi: 10.1109/TCBB.2023.3253138
Wei T., Simko V. (2021). R package corrplot: visualization of a correlation matrix. Available online at: https://github.com/taiyun/corrplot (Accessed April 10, 2024).
West P. T., Probst A. J., Grigoriev I. V., Thomas B. C., Jillian F. (2018). Genome reconstruction for eukaryotes from complex natural microbial communities. Genome Res. 28, 569–805. doi: 10.1101/gr.228429.117
Wibowo M. C., Yang Z., Borry M., Hübner A., Huang K. D., Tierney B. T., et al. (2021). Reconstruction of ancient microbial genomes from the human gut. Nature 594, 234–239. doi: 10.1038/s41586-021-03532-0
Wickham H. (2016). ggplot2: Elegant Graphics for Data Analysis. New York: Springer-Verlag. doi: 10.1007/978-3-319-24277-4_9
Wommack K.E., Bhavsar J., Ravel J. (2008). Metagenomics: read length matters. Appl. Environ. Microbiol. 74, 1453–1635. doi: 10.1128/AEM.02181-07
Wood D. E., Lu J., Langmead B. (2019). Improved metagenomic analysis with kraken 2. Genome Biol. 20, 2575. doi: 10.1186/s13059-019-1891-0
Yan L. (2024). Ggvenn: draw venn diagram by ggplot2. Available online at: https://github.com/yanlinlin82/ggvenn (Accessed March 15, 2024).
Yang C., Chowdhury D., Zhang Z., Cheung W. K., Lu A., Bian Z., et al. (2021). A review of computational tools for generating metagenome-assembled genomes from metagenomic sequencing data. Comput. Struct. Biotechnol. J. 19, 6301–6314. doi: 10.1016/j.csbj.2021.11.028
Zhang S.-W., Jin X.-Y., Zhang T. (2017). Gene prediction in metagenomic fragments with deep learning. BioMed. Res. Int. 2017, 4740354. doi: 10.1155/2017/4740354
Zhang Z., Yang C., Veldsman W. P., Fang X., Zhang L. (2023). Benchmarking genome assembly methods on metagenomic sequencing data. Briefings Bioinf. 24, bbad087. doi: 10.1093/bib/bbad087
Zhu X.-Y., Liu J., Xue C.-X., Tian J., Zhang A. X.-H. (2021). Shift and metabolic potentials of microbial eukaryotic communities across the full depths of the mariana trench. Front. Microbiol. 11. doi: 10.3389/fmicb.2020.603692
Zimmermann H. H., Stoof-Leichsenring K. R., Dinkel V., Harms L., Schulte L., Hütt M.-T., et al. (2023). Marine ecosystem shifts with deglacial sea-ice loss inferred from ancient DNA shotgun sequencing. Nat. Commun. 14, 16505. doi: 10.1038/s41467-023-36845-x
Zimorski V., Ku C., Martin W. F., Gould S. B. (2014). Endosymbiotic theory for organelle origins. Current opinion in microbiology. Growth development: eukaryotes/prokaryotes 22, 38–48. doi: 10.1016/j.mib.2014.09.008
Keywords: eukaryotes, functional genes, paleoecosystem, paleo metagenomics, sedimentary ancient DNA (sedaDNA)
Citation: Çabuk U, Herzschuh U, Harms L, von Hippel B and Stoof-Leichsenring KR (2025) Functional annotation of eukaryotic genes from sedimentary ancient DNA. Front. Ecol. Evol. 13:1459690. doi: 10.3389/fevo.2025.1459690
Received: 04 July 2024; Accepted: 24 January 2025;
Published: 19 February 2025.
Edited by:
Laura Parducci, Sapienza University of Rome, ItalyReviewed by:
Mauro Mandrioli, University of Modena and Reggio Emilia, ItalyXiaofeng Cao, Tsinghua University, China
Copyright © 2025 Çabuk, Herzschuh, Harms, von Hippel and Stoof-Leichsenring. This is an open-access article distributed under the terms of the Creative Commons Attribution License (CC BY). The use, distribution or reproduction in other forums is permitted, provided the original author(s) and the copyright owner(s) are credited and that the original publication in this journal is cited, in accordance with accepted academic practice. No use, distribution or reproduction is permitted which does not comply with these terms.
*Correspondence: Kathleen R. Stoof-Leichsenring, a2F0aGxlZW4uc3Rvb2YtbGVpY2hzZW5yaW5nQGF3aS5kZQ==