- 1College of Horticulture and Landscape Architecture, Northeast Agricultural University, Harbin, China
- 2School of Physics and Electronic-Electrical Engineering, Aba Teachers College, Aba, China
Ecosystem services (ES) such as carbon storage (CS), soil conservation (SC), habitat quality (HQ), and water yield (WY) play a crucial role in maintaining ecological balance and supporting sustainable regional development. With increasing environmental changes, understanding the spatiotemporal dynamics of these services and their driving factors has become essential in environmental science. This study focuses on the Nanchang metropolitan area, quantifying CS, SC, HQ, and WY from 2000 to 2020. It explores the impacts of major factors, including climate, topography, and social aspects, on the spatial heterogeneity of ES. The results reveal that between 2000 and 2020, CS and HQ decreased by 0.1385×10⁸ tons/ha and 0.0507, respectively, while SC and WY increased by 2.4754×10⁹ tons/ha and 1.6668×10¹⁰ m3, respectively. Notable spatial heterogeneity exists in the correlation between driving factors and changes in ES. The spatial distribution of ESs is higher in mountainous regions compared to central plains. Among human factors, population (POP) and gross domestic product (GDP) predominantly influenced changes in CS and HQ, whereas climate and POP drove changes in SC. Changes in WY were primarily affected by climate and topography. These findings suggest a need to focus on key driving factors to formulate targeted land policies aimed at enhancing the ES value in the Nanchang metropolitan area.
1 Introduction
Ecosystem Services (ES) refers to the environmental conditions and natural benefits that ecosystems provide to humans through their structure, processes and functions to meet the needs of human survival and development (Hasan et al., 2020; Mengist et al., 2020; Mandle et al., 2021). In recent years, global climate change and urban development have led to a discernible deterioration in ecosystem conditions, a concern that has garnered widespread attention from governments and academia alike (Valencia Torres et al., 2021; Aryal et al., 2022). Researchers have established that both natural and anthropogenic factors influence ES, rendering their interrelationships complex and dynamic (De Valck et al., 2023). Consequently, investigating the spatiotemporal dynamics of ES and analyzing the spatial heterogeneity of multiple driving factors can elucidate the interactions between these factors and ES, thereby supporting efforts to maintain regional ecological balance and promote sustainable development.
The quantification of ES functions is primarily performed using various models to analyze their supply and demand, trade-offs, and driving factors. Currently, prominent quantitative tools for evaluating ES include the ARIES model (Villa et al., 2014), the InVEST model (Dashtbozorgi et al., 2023), the SoLVES model (Guan et al., 2023), and the TESSA model (Perosa et al., 2021) and CICES model (Czúcz et al., 2018). The InVEST model is widely used in the quantitative analysis of ES due to its multifunctionality (including modules for carbon storage, soil conservation, habitat quality, and water yield) as well as its operational flexibility and well-developed theoretical framework. Although the current literature provides several models for evaluating ES, discussions predominantly focus on the application of these models, with limited in-depth analysis of their adaptability and accuracy in different environments. For instance, studies by Locatelli et al. (2014) and Bernués et al. (2014) utilized the InVEST model to analyze ecosystem services but lacked a critical discussion on the model’s adaptability and limitations. Additionally, the research by Na et al. (2023), which predicts future land use changes and their impacts on ES values using the MCE-CA-Markov model, indicates a need for further exploration of the model’s effectiveness in predicting and quantifying ES and its applicability in various ecological settings. Current research often considers ecosystem services collectively when analyzing ES driving factors, overlooking the potential heterogeneity in function among different ES and its impact on strategy formulation. Identifying these factors and analyzing their spatial heterogeneity are crucial for advancing sustainable management of regional ES.
A multitude of factors influences ES, including temperature, precipitation, biological activities, soil, and terrain (Jia et al., 2023). Identifying the impacts of these factors on ES presents a significant challenge (Birkhofer et al., 2015). Research on the driving factors of ES is typically categorized into non-spatial and spatial regression models. Non-spatial regression models, which include scenario analysis (Landuyt et al., 2016), redundancy analysis (Nogues et al., 2023), and least squares analysis. For example, Wu et al. (2019) selected a redundancy analysis model to conduct a ranking analysis of 109 cities at the urban scale, and identified that the forest proportion was the most important influencing factor in the supply of ecosystem services; Sun et al. (2021) used the GeoSoS-FLUS model to explore the impact of land use changes in intensive agricultural areas in North China on ecosystem services under different scenarios, and proposed a framework that combines scenario analysis with ecosystem service quality evaluation. However, the non-spatial model has obvious drawbacks and ignores the potential spatial effects. In contrast, spatial regression models mainly include geographic detectors (Wang et al., 2021), spatial autocorrelation models (Koenig, 1999), and geographically weighted regression (Farber and Páez, 2007), which take into account the spatial heterogeneity of influencing factors more comprehensively and provide more comprehensive research on the driving factors of ESs (Liu et al., 2022). For example, Zhou Y. et al. (2023) used the geographic detector model to identify the driving factors behind the fluctuations in the value of ecosystem services in the Liangzi Lake Basin, indicating that the intensity of human activities and NDVI detection results were the most obvious. Ren et al. (2020) used the geographically weighted regression model to analyze the driving factors of land change in the Loess Plateau of China, and explored the common dominant factors associated with altitude and four major land use types (forestland, grassland, farmland and built-up area).
However, existing research methods tend to apply a single model, and usually lack a comprehensive analysis that combines non-spatial models with spatial models. This limitation leads to an incomplete understanding of the impact of driving factors. We believe that by first using geographic detectors to identify the influencing factors of the main ES, and then using geographically weighted regression models to analyze the spatial heterogeneity of these factors in different regions, we can better deal with complex and large-scale multi-factor problems. This method can reveal the changing characteristics and impact patterns of each factor at different spatial scales, and provide more refined tools and methods for understanding the spatial distribution and driving mechanism of ES.
In addition, many current studies tend to consider the driving factors of ES comprehensively and use unified indicators or methods to analyze the driving factors of these services. Although this method can provide an overall perspective, it often ignores the functional differences between different ES and their spatial heterogeneity. For example, Zhang et al. (2021) explored the spatial distribution of ES in the Yellow River Basin and used GDM to explore the impact of detecting a single driving variable on ES distribution; Li et al. (2024) detected the overall driving factors of ES in different terrain types in the Sichuan-Yunnan Ecological Barrier Zone in China through the optimal geographic detector model and conducted a holistic analysis of the driving factors of ESs. Although this comprehensive approach can outline the overall picture, it often fails to reveal the functional differences between individual ES and their impact on strategy formulation.
Therefore, based on existing research, the innovation of this study is to combine GDM and GWR models to propose a more refined analytical framework to refine the spatial heterogeneity of the driving factors of ES. This method can simultaneously identify the main driving factors affecting ES and deeply analyze the spatial heterogeneity of these factors in different geographical regions. Different from traditional comprehensive research methods, our study not only considers the overall perspective, but also focuses on the functional differences between different ES and their spatial heterogeneity. This detailed analysis can more accurately reveal the changing patterns of various factors at different spatial scales, provide more comprehensive tools and methods for understanding the spatial distribution and driving mechanism of ES, and provide a more precise scientific basis for regional ecological management and strategy formulation.
This study particularly focuses on the Nanchang metropolitan area, a representative research area. The Nanchang metropolitan area, situated in the central segment of China’s Yangtze River Economic Belt, is Jiangxi Province’s most densely populated and economically vibrant urban agglomeration. This region encompasses Poyang Lake, the largest freshwater lake in China, along with extensive forest resources, which serve as critical ecological buffers within the Economic Belt. In 2019, the Jiangxi Provincial Government promulgated the Nanchang metropolitan area Development Plan (2019-2025), targeting the establishment of an aesthetically pleasing ecological spatial arrangement by 2035 to underscore the commitment to sustainable ecosystem development. Despite these ambitions, the Nanchang metropolitan area remains in a nascent stage of urbanization compared to other global urban centers. Presently, urban growth is poorly integrated with rural development, leading to disparate resource distribution and heightened ecological stress. The infrastructure development lags behind, requiring enhanced alignment with ecological sustainability goals (Chen et al., 2023). Moreover, the rapid urbanization pace and significant land use alterations, involving the conversion of farmland and green spaces to commercial and residential uses, are diminishing regional biodiversity, intensifying the urban heat island phenomenon, and degrading living conditions. Current studies indicate marked geographic discrepancies in ecosystem service responses to various drivers (Ajaz Ahmed et al., 2017). While global and regional analyses often identify broad patterns, they frequently overlook critical local environmental and socio-economic nuances (He et al., 2019), leading to a generalized understanding that may not accurately capture the unique ecological and developmental challenges specific to regions.
Furthermore, our review of existing literature revealed a significant gap in research on ecosystem services within the Nanchang metropolitan area, particularly in the context of spatiotemporal dynamics and the heterogeneity of driving factors. Consequently, this article aims to: (1) assess the ecosystem service functions in the Nanchang metropolitan area using the InVEST model; (2) investigate the spatial heterogeneity of critical drivers affecting various ES. This study holds profound implications for enhancing regional ecological balance and advancing sustainable development strategies in the Nanchang metropolitan area.
2 Research area and methods
2.1 Study area
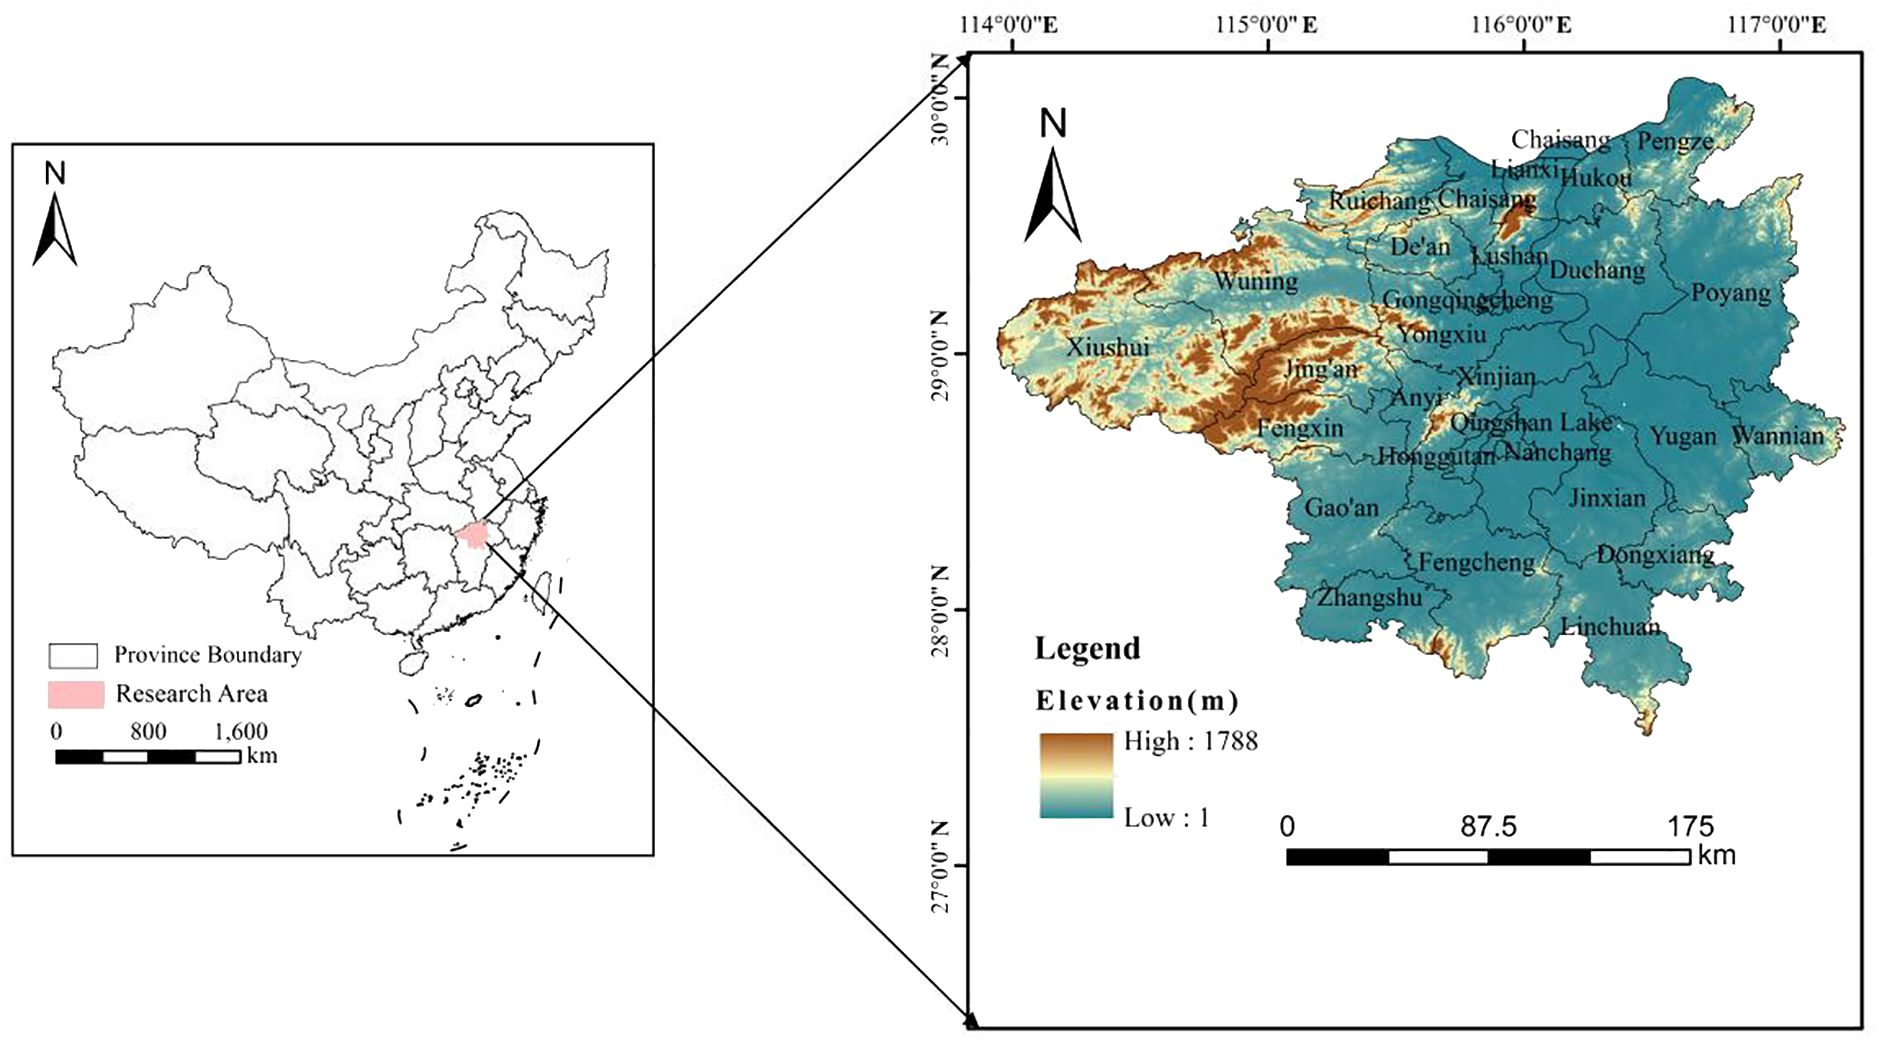
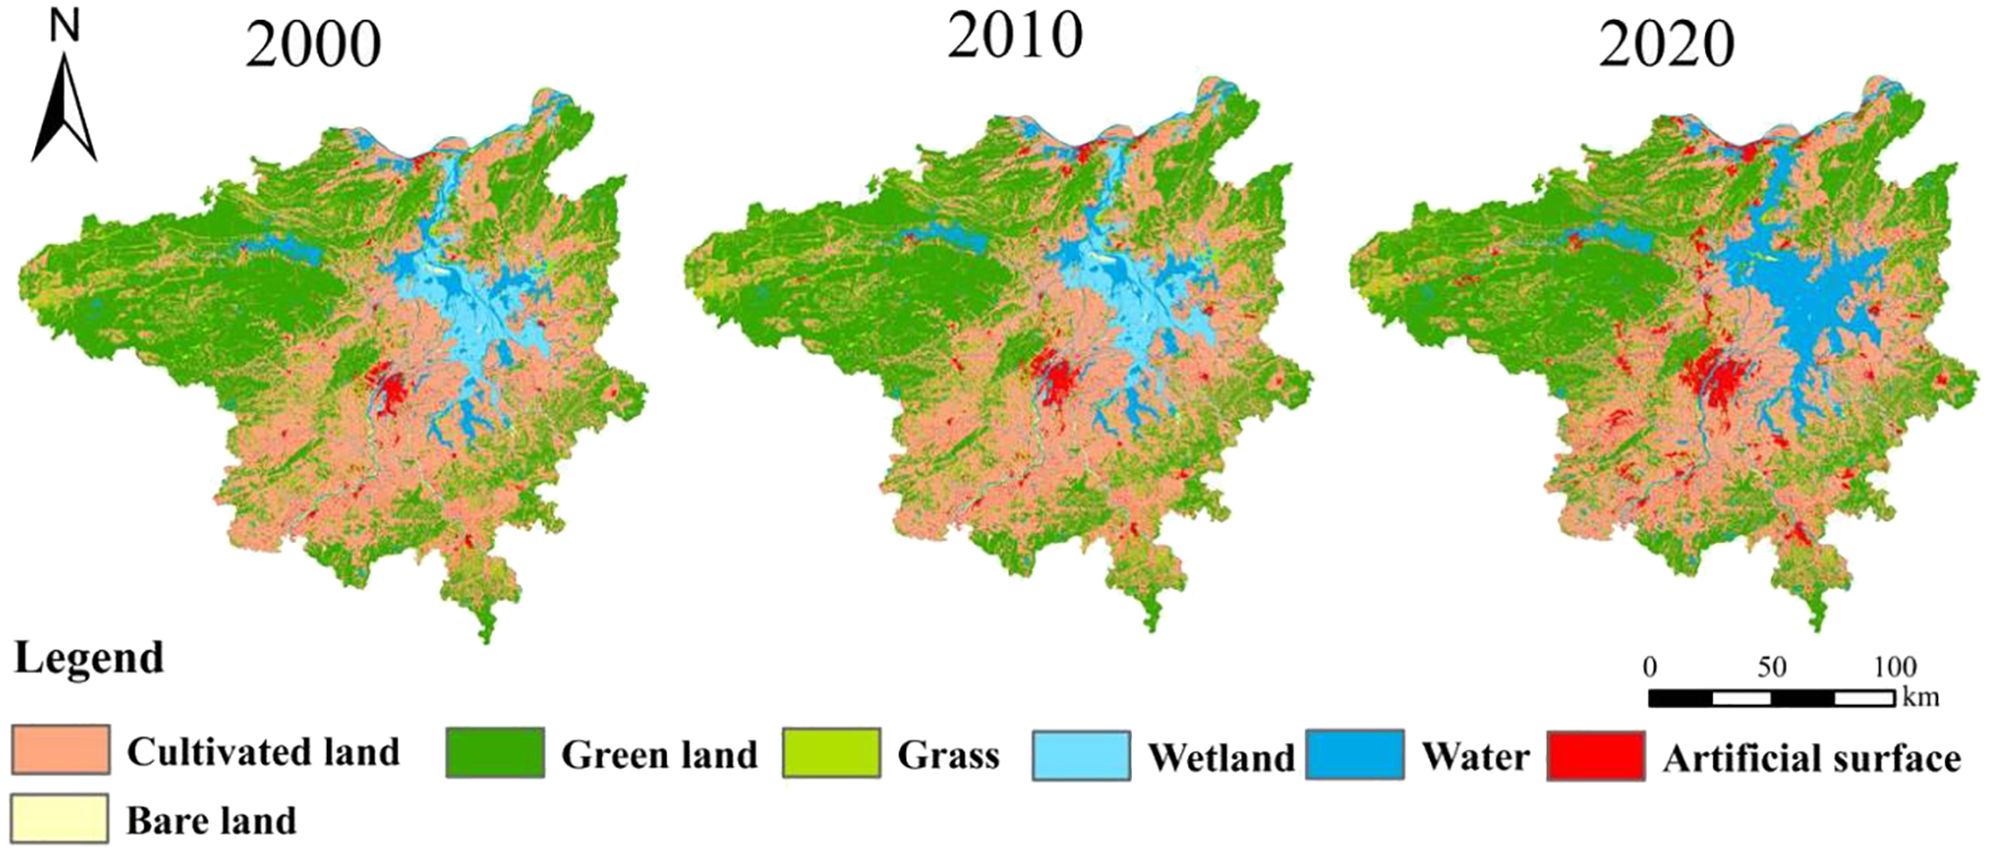
The Nanchang metropolitan area, located in the northern part of Jiangxi Province within China’s Yangtze River Delta region, encompasses cities including Nanchang, Jiujiang, and the Fuzhou districts of Linchuan and Dongxiang, as well as Yichun (covering Fengcheng, Zhangshu, Fengxin, Gao’an, Jing’an) and Shangrao (Poyang, Yugan, Wannian) (Figure 1). The Nanchang metropolitan area features a general topography that is high in the west and low in the east, with relatively flat terrain dominated by plains. The primary vegetation type is subtropical evergreen broad-leaved forest. The land use types are mainly categorized cultivated land, green land, grass, wetland, water, artificial surfaces, and bare land, with cultivated land and green land comprising a significant proportion of the total land use area (Figure 2, Supplementary Table S1). This area falls within the subtropical monsoon climate zone, experiencing an average annual temperature of 16-23°C and receiving annual precipitation ranging from 1368 to 1790 mm, which predominantly occurs in summer. As of the end of 2020, the total population of the area was approximately 27.39 million, and the GDP stood at 1.592 trillion yuan. Its strategic geographical and transportation advantages are marked by its position at the intersection of the Yangtze River’s horizontal urbanization axis and the Beijing-Kowloon development axis, enhancing its pivotal role in connecting eastern and western China, as well as linking the northern and regions.
2.2 Data source
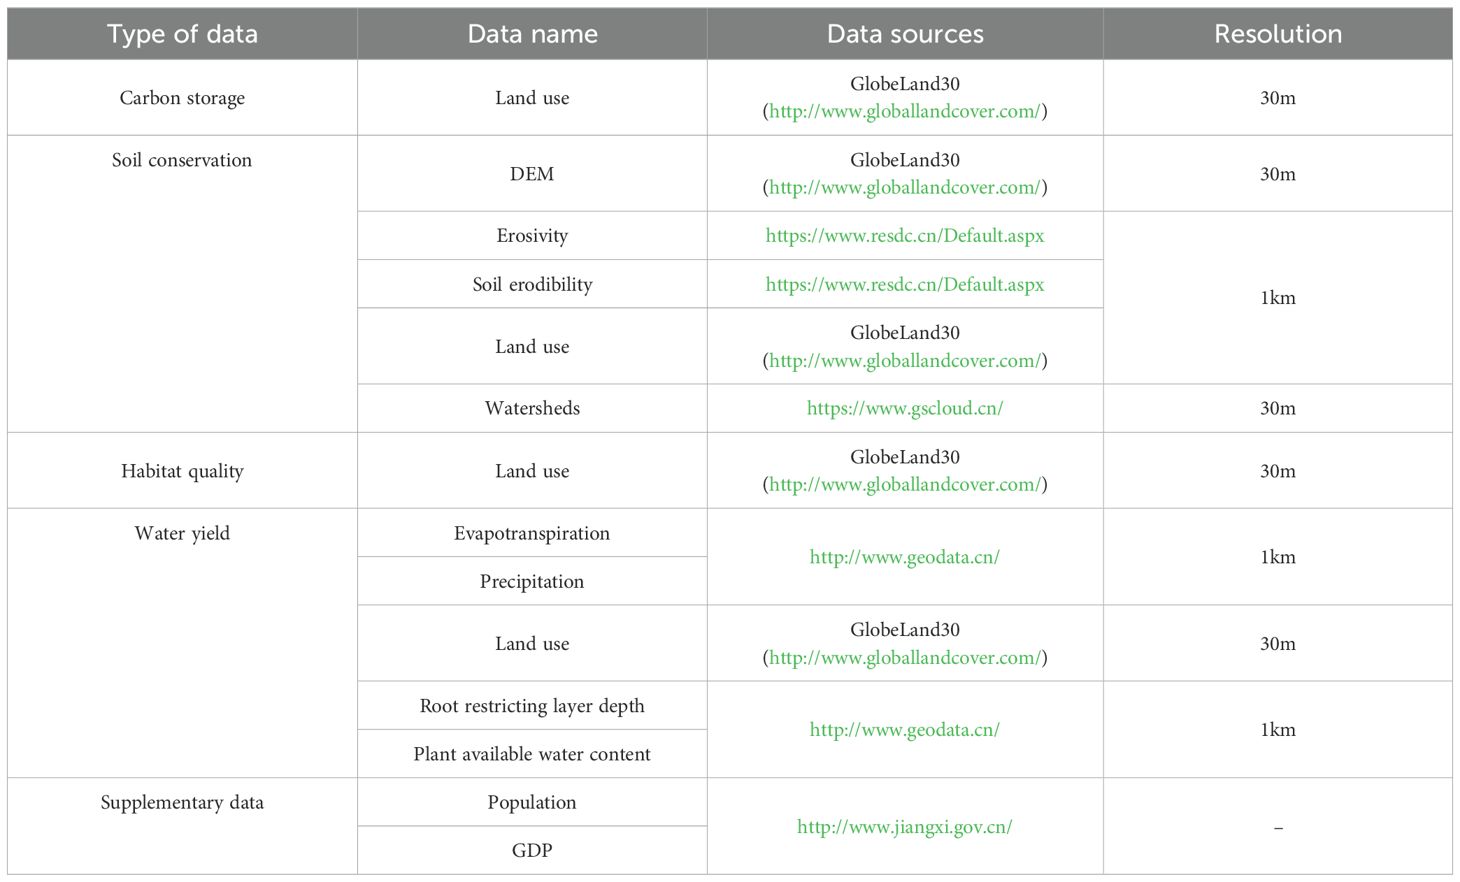
The InVEST model is known as the Ecosystem Services Assessment Tool, which was jointly created by Stanford University, the World Wildlife Fund and the Nature Conservancy. The model includes three modules for assessing freshwater, marine and terrestrial ecosystems, including annual water production (Allen et al., 2005), sediment delivery rate (Cavalli et al., 2013), habitat quality (Franklin and Lindenmayer, 2009), habitat risk assessment (Arkema et al., 2015), carbon storage and sequestration (Antle and Diagana, 2003), etc. This study mainly utilized the Carbon Storage, Soil Conservation, Habitat Quality, and Water Yield modules in the InVEST model. The basic data and related supplementary data sources for each module are shown in Table 1.
2.3 Research methods for quantifying ecosystem services
In recent years, the escalating urbanization in the Nanchang metropolitan area has led to significant changes in land use, subsequently affecting regional ES (Liu et al., 2023). For this study, we identified four critical ES from 2000 to 2020, namely carbon storage (CS), soil conservation (SC), habitat quality (HQ), and water yield (WY). CS plays a crucial role in mitigating global climate change, SC prevents soil erosion and maintains surface water quality, while WY is essential for regional water resource supply. HQ is vital for maintaining biodiversity. These services are critical for maintaining ecological balance and promoting sustainable development, particularly in response to the ecological changes induced by urbanization. The selection of these services is based on their relevance to regional environmental policies, specific environmental characteristics, long-term ecological trend assessments, and the support of existing scientific data. This aims to provide local governments with scientific evidence for ecological protection and resource management (Duan et al., 2023; Dai et al., 2024). To quantify these ES, we employed the InVEST model, which utilizes land use data to assess regional ES and ascertain their spatial distribution characteristics. This model has been extensively applied across various studies on ES (Li and Luo, 2023; Zhou J. et al., 2023). The four formulas for quantifying ES will be explained below.
2.3.1 Carbon storage
The InVEST model categorizes the CS module into four primary carbon pools: the above-ground biocarbon pool, underground biocarbon pool, soil carbon pool, and dead organic carbon pool (Xue et al., 2023). The InVEST model categorizes the CS module into four primary carbon pools: the above-ground biocarbon pool, underground biocarbon pool, soil carbon pool, and dead organic carbon pool (Gang et al., 2011):
In the formula, is the total carbon storage (Mg/ha); is the above-ground carbon storage (Mg/ha); is the underground carbon storage (Mg/ha); is the soil carbon storage (Mg/ha); is the dead organic matter carbon storage (Mg/ha). The carbon density data refer to previous studies in the study area and the model manual (Huang et al., 2023) (Supplementary Table S2).
2.3.2 Soil conservation
SC in the InVEST model is an enhancement of the classic Soil Loss Equation (USLE) within the Sediment Delivery Ratio (SDR) module. This module quantifies the spatial dynamics of soil erosion on slopes and sediment transport across watersheds (Yang et al., 2024). The calculation formula utilized is as follows (Li et al., 2023):
In the formula, represents the amount of soil conservation(tons·(ha·yr)−1); represents the amount of potential soil erosion (tons·(ha·yr)−1); represents the amount of actual soil erosion(tons·(ha·yr)−1); represents the average rainfall erosiveness; represents the soil erodibility factor; represents the slope length factor; represents the soil and water conservation measure factor; is the vegetation coverage and management factor.
2.3.3 Habitat quality
The HQ module within the InVEST model is a critical component utilized across numerous ecological assessment models due to its high accuracy (Bastos et al., 2023). The formula employed is detailed below (Nie et al., 2023):
In the formula, is the habitat suitability of the land cover type, is the half-saturation constant, Z is the constant, and is the HQ index, usually ranging from 0 to 1. The closer to 1, the better the HQ. The operation of this module requires relevant data. We referred to the model manual and relevant literature (Zhang et al., 2020; Zhang et al., 2024). At the same time, we comprehensively considered the actual conditions of the study area, and set the cultivated land, artificial surface, and bare land that is subject to greater human interference among the land types are stress factors, and woodland, grassland, wetland, and water bodies are set as habitat factors (Supplementary Tables S3, S4).
2.3.4 Water yield
The WY module within the InVEST model calculates the annual water yield for each grid cell using the Budyko curve, integrated with data on average annual precipitation specific to the study area (Huang et al., 2024). The computational formula applied is outlined below (Scordo et al., 2018):
In the formula, represents the annual water production of the grid unit (mm), represents the annual precipitation of the grid unit (mm), and represents the annual actual evapotranspiration of the grid unit (mm).
2.3.5 ES impact
2.3.5.1 Geographic detector model
The GDM is a statistical method developed by Wang Jinfeng that is utilized to explore global spatial differentiation and identify underlying driving factors (Wang et al., 2021). In this study, factor detectors are employed to ascertain the explanatory power of independent variable factors for more detailed analysis. The specific formula used is outlined below (He et al., 2023):
In the formula, is a value between 0 and 1 – the closer to 1, the stronger the explanatory power; L represents the stratification of variables; represents the total number of samples of variable h in the study area; represents the number of samples of variable h; represents the variance of the study area; represents the discrete variance of the variable h in the subregion.
2.3.5.2 Geographically weighted regression
The GWR model is designed to account for spatial variations by establishing localized regression relationships between independent and dependent variables, thereby avoiding errors typically associated with spatial disparities (Ali et al., 2024). This model enhances the Ordinary Least Squares (OLS) method by incorporating spatial non-stationarity to better characterize local variations. In this study, GWR is employed to examine the spatial heterogeneity of the impacts of driving factors on ES in the study area. The specific formula used is detailed below (Liu et al., 2019):
Among them, i represents the given observation value; represents the explanatory variable; is the k-th independent variable; is the geographical coordinate; is the error term of the i-th sampling point, which represents the regression coefficient. The spatial variation of this model is affected by bandwidth, which is a positive attenuation parameter of the functional correlation between weights and distances.
3 Result analysis
3.1 The spatial changes of ESs
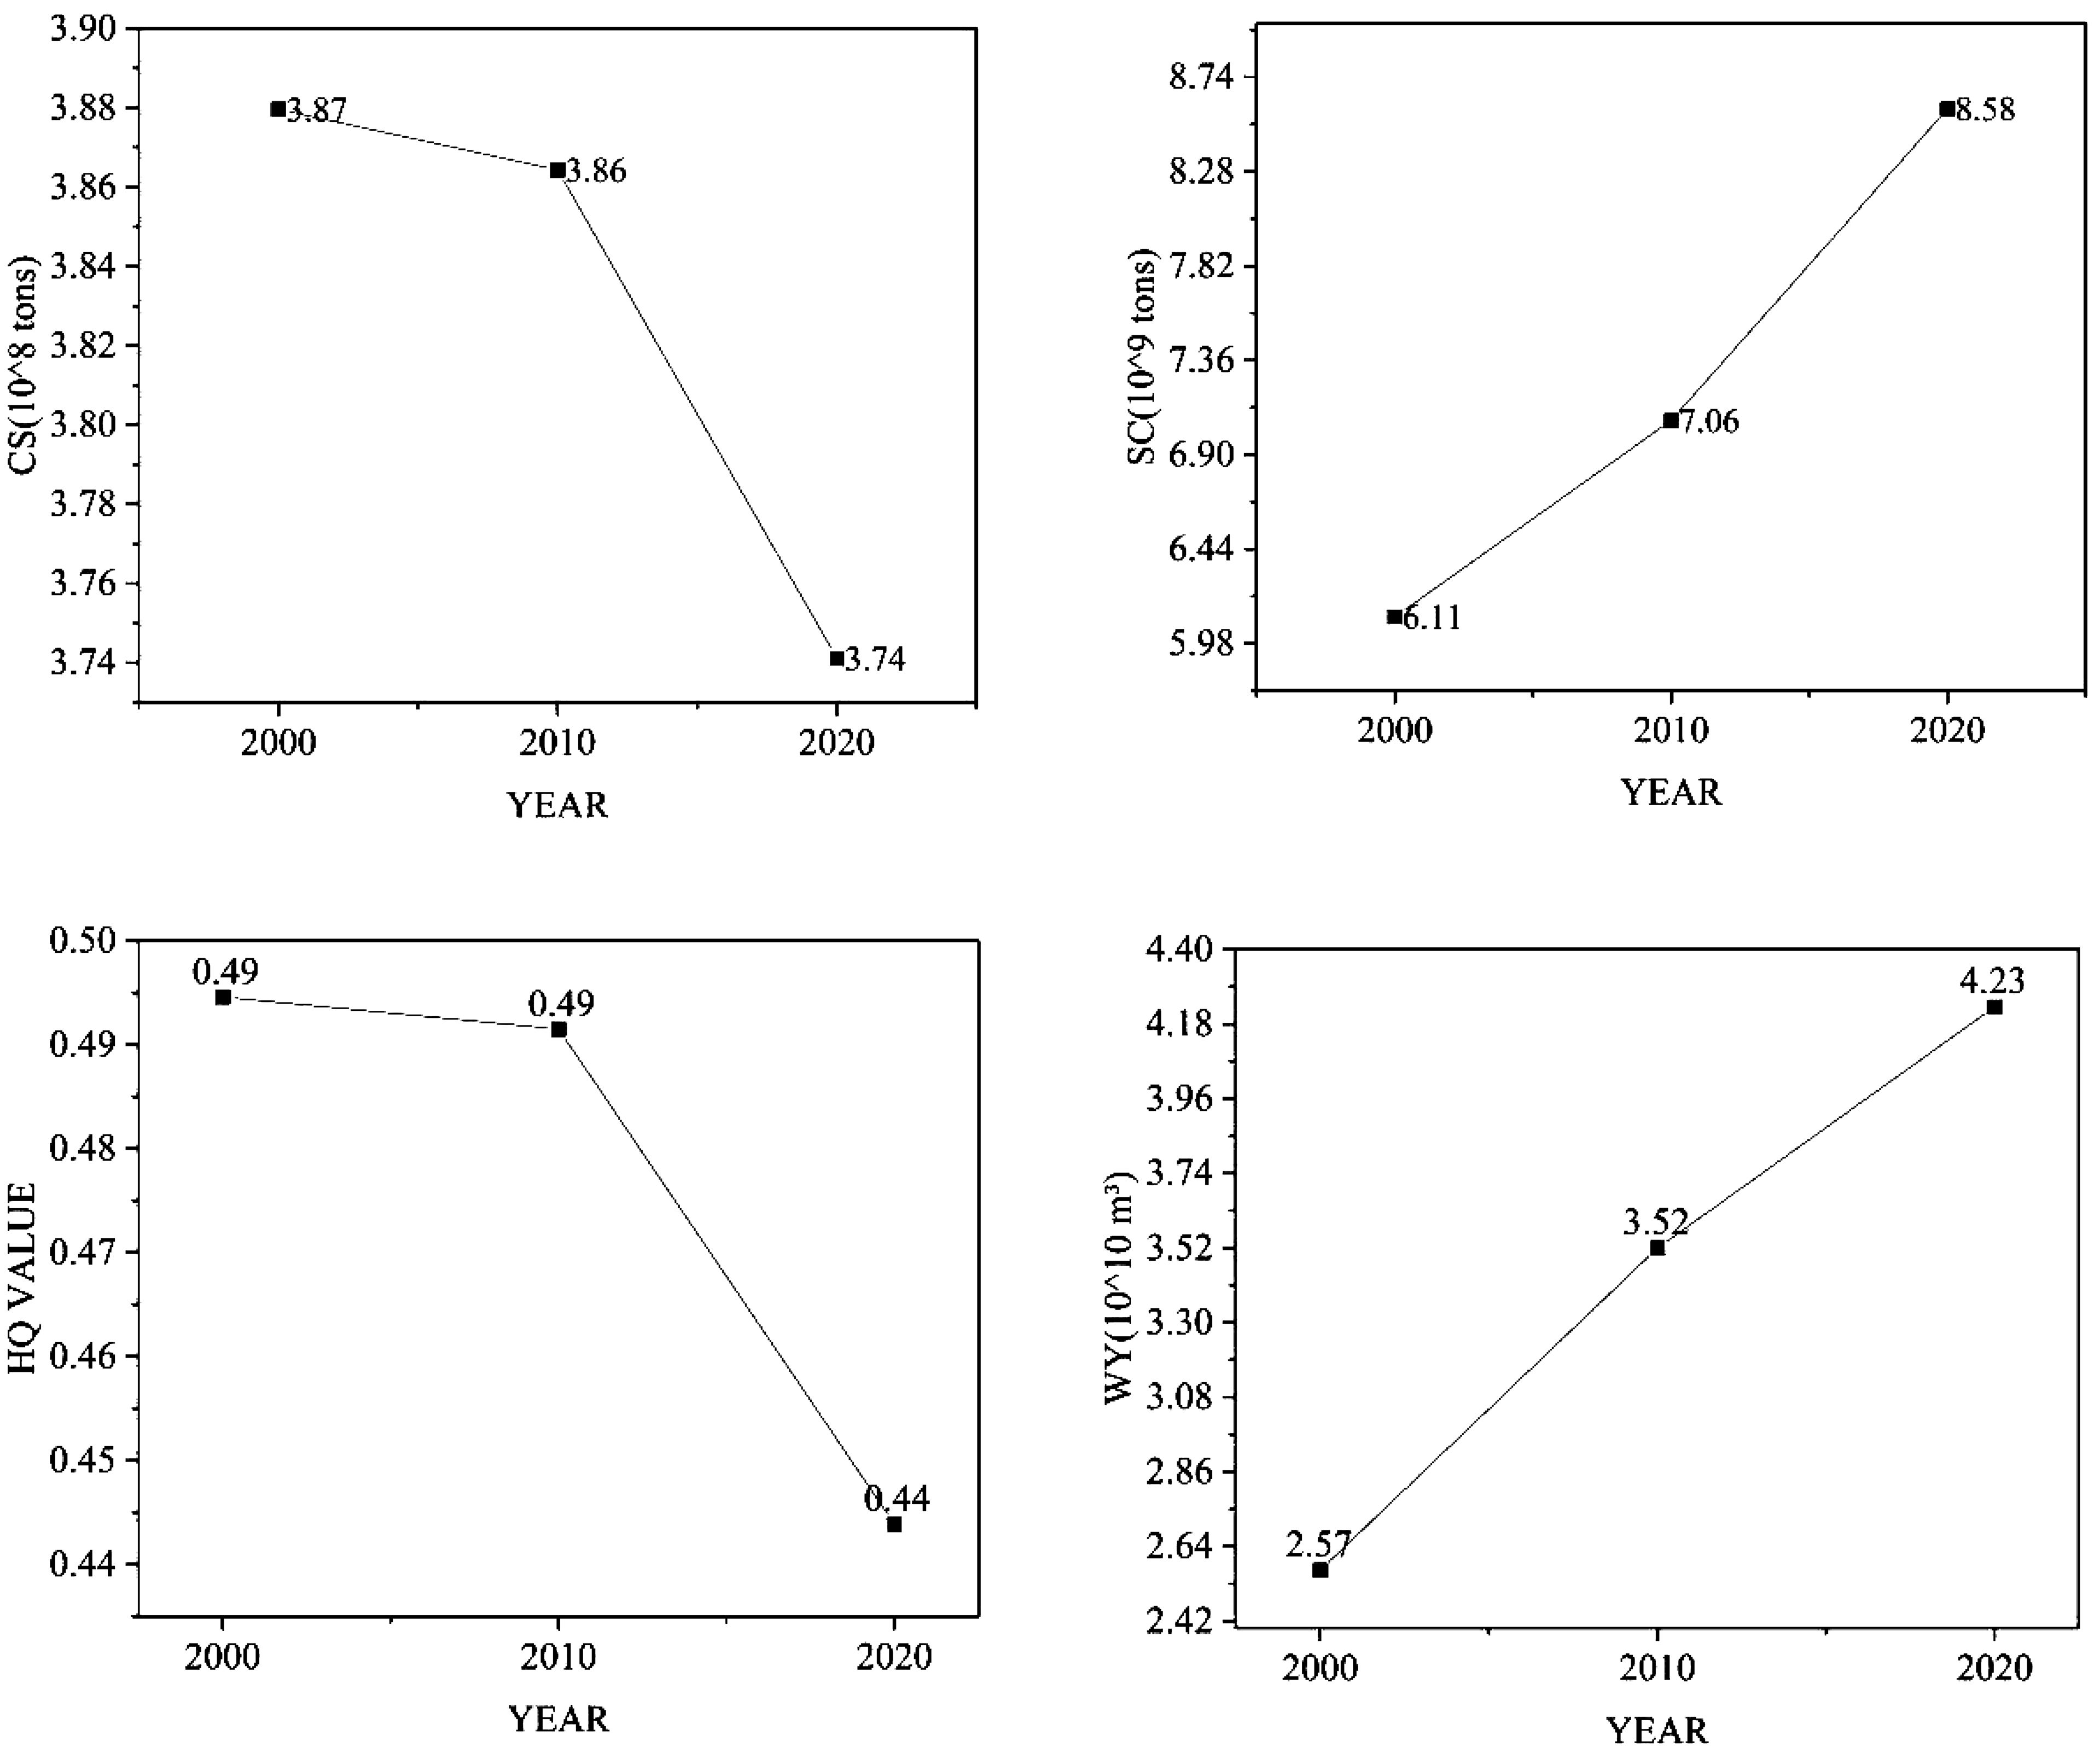
The InVEST model was utilized to analyze the spatial dynamics of ESs in the Nanchang metropolitan area from 2000 to 2020, as shown in Figure 3. The ES values were exported from ArcGIS 10.8 to an Excel spreadsheet for statistical analysis and depicted in Figure 4.
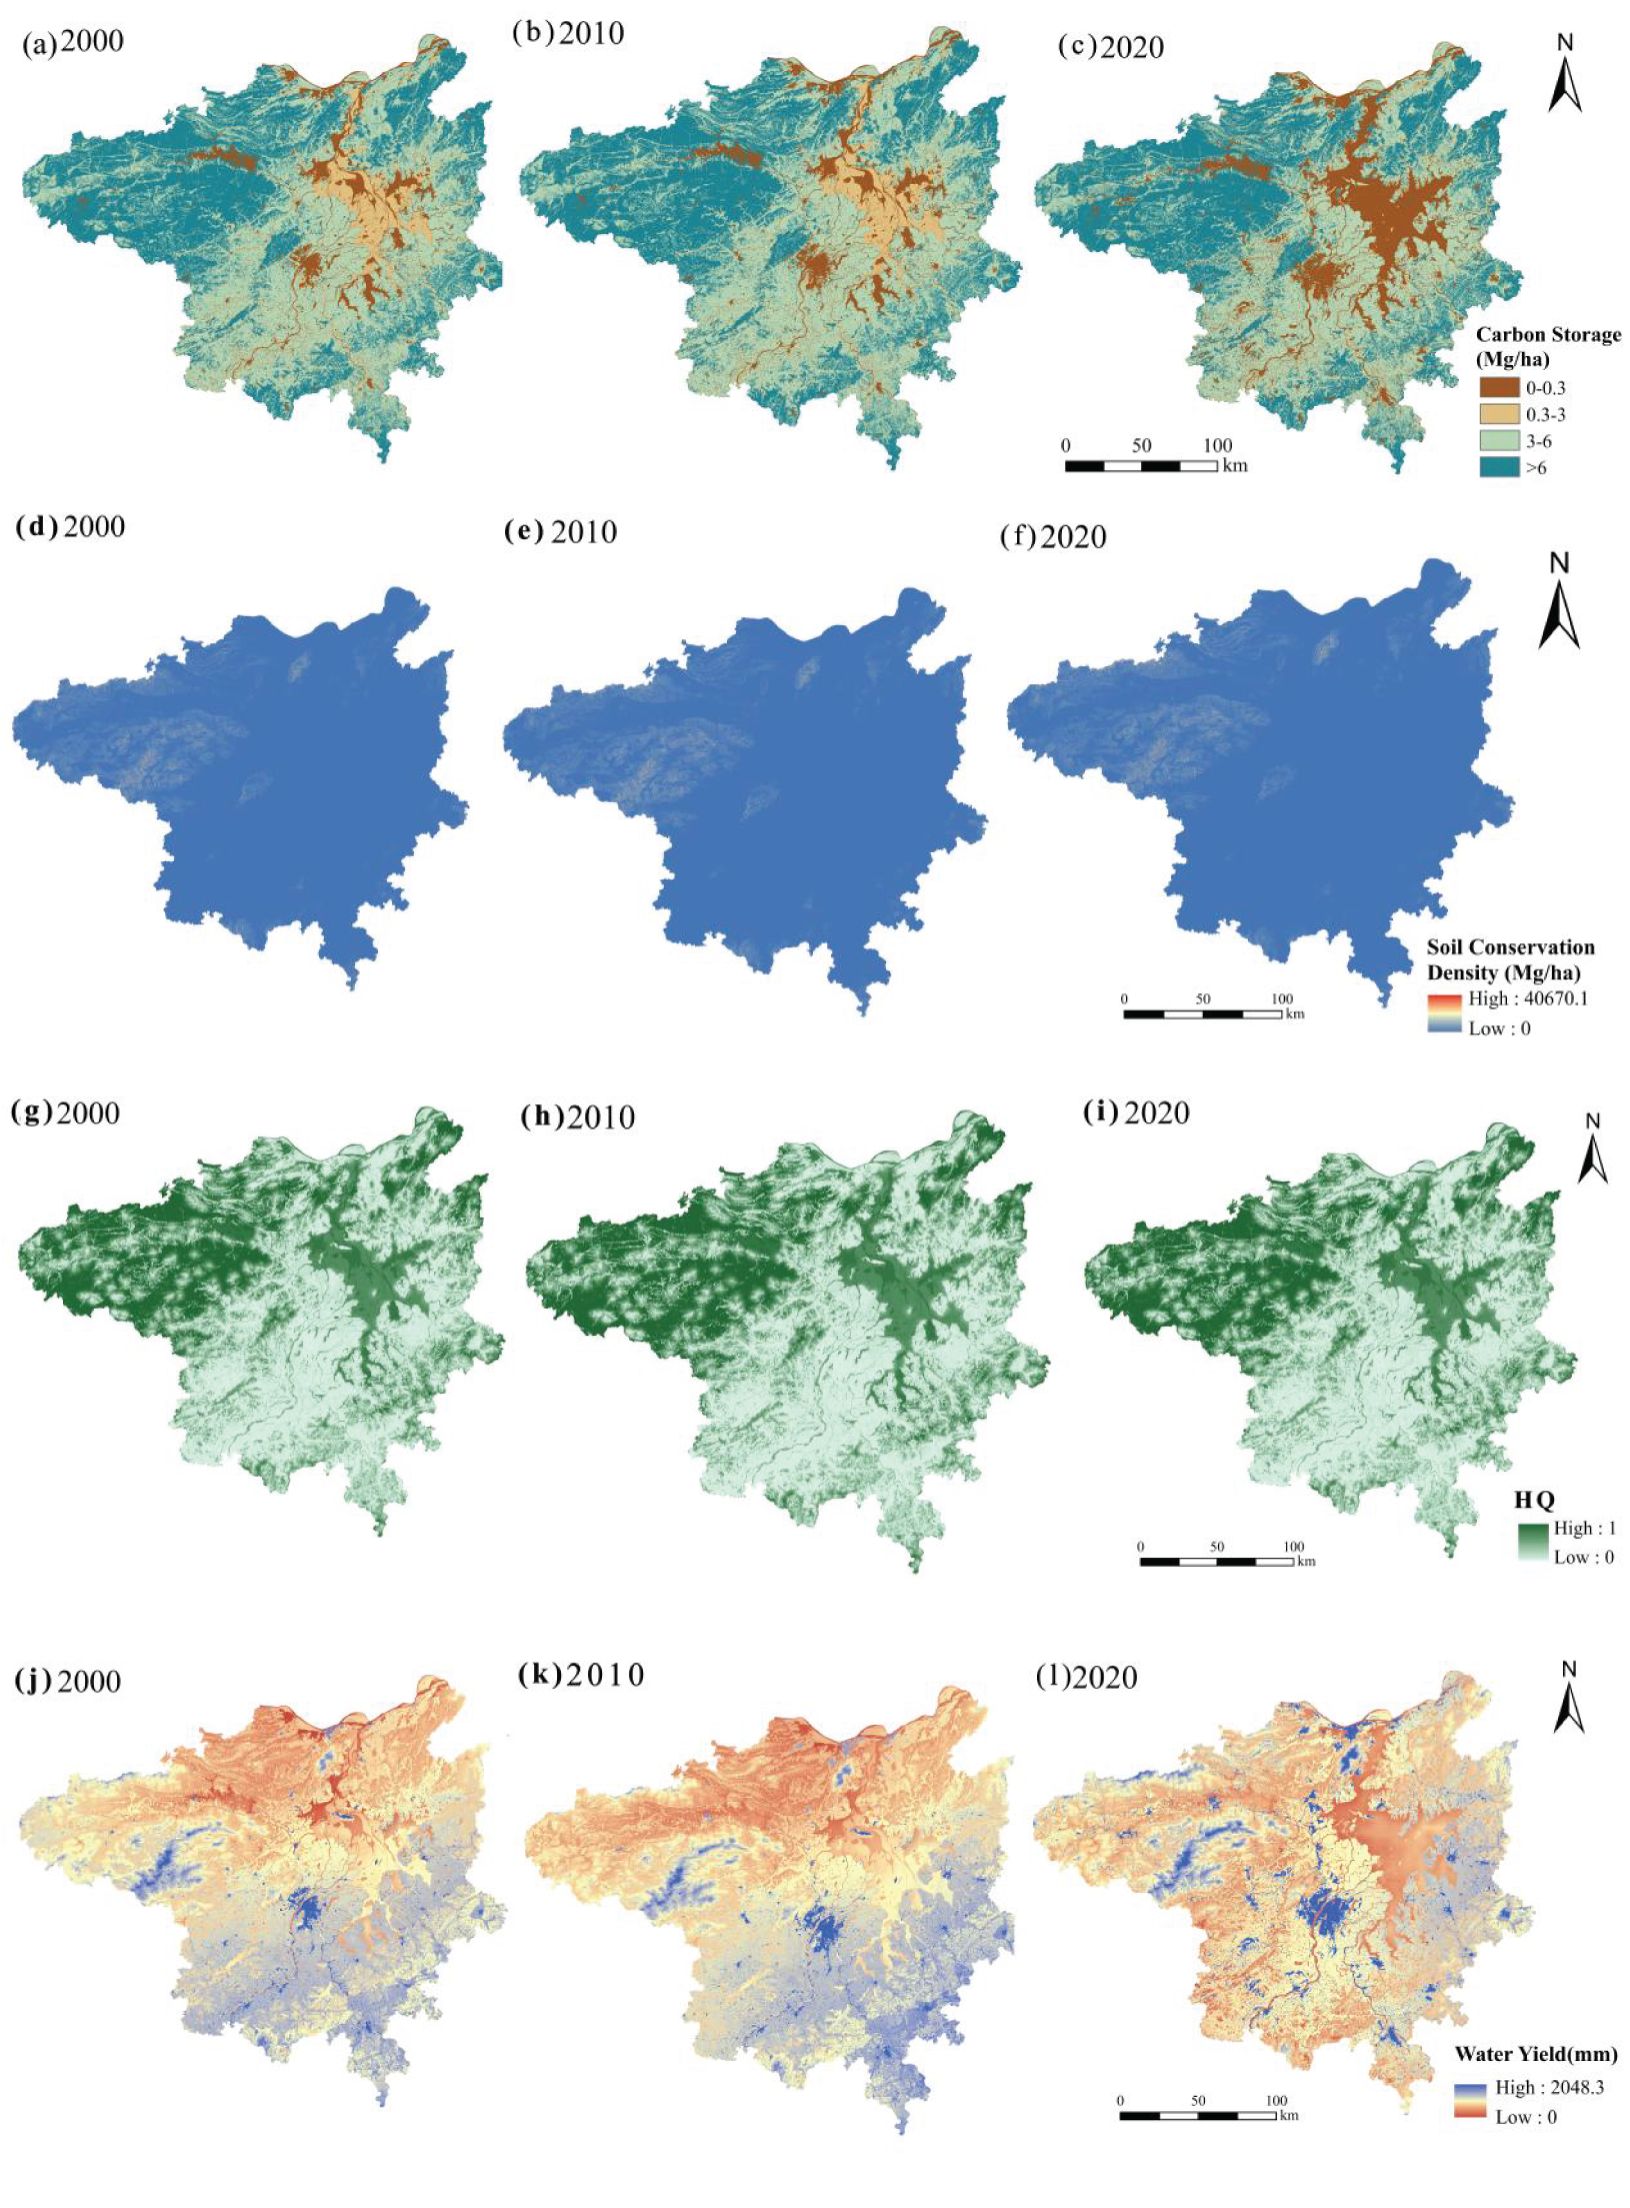
Figure 3. Spatial dynamic distribution of ESs from 2000 to 2020. (A–C) represents carbon storage; (D–F) represents soil conservation; (G–I) represents habitat quality; (J–L) represents water yield.
In the case of CS in the Nanchang metropolitan area, the total carbon stored in 2000 was 3.8796×10⁸ tons/ha, decreasing slightly to 3.8643×10⁸ tons/ha in 2010, and further to 3.7411×10⁸ tons/ha by 2020. The region exhibited a continuous decline in total CS, with a net decrease of 0.1385×10⁸ tons/ha during this period, primarily occurring in the Poyang Lake basin. Geographically, areas with lower CS density included central Duchang County, eastern parts of Xinjian County, east of Gongqing City, western Poyang County, western Yugan County, and the Honggutan District in downtown Nanchang. In contrast, higher CS densities were concentrated in the northwestern parts such as Xiushui County and Wuning County. This is attributed to the dense forests in the northwestern part of the metropolitan area, which have high vegetation cover and thus greater carbon storage capacity, whereas central areas predominantly consist of water bodies and croplands which have lower above-ground carbon density. Additionally, the carbon density of aquatic areas has notably decreased due to intensified water management efforts by local authorities since 2000.
Regarding SC changes, spatially, regions with high soil conservation values were less widespread, mostly clustered in the western areas including Jing’an County, Fengxin County, Wuning County, and Xiushui County, and around Chaizang and Lianxi districts in the north. Temporally, SC was 6.1105×10⁹ tons/ha in 2000, increasing to 7.0673×10⁹ tons/ha in 2010, and reaching 8.5859×10⁹ tons/ha in 2020, marking an overall increase of 2.4754×10⁹ tons/ha over the period. This rise in soil conservation was facilitated by reforestation and afforestation policies launched by the Jiangxi provincial government in 2010, leading to an expansion in forested areas and consequently improved soil conservation.
The spatial distribution of HQ density from 2000 to 2020 was predominantly high around Poyang Lake in Duchang County, Gongqing City, Xinjian County, Poyang County, Yugan County, and the western parts of Jing’an County, Fengxin County, Wuning County, and Xiushui County. Areas with lower HQ densities included Nanchang’s main urban district, Fengcheng City, Gao’an City, and Zhangshu City. The average HQ values decreased overall from 0.4946 in 2000 to 0.4915 in 2010 and 0.4439 in 2020, indicating a deterioration in the ecological environment of the study area. This decline in HQ was mainly due to the increasing urbanization in Nanchang, where urban surfaces continuously encroached upon water bodies and forests, leading to a decrease in HQ. Conversely, regions around Poyang Lake such as Duchang County saw improvements in HQ due to enhanced water management efforts by local authorities.
For WY, the density concentration from 2000 to 2020 was mostly high in the southern and western parts of the study area, including Linchuan District, Fengcheng City, Honggutan District, Qingshan Lake District, Nanchang County, Fengxin County, and Jing’an County. Areas with lower WY concentrations were mainly around Poyang Lake, including Yugan County, Xinjian County, and Gongqing City. The WY in 2000 was 2.5704×10¹⁰ m3, increasing to 3.5208×10¹⁰ m3 in 2010, and further to 4.2372×10¹⁰ m3 in 2020, with a total increase of 1.6668×10¹⁰ m3 over the period. This increase in WY was primarily observed in the northern region, attributed to high vegetation cover and government policies encouraging reforestation, which led to reduced runoff and soil erosion, thus improving soil permeability and reducing evaporation losses.
3.2 Analysis of ES influencing factors
3.2.1 Determination of key ES influencing factors
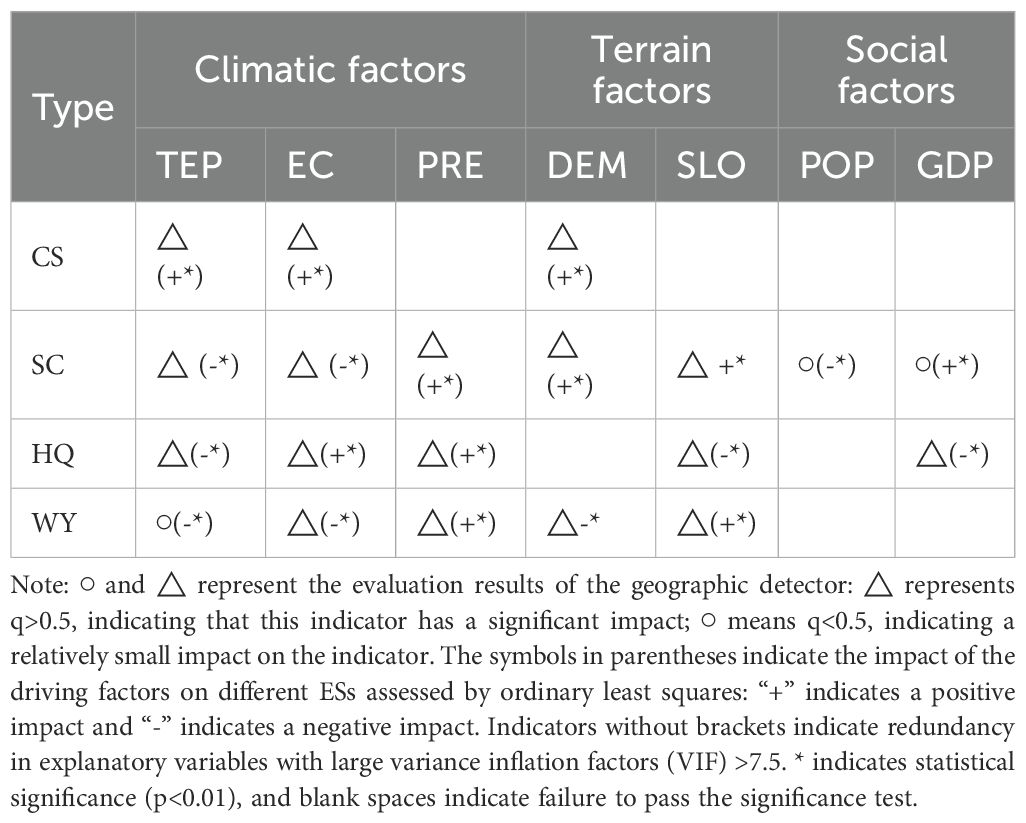
Drawing on prior research and the specific conditions of the study area (Wang et al., 2021; Li et al., 2023), we identified the following preliminary socio-economic and climatic environmental factors impacting ES: annual average temperature (TEP), potential evapotranspiration (EC), annual average rainfall (PRE), digital elevation (DEM), slope (SLO), population (POP), and economy (GDP). All independent variables were standardized using SPSS software and subsequently analyzed in ArcGIS10.8 to assess their influence on ES through geographic detectors and Ordinary Least Squares (OLS) regression (Table 2; Supplementary Material) (Sánchez-Martín et al., 2020). Overall, ES is predominantly influenced by climatic factors. Among these, TEP and EC are the main climate-related drivers affecting CS, with both demonstrating a positive correlation with CS. SC is primarily influenced by TEP, EC, and PRE, where TEP shows a negative correlation with SC, while EC and PRE are positively correlated. HQ is affected by TEP, EC, and PRE, with HQ negatively correlated with TEP and positively with EC and PRE. WY is mainly driven by TEP, EC, and PRE, with positive correlations between TEP, PRE and WY, and a negative correlation with EC.
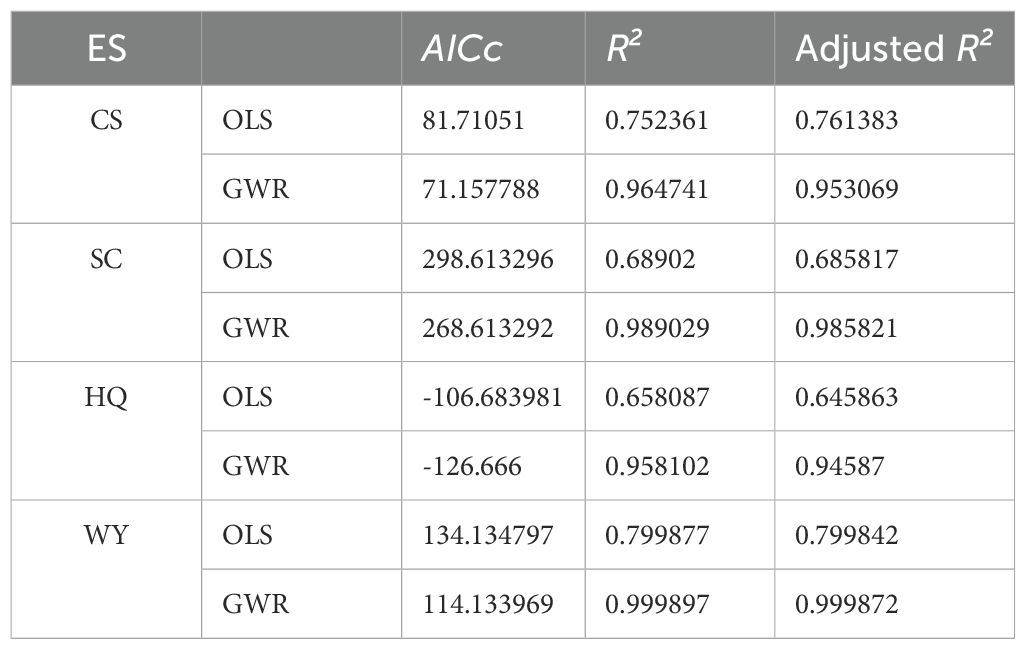
AICc and R² values are critical indicators of model accuracy; a lower AICc and a higher R² denote greater precision. In our analysis, we compared these metrics between the OLS model and the GWR model (Table 3). The results revealed that the GWR model exhibited a smaller AICc and a higher R² compared to the OLS model, suggesting that GWR provides superior accuracy. This enhanced precision allows GWR to more effectively capture the spatial heterogeneity of the driving factors affecting ES.
3.2.2 Analysis of spatial heterogeneity of different ES driving factors
The critical driving factor data for ecosystem services ES were standardized and integrated into the GWR module of ArcGIS10.8. The resulting datasets were visualized using the natural breakpoint method to optimize the classification of spatial data. Based on this regression analysis and the visualization outcomes, we conducted a detailed examination of the spatial heterogeneity of the various driving factors influencing ES in the study area. This approach allows for a nuanced understanding of how different factors impact ES across different geographic regions.
3.2.2.1 Carbon storage
Figure 5 illustrates that TEP generally exerts a positive influence on CS within the ecosystem services framework. The beneficial effects are predominantly observed in Pengze, Poyang, Wannian, and Dongxiang in the eastern region of the study area, as well as Ruichang and Chaisang Districts in the central region, and extend to Gongqingcheng, Xinjian, Anyi, Gao’an, Zhangshu, and Fengcheng. It appears that rising temperatures in these locales correlate with increased carbon sequestration. Conversely, TEP’s negative impact on ES is more dispersed, particularly noticeable in Qingshan Lake District and Honggutan District in central Nanchang, where rapid urbanization and a pronounced urban heat island effect are evident. Dense construction and high levels of human activity reduce land exposure and harm vegetation, thereby restricting vegetation cover and the natural development of soil, ultimately diminishing CS.
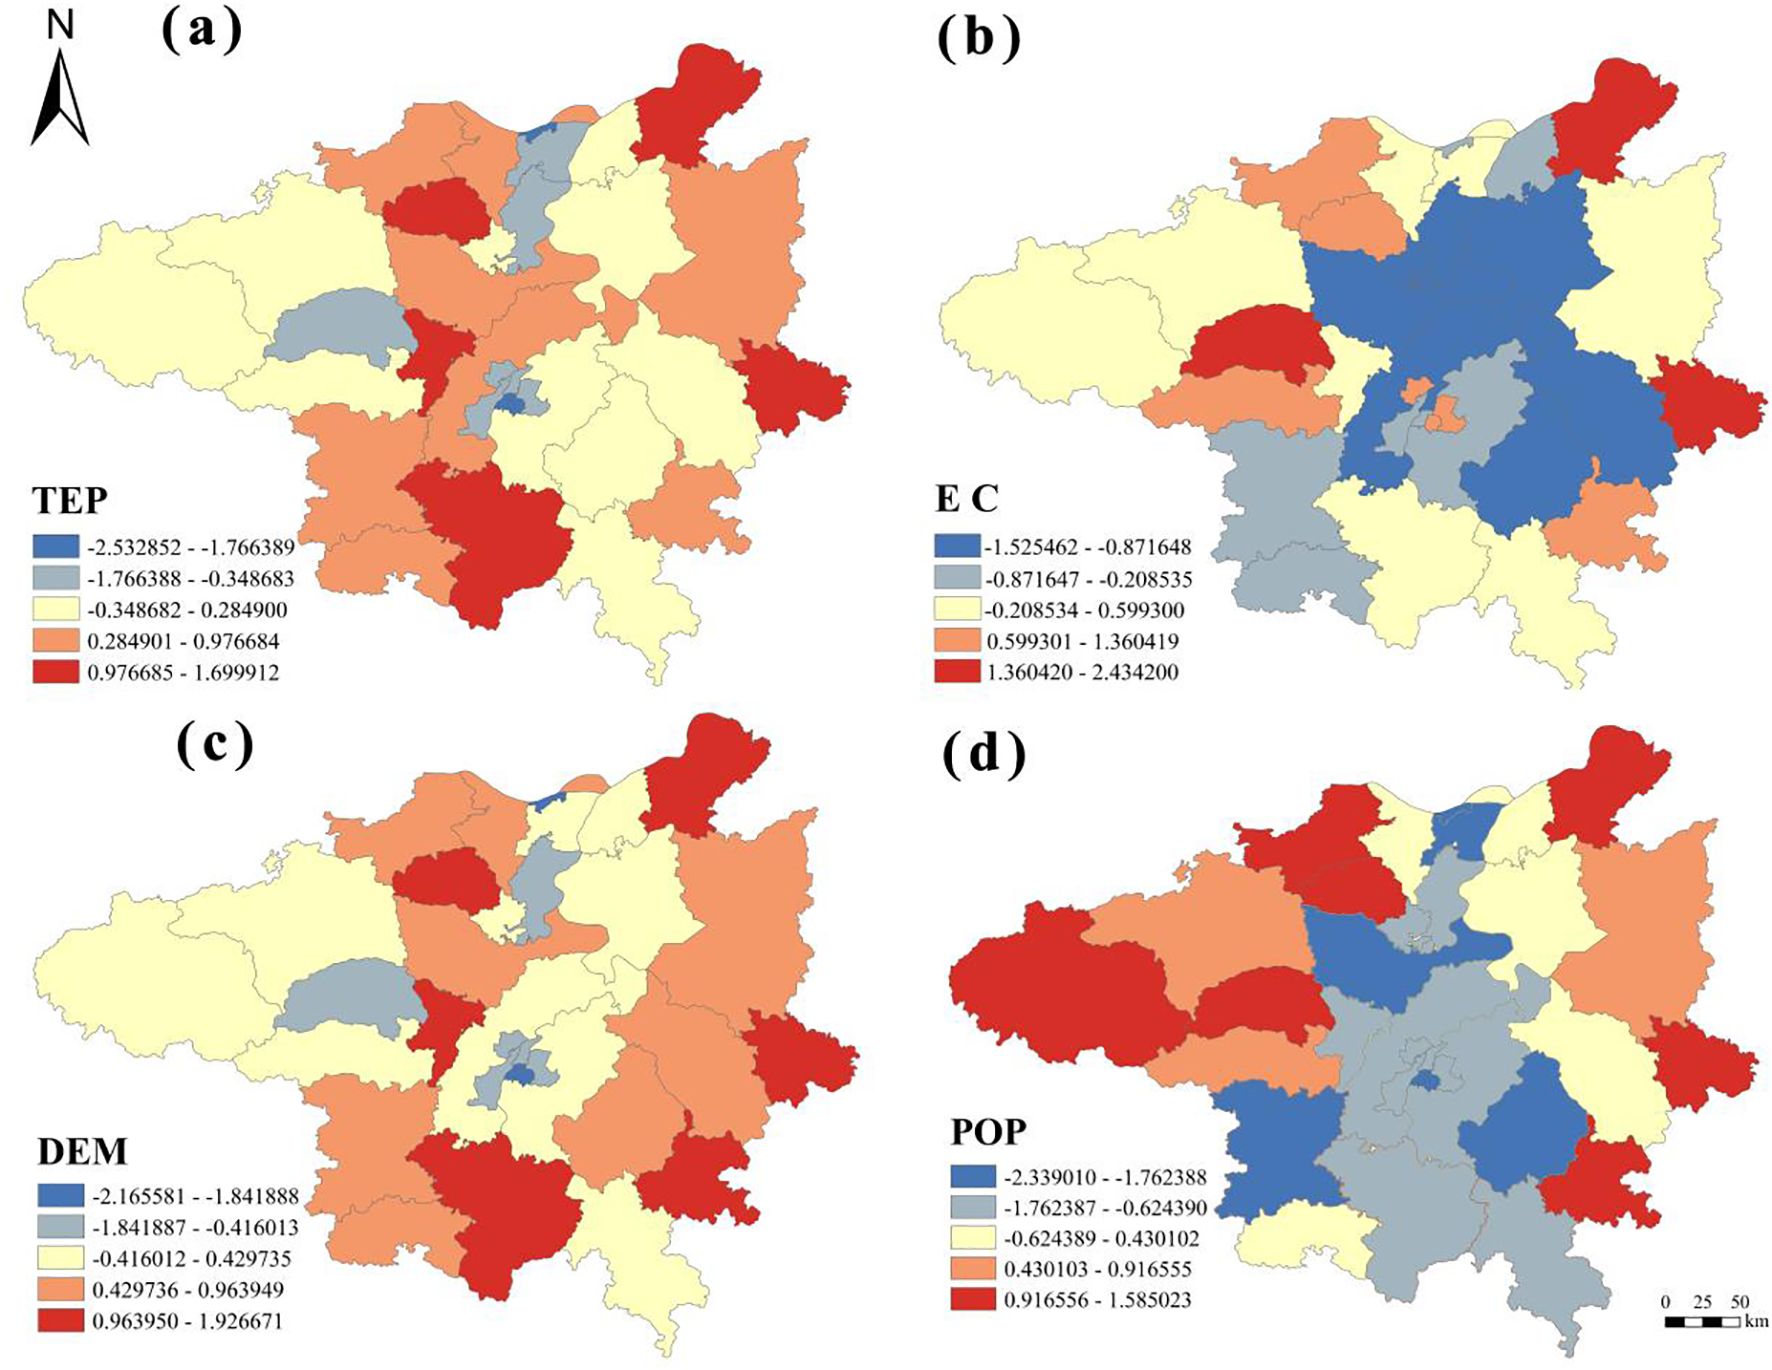
Figure 5. Spatial distribution of geographically weighted regression coefficients of CS in the study area in 2020. (A) TEP represents air temperature; (B) EC represents potential evapotranspiration, (C) DEM represents digital elevation; (D) POP represents population.
The influence of EC on CS is also significant. Positively, it impacts areas such as Pengze in the north, Wannian in the east, and Jing’an in the west of the study area. Negative impacts are concentrated around Poyang Lake, affecting Duchang, Yugan, Gongqingcheng, Xinjian, southern Lushan, and Jinxian. In these lake-proximate areas, higher EC correlates with enhanced river fluidity, which in turn influences carbon storage. Additionally, aquatic biological activities also play a role in affecting CS.
DEM predominantly fosters a positive effect on CS, suggesting that increased elevation correlates with higher CS in most parts, including Fengcheng and Zhangshu in the south, Dongxiang and Wannian in the east, and Xiushui and Wuning in the west and central regions of the study area. Higher elevations, which are typically characterized by concentrated mountainous and hilly areas with extensive woodlands and grasslands, facilitate increased CS.
POP impact on CS is primarily negative, especially in Nanchang’s main urban area and extending to Gongqingcheng, Gao’an, and Yugan. Rising population levels have accelerated urbanization, leading to extensive conversion of arable land for construction purposes. This alteration in land use reduces plant coverage and subsequently, CS.
3.2.2.2 Soil conservation
From the analysis presented in Figure 6, it is evident that the positive impacts of Temperature Elevation on SC within the ES framework are predominantly localized in Fengcheng City, Duchang County, Wannian County, and Ruichang City. Conversely, the adverse effects are primarily observed in high-altitude, forested regions such as Xiushui County, Fengxin County, and Gao’an City. This differential impact is attributable to the moderating influence of forest land on temperature fluctuations and its facilitative role in soil retention, thereby mediating a trade-off between thermal regulation and soil conservation in these areas.
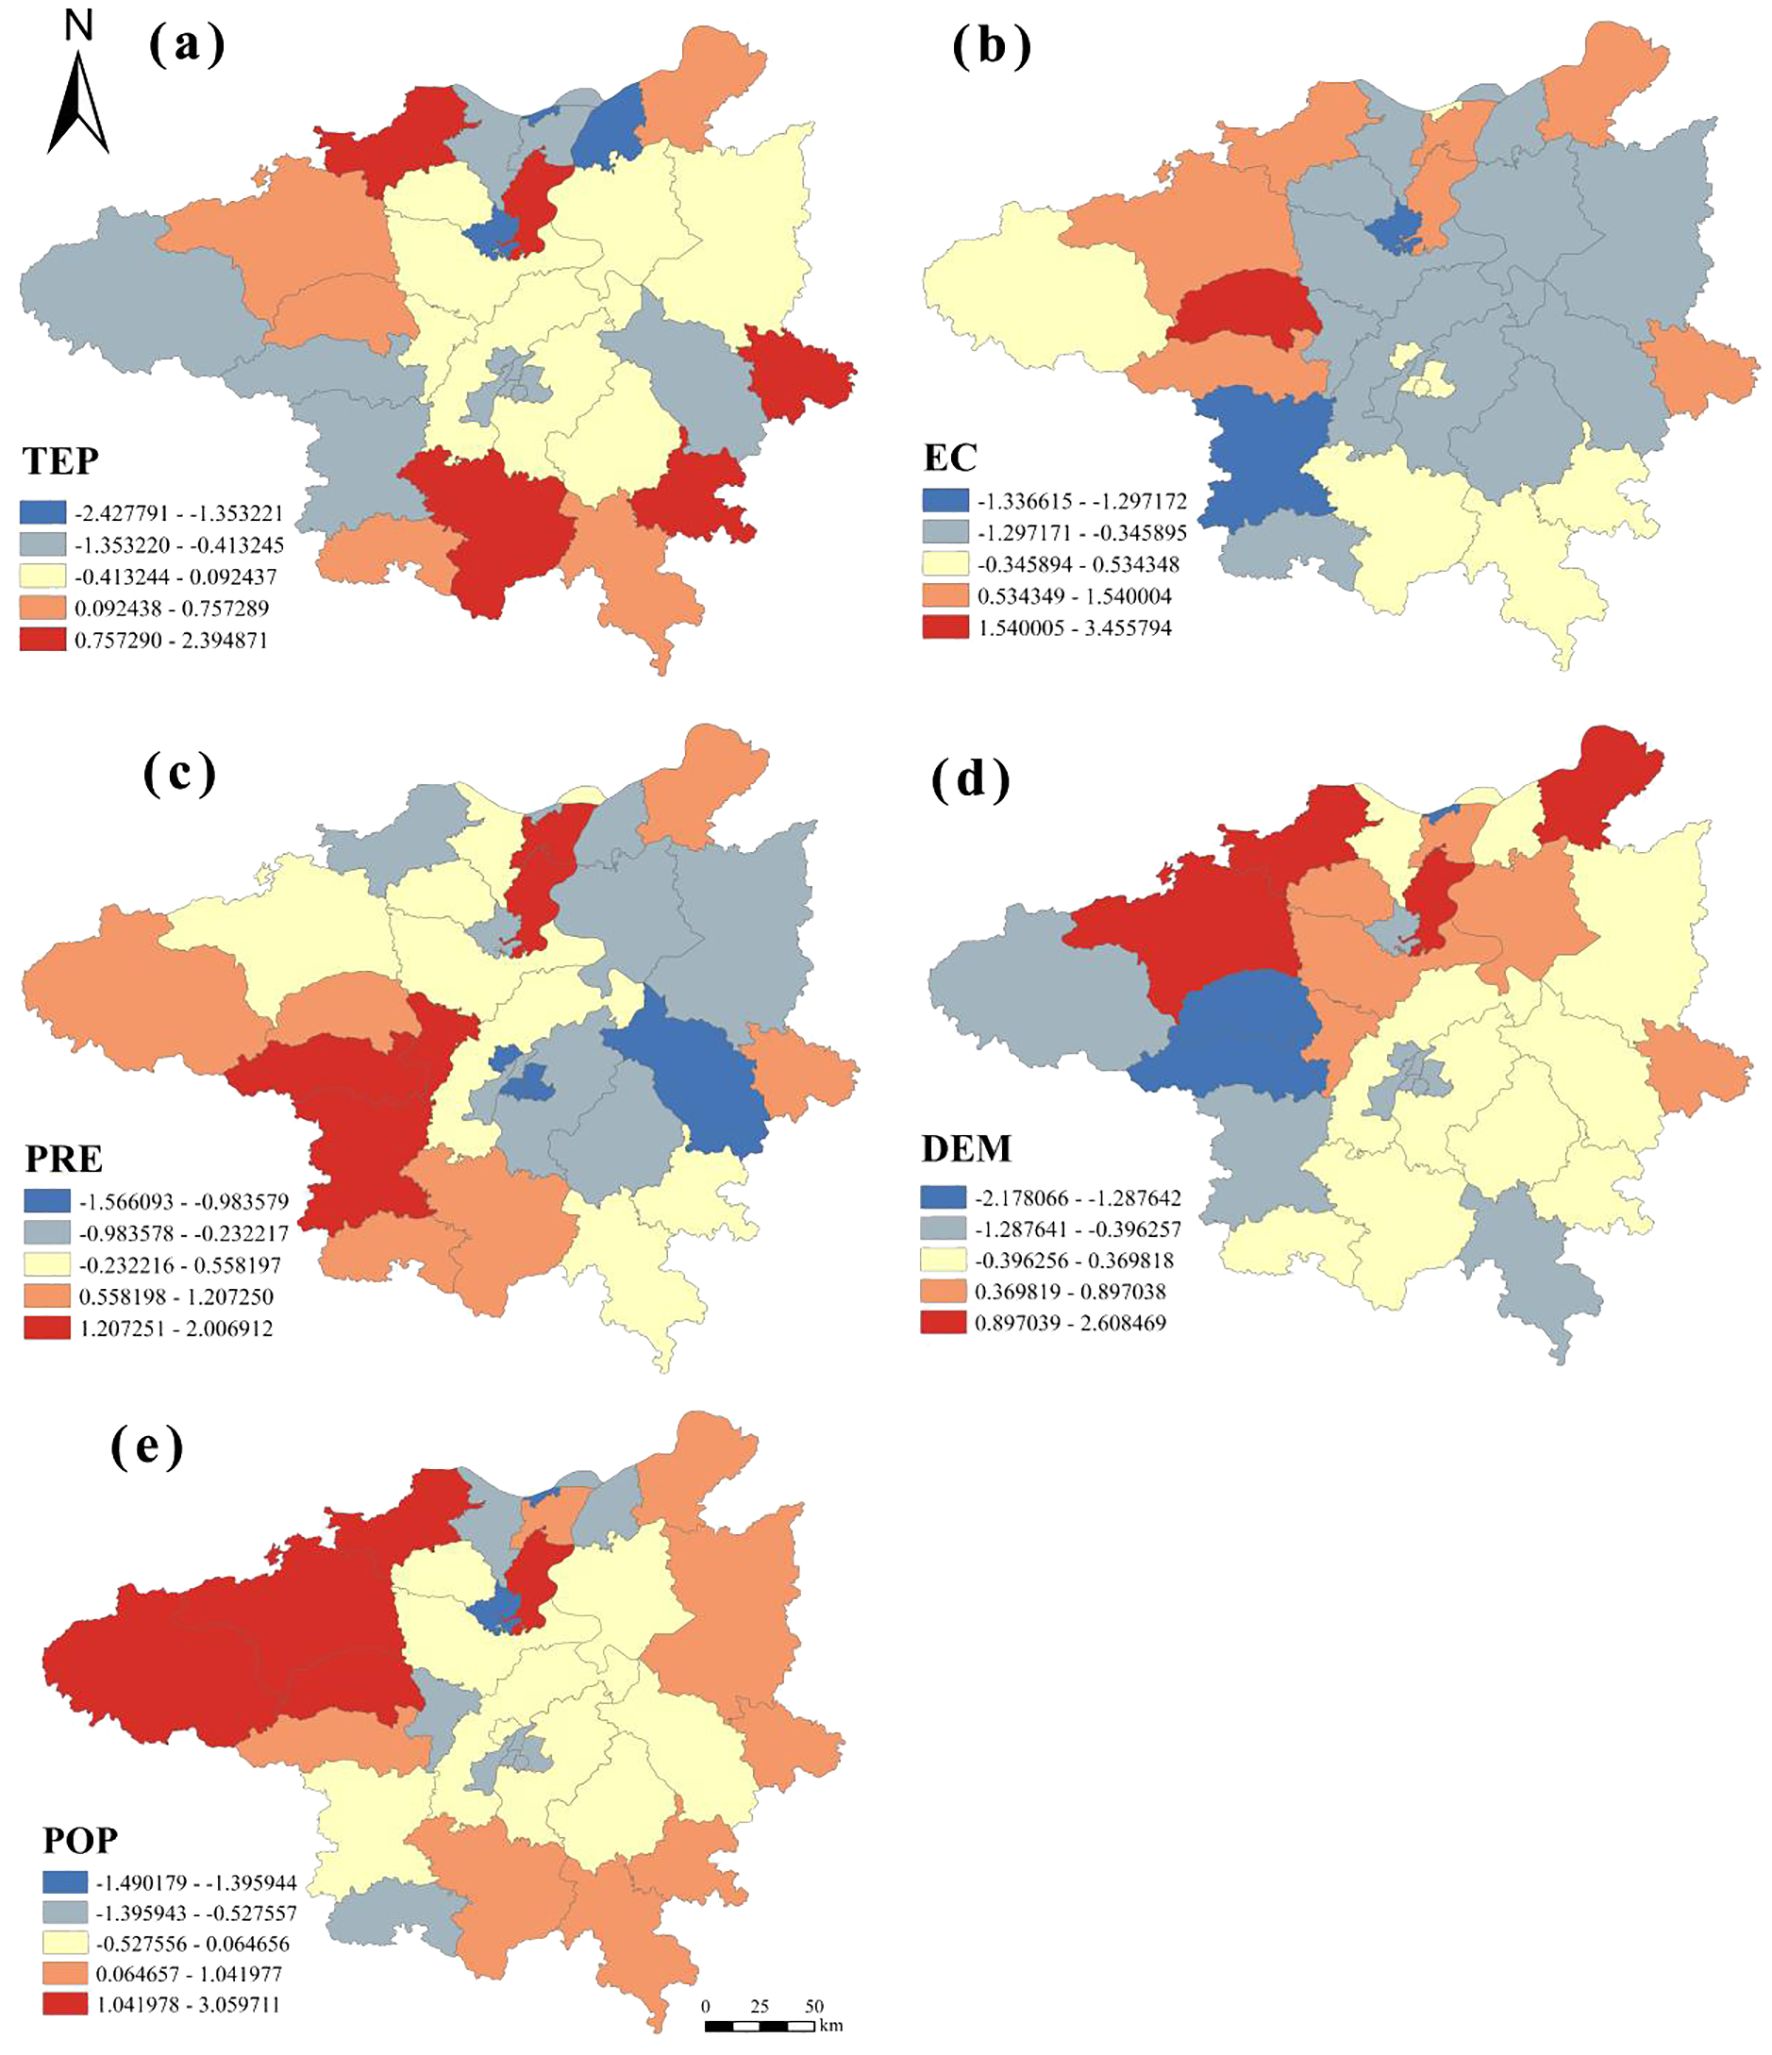
Figure 6. Spatial distribution of SC geographically weighted regression coefficients in the study area in 2020. In the figure (A) TEP represents temperature; (B) EC represents potential evapotranspiration; (C) PRE represents average annual precipitation; (D) DEM represents digital elevation; (E) POP represents population.
The influence of EC on SC is largely detrimental, with significant manifestations in the vicinities of Poyang Lake, encompassing Duchang County, Poyang County, Gongqing City, Xinjian County, Yugan County, Jinxian County, and Nanchang County. The intensification of EC near Poyang Lake promotes soil moisture evaporation, exacerbating soil moisture depletion and escalating the risk of soil erosion, thereby undermining SC.
PRE exerts primarily negative effects on SC around Poyang Lake, specifically in Poyang County, Duchang County, and Nanchang County, where riverine environments contribute to high ambient humidity and substantial rainfall. Excessive precipitation heightens soil erosion risk, detrimental to soil conservation efforts. Conversely, positive impacts are notable in the western regions within Xiushui County, Fengxin County, Jing’an County, and Zhangshu City, where dense forestation aids in soil erosion prevention and enhances SC.
DEM analyses reveal that higher DEM correlates with negative SC impacts in Xiushui County, Wuning County, Fengxin County, Gao’an County, and Linchuan District due to enhanced surface runoff capabilities that increase soil erosion during rainfall. In contrast, lower DEM areas like central Nanchang, Jinxian County, and Yugan County, characterized by flatter terrains and slower runoff, exhibit reduced erosive forces and thus better soil retention.
Finally, POP analysis indicates that increased population density generally correlates with reduced SC, particularly in rapidly urbanizing areas such as Zhangshu City, Yugan County, and central Nanchang, where urban expansion and increased impervious surfaces adversely affect arable land development. In contrast, areas like Xiushui County, Jing’an County, Ruichang County, and Wuning County demonstrate positive SC outcomes despite population growth, likely due to effective forest conservation practices that offset potential degradation.
3.2.2.3 Habitat quality
As illustrated in Figure 7, TEP predominantly exert a positive influence on HQ within ES, particularly in the central and eastern regions of the study area, including Duchang and Gongqingcheng near the upper reaches of Poyang Lake. This enhancement is likely attributable to the improvement in the EC, which facilitates the hydrological cycle of water bodies and wetlands around Poyang Lake, thereby ameliorating the aquatic environment and augmenting photosynthetic activity of proximate flora, subsequently elevating HQ. Conversely, the adverse effects of EC on HQ are principally observed in the Qingshan Lake District and Honggutan District of central Nanchang, areas characterized by predominantly artificial surfaces and rapid urban development. These regions exhibit low vegetative cover, high population density, and pronounced urban heat island effects, which escalate local temperatures and detrimentally impact the ecological environment, thereby diminishing HQ.
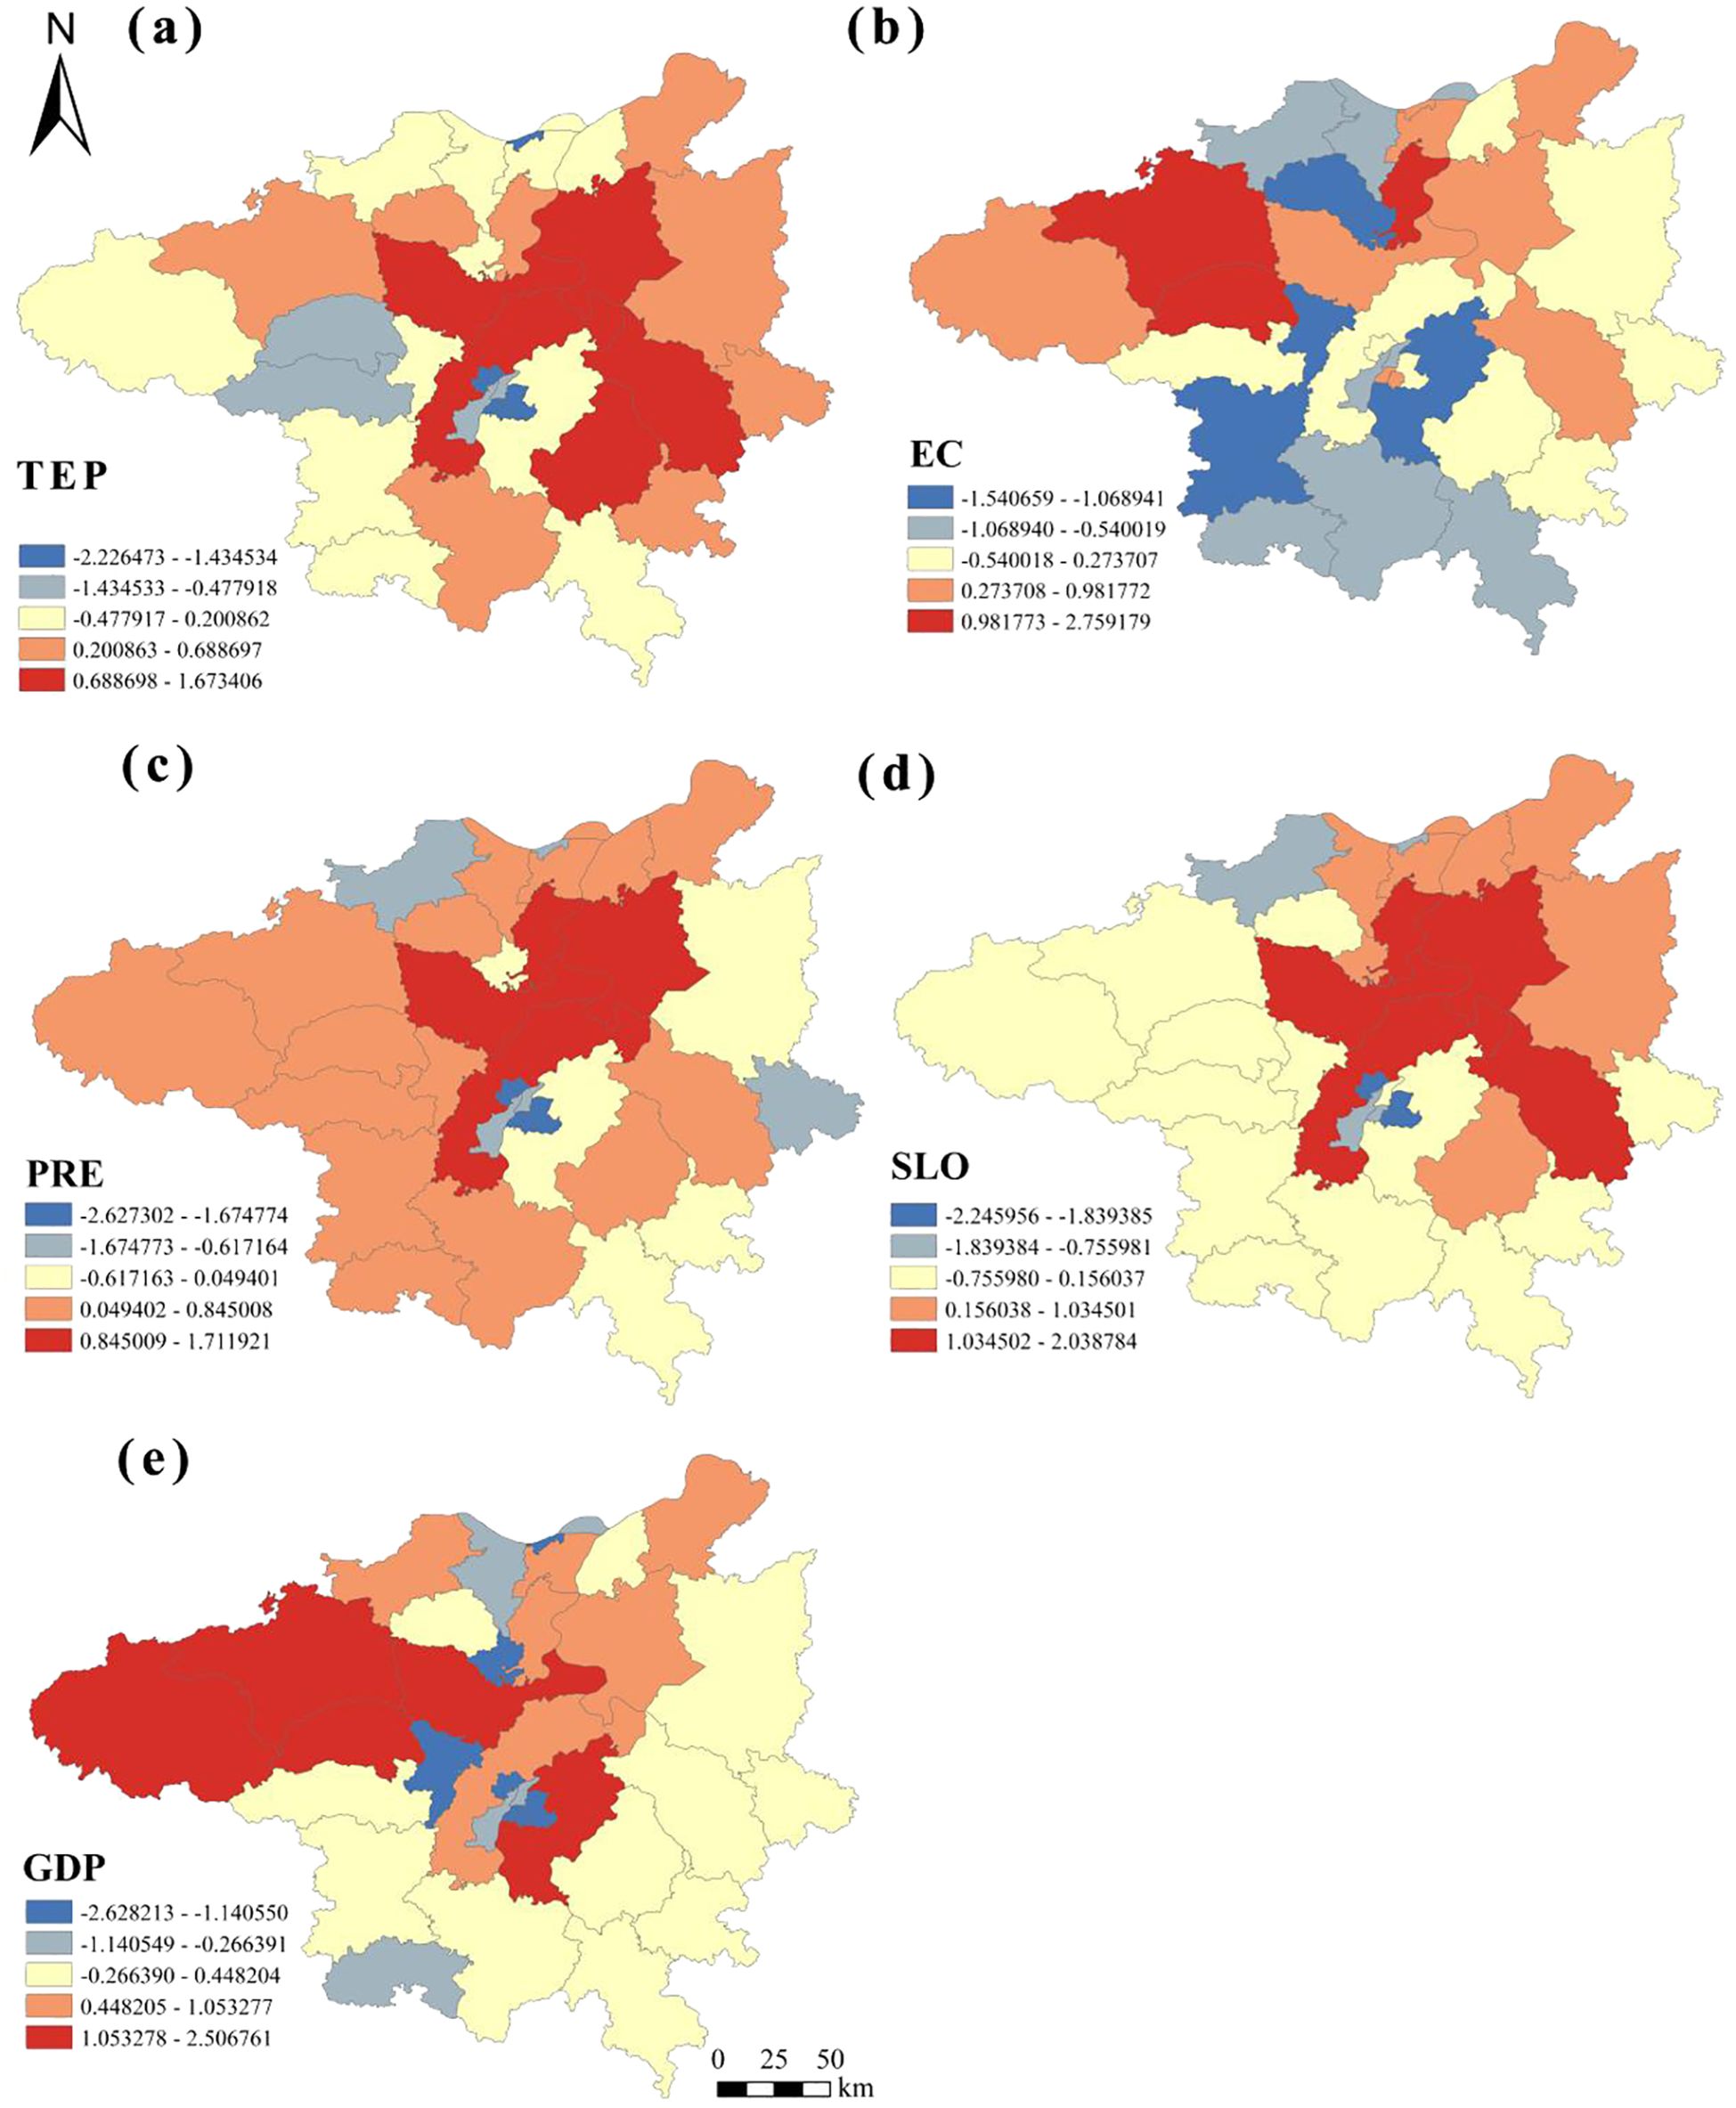
Figure 7. Spatial distribution of HQ geographically weighted regression coefficients in the study area in 2020. In the figure (A) TEP represents temperature; (B) EC represents potential evapotranspiration; (C) PRE represents average annual precipitation; (D) SLO represents slope; (E) GDP represents the level of regional economic development.
Furthermore, EC generally promotes HQ improvements across the study area, notably in Xiushui, Wuning, Gongqingcheng, and Lushan in the north, as well as in Yugan and Duchang near Poyang Lake. However, detrimental impacts are concentrated in the urban core of Nanchang, where intense urbanization prevails. Here, dense infrastructural development reduces soil water permeability and mitigates evaporation, while the urban heat island phenomenon intensifies local temperatures, enhancing evaporation and creating a conflict between EC and local HQ enhancement.
PRE primarily negatively affects HQ enhancement in the study area, especially in the western regions including Xiushui and Jing’an, and in the central areas around Poyang Lake Basin such as Duchang, Gongqingcheng, and Xinjian. The dominant land uses in these regions—woodlands, grasslands, wetlands, and aquatic environments—benefit from increased PRE, which supports vegetative growth and thereby promotes HQ.
SLO impacts on HQ are largely negative, concentrated in western locales such as Xiushui, Ruichang, De’an, Jing’an, and Gao’an, and in southern areas including Dongxiang, Linchuan District, and Fengcheng. The beneficial impacts, however, are focused around the Poyang Lake Basin in Duchang, Xinjian, Poyang, and Wannian. As slope increases, the positive influence on HQ typically diminishes from west to east, potentially due to encroachment by artificial surfaces which alter the original vegetation cover and reduce SLO’s beneficial contribution to HQ.
GDP predominantly exerts a negative influence on HQ improvements in the study area, especially in Anyi, central Nanchang, and surrounding areas of the Poyang Lake Basin. Rapid urbanization in these areas leads to dense population concentrations and expanded artificial land use, resulting in decreased vegetative cover and HQ degradation. Conversely, positive GDP impacts on HQ are noted in the western areas of Xiushui, Wuning, and Jing’an. These regions, primarily forested and possessing substantial plant cover, demonstrate that economic growth has not significantly harmed local forest ecosystems.
3.2.2.4 Water yield
Figure 8 delineates the predominantly negative correlation between TEP and WY across various regions surrounding the Poyang Lake Basin, including Duchang County, Gongqing City, and Yugan County. This negative association is largely attributed to the enhancement of evaporation rates induced by increased TEP, which consequently diminishes WY. Conversely, a positive correlation is observed in western regions such as Xiushui County, where extensive forest lands and high vegetation coverage prevail. Here, the elevation in TEP augments plant photosynthesis, fostering plant growth and beneficially impacting WY.
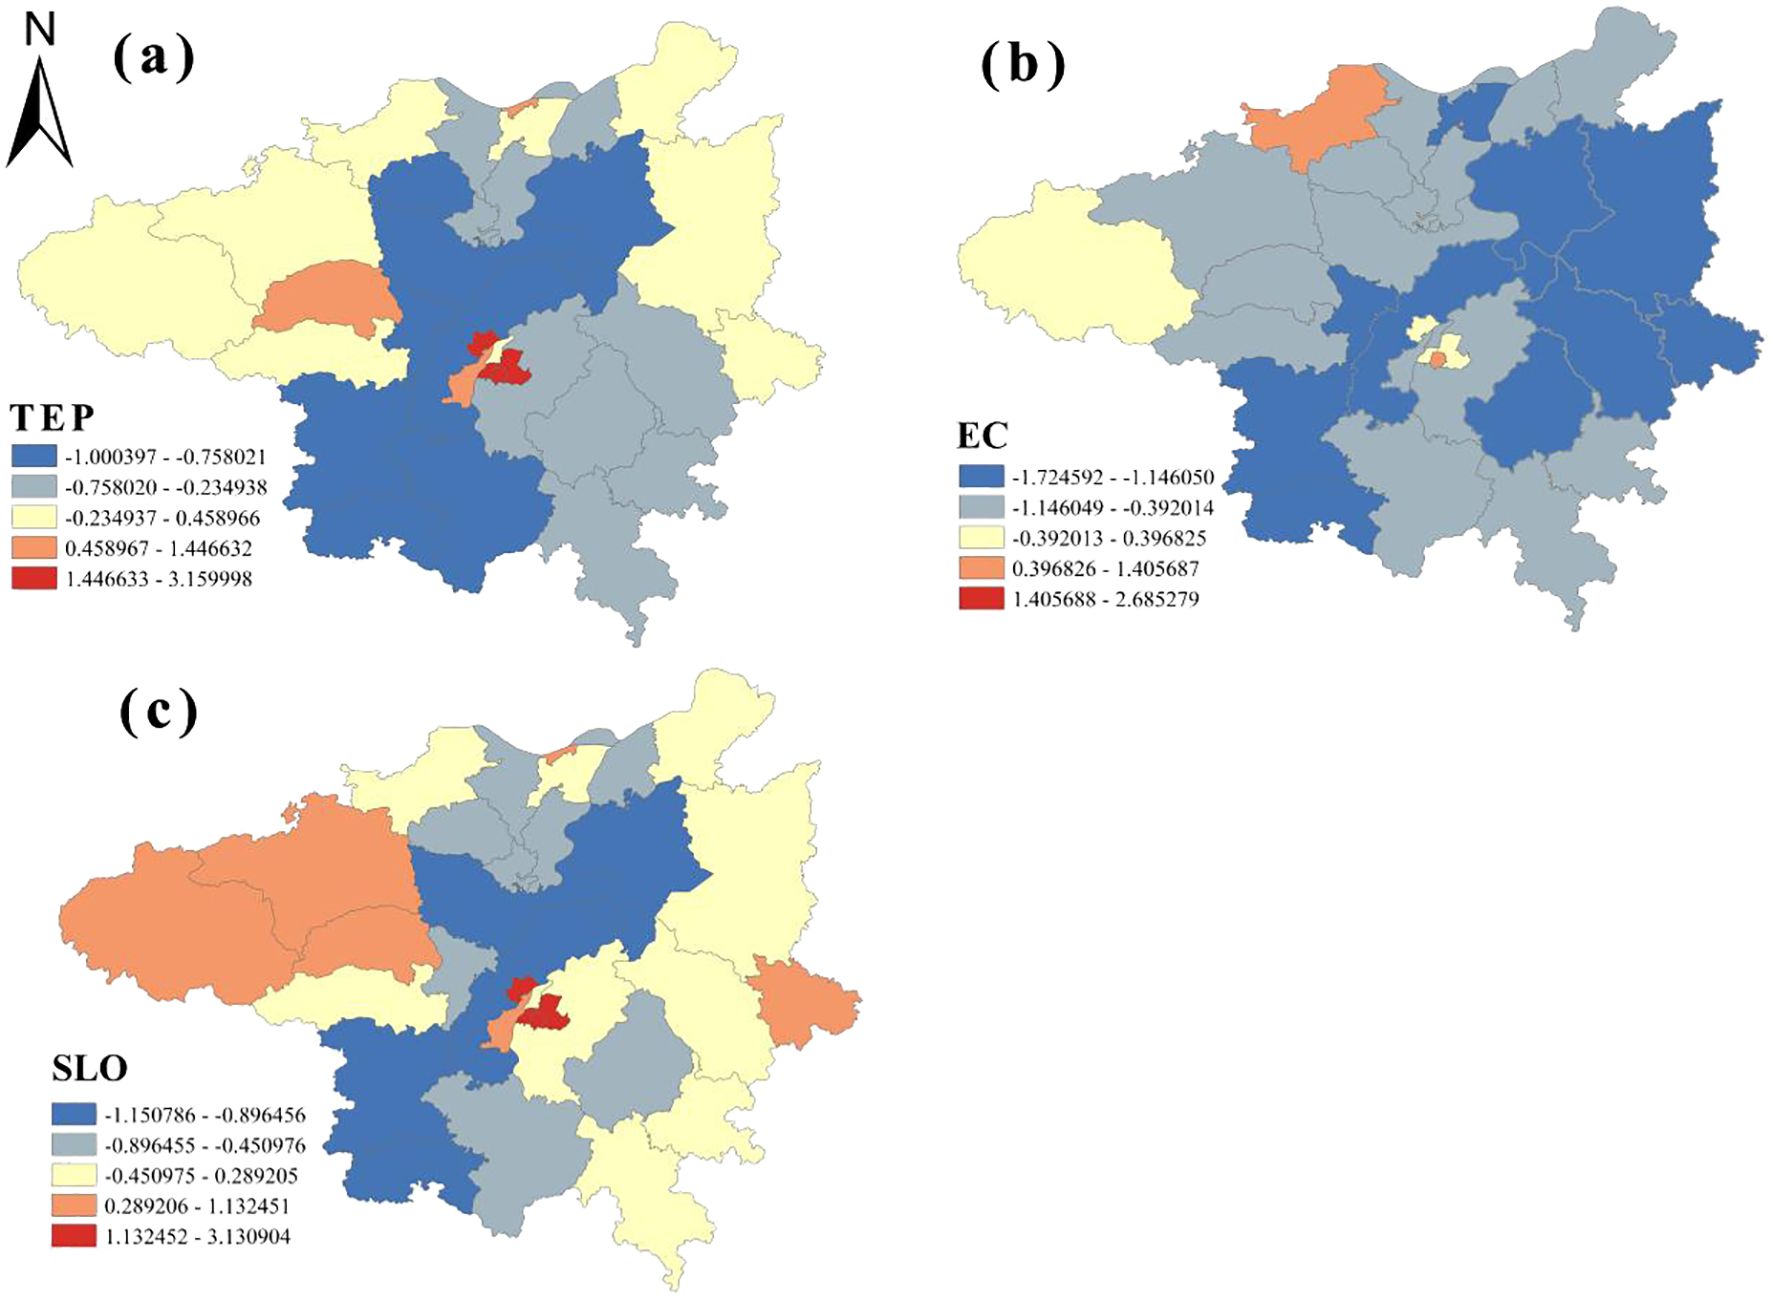
Figure 8. Spatial distribution of geographically weighted regression coefficients of WY in the study area in 2020. In the figure (A) TEP represents air temperature; (B) EC represents evapotranspiration; (C) SLO represents slope.
The interaction between EC and WY is primarily adverse, as improvements in EC tend to reduce the watershed’s capacity to produce WY, detrimentally affecting the vegetative water retention. In contrast, PRE exerts a positive influence on WY by enhancing its production capacity and facilitating the expansion of plant coverage. The effects of EC and PRE on WY are primarily observed around Poyang Lake, affecting regions such as Yugan County, Duchang County, Xinjian County, and Gongqing City. The variability in the impacts of EC and PRE across different locales can be attributed to regional distinctions in soil composition and other environmental conditions.
Furthermore, a positive correlation between SLO and WY is identified in western counties such as Jing’an, Wuning, and Xiushui. These areas, characterized by higher terrain and steeper slopes, are predominantly forested. The substantial plant coverage in these regions mitigates runoff velocity and enhances rainwater infiltration, which supports the maintenance and improvement of WY.
4 Discussion
4.1 Land cover impact on ES
This study analyzed the spatiotemporal evolution of different ES in the Nanchang metropolitan area from 2000 to 2020 and explored the spatial heterogeneity in the influence of climatic, topographic, and social factors. Findings indicate a divergent trend in ES; CS and HQ have exhibited a decline, whereas SC and WY have increased. These trends are significantly shaped by regional variances in natural and social environments, with a notable dependency on land use typologies and principal influencing factors (Hossain et al., 2016).
In the western territories of Xiushui, Wuning, Fengxin, and Jing’an counties, predominately forested areas with extensive vegetation coverage are associated with higher levels of CS, SC, HQ, and WY. These conditions contribute to the stabilization of total primary productivity and ecological equilibrium, enhancing habitats for fauna and flora and positively impacting ES (Hasan et al., 2020).
Conversely, in regions proximate to Poyang Lake such as Duchang County, Yugan County, and Gongqing City, the prevalent wetlands and aquatic bodies are observed to adversely affect the sustainability of CS and WY. This observation aligns with recent findings (Deng et al., 2023). While wetlands and water bodies have a negligible impact on SC, they facilitate HQ improvement due to their fluid dynamics and high moisture content, which accelerate EC consumption yet support the viability of adjacent biological communities.
In the urban cores of Nanchang City and the Xunyang and Lianxi districts of Jiujiang City, where artificial surfaces predominate, all indices of ecosystem services are markedly lower. This decline is closely linked to the accelerated urbanization, including GDP growth and population density increases, which collectively exert profound negative impacts on ES. Moreover, the expansion of artificial landscapes has led to the destruction of local forests and agricultural lands (Kibria et al., 2022), which are crucial for sustaining and enhancing ecosystem services.
Finally, regional differences in policies and management practices related to environmental protection, land use planning, and ecological compensation can also influence the spatial heterogeneity of ES. Effective policy support can mitigate or reverse the negative impacts of human activities, whereas the absence or inadequacy of such policies can exacerbate these negative effects.
4.2 Impact of policies
This study elucidates that ESs are shaped by both natural and anthropogenic factors, necessitating targeted interventions by local authorities to enhance ES outcomes. In urban and peri-urban areas such as Nanchang City, Duchang County, Yugan County, and Gongqing City, population growth should be strategically managed to mitigate its impacts. These areas, characterized by fragmented forests and low vegetation cover due to the expansion of farmland and artificial surfaces, require policies aimed at minimizing forest-to-agriculture and urban land conversion.
In contrast, the forest-rich western regions including Xiushui, Wuning, Fengxin, and Jing’an Counties, should prioritize forest conservation and enhancement initiatives. These could involve reforestation, forest management, and the natural conversion of underperforming forests to bolster land use efficiency and thereby improve CS and SC (Zhou et al., 2020).
For HQ development, areas around Poyang Lake—Duchang, Gongqing, Poyang, Yugan, and Xinjian Counties—exhibit higher HQ and are considered sensitive zones. Protection efforts here should focus on conserving wetlands and aquatic systems, managing water quality, and safeguarding local biodiversity, including the flora and fauna dependent on the lake and its wetlands. This entails regulating floodwaters from the “Five Rivers” and the Yangtze River, enhancing biodiversity protection, and strengthening wetland conservation and restoration practices.
Conversely, in metropolitan regions like Nanchang City, Fengcheng City, Gao’an City, and Zhangshu City where HQ is lower, strategies should be implemented to curb the sprawl of artificial surfaces, decrease forest encroachment, and increase vegetative cover to create a more balanced ecological environment conducive to simultaneous economic growth (Wang et al., 2023).
WY is influenced directly by climatic and topographic factors, with areas like Jing’an, Fengxin, Wuning, and Xiushui Counties demonstrating superior WY due to their high forest vegetation coverage and effective hydrological maintenance by the existing plant life. Enhancing forest protection in these regions will positively impact WY.
Moreover, future urban ecosystem management should emphasize the equilibrium between human activities and vegetative restoration. Implementing region-specific measures can foster the sustainable development of ES (Zhu et al., 2021), including the broader ecological context (Kang et al., 2023).
4.3 Research contributions and potential improvements
The contribution of this study is to refine the analysis of spatial heterogeneity of ES drivers. Although GDM and GWR models have been used to identify ES drivers and analyze spatial heterogeneity in existing studies, there are relatively few studies that use the two together. This study uses this combined approach to not only help identify the main drivers, but also reveal the changing patterns of these factors in different geographical regions. Through this refined spatial analysis method, the study can more accurately reveal the differences in the effects of different drivers at different spatial scales, providing a new perspective for understanding the spatial distribution and driving mechanism of ES.
In addition, the study expands the research framework of regional ecological management. Through an in-depth analysis of the Nanchang metropolitan area, the study not only fills the gap in the current literature on the refinement of spatial heterogeneity analysis in specific regions, but also provides valuable experience for ecological management and sustainable development policies in other similar regions. The targeted policy recommendations proposed in the study, based on a refined understanding of the specific conditions of different regions, will help to more effectively protect ecosystem services while promoting local economic development. This differentiated and refined policy recommendation represents a novel, scientific evidence-based management approach.
However, this study also has the following shortcomings. First, the study only focused on four ecosystem services, CS, SC, HQ and WY, and did not fully explore other types of ES. Future research should cover more types of ES to comprehensively evaluate ecosystem functions. Second, the driving factors in this study may change over time, and future research should consider the impact of more dynamic and comprehensive natural and social factors on ES. In addition, the interactions between driving factors and their combined impact on ES were not deeply analyzed in this study, which also provides potential improvement directions for future research.
5 Conclusions
In this investigation, we delineated the spatiotemporal distribution characteristics of ES changes within the Nanchang metropolitan area over the period 2000 to 2020. Employing geographic detectors and GWR models, we assessed the spatial heterogeneity of influential factors encompassing climatic, topographic, and sociodemographic dimensions. Our findings furnish a scientific foundation for formulating strategies to enhance ES in this region.
The analysis reveals that concurrent with urbanization and land use transformations, ES exhibited notable changes. Specifically, SC and WY demonstrated upward trends, increasing by approximately 2.4754 x 10⁹ tons/ha and 1.6668 x 10¹⁰ cubic meters, respectively. Conversely, CS and HQ declined, with CS decreasing by 0.1385 x 10⁸ tons/ha and HQ by an average of 0.0507 points. Notably, ES densities were higher in mountainous regions and lower in the central plains, reflecting the impact of varying natural and social conditions which contribute to spatial heterogeneity.
Our spatial analysis underscored that the GWR model, as opposed to OLS, more effectively accommodates the spatial heterogeneity of data, thereby providing superior explanatory power. The regression outcomes suggest a robust correlation between the identified drivers and ES changes, with notable spatial variations in the correlation strength and characteristics. Human factors such as POP and GDP predominantly influenced the variations in CS and HQ, respectively, while climatic and topographic conditions mainly steered the changes in SC and WY.
This study not only highlights the utility of spatial modeling techniques in discerning the dominant influences on different ES but also elucidates the spatial heterogeneity of these influences. Such insights are invaluable for the sustainable management of ES in other urban settings. Our findings advocate for an integrated approach to urban ecosystem management that balances natural processes and protective measures with strategic human interventions and vegetation restoration efforts.
Data availability statement
The original contributions presented in the study are included in the article/Supplementary Material. Further inquiries can be directed to the corresponding authors.
Author contributions
TZ: Conceptualization, Methodology, Writing – original draft, Writing – review & editing. YH: Project administration, Writing – original draft, Writing – review & editing. SG: Formal analysis, Writing – original draft, Writing – review & editing. MZ: Validation, Writing – original draft, Writing – review & editing. TL: Conceptualization, Investigation, Writing – original draft, Writing – review & editing. HH: Supervision, Writing – original draft, Writing – review & editing.
Funding
The author(s) declare financial support was received for the research, authorship, and/or publication of this article. This study was supported by the Heilongjiang Provincial Art and Science Planning Project (2023B112) and the Heilongjiang Provincial Natural Science Foundation Project (LH2021E006).
Conflict of interest
The authors declare that they have no known competing financial interests or personal relationships that could have appeared to influence the work reported in this paper.
Publisher’s note
All claims expressed in this article are solely those of the authors and do not necessarily represent those of their affiliated organizations, or those of the publisher, the editors and the reviewers. Any product that may be evaluated in this article, or claim that may be made by its manufacturer, is not guaranteed or endorsed by the publisher.
Supplementary material
The Supplementary Material for this article can be found online at: https://www.frontiersin.org/articles/10.3389/fevo.2024.1470912/full#supplementary-material
References
Ajaz Ahmed M. A., Abd-Elrahman A., Escobedo F. J., Cropper W. P., Martin T. A., Timilsina N. (2017). Spatially-explicit modeling of multi-scale drivers of aboveground forest biomass and water yield in watersheds of the Southeastern United States. Journal of Environmental Management 199, 158–171. doi: 10.1016/j.jenvman.2017.05.013
Ali S., Ran J., Luan Y., Khorrami B., Xiao Y., Tangdamrongsub N. (2024). The GWR model-based regional downscaling of GRACE/GRACE-FO derived groundwater storage to investigate local-scale variations in the North China plain. Sci. Total Environ. 908, 168239. doi: 10.1016/j.scitotenv.2023.168239
Allen R. G., Pruitt W. O., Raes D., Smith M., Pereira L. S. (2005). Estimating evaporation from bare soil and the crop coefficient for the initial period using common soils information. J. Irrig. Drain. Eng. 131, 14–23. doi: 10.1061/(ASCE)0733-9437(2005)131:1(14
Antle J. M., Diagana B. (2003). Creating incentives for the adoption of sustainable agricultural practices in developing countries: the role of soil carbon sequestration. Am. J. Agric. Econ. 85, 1178–1184. doi: 10.1111/j.0092-5853.2003.00526.x
Arkema K. K., Verutes G. M., Wood S. A., Clarke-Samuels C., Rosado S., Canto M., et al. (2015). Embedding ecosystem services in coastal planning leads to better outcomes for people and nature. Proc. Natl. Acad. Sci. United States America 112, 7390–7395. doi: 10.1073/pnas.1406483112
Aryal K., Maraseni T., Apan A. (2022). How much do we know about trade-offs in ecosystem services? A systematic review of empirical research observations. Sci. Total Environ. 806, 151229. doi: 10.1016/j.scitotenv.2021.151229
Bastos M. I., Roebeling P. C., Alves F. L., Villasante S., Magalhães Filho L. (2023). High risk water pollution hazards affecting Aveiro coastal lagoon (Portugal) – A habitat risk assessment using InVEST. Ecol. Inf. 76, 102144. doi: 10.1016/j.ecoinf.2023.102144
Bernués A., Rodríguez-Ortega T., Ripoll-Bosch R., Alfnes F. (2014). Socio-cultural and economic valuation of ecosystem services provided by mediterranean mountain agroecosystems. PloS One 9, e102479. doi: 10.1371/journal.pone.0102479
Birkhofer K., Diehl E., Andersson J., Ekroos J., Machnikowski F., Mader V. L., et al. (2015). Ecosystem services—current challenges and opportunities for ecological research. Front. Ecol. Evol. 2. doi: 10.3389/fevo.2014.00087
Cavalli M., Trevisani S., Comiti F., Marchi L. (2013). Geomorphometric assessment of spatial sediment connectivity in small Alpine catchments. Geomorphology 188, 31–41. doi: 10.1016/j.geomorph.2012.05.007
Chen Y., Cai H., Chen Y. (2023). Spatial correlation and interaction effect intensity between territorial spatial ecological quality and new urbanization level in Nanchang metropolitan area, China. Ecol. Indic. 156, 111163. doi: 10.1016/j.ecolind.2023.111163
Czúcz B., Arany I., Potschin-Young M., Bereczki K., Kertész M., Kiss M., et al. (2018). Where concepts meet the real world: A systematic review of ecosystem service indicators and their classification using CICES. Ecosys. Serv. 29, 145–157. doi: 10.1016/j.ecoser.2017.11.018
Dai E., Zhao Z., Jia L., Jiang X. (2024). Contribution of ecosystem services improvement on achieving Sustainable development Goals under ecological engineering projects on the Qinghai-Tibet Plateau. Ecol. Eng. 199, 107146. doi: 10.1016/j.ecoleng.2023.107146
Dashtbozorgi F., Hedayatiaghmashhadi A., Dashtbozorgi A., Ruiz–Agudelo C. A., Fürst C., Cirella G. T., et al. (2023). Ecosystem services valuation using InVEST modeling: Case from southern Iranian mangrove forests. Reg. Stud. Mar. Sci. 60, 102813. doi: 10.1016/j.rsma.2023.102813
De Valck J., Jarvis D., Coggan A., Schirru E., Pert P., Graham V., et al. (2023). Valuing ecosystem services in complex coastal settings: An extended ecosystem accounting framework for improved decision-making. Mar. Policy 155, 105761. doi: 10.1016/j.marpol.2023.105761
Deng Y., Shao Z., Dang C., Huang X., Zhuang Q. (2023). The impact of policies on land cover and ecosystem services dynamics in the Poyang Lake Ecological Economic Zone, China. Ecol. Indic. 156, 111169. doi: 10.1016/j.ecolind.2023.111169
Duan P., Xu Y., Guo X., Luo Z., Zhao X. (2023). Study on multi-scale characteristics and influencing factors of trade-offs and synergies between ecosystem services in Jiangxi province. Forests 14 (3), 598. doi: 10.3390/f14030598
Farber S., Páez A. (2007). A systematic investigation of cross-validation in GWR model estimation: empirical analysis and Monte Carlo simulations. J. Geogr. Syst. 9, 371–396. doi: 10.1007/s10109-007-0051-3
Franklin J. F., Lindenmayer D. B. (2009). Importance of matrix habitats in maintaining biological diversity. Proc. Natl. Acad. Sci. United States America 106, 349–350. doi: 10.1073/pnas.0812016105
Gang L., Gaoming J., Yonggeng L., Meizhen L. (2011). Biomass carbon storage and net primary production in different habitats of Hunshandake Sandland, China. Acta Ecol. Sin. 31, 217–224. doi: 10.1016/j.chnaes.2011.04.006
Guan D., Ran B., Zhou L., Jin C., Yu X. (2023). Assessing and transferring social value of ecosystem services in wetland parks based on SolVES model. Ecol. Indic. 157, 111300. doi: 10.1016/j.ecolind.2023.111300
Hasan S. S., Zhen L., Miah M., Ahamed T., Samie A. (2020). Impact of land use change on ecosystem services: A review. Environ. Dev. 34, 100527. doi: 10.1016/j.envdev.2020.100527
He J., Pan Z., Liu D., Guo X. (2019). Exploring the regional differences of ecosystem health and its driving factors in China. Science of The Total Environment. 673, 553–564. doi: 10.1016/j.scitotenv.2019.03.465
He X., Tian J., Zhang Y., Zhao Z., Cai Z., Wang Y. (2023). Attribution and driving force of nitrogen losses from the Taihu Lake Basin by the InVEST and GeoDetector models. Sci. Rep. 13, 7440. doi: 10.1038/s41598-023-34184-x
Hossain M. S., Dearing J. A., Rahman M. M., Salehin M. (2016). Recent changes in ecosystem services and human well-being in the Bangladesh coastal zone. Reg. Environ. Change 16, 429–443. doi: 10.1007/s10113-014-0748-z
Huang H., Xue J., Feng X., Zhao J., Sun H., Hu Y., et al. (2024). Thriving arid oasis urban agglomerations: Optimizing ecosystem services pattern under future climate change scenarios using dynamic Bayesian network. J. Environ. Manage. 350, 119612. doi: 10.1016/j.jenvman.2023.119612
Huang Y., Xie F., Song Z., Zhu S. (2023). Evolution and multi-scenario prediction of land use and carbon storage in Jiangxi province. Forests 14 (10), 1933. doi: 10.3390/f14101933
Jia Z., Wang X., Feng X., Ma J., Wang X., Zhang X., et al. (2023). Exploring the spatial heterogeneity of ecosystem services and influencing factors on the Qinghai Tibet Plateau. Ecol. Indic. 154, 110521. doi: 10.1016/j.ecolind.2023.110521
Kang X., Liu T., Hao L., Duan L., Wang G., Singh V. P., et al. (2023). Carbon dynamics of the plant-soil system during vegetation succession in dune-meadow cascade ecosystems in Horqin Sandy Land, China. Ecol. Indic. 155, 110916. doi: 10.1016/j.ecolind.2023.110916
Kibria A. S., Costanza R., Soto J. R. (2022). Modeling the complex associations of human wellbeing dimensions in a coupled human-natural system: In contexts of marginalized communities. Ecol. Model. 466, 109883. doi: 10.1016/j.ecolmodel.2022.109883
Koenig W. D. (1999). Spatial autocorrelation of ecological phenomena. Trends Ecol. Evol. 14, 22–26. doi: 10.1016/S0169-5347(98)01533-X
Landuyt D., Broekx S., Engelen G., Uljee I., van der Meulen M., Goethals P. L. M. (2016). The importance of uncertainties in scenario analyses – A study on future ecosystem service delivery in Flanders. Sci. Total Environ. 553, 504–518. doi: 10.1016/j.scitotenv.2016.02.098
Li C., Qiao W., Gao B., Chen Y. (2024). Unveiling spatial heterogeneity of ecosystem services and their drivers in varied landform types: Insights from the Sichuan-Yunnan ecological barrier area. J. Clean. Product. 442, 141158. doi: 10.1016/j.jclepro.2024.141158
Li J., Dong S., Li Y., Wang Y., Li Z. (2023). Terrestrial transect study on pattern and driving mechanism of ecosystem services in the China–Mongolia–Russia Economic Corridor. Sci. Total Environ. 884, 163880. doi: 10.1016/j.scitotenv.22023.163880
Li Y., Luo H. (2023). Trade-off/synergistic changes in ecosystem services and geographical detection of its driving factors in typical karst areas in southern China. Ecol. Indic. 154, 110811. doi: 10.1016/j.ecolind.2023.110811
Li Z., Jiang W., Hou P., Peng K., Deng Y., Wang X. (2023). Changes in the ecosystem service importance of the seven major river basins in China during the implementation of the Millennium development goals, (2000–2015) and sustainable development goals, (2015–2020). J. Clean. Product. 433, 139787. doi: 10.1016/j.jclepro.2023.139787
Liu C., Wu X., Wang L. (2019). Analysis on land ecological security change and affect factors using RS and GWR in the Danjiangkou Reservoir area, China. Appl. Geogr. 105, 1–14. doi: 10.1016/j.apgeog.2019.02.009
Liu W., Zhan J., Zhao F., Wang C., Zhang F., Teng Y., et al. (2022). Spatio-temporal variations of ecosystem services and their drivers in the Pearl River Delta, China. J. Clean. Product. 337, 130466. doi: 10.1016/j.jclepro.2022.130466
Liu Y., Huang C., Zhang L. (2023). The spatio-temporal patterns and driving forces of land use in the context of urbanization in China: evidence from Nanchang city. Int. J. Environ. Res. Public Health 20, 2330. doi: 10.3390/ijerph20032330
Locatelli B., Imbach P., Wunder S. (2014). Synergies and trade-offs between ecosystem services in Costa Rica. Environ. Conserv. 41, 27–36. doi: 10.1017/S0376892913000234
Mandle L., Shields-Estrada A., Chaplin-Kramer R., Mitchell M. G. E., Bremer L. L., Gourevitch J. D., et al. (2021). Increasing decision relevance of ecosystem service science. Nat. Sustainabil. 4, 161–169. doi: 10.1038/s41893-020-00625-y
Mengist W., Soromessa T., Legese G. (2020). Ecosystem services research in mountainous regions: A systematic literature review on current knowledge and research gaps. Sci. Total Environ. 702, 134581. doi: 10.1016/j.scitotenv.2019.134581
Na L., Zhao Y., Feng C.-C., Guo L. (2023). Regional ecological risk assessment based on multi-scenario simulation of land use changes and ecosystem service values in Inner Mongolia, China. Ecol. Indic. 155, 111013. doi: 10.1016/j.ecolind.2023.111013
Nie Y., Zhang X., Yang Y., Liu Z., He C., Chen X., et al. (2023). Assessing the impacts of historical and future land-use/cover change on habitat quality in the urbanizing Lhasa River Basin on the Tibetan Plateau. Ecol. Indic. 148, 110147. doi: 10.1016/j.ecolind.2023.110147
Nogues Q., Baulaz Y., Clavel J., Araignous E., Bourdaud P., Ben Rais Lasram F., et al. (2023). The usefulness of food web models in the ecosystem services framework: Quantifying, mapping, and linking services supply. Ecosys. Serv. 63, 101550. doi: 10.1016/j.ecoser.2023.101550
Perosa F., Gelhaus M., Zwirglmaier V., Arias-Rodriguez L. F., Zingraff-Hamed A., Cyffka B., et al. (2021). Integrated valuation of nature-based solutions using TESSA: three floodplain restoration studies in the danube catchment. Sustainability 13, 1482. doi: 10.3390/su13031482
Ren Y., Lü Y., Fu B., Comber A., Li T., Hu J. (2020). Driving factors of land change in China’s loess plateau: quantification using geographically weighted regression and management implications. Remote Sens. 12 (3), 453. doi: 10.3390/rs12030453
Sánchez-Martín J.-M., Gurría-Gascón J.-L., Rengifo-Gallego J.-I. (2020). The distribution of rural accommodation in extremadura, Spain-between the randomness and the suitability achieved by means of regression models (OLS vs. GWR). Sustainability 12 (11), 4737. doi: 10.3390/su12114737
Scordo F., Lavender T. M., Seitz C., Perillo V. L., Rusak J. A., Piccolo M. C., et al. (2018). Modeling water yield: assessing the role of site and region-specific attributes in determining model performance of the inVEST seasonal water yield model. Water 10 (11), 1496. doi: 10.3390/w10111496
Sun Q., Qi W., Yu X. (2021). Impacts of land use change on ecosystem services in the intensive agricultural area of North China based on Multi-scenario analysis. Alexandria Eng. J. 60, 1703–1716. doi: 10.1016/j.aej.2020.11.020
Valencia Torres A., Tiwari C., Atkinson S. F. (2021). Progress in ecosystem services research: A guide for scholars and practitioners. Ecosys. Serv. 49, 101267. doi: 10.1016/j.ecoser.2021.101267
Villa F., Bagstad K. J., Voigt B., Johnson G. W., Portela R., Honzák M., et al. (2014). A methodology for adaptable and robust ecosystem services assessment. PloS One 9, e91001. doi: 10.1371/journal.pone.0091001
Wang Y., Gu X., Yu H. (2023). Spatiotemporal variation in the Yangtze river delta urban agglomeration from 1980 to 2020 and future trends in ecosystem services. LAND 12, 929. doi: 10.3390/land12040929
Wang Y., Zhang Z., Chen X. (2021). Quantifying influences of natural and anthropogenic factors on vegetation changes based on geodetector: A case study in the Poyang lake basin, China. Remote Sens. 13 (24), 5081. doi: 10.3390/rs13245081
Wu X., Liu S., Zhao S., Hou X., Xu J., Dong S., et al. (2019). Quantification and driving force analysis of ecosystem services supply, demand and balance in China. Sci. Total Environ. 652, 1375–1386. doi: 10.1016/j.scitotenv.2018.10.329
Xue C., Chen X., Xue L., Zhang H., Chen J., Li D. (2023). Modeling the spatially heterogeneous relationships between tradeoffs and synergies among ecosystem services and potential drivers considering geographic scale in Bairin Left Banner, China. Sci. Total Environ. 855, 158834. doi: 10.1016/j.scitotenv.2022.158834
Yang D., Zhu C., Li J., Li Y., Zhang X., Yang C., et al. (2024). Exploring the supply and demand imbalance of carbon and carbon-related ecosystem services for dual−carbon goal ecological management in the Huaihe River Ecological Economic Belt. Sci. Total Environ. 912, 169169. doi: 10.1016/j.scitotenv.2023.169169
Zhang T., Hu Y. -Z., Hu -H., Lei T.-T. (2024). Prediction of Land Use and Habitat Quality in Harbin City Based on the PLUS- InVEST Model. Huan Jing Ke Xue= Huanjing Kexue. 45 (8), 4709–4721. doi: 10.13227/j.hjkx.202308212
Zhang Y., Lu X., Liu B., Wu D., Fu G., Zhao Y., et al. (2021). Spatial relationships between ecosystem services and socioecological drivers across a large-scale region: A case study in the Yellow River Basin. Sci. Total Environ. 766, 142480. doi: 10.1016/j.scitotenv.2020.142480
Zhang X., Zhou J., Li G., Chen C., Li M., Luo J. (2020). Spatial pattern reconstruction of regional habitat quality based on the simulation of land use changes from 1975 to 2010. J. Geogr. Sci. 30, 601–620. doi: 10.1007/s11442-020-1745-4
Zhou Y., Chen T., Wang J., Xu X. (2023). Analyzing the factors driving the changes of ecosystem service value in the Liangzi lake basin—A geoDetector-based application. Sustainability 15 (22), 15763. doi: 10.3390/su1522]15763
Zhou J., Zhang B., Zhang Y., Su Y., Chen J., Zhang X. (2023). Research on the trade-offs and synergies of ecosystem services and their impact factors in the Taohe river basin. Sustainability 15 (12), 9689. doi: 10.3390/su15129689
Keywords: ecosystem services, environmental change, land planning, influencing factors, sustainable development
Citation: Zhang T, Hu Y, Guan S, Zhu M, Lei T and Hu H (2024) Spatiotemporal changes and influencing factors of ecosystem services in the Nanchang metropolitan area, China. Front. Ecol. Evol. 12:1470912. doi: 10.3389/fevo.2024.1470912
Received: 26 July 2024; Accepted: 30 September 2024;
Published: 12 November 2024.
Edited by:
Athanasios Kallimanis, Aristotle University of Thessaloniki, GreeceReviewed by:
Cesar Augusto Ruiz Agudelo, Universidad de Bogotá Jorge Tadeo Lozano, ColombiaClaudia Caro, Universidad Nacional Agraria La Molina, Peru
Copyright © 2024 Zhang, Hu, Guan, Zhu, Lei and Hu. This is an open-access article distributed under the terms of the Creative Commons Attribution License (CC BY). The use, distribution or reproduction in other forums is permitted, provided the original author(s) and the copyright owner(s) are credited and that the original publication in this journal is cited, in accordance with accepted academic practice. No use, distribution or reproduction is permitted which does not comply with these terms.
*Correspondence: Tingting Lei, bGVpdGluZ3RpbmdAbmVhdS5lZHUuY24=; Haihui Hu, aGxqaHVoYWlodWlAMTYzLmNvbQ==
 Ting Zhang
 Yuzhu Hu2