 Shalu Dwivedi
 Ravindra Garde
 Stefan Schuster
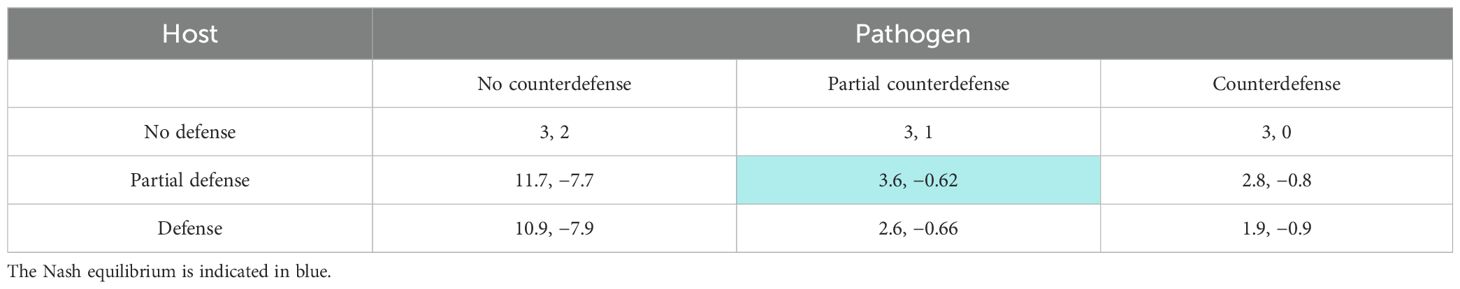

94% of researchers rate our articles as excellent or good
Learn more about the work of our research integrity team to safeguard the quality of each article we publish.
Find out more
ORIGINAL RESEARCH article
Front. Ecol. Evol., 30 January 2025
Sec. Models in Ecology and Evolution
Volume 12 - 2024 | https://doi.org/10.3389/fevo.2024.1379868
Host–pathogen interactions consist of an attack by the pathogen, frequently a defense by the host and possibly a counterdefense by the pathogen. Here, we present a game-theoretical approach to describe such interactions. We consider a game where the host and pathogen are players and can choose between the strategies of defense (or counterdefense) and no response. Specifically, they may or may not produce a toxin and an enzyme degrading the toxin, respectively. We consider that the host and pathogen must also incur a cost for toxin or enzyme production. We highlight both the sequential and non-sequential versions of the game and determine the Nash equilibria. Furthermore, we resolve a paradox occurring in that interplay. If the inactivating enzyme is very efficient, producing the toxin becomes useless, leading to the enzyme being no longer required. Then, the production of the defense becomes useful again. In game theory, such situations can be described by a generalized matching pennies game. As a novel result, we find under which conditions the defense cycle leads to a steady state or an oscillation. We obtain, for saturating dose–response kinetics and considering monotonic cost functions, “partial (counter)defense” strategies as pure Nash equilibria. This implies that producing a moderate amount of toxin and enzyme is the stable situation in this game.
A typical host–pathogen interaction involves an attack by the pathogen and defense by the host. Many pathogens invest in a counterdefense, that is, in not just attacking the host but also in bypassing or neutralizing the host defenses in order to increase the efficacy of the attack (Frohner et al., 2009; Brunke and Hube, 2013; Sasikaran et al., 2014; Dühring et al., 2015; Mackel and Steele, 2019; Park et al., 2019). For example, reactive oxygen species are formed by immune cells of the host, and superoxide dismutases are synthesized by the pathogenic fungus Candida albicans to neutralize the reactive oxygen species (Frohner et al., 2009). The bacterium Porphyromonas gingivalis produces proteases capable of degrading defensins of the host, which are antimicrobial peptides (Carlisle et al., 2009). Note that the enzyme inactivating the defense chemical usually differs from the target enzyme inhibited by that chemical. Another example is the phagocytosis of C. albicans by macrophages, which is counteracted by the pathogen via a yeast-to-hyphae transition (Calderone and Fonzi, 2001; Hummert et al., 2010). Although not a host–pathogen interaction in the strict sense, it is worth mentioning that in the competition between Streptomyces clavuligerus and Salmonella bacteria, a counter-counterdefense can be observed: clavulanic acid secreted by S. clavuligerus inhibits ß-lactamases, which inactivate ß-lactam antibiotics (Drawz and Bonomo, 2010; Schuster et al., 2019). Even a bacterium may become a host, notably upon attack by a bacteriophage. The T4 phage from the family Straboviridae can evolve to overcome a phage-defensive toxin–antitoxin system (toxIN) in Escherichia coli by expressing a protein inactivating the toxin (Srikant et al., 2022).
To understand host–pathogen interactions, mathematical modeling and computer simulation have turned out to be very helpful (Segel, 1980; Bauer et al., 2009; Schleicher et al., 2017; Ewald et al., 2020). This can be done, among other methods, by systems of ordinary differential equations (Segel, 1980; Lang et al., 2019) or by evolutionary game theory (Eswarappa, 2009; Gintis, 2009; Hummert et al., 2010; Hummert et al., 2014; Tyc et al., 2014; Dühring et al., 2015; Pollmächer et al., 2016; Wu and Ross, 2016; Dühring et al., 2017; Javarone, 2018; Sharebiani et al., 2021; Halloway et al., 2022). Previously, a mathematical model based on enzyme-kinetic equations describing the interplay between a defense chemical, enzymes degrading those, and inhibitors of the enzyme was proposed (Schuster et al., 2019). The calculations show that only in the case of strong binding of the inhibitor, it pays to produce an inhibitor as a counter-counterdefense.
However, a paradox occurs in the abovementioned interaction. If the counterdefense (e.g., inactivating enzyme) is very efficient, the defense (e.g., toxin) becomes useless, so that there is no longer any need for its production. Then, the counterdefense becomes unnecessary. If, however, this is stopped being produced as well, the production of the defense becomes useful again (Ewald et al., 2020). The question arises whether this leads to an oscillatory change in strategies or to a steady state being a trade-off, in which the two species produce a moderate amount of toxin and enzyme, respectively. Although this question is very relevant for medical and pharmacological applications, it has hardly been analyzed so far for such applications. In game theory, such situations without a clear equilibrium are known as (generalized) “matching pennies game” (Goeree et al., 2003; Tadelis, 2013). In its basic, traditional version, each of the two players secretly turns a penny to heads or tails and then they show it at the same time. If the pennies match, that is both heads up or both tails up, then player 1 keeps both pennies. If the pennies do not match, player 2 keeps both pennies (Tadelis, 2013). Both players have the same set of strategies and only the payoffs 1 and −1 occur. In the generalized version, more than two different payoff values occur and the game is not usually a zero-sum game anymore (Goeree et al., 2003).
The “generalized matching pennies game” can be found in several situations in biology. For example, when a prey can hide in either of two different locations and a predator animal only has the time or energy to search in one of the locations (Alpern et al., 2019). A related situation is when a predator (e.g., a leopard) chases a prey (e.g., a gazelle): the predator would try to turn to the same side as the prey is evading, while the prey tries to avoid that (Sanabria and Thrailkill, 2009). Also with respect to the decision between daytime activity and nighttime activity of predator and prey, a matching pennies game can be observed. Applications other than in biology include auditing in management and penalty shooting in soccer (Goeree et al., 2003; Sanabria and Thrailkill, 2009). The goalkeeper has a strong motivation to jump to the same side as the ball is coming, while the kicker prefers a mismatch. Similarly, the prohibition of alcohol in the U.S. in the 1920s can be regarded from that viewpoint. That law finally became useless because of clandestine brewing and distilling.
Here, we present a game-theoretical analysis to answer the above questions in an innovative way. The analysis considerably extends a preliminary game-theoretical interpretation presented earlier (Ewald et al., 2020). The host and pathogen are considered as players and they maximize their payoffs (outcome, which can be quantified as gain in fitness) by choosing appropriate strategies. We consider both the sequential and non-sequential versions of the game. In the former case, one player chooses its strategy first and cannot change it anymore, and only thereafter, the other player responds. In the latter case, the two players can iteratively find a stable equilibrium in which neither of them has an incentive to change its strategy anymore. The methods, assumptions, and simplifications used are explained in Section 2. While, in principle, strategies can be changed in a continuous way because the concentrations of both defense chemicals and degrading enzymes can vary continuously, we here use a discretization as usual in game theory. In Sections 3 and 4, we distinguish two and three strategies, respectively. In the case of three strategies, we derive the payoffs from dose–response curves.
As has been done in several other game-theoretical studies on host–pathogen interactions (Eswarappa, 2009; Hummert et al., 2014; Tyc et al., 2014; Dühring et al., 2015; Pollmächer et al., 2016; Dühring et al., 2017; Sharebiani et al., 2021), we here use the classical game theory, which revolves around the concepts of the payoff matrix and Nash equilibrium. The latter refers to an equilibrium solution of the game in which neither player has an incentive to change strategy unilaterally (Gintis, 2009; Tadelis, 2013). A more sophisticated approach (often called evolutionary game theory) is based on the concept of evolutionary stable strategy, which allows one to study the fate of a rare mutant with a new strategy within a resident population (Maynard Smith, 1982; Hofbauer and Sigmund, 1998; Gintis, 2009). The classical approach used here provides a basic understanding of the interactions under study (Eswarappa, 2009; Sharebiani et al., 2021). Also in classical game theory, the possibility is taken into account that a population subdivides into subpopulations adopting different strategies and that they either coexist or that one subpopulation outcompetes the other one.
Although only rarely discussed in game theory, it is tacitly assumed that the Nash equilibrium in non-sequential games is often found by iteration, particularly if there is more than one equilibrium. One player is choosing a preliminary strategy, the other player is responding and then the first player may change strategy according to that response, and so on until an equilibrium is found.
An important point is whether the players are allowed to see what the other one is doing, that is, whether information exchange is allowed. Organisms can usually (but not in every case) sense effector molecules produced by other organisms (Papenfort and Bassler, 2016; Grainha et al., 2020). Microorganisms can obtain information about their surroundings (Shapiro, 2007). It may be speculated that some microbes can even anticipate what the other player will do. Irrespective of whether information is exchanged, an interpretation in terms of populations can be used. Consider a population of hosts consisting of variants (e.g., mutants) that choose one strategy and other variants choosing the other strategy. Likewise, there is a population of pathogens including two variants. When all of them interact, four different outcomes will occur. Now, the variants getting a higher payoff will win the competition against the variants getting a lower one.
To make the presentation clearer, we here consider the situation where the pathogen produces an enzyme (such as a superoxide dismutase) that partially or completely degrades or inactivates a defense chemical (such as reactive oxygen species) produced by the host. However, the analysis can be applied to many other biological “defense/counterdefense” systems.
The assumptions and simplifications considered here in the game settings can be summarized as follows:
● We consider an asymmetric game among a population of hosts and a population of pathogens.
● An important simplification is that we consider the relation between one host species and one pathogen species at a time so that the analysis is particularly valid for specialists.
● Each individual (player) has two strategies (in Section 3), notably (counter)defense or no (counter)defense, or three strategies (in Subsection 4.2), which include partial (counter)defense.
● Individuals within one and the same population may use different strategies.
● Individuals getting a higher payoff will win the competition within a population.
● The solution of the game is found by random events in populations.
The second point is relevant because even if a defense chemical is degraded by the enzyme of one pathogen species, it may still be useful against another pathogen species. An analogous reasoning applies to the enzymes of pathogen species.
Further assumptions are mentioned for the different scenarios in the respective subsections.
In some of the game situations analyzed below, there is no pure Nash equilibrium. This case is characteristic of many games studied in game theory earlier (Gintis, 2009; Pollmächer et al., 2016; Wu and Ross, 2016; Javarone, 2018). A classical example is the “matching pennies” game (see Introduction).
The matching pennies game has a more symmetric structure than the defense/counterdefense game studied here because both players have the same strategies. However, it is an asymmetric game because the payoffs are not the same for both players. The correspondence between the two games can be seen by relating “matching” (head/head or tail/tail) to producing (counter)defense by both sides or by neither side. Then, the pathogen wins. If the strategies do not match (defense without counterdefense or vice versa), the host has an advantage because it either can defend itself or the pathogen bears the cost of counterdefense for nothing.
Obviously, both the host and pathogen have a broad spectrum of possible strategies in that they can vary the levels of toxins and toxin-degrading enzymes. First, we consider the simplest case where the host only has two strategies,
1. D: defense
2. ND: no defense
and the pathogen only has two strategies,
1. CD: counterdefense
2. NCD: no counterdefense.
This is an asymmetric game because the sets of strategies and also the payoff values differ for the two players (Figure 1). As mentioned in Section 1, we distinguish between non-sequential and sequential games depending on whether the choice is made simultaneously (or by iteration, see Section 1) or consecutively and cannot be changed afterward. In the first case, we use payoff matrices, while in the second case, we use both (extended) payoff matrices and the method of game trees (Gintis, 2009). Sequential games represent cases where the presence or action of defense chemicals triggers the production of degrading enzymes.
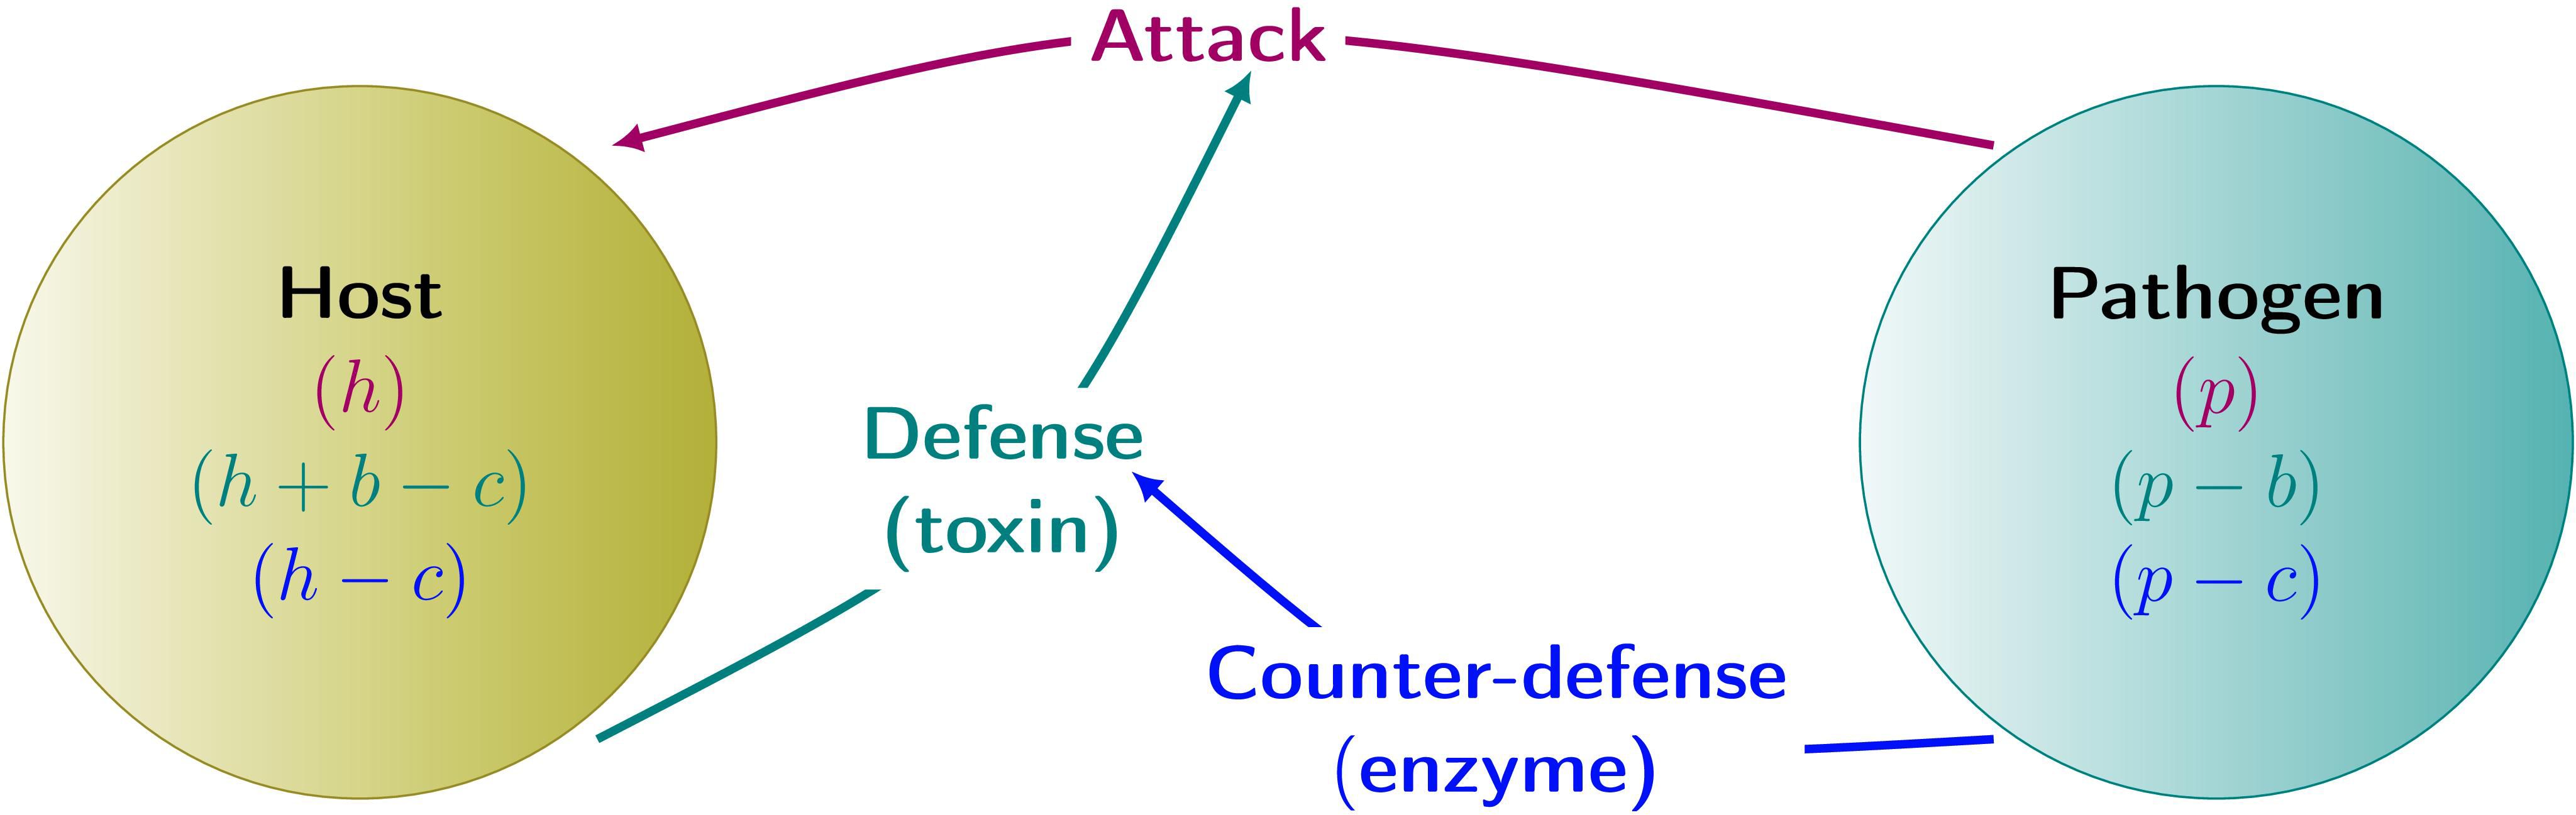
Figure 1. Schematic diagram for the defense and counterdefense game in host–pathogen interactions. h, p, initial payoffs of the host and pathogen, respectively; b, benefit from using toxin; c, cost of producing defense and counterdefense.
Sometimes, the enzyme is not able to degrade the toxin completely. We categorize the strength of the enzyme as perfectly efficient counterdefense and imperfectly efficient counterdefense.
First, we assume that the enzyme completely inactivates the toxin. Now, as mentioned above, we consider two scenarios according to the sequence in time.
First, we consider the non-sequential or simultaneous game. The payoff matrix (also known as normal form) for this subcase is given in Table 1 (see also Figure 1).
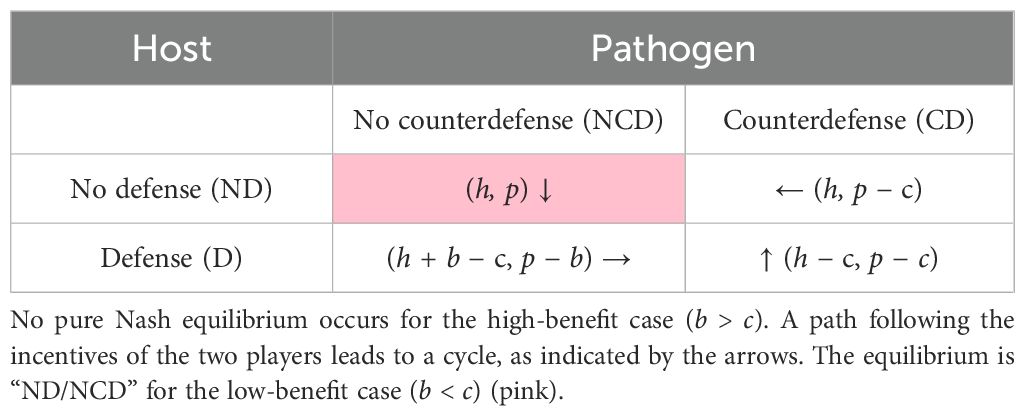
Table 1. Payoff matrix for host–pathogen interactions (perfectly efficient counterdefense).
Here, we denote the payoff value of the host and pathogen when the latter attacks the former, yet without any defense and counterdefense, as , the cost of defense or counterdefense as “c” and the respective benefit as “b.” For simplicity’s sake, we assume that the costs are the same for both organisms and that a benefit for the host implies an opposite effect for the pathogen. This restriction can be relaxed to some extent, as long as the order relations between the payoffs assumed in the two cases considered below are not changed.
We first assume that the counterdefense (e.g., inactivating enzyme) is highly efficient so that the defense is practically useless. So the payoff values in the case D/CD are just given by the payoffs in the case ND/NCD minus the costs, i.e., . If the pathogen chooses to counterdefend against no response by the host, then only the pathogen must pay the cost without having any gain. So the payoff value in the case of ND/CD is . If the host chooses to defend against no response by the pathogen, then only the host must pay the cost. In this case, the host and pathogen get benefit (b) and harm (−b). So the payoff value of D/NCD is .
We distinguish two cases, which differ in the order relations between the payoffs.
In the payoff matrix (Table 1), we can start from ND/NCD, i.e., . Here, the host has an incentive to change its strategy to D as . Now, the pathogen has an incentive to change its strategy to CD as . This, however, incites the host to switch its strategy to ND again and save its cost because . Here, the pathogen has again an incentive to switch its strategy to NCD as . This gives the host a choice to produce defense against the pathogen since and so on. This leads to oscillations. Starting from another cell in the matrix does not change this result because the oscillation covers all the cells. So, no pure Nash equilibrium occurs.
In the absence of a pure Nash equilibrium, still, a mixed Nash equilibrium occurs, which implies in the two-player game that each player chooses one or the other strategy with certain probabilities (Hofbauer and Sigmund, 1998; Gintis, 2009; Friedman and Zhao, 2021). This can be interpreted in biological terms in different ways. Either, in accordance with the cyclic dominance in the payoff matrix, oscillations occur in that defense and no defense alternate on evolutionary time scales. Moreover, there is a natural correspondence between the mixed Nash equilibria of a two-player normal form game and the Nash equilibria of an asymmetric evolutionary game in populations (Gintis, 2009, section 12.17). In the game between populations, the probabilities are usually interpreted as fractions of the populations adopting a certain strategy (Hofbauer and Sigmund, 1998; Gintis, 2009). In populations, oscillations can be interpreted in that the relative frequencies of the different strategies oscillate in time around the equilibrium frequencies, as often discussed in the case of the famous rock-scissors-paper game, which also shows a mixed Nash equilibrium (Neumann and Schuster, 2007; Gintis, 2009; Garde et al., 2020). A second interpretation is that some hosts use a defense while others do not, and they stay with their strategy. A third option is that all individuals within one population permanently produce a certain fraction of the maximum amount of (counter)defense possible. Organisms may have a broader spectrum of possible actions in that they can vary the concentrations of toxins and toxin-degrading enzymes. In order to still consider a discrete set of strategies, a straightforward extension is to consider three rather than two strategies. We will analyze these three options in Section 4.
Let us denote the fraction of hosts choosing defense or no defense by fD and fND, respectively, and analogously gCD and gNCD for the pathogen population. We assume that the hosts use the “defense” strategy, with probability fD and “no defense” with probability 1−fD, i.e., fND. Similarly, the pathogens use the “counterdefense” strategy with probability gCD and “no counterdefense” with probability 1−gCD, i.e., gNCD.
For the system under study, the expected payoff, PH, of the hosts read,
Similarly, the expected payoff, Pp, of the pathogens read:
The equilibrium fractions of the host can be calculated by setting the derivatives of the average payoffs of the host w.r.t. the fractions corresponding to that player equal to zero (Hofbauer and Sigmund, 1998; Gintis, 2009):
Analogously, the equilibrium fractions of the pathogen are calculated. Together, this gives:
Since in the high-benefit case, b > c, all these values are between 0 and 1.
We can start from ND/NCD, i.e., (Table 1). The host gets less payoff if it produces defense against the pathogen as the cost is higher than the benefit, . So strategy D is not in favor of the host. On the other hand, the pathogen must pay the cost without any gain if it chooses CD against the host which reduces its payoff, i.e., . They do not have any incentive to change their strategies. Hence, the Nash equilibrium is “ND/NCD.” This is understandable because the costs for defense or counterdefense exceed the corresponding benefit.
Alternatively, we may start from another cell in the matrix, for example, ND/CD, i.e., . Here, strategy D is not in favor of the host as , while the pathogen can switch its strategy to NCD and save its cost. Hence, the Nash equilibrium is again “ND/NCD.” We reach the same equilibrium when starting from any other cell.
In the sequential game, the second player can play a strategy after observing the first player’s move. In a sequential interaction, it is biologically plausible that the host “decides” first whether or not to produce a toxin, and only subsequently, the parasite “decides.” (The fact that it is the pathogen that initiates the interaction by attacking the host is neglected here because we do not consider that level.) Out of academic interest, we also consider, in the Supplementary Material, the opposite case where the parasite decides first.
The host can choose either to defend or not to defend, while the pathogen has now four strategies:
i. No counterdefense no matter what the host does (NCD)
ii. Counterdefense no matter what the host does (CD)
iii. Do the same thing as the host does (NCD/CD)
iv. Do the opposite of what the host does (CD/NCD)
We can write the payoff matrix on the basis of two and four strategies for the host and pathogen, respectively (Table 2).
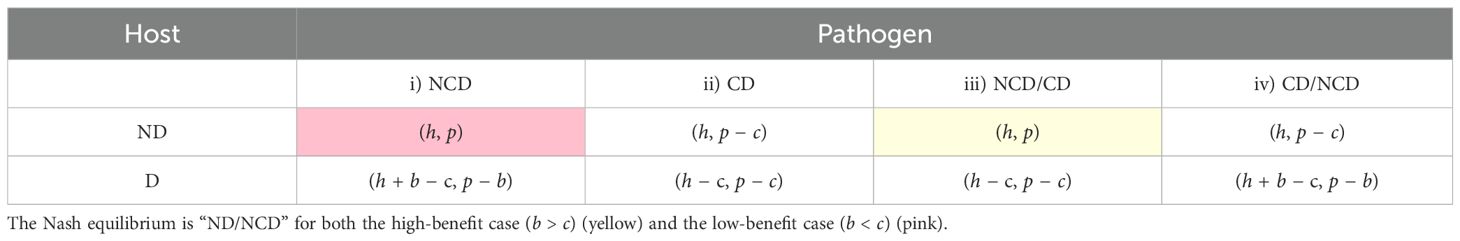
Table 2. Payoff matrix if the host plays first (perfectly efficient counterdefense).
An alternative representation is by using game trees, also known as extensive form game (Gintis, 2009) (Figure 2). Root and branch nodes represent players and branches represent their strategies. Leaves or terminal nodes correspond to the outcomes of the game with the respective payoffs. A convenient method for finding the Nash equilibria in game trees is by eliminating the dominated strategies from the leaves to the root, a method called backward induction.
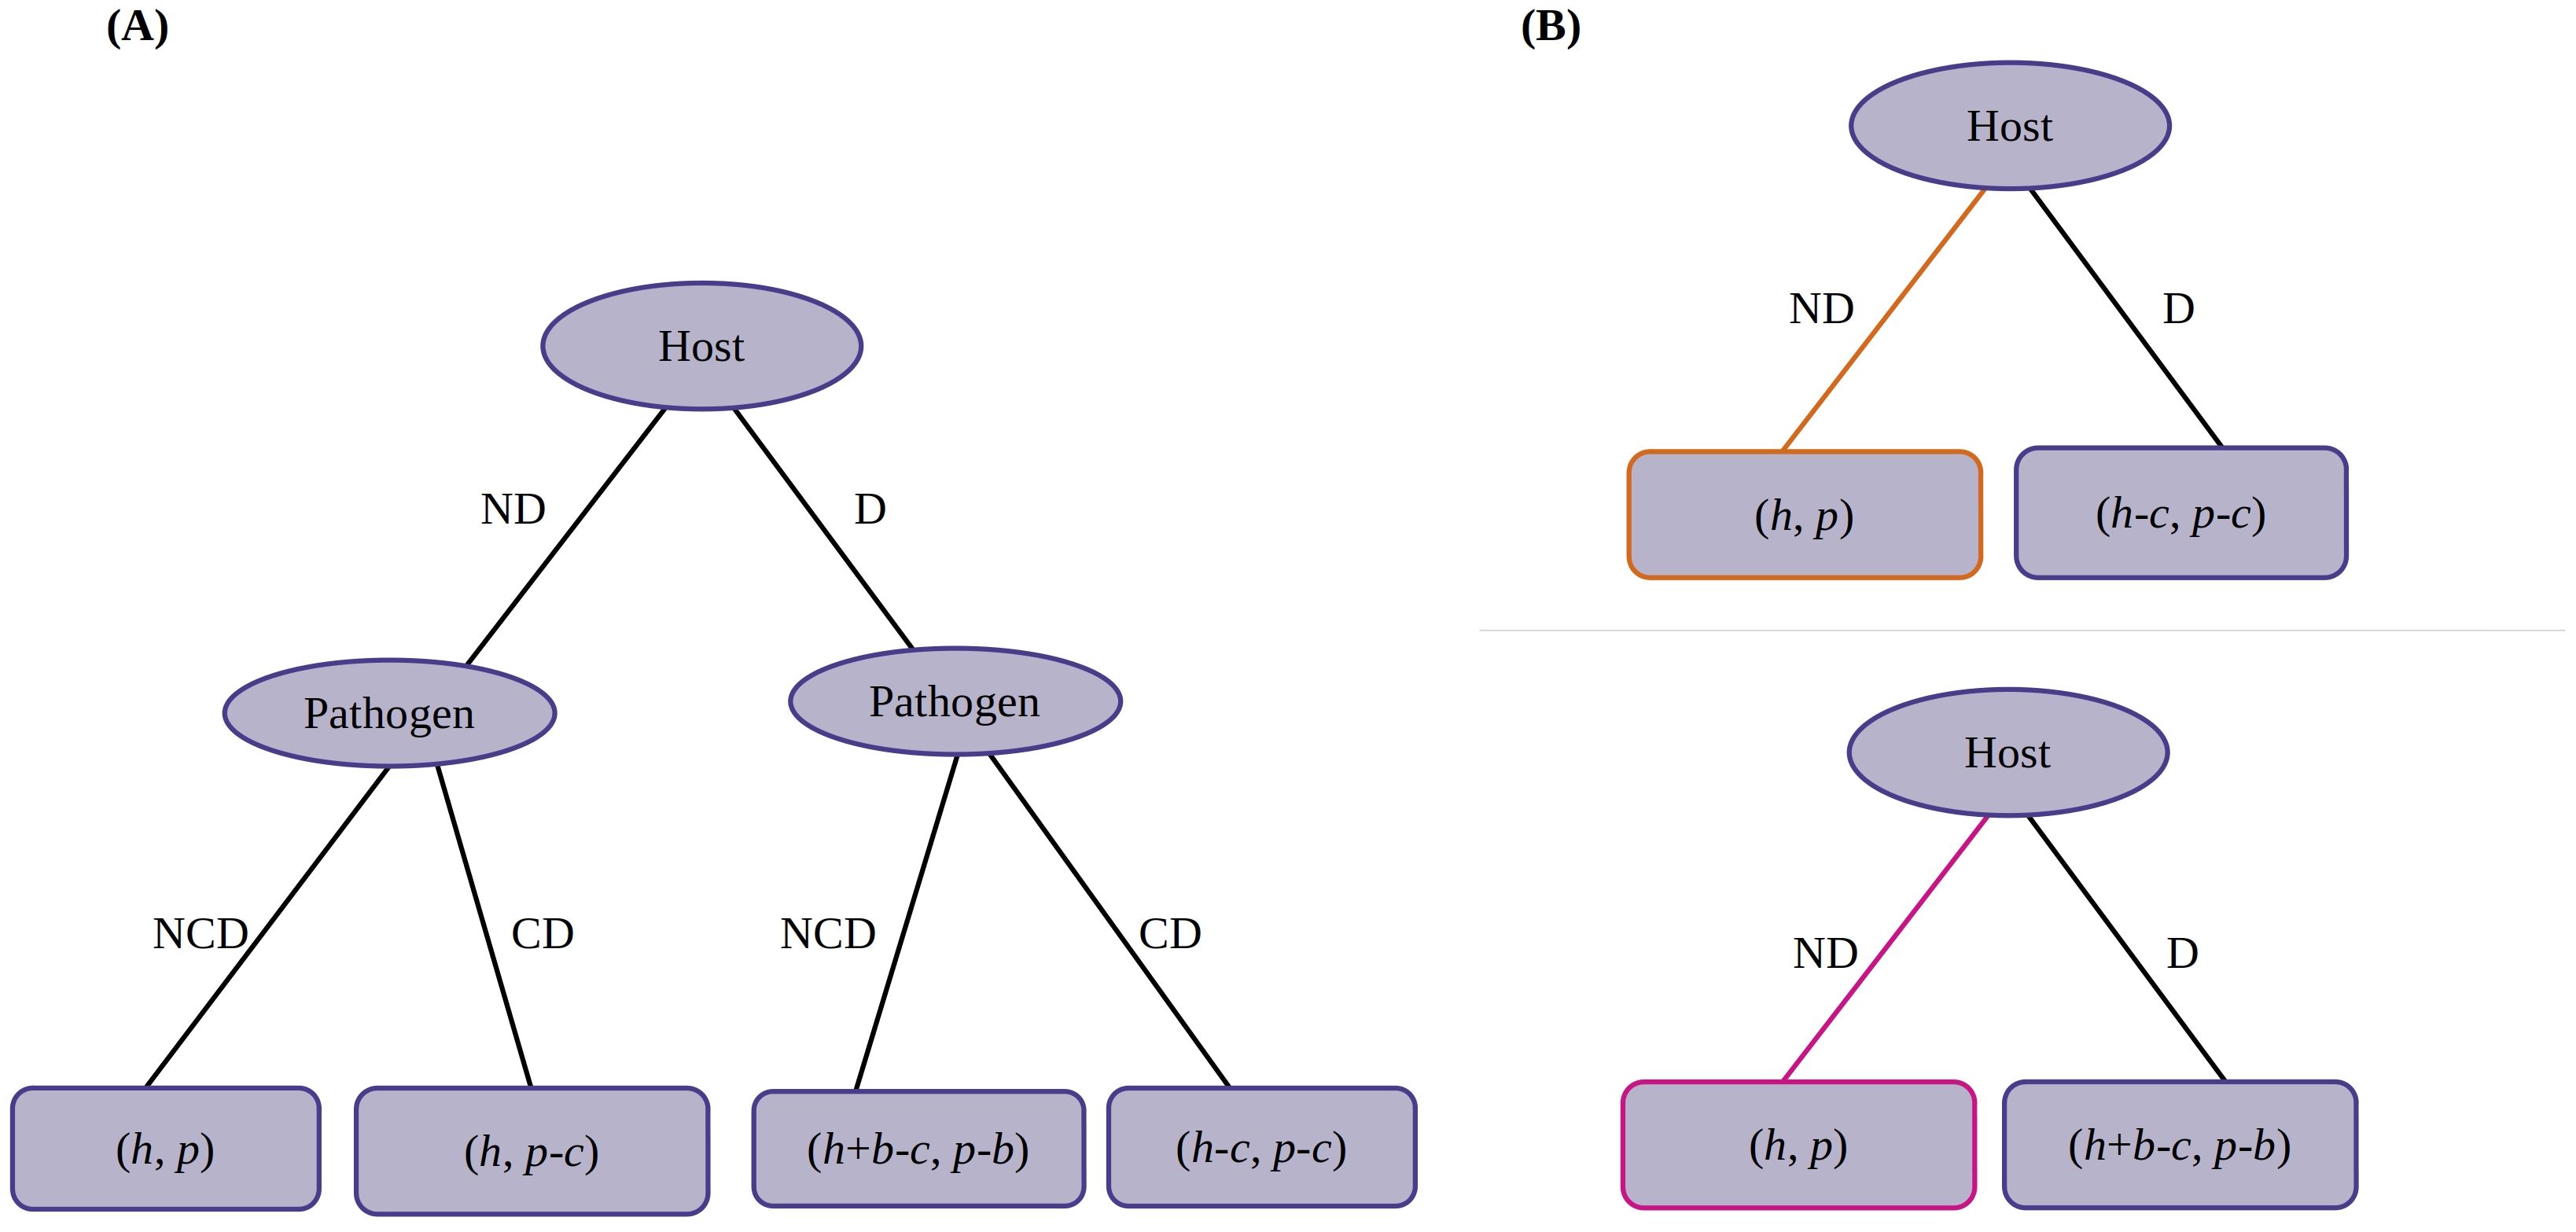
Figure 2. Game tree (extensive form game) for the case where the counterdefense is perfectly efficient. (A) Initial tree. (B) Processed form. Top panel, case (i) (b > c). Bottom panel, case (ii) (b < c). Nash equilibria are indicated in yellow and pink corresponding to Table 2.
We distinguish two cases, which differ in the order relations between the payoffs.
Here, we use backward induction to solve the game tree. We start from the left leaf nodes and (Figure 2A). Strategy NCD dominates CD as the payoffs for the pathogen satisfy the inequality . So, we eliminate strategy CD. Now, in the right nodes and , strategy CD dominates NCD as . So, we eliminate strategy NCD.
The next processed tree is shown in Figure 2B (top panel). Here, strategy ND dominates D as . So, the host will choose strategy ND. The final payoffs for the host and pathogen are “h” and “p.” Hence, the equilibrium is “ND/NCD.” Intuitively, one may have not expected this result if the benefits are high.
In this case (Figure 2A), we start from the left and right leaf nodes as before, and we see that strategy NCD dominates CD on both sides as the payoffs for the pathogen satisfy the inequality and . So, we eliminate strategies CD from both sides.
In the tree shown in Figure 2B (bottom panel), strategy ND dominates D as inequality . The final payoffs are “h” and “p.” Hence, the equilibrium is “ND/NCD.”
Interestingly, the Nash equilibrium is the same for both cases (i) and (ii), i.e., “ND/NCD.” Obviously, this is not observed in all real interactions between a host and a pathogen. In Section 1, we gave several examples of chemical defenses. This discrepancy may arise from our simplifying assumption that the counterdefense is perfectly efficient.
Now, we assume that the counterdefense is not perfectly efficient. This means, for example, that the enzyme degrades the toxin partially, so that there remains some effect of the toxin after defense and counterdefense.
The payoff matrix for the non-sequential game where the host and pathogen choose their strategies simultaneously is given in Table 3.
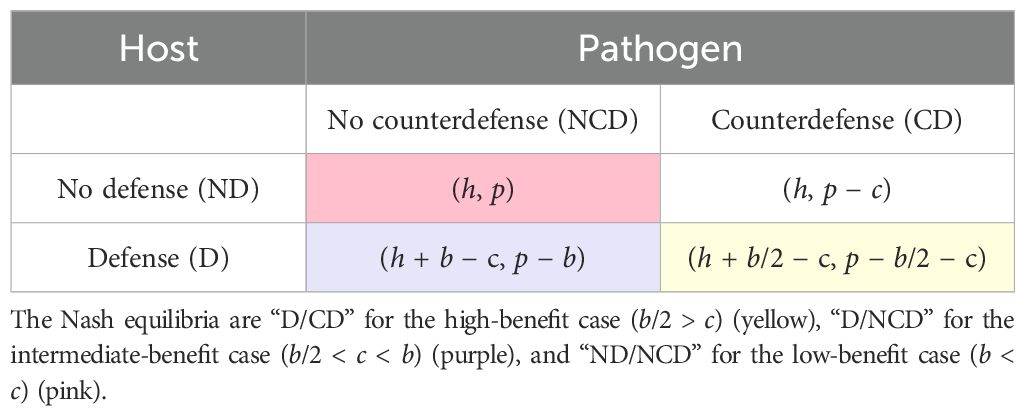
Table 3. Payoff matrix for the host–pathogen interaction (imperfectly efficient counterdefense).
Since we assume that the counterdefense (e.g., inactivating enzyme) is imperfectly efficient, the defense is not completely useless. So, the payoff values in the case D/CD are just given by the payoffs (h, p) modified by the costs and some benefit/loss due to the toxin, which we here assume to be half of the full benefit, leading to the payoffs . All the other payoffs are the same as before. In the scenarios of imperfectly efficient counterdefense, we distinguish three subcases:
We start from the cell ND/NCD. Here, the host has an incentive to change its strategy to D due to the inequality . Now, the pathogen changes its strategy to CD as is satisfied. At this point, they do not have any incentive to change their strategies. In a similar way, starting from every cell of the payoff matrix, we find that the iteration stops at the cell D/CD every time. Hence, the equilibrium is “D/CD.”
In this case, the equilibrium is “D/NCD” with the payoffs because neither player then has an incentive to change its strategy due to the inequalities defining this case. The other entries in the matrix do not have this property, so that this is the only Nash equilibrium.
Here, the equilibrium is “ND/NCD.” This can be understood because the costs for defense and counterdefense are high.
Now, we consider the sequential game where the host and pathogen play as first and second player, respectively. The opposite case where the pathogen decides first is considered in the Supplementary Material.
The host has two strategies, while the pathogen has four strategies (Table 4), notably the same as in the case of perfectly efficient counterdefense.
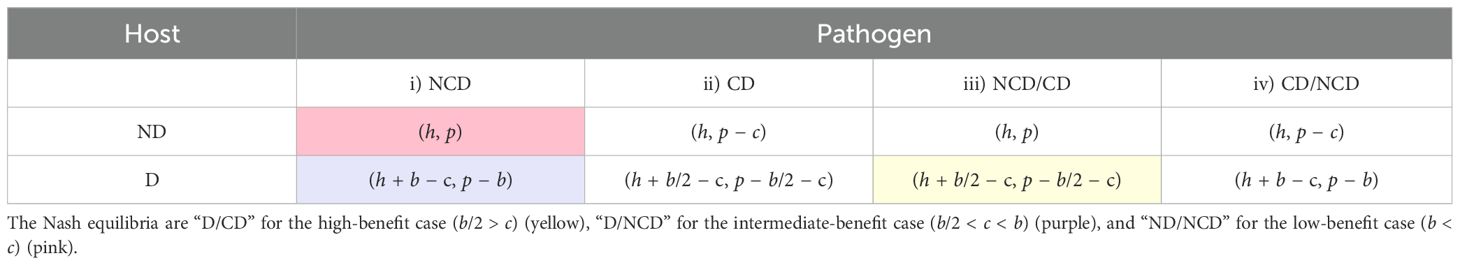
Table 4. Payoff matrix if the host plays first (imperfectly efficient counterdefense).
The game tree form of the case where the host plays first and the corresponding payoffs are depicted in Figure 3. Here, we again solve the game tree using backward induction. We start from the left leaf nodes and see that the strategy NCD dominates CD for the pathogen (Figure 3A). For the right leaf nodes, payoffs depend on “b” and “c.”
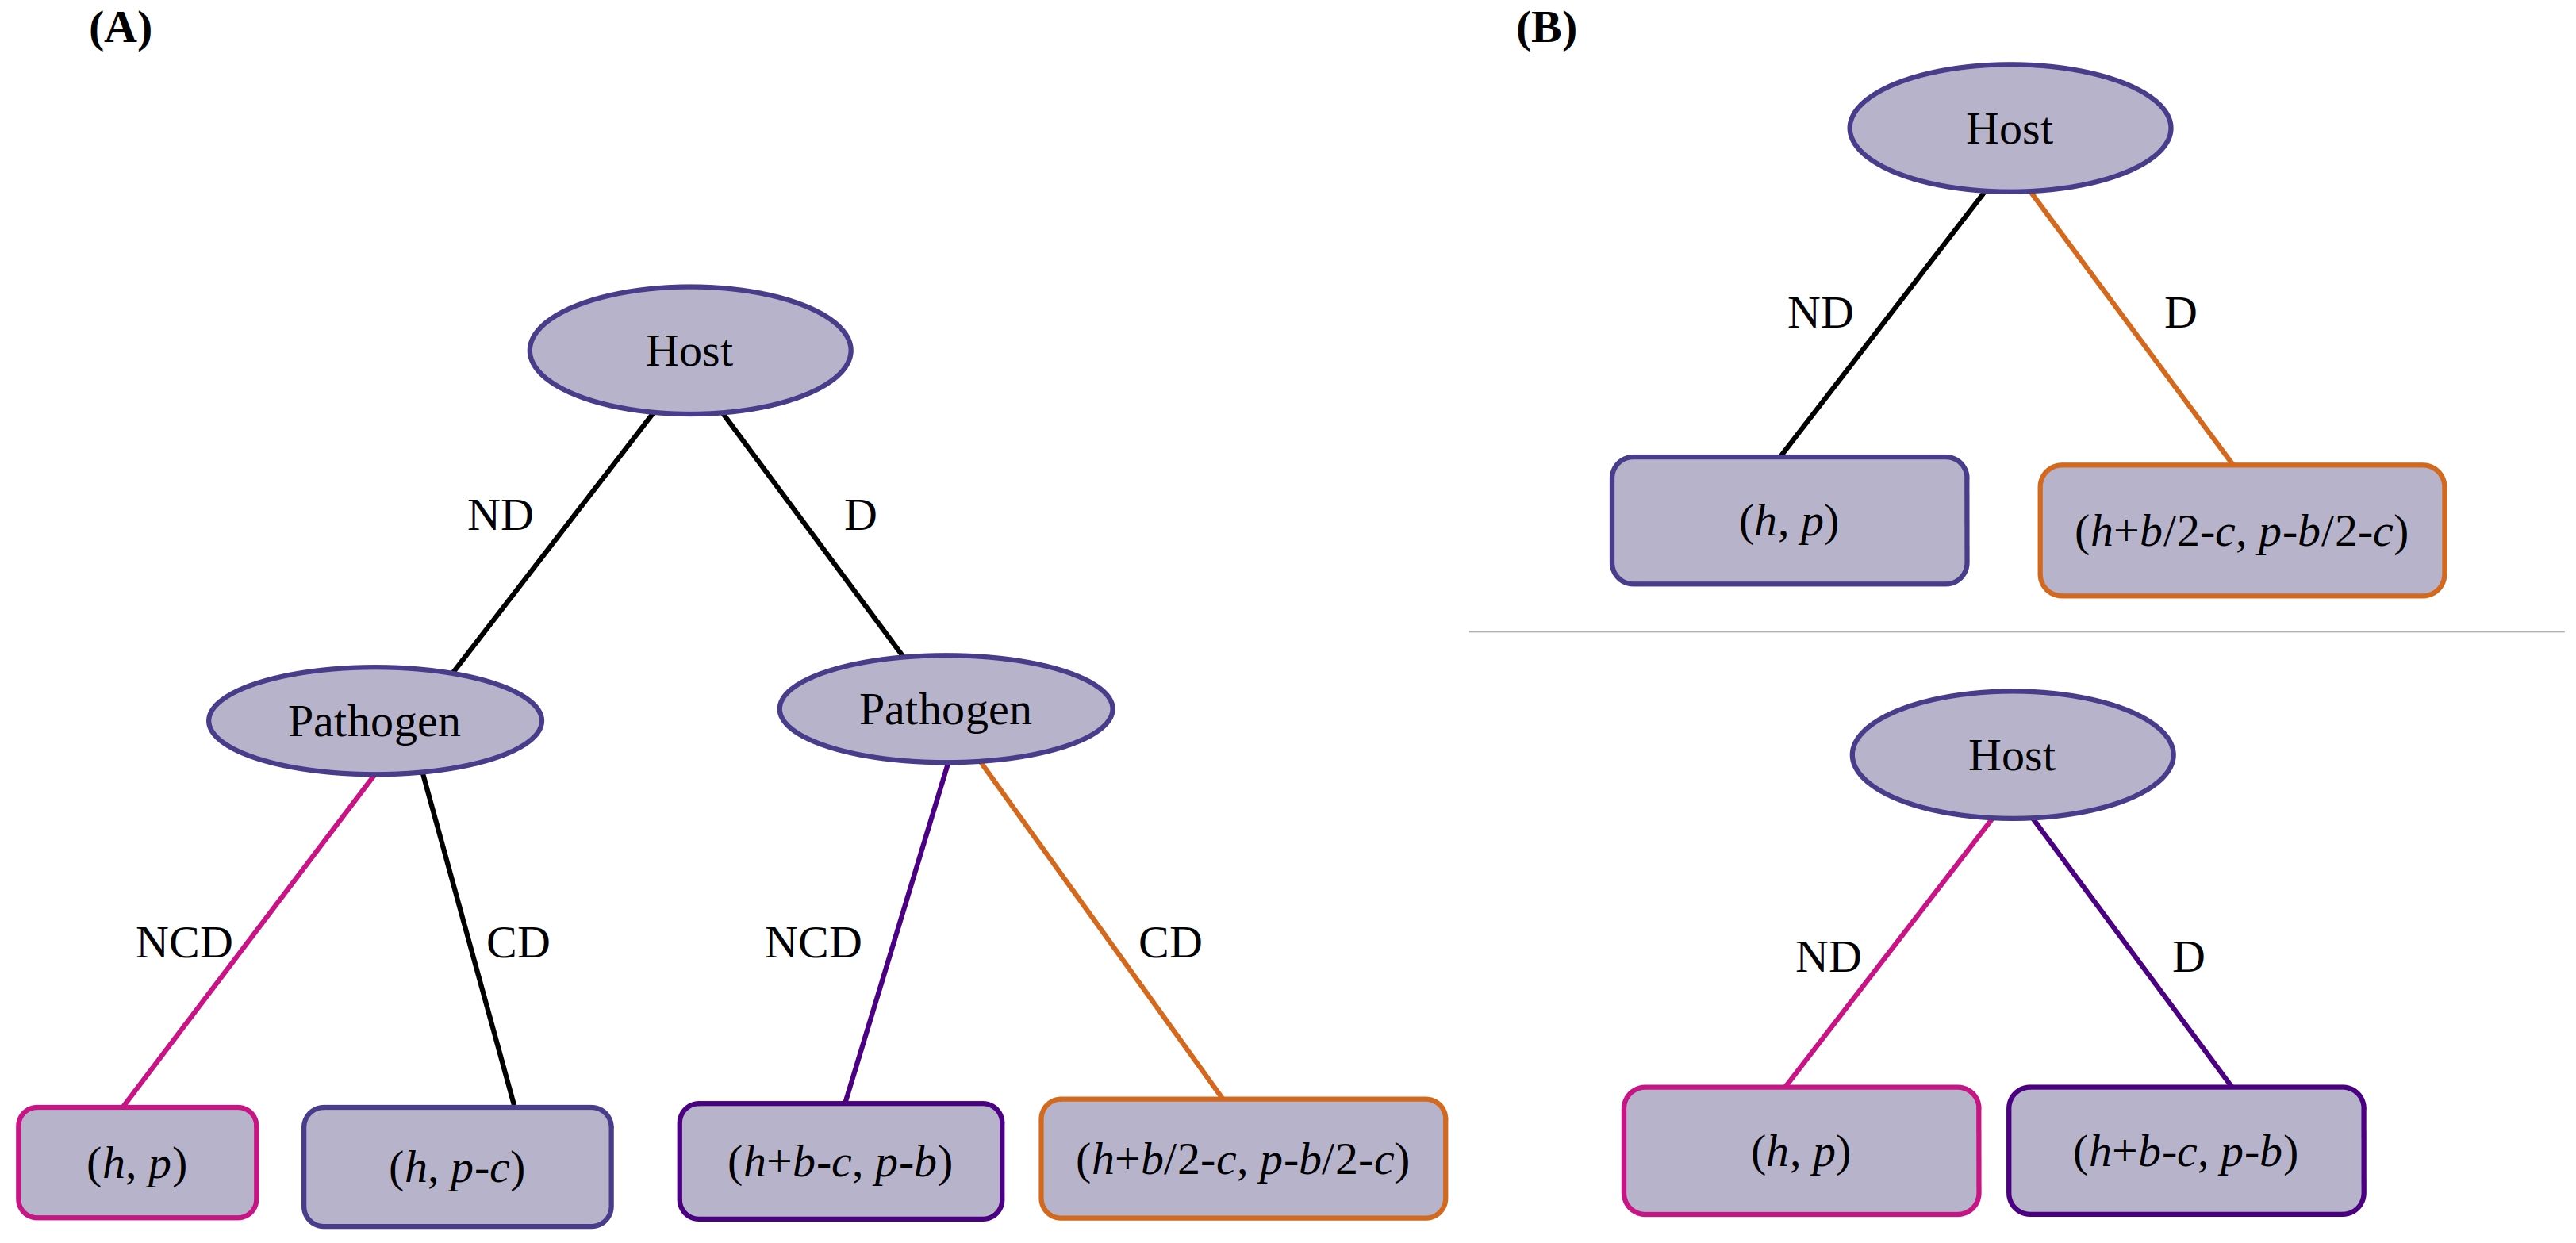
Figure 3. Game tree (extensive form game) for the case where the counterdefense is imperfectly efficient. (A) Initial tree. (B) Processed form. Top panel, case (i) (b/2 > c). Bottom panel, case (ii) (b/2 < c < b) and case (iii) (c > b). Nash equilibria are indicated in yellow, purple, and pink corresponding to Table 3.
In the right nodes, strategy CD dominates NCD as . Now, in the processed form, strategy D dominates ND as (Figure 3B, top panel). So, the host will choose to defend. Hence, the equilibrium is “D/CD.”
In an analogous way as above, we derive the processed tree as shown in Figure 3B (bottom panel). Here, strategy D dominates ND as . Hence, the equilibrium is “D/NCD.”
By analyzing the payoffs, one can see that the next processed tree is the same as in case (ii), shown in Figure 3B (bottom panel). Here, however, strategy ND dominates D as it gives a higher payoff to the host, i.e., . Hence, the equilibrium is “ND/NCD.” Thus, in the three cases, three different Nash equilibria are obtained.
In the previous section, we made a distinction between two discrete strategies for each player: (counter)defense or no (counter)defense. However, organisms have a broader spectrum of possible actions in that they can vary the concentrations of toxins and toxin-degrading enzymes, so that they could find a compromise equilibrium in which either side produces a submaximal amount. Alternatively, evolution could change the chemical structure of the defense chemical to make it more toxic or the properties of a degrading enzyme to make it more efficient. To some extent, this is similar to changes in the amount of toxin or enzyme provided that higher toxicity or efficiency implies higher costs.
As mentioned in Subsection 3.1.1, we want to find out, by looking at the strategies in more detail, whether the mixed Nash equilibrium leads to a stationary compromise or to a never-ending switching between production and no production. In this section, we calculate the payoffs for the host and pathogen from the concentrations of the toxin and enzyme, based on the benefit, which we will here call response (in the sense of dose–response curves) and the cost.
As we can assume that the cost for producing the toxin or enzyme is proportional to their initial concentrations (Zhang and Jiang, 2006), we have
where a = specific cost for producing toxin, f = coefficient of toxin effect on pathogen, c = specific cost for producing enzyme, T0 = initial toxin concentration, and E0 = initial enzyme concentration.
We calculate the response from the Hill equation, which is often used for quantifying dose–response relationships (Chou and Talalay, 1984; Gadagkar and Call, 2015), i.e.,
where l = response when dosage T0 is 0, n = response for an infinite dosage, m = half-saturation constant, and k = Hill coefficient.
For simplicity’s sake, we put the parameter l equal to zero since there is often no effect in the absence of toxin. Then, the parameter m equals the value of T0 at which half of maximum response occurs. Figure 4 represents the payoff as a function of toxin concentration, where the curve first decreases to negative values because for low concentrations, the toxic effect is negligible while some cost needs to be afforded. Only at higher concentrations, the curve starts increasing and reaches its maximum point and then monotonically decreases. It is worth mentioning that the graphs in Figures 4–6 were plotted with arbitrary parameters. Therefore, the numbers in the table are not based on experimental data, since these are not needed to show the qualitative effect.
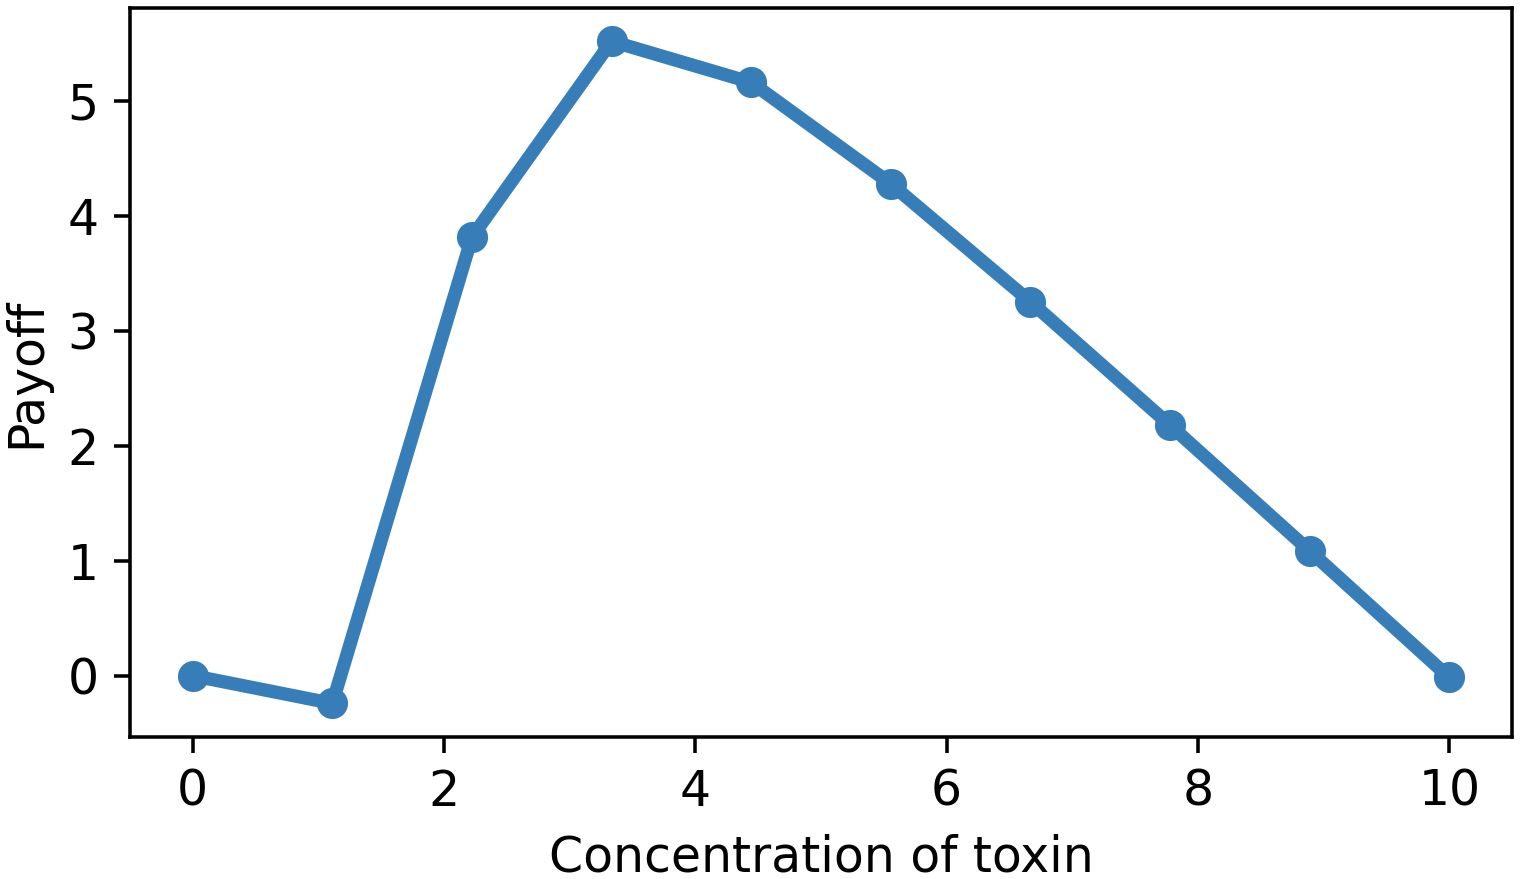
Figure 4. Dose–payoff curve for the host (Hill equation minus linear cost function). Parameter values: l = 0, m = 2, n = 10, k = 4.
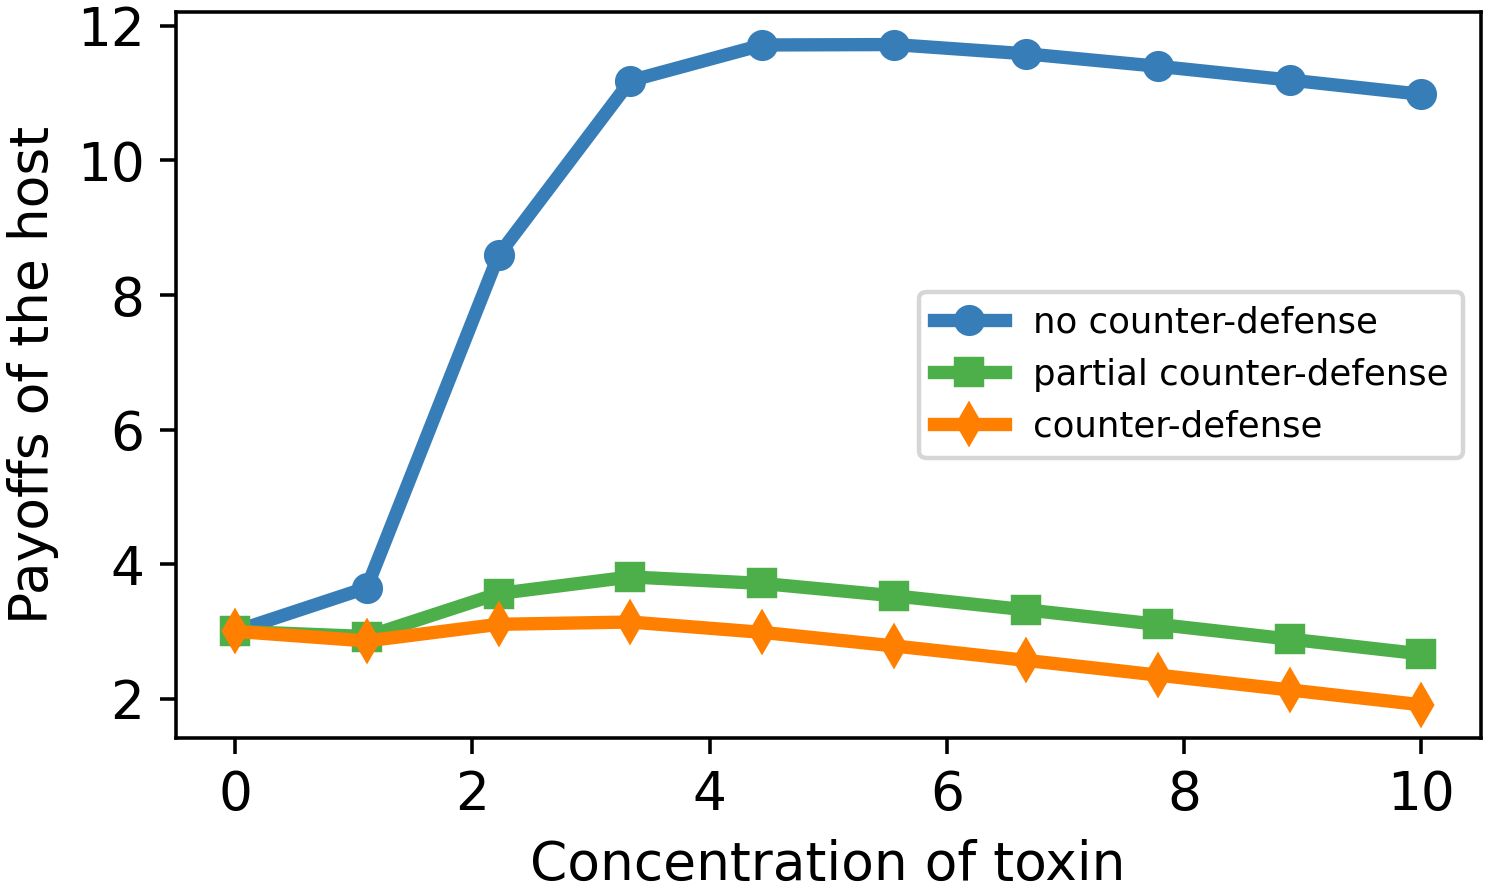
Figure 5. Dose–payoff curve for the host as a function of toxin concentration for three different enzyme concentrations. Parameter values: m = 2, n = 10, k = 4, a = 0.2. E0 = 0 (blue curve), 5 (green), and 10 (orange).
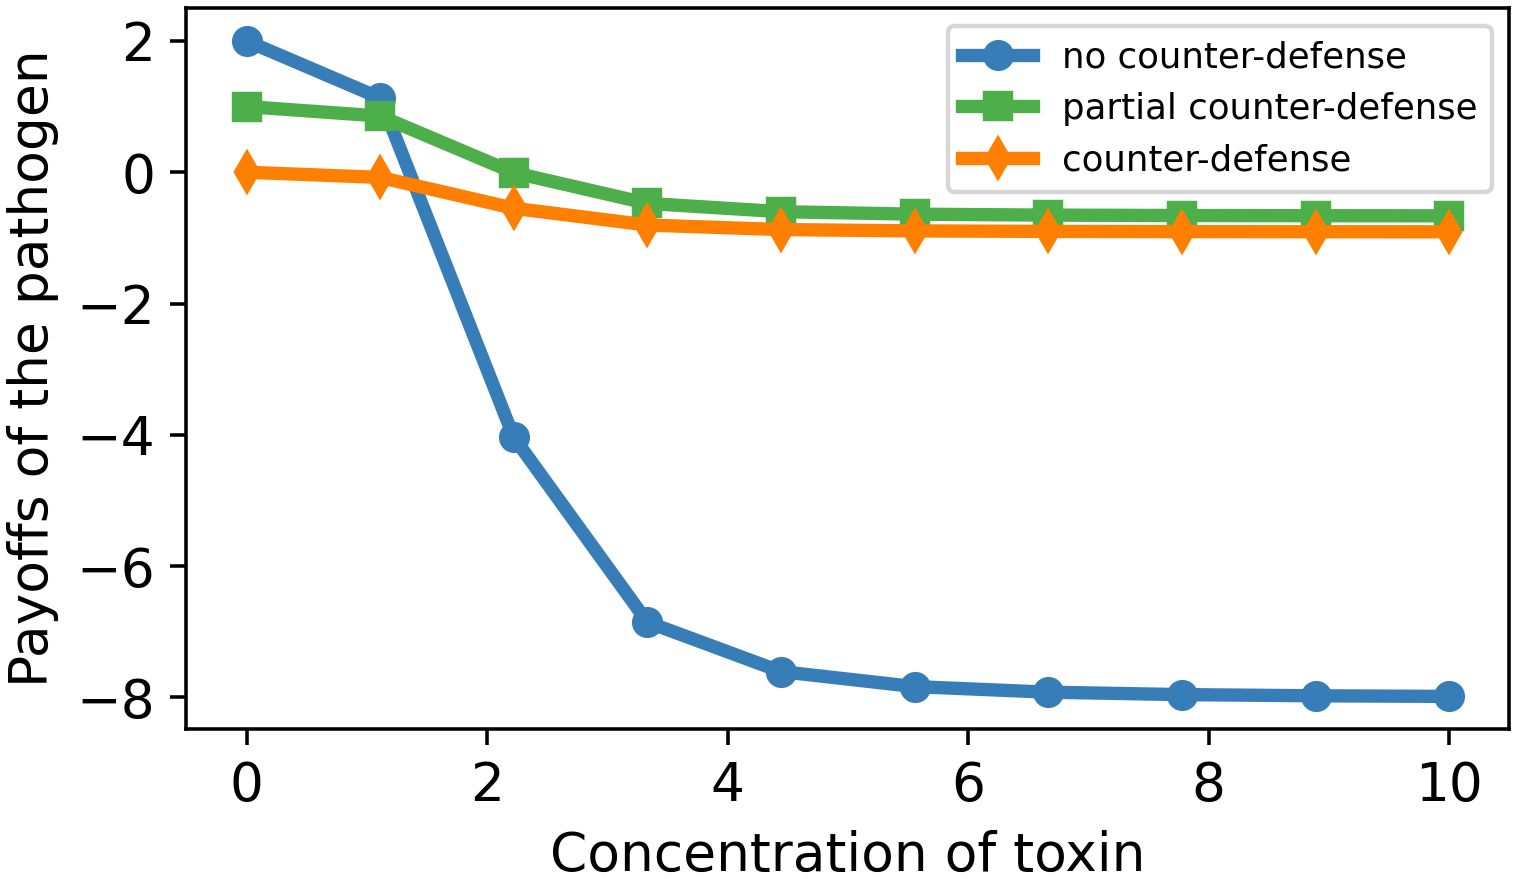
Figure 6. Dose–payoff curve for the pathogen as a function of toxin concentration for three different enzyme concentrations. Parameter values: m = 2, n = 10, k = 4, c = 0.2, f = 1. E0 = 0 (blue curve), 5 (green), and 10 (orange).
A graphical model of the dependence of benefit on the allocation to defense including the effect of costs was proposed earlier by Simms and Rausher (1987). It combines a Michaelis–Menten curve with linear costs and also leads to the phenomenon that the maximum effect is reached at intermediate toxin levels. A refined model based on a sigmoidal function has been suggested by Siemens et al. (2010).
Then, we calculate the payoffs for the host from Equation 3 in the presence of the enzyme. It is not straightforward how the enzyme is taken into account. In principle, a small constant enzyme concentration is sufficient to inactivate a large toxin concentration in the long run. Here, however, we consider a snapshot, so to speak. That is, we analyze the short-term effect. We describe that effect approximately by dividing the Hill kinetics by the term (1 + E0). It has the favorable properties that it does not change the Hill kinetics in the case E0 = 0 and tends to zero for very large values of E0. A similar dependence was used for quantifying the effect of defense on herbivory (Zhang and Jiang, 2006). From Equations 3 and 5, we obtain
To calculate the maximum payoff, we equate the derivative of the payoff with respect to toxin to zero. We obtain a polynomial equation for T0, which cannot normally be solved analytically:
For the game-theoretical analysis, we need not calculate the optimum value (see below).
Figure 5 represents the payoffs of the host in dependence on the extent of defense. We can see that the graphs first decrease to negative values and then start increasing to their maximum points and then monotonically decrease. The three curves represent the payoffs of the host in the cases of no counterdefense, partial counterdefense, and full counterdefense produced by the pathogen.
Obviously, a host has the highest payoff in the absence of the pathogen’s counterdefense. In the presence of toxin-degrading enzymes, the host has maximum payoff when it uses a submaximum concentration of toxin because a higher concentration would imply unnecessarily high costs (Figure 5).
Furthermore, we calculate the payoff for the pathogen based on the toxin concentration from Equation 4, using the Hill equation in the presence of the enzyme, from Equation 5,
We equate the derivative of the payoff with respect to the enzyme to zero. We obtain , where the response is described in Equation 5.
Figure 6 represents the payoffs of the pathogen in dependence on the toxin concentration when it produces no counterdefense, partial counterdefense, and full counterdefense. The graphs first show a short plateau, then decrease, and finally tend asymptotically to negative values. The pathogen has always maximum payoffs when there is no defense produced by the host. Furthermore, it becomes clear from Figure 6 that the production of the enzyme is beneficial for the pathogen whenever the toxin concentration is above a certain threshold. The payoffs for the partial counterdefense are always higher than the payoffs for full counterdefense. This shows that the use of the partial concentration of the enzyme is favorable to the pathogen.
In game theory, it is much more usual to consider discrete strategies than continuous strategies (Hofbauer and Sigmund, 1998; Gintis, 2009; Hummert et al., 2014). Most often, the analysis is based on a set of two discrete strategies, as done in Section 3. However, Figure 4 shows that the highest effect is achieved for an intermediate toxin concentration. Therefore, we now distinguish three strategies for each player: no, partial, or complete (counter)defense, which can be interpreted in terms of toxin concentration or of toxicity. In another context, we have analyzed a two-player, three-strategy game earlier (Garde et al., 2020). We can extract the payoff values from Figures 5, 6 by considering the concentration values 0, 5, and 10 both for the toxin and the enzyme (Table 5).
It can be seen that the host has maximum payoff when it defends partially against the pathogen when the latter does not use counterdefense. Starting from any cell of Table 5, the equilibrium is reached at the cell “Partial defense/partial counterdefense.” If the players deviate from these strategies, their payoff decreases. Thus, in this situation, no oscillation occurs, in contrast to the two-strategy game. Rather, a stationary trade-off is found, as illustrated in Figure 7.
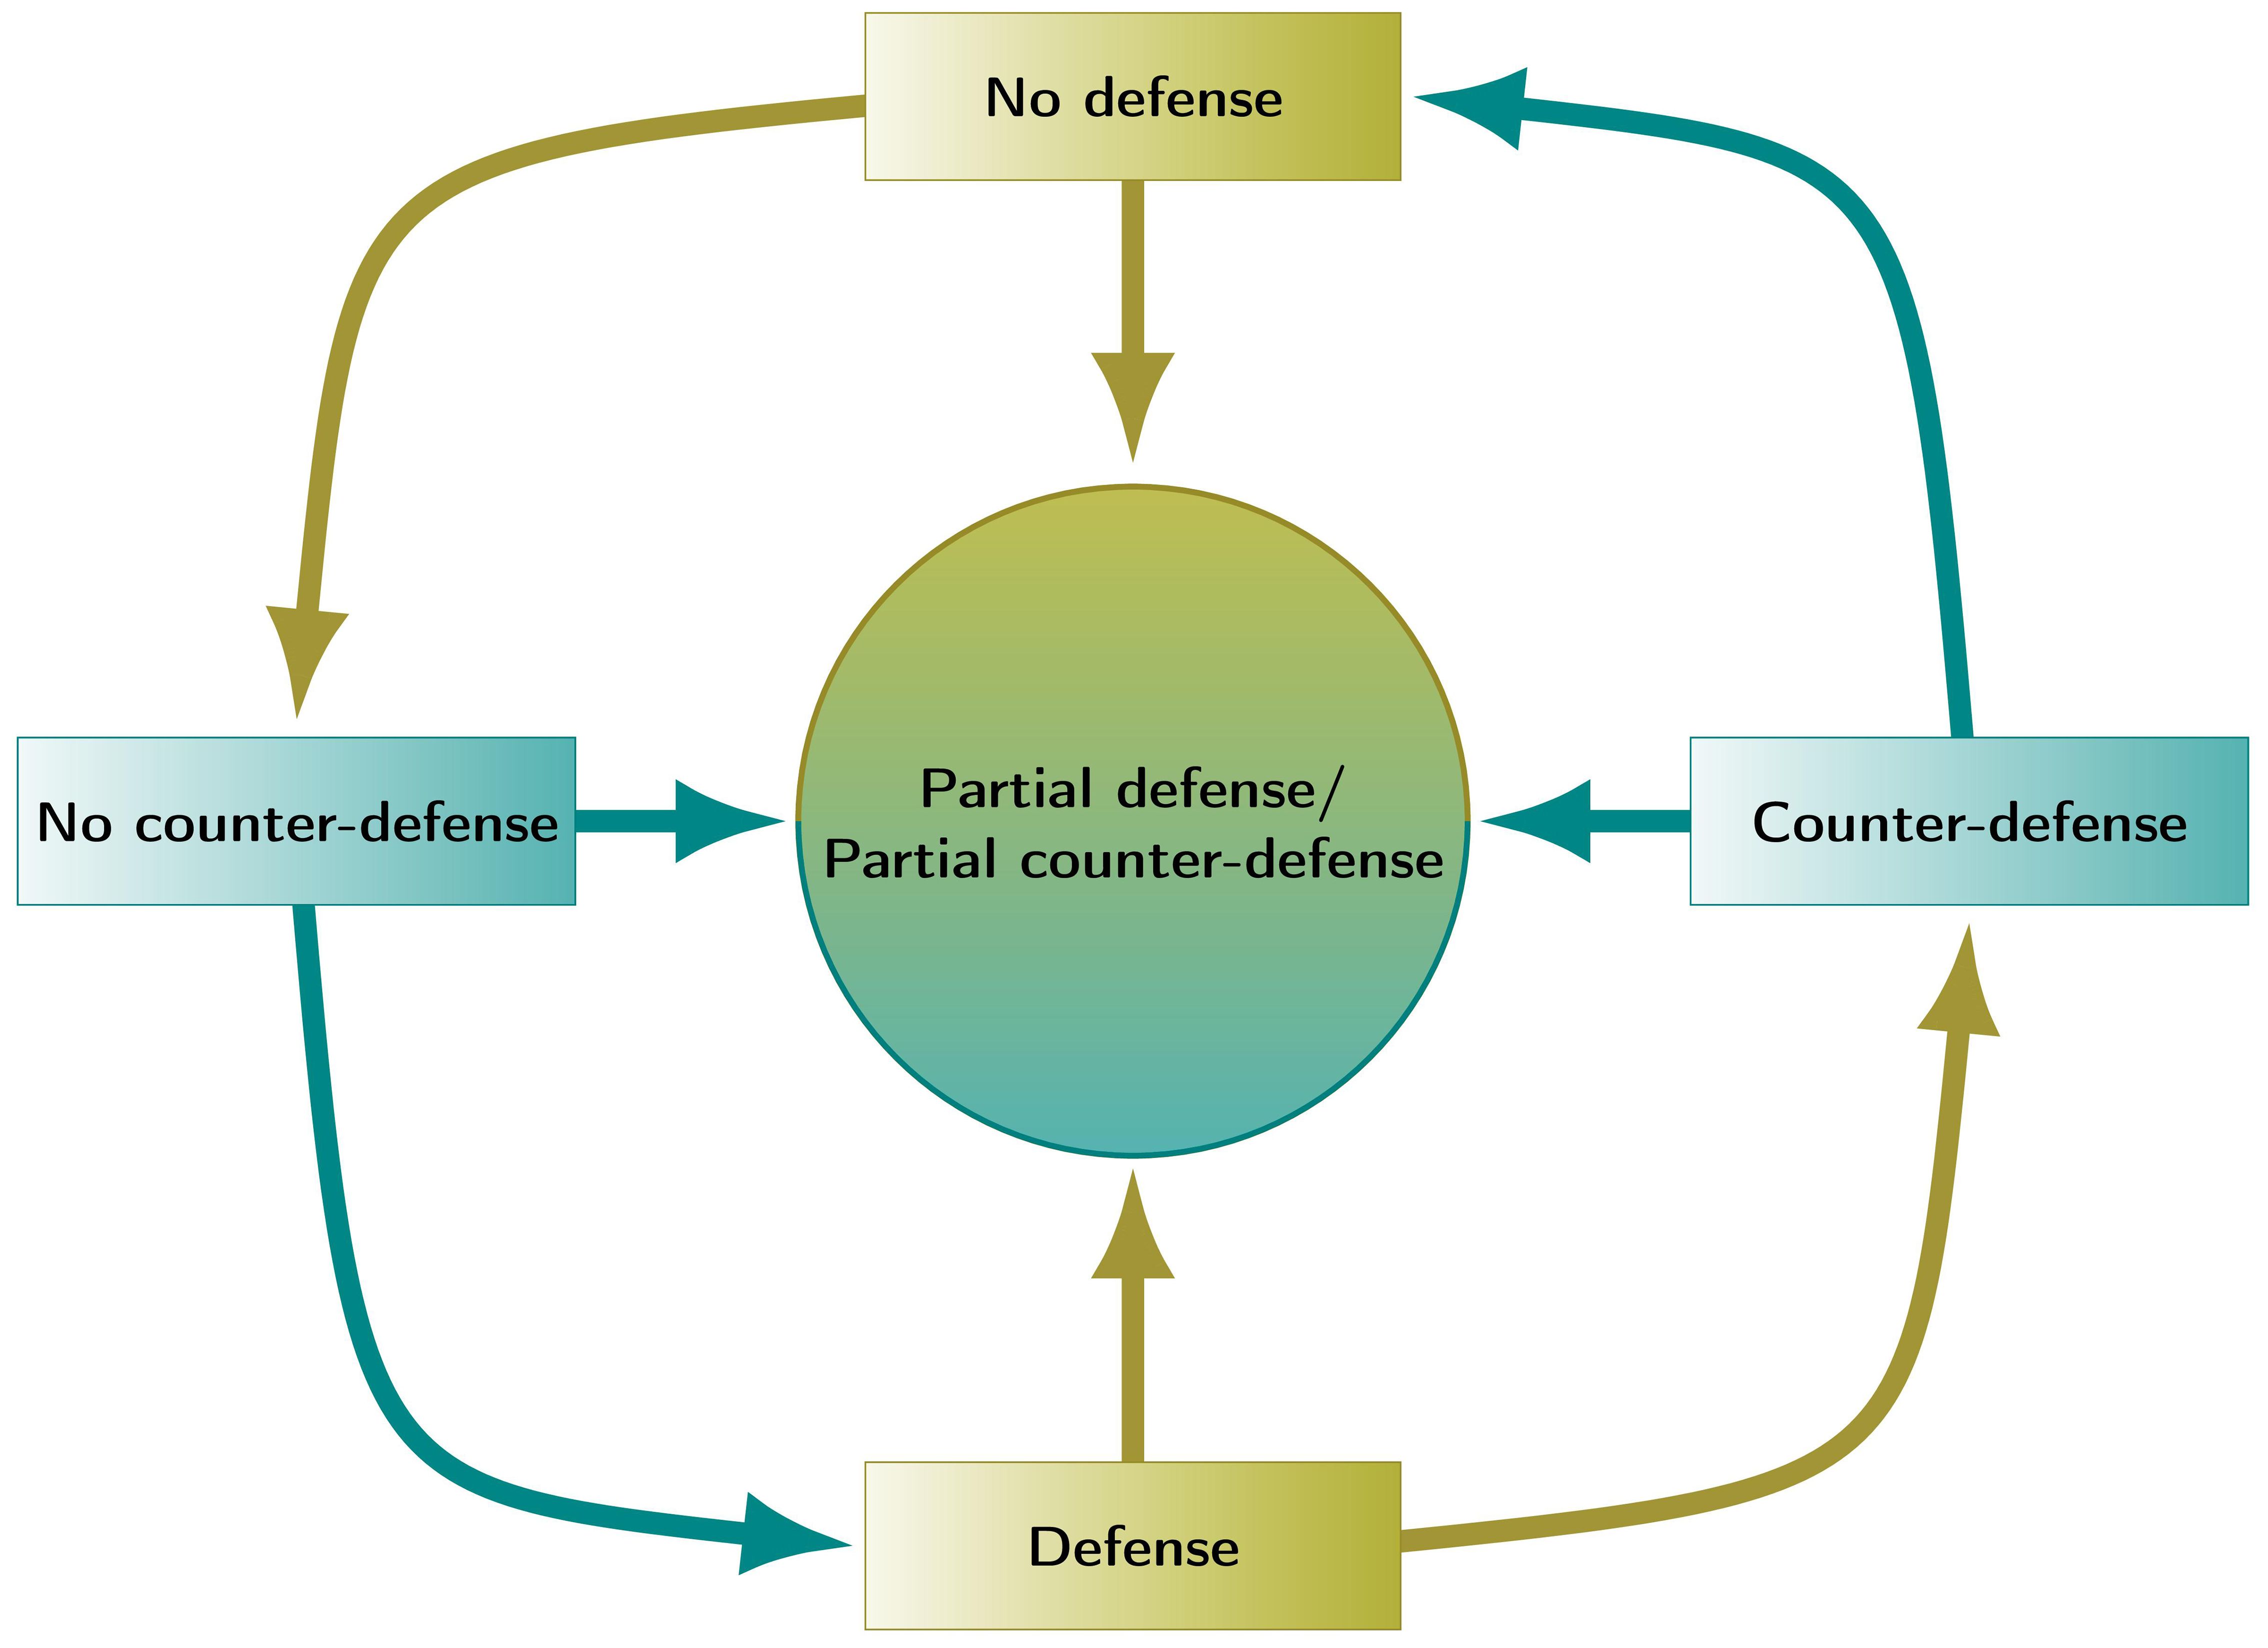
Figure 7. Schematic representation of the dynamics resulting from the two-strategy and three-strategy games between the host and pathogen. In the two-strategy game, strategies are changed in a cyclic way (see Table 6), while in the three-strategy game with non-monotonic response functions, the system tends to a stable equilibrium “in the center” (see Table 5). Green, strategies of the host; blue, strategies of the pathogen.
It is of interest to analyze a three-strategy game where the payoffs are changing monotonically, in contrast to Table 5. For example, when “Partial defense/partial counterdefense” provide payoff values of 2.8 and −4, there is an incentive for either player to leave the intermediate strategies. Then, a cyclic behavior as in Table 6 occurs. Note the important difference between monotonic and non-monotonic payoff functions. While the former lead to oscillations, the latter may lead to a pure Nash equilibrium.
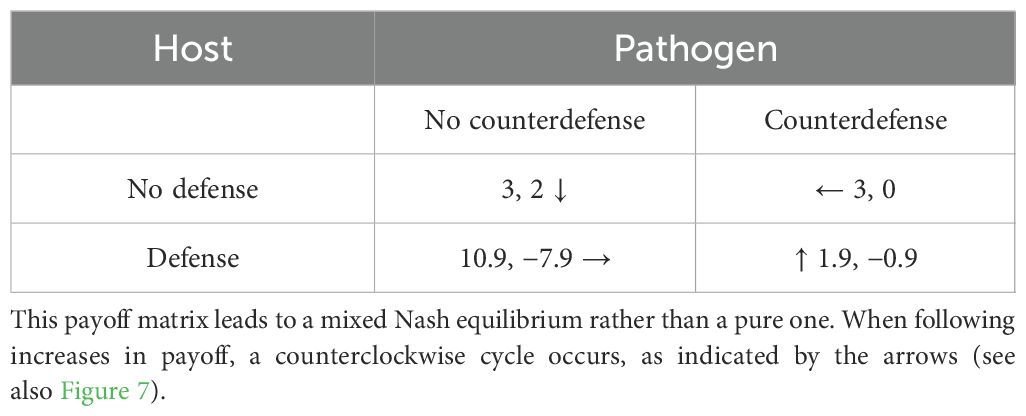
Table 6. Payoff values for the two-strategy host–pathogen game.
To make the point of oscillation versus stationary trade-off clearer, we simplified Table 5 by omitting the intermediate strategies, shown in Table 6. The payoff values for a two-strategy game in this table fulfil the same order relations as in the high-benefit case in Subsection 3.1.1 (Table 1).
Thus, the game shows a cyclic dominance structure rather than a pure Nash equilibrium (see also Figure 7, cycle on the periphery).
For the two-strategy game, a mixed Nash equilibrium can be calculated, meaning that each strategy is adopted by a certain probability. Let us consider that the host uses a “defense” strategy with probability r and “no defense” with probability 1−r. This could be interpreted in that a fraction r of all hosts use the defense strategy. Similarly, the pathogen uses the “counterdefense” strategy with probability s and “no counterdefense” with probability 1−s.
Mixed Nash equilibria can be calculated by putting the derivative of the average payoffs with respect to probabilities equal to zero (as outlined in Subsection 3.1.1).
We obtain and .
As soon as one player somewhat deviates from the best (mixed) response, the other player has an incentive to switch to a pure strategy, as can be shown by differentiating the above response functions. Hence, the best response functions are as follows:
For s = 0.878, the host can, as an immediate response, use any probability r. However, if this probability deviates from r = 0.185, the pathogen can, in the next iteration, respond accordingly and increase its payoff. Therefore, it is best for the host to choose r = 0.185 and analogously for the pathogen to choose s = 0.878, leading to the Nash equilibrium.
In terms of populations, the mixed Nash equilibria can be interpreted such that the probabilities correspond to fractions of the two populations. So, approximately 19% of the host population play the defense strategy and approximately 88% of the pathogen population play the counterdefense strategy.
In Table 7, the results of all games analyzed above are summarized, most of them in dependence on the order relation among the benefits and costs. For simplicity’s sake, for the three-strategy game, we did not distinguish any subcases depending on the benefit and costs nor on perfectly and imperfectly efficient counterdefense. It is a general result that in the low-benefit case, always “No defense/no counterdefense” results. The explanation for the case “pathogen plays first” is given in the Supplementary Material.
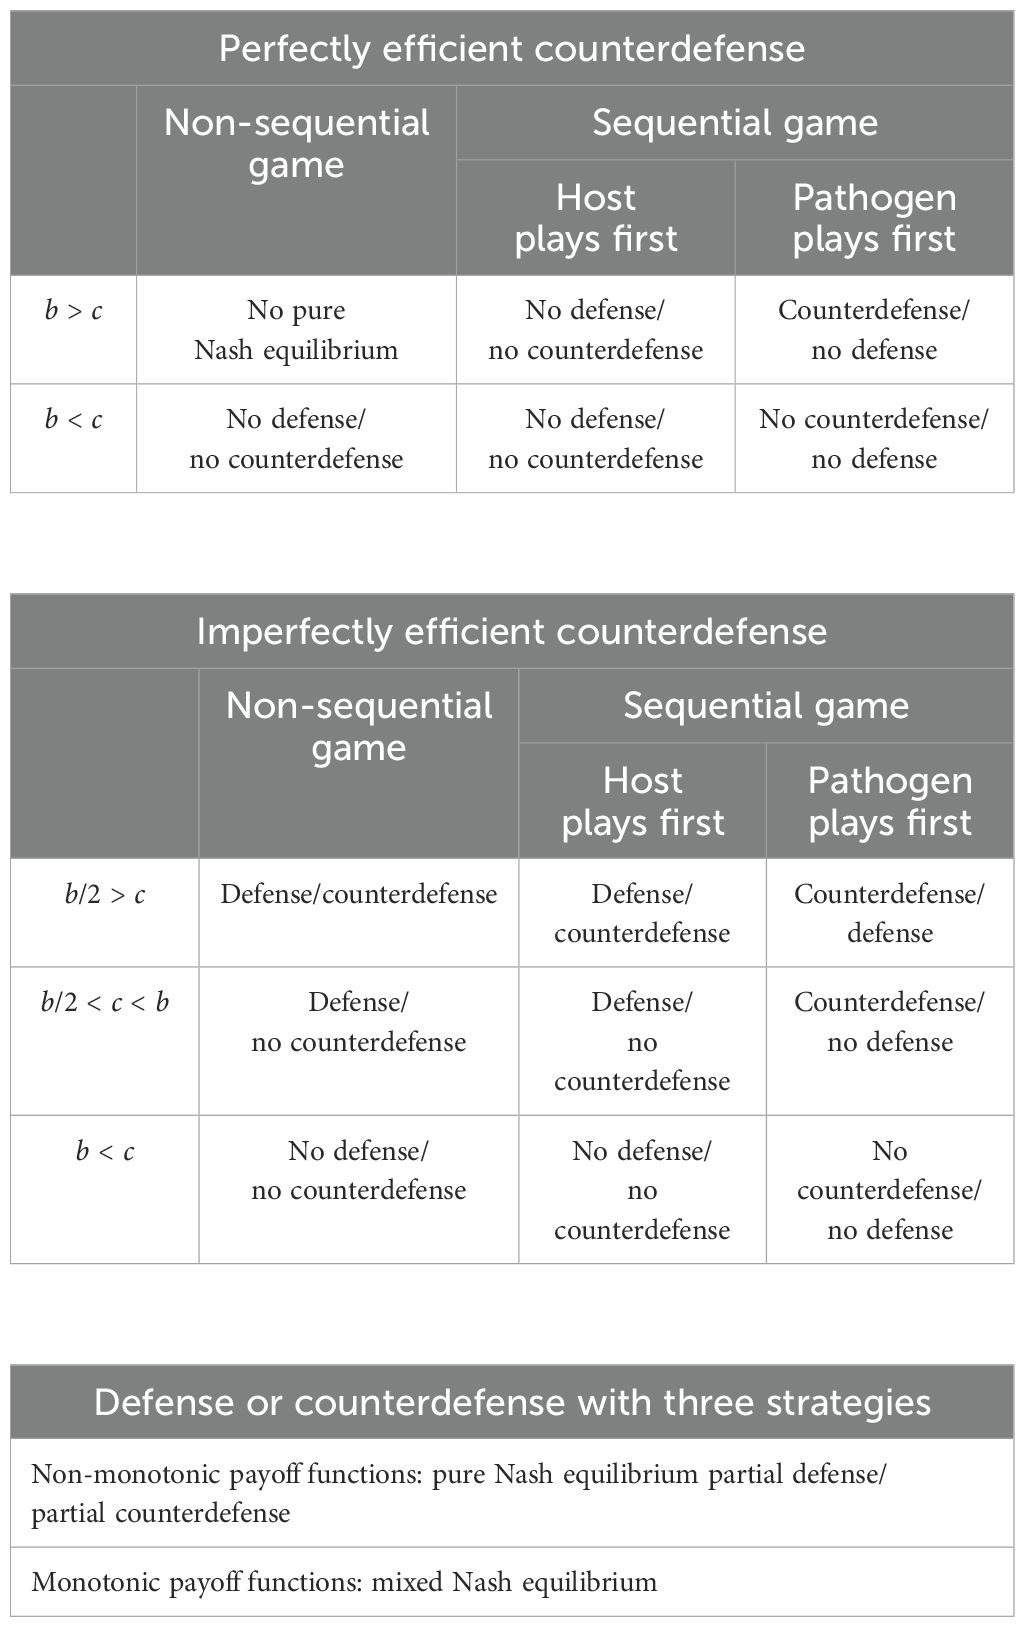
Table 7. Systematic overview of Nash equilibria for the host–pathogen interactions in different cases.
Here, we have analyzed, by a game-theoretical approach, the defense and counterdefense (for example, by chemical substances) among hosts and parasites. We have dealt with the paradox that when the host starts defending against the pathogen to increase its payoff, the pathogen is encouraged to counterdefend against the host to protect itself. If this counterdefense neutralizes the host’s defense, the host can save the cost for it and switch it off. Then, the pathogen can stop its counterdefense to save its cost (Ewald et al., 2020). This may lead to an endless cycle of switching on and off the defense/counterdefense and corresponds to a mixed Nash equilibrium. Such equilibria were also found in a model describing the interaction between pathogenic bacteria and the human host, where the two strategies for either side correspond to the intracellular and extracellular locations (Eswarappa, 2009) and between macrophages and fungal pathogens, where the two strategies for either side are “aggressive” and “peaceful” (Dühring et al., 2017).
Games only having a mixed Nash equilibrium rather than a pure equilibrium include several asymmetric two-strategy games and also several three-strategy games, even if the latter are symmetric. A famous example is the rock-scissors-paper game (Neumann and Schuster, 2007; Gintis, 2009; Garde et al., 2020). An example of a two-strategy game without a pure Nash equilibrium is provided by the “matching pennies game” (Goeree et al., 2003; Gintis, 2009; Tadelis, 2013), as discussed in Section 1. To our knowledge, our results are novel because the generalized matching pennies game is here used to explain chemical–ecological interactions. A related game is “hard love” (Gintis, 2009, section 6.6): A mother supports her son financially if he seeks a job. However, he does not do so if he is supported and enjoys his leisure time instead. Therefore, the mother stops the support, which prompts him to seek a job. The mother is happy and supports him again, and so on.
We determined the Nash equilibria for sequential and non-sequential host–pathogen interactions. First, we only considered two strategies for each player and used normal form games and game trees, as often done in game theory. To avoid that the analysis gets very cumbersome, we used the simplification that the costs are the same for both organisms and that a benefit for the host implies an opposite effect for the pathogen. Our point was to show that two qualitatively different situations can occur: pure or mixed Nash equilibria. If this restriction is relaxed, the structure of Nash equilibria may change, but they would still be pure or mixed.
For the sequential games, we considered both the cases that the pathogen plays first (see Supplementary Material) and that the host plays first. Depending on the case considered, different Nash equilibria have been obtained. In the former case, the Nash equilibrium “No defense/counterdefense” is obtained for certain parameter ranges. This is a counterintuitive result because one may wonder why a counterdefense is beneficial if there is no defense. The reason is that the pathogen safeguards itself against both possible responses by the host. Although it may appear to be unrealistic that the pathogen chooses its strategy first, it can appropriately describe the interplay if the pathogen jumps from one host species to another.
We analyzed the game depending on the benefits and costs as well as on whether the counterdefense is perfect or imperfect. For example, in the case of imperfectly efficient enzymes and high benefit-to-cost ratios, the pure Nash equilibrium “Defense/counterdefense” is obtained. Moreover, we found that host and pathogen can interact without any defense or counterdefense if the costs of producing the toxin and enzyme are higher than the benefit.
Thereafter, we considered a continuous spectrum of strategies for the host and pathogen. This may include the case where evolution changes the chemical structure of the defense chemical or the properties of a degrading enzyme, under the assumption that higher toxicity or efficiency implies higher costs. We simulated the payoffs by a Hill-type dose–response curve (Chou and Talalay, 1984; Gadagkar and Call, 2015; Siemens et al., 2010). Since we have to subtract the costs, which can be assumed to depend linearly on the dose, the payoff can show a maximum for the intermediate strategy for appropriate parameter values (Siemens et al., 2010). A maximum can also occur in the simpler Simms–Rausher cost/benefit model, which is based on a Michaelis–Menten-type function (Simms and Rausher, 1987). Here, however, we use a Hill function because it describes the dose dependence more realistically. Then, we discretized the continuous spectrum of strategies by considering three possible actions and used normal form games. We obtained “partial (counter)defense” strategies as the pure Nash equilibrium, which implies that permanently producing a moderate amount of toxin and enzyme rather than a cyclic switching on and off is the best choice for the organisms. To obtain this result, it is important to consider (at least) three strategies here.
The abovementioned result that in certain parameter ranges, neither a defense nor a counterdefense occurs, is an idealization based on the binary discretization. The immune response is indeed often very costly so that a trade-off with the pathogen has to be reached (Zuk and Stoehr, 2002). Earlier, it was shown by a game-theoretical model assuming a non-sequential game that pathogens are sometimes tolerated (Renaud and De Meeüs, 1991). However, such trade-offs usually include a certain (possibly low) extent of defense and counterdefense. This can be modeled adequately by the three-strategy game. The explanation of “partial (counter)defense” is likely to have a very broad importance for antagonistic interactions beyond chemical defense. Trade-offs (e.g., between resistance and tolerance) in which a submaximal effort is invested by either side are very relevant in evolution (Renaud and De Meeüs, 1991; Zuk and Stoehr, 2002; Pink et al., 2011; Wen et al., 2012; Brunke and Hube, 2013; Bullard et al., 2022; Halloway et al., 2022).
It is worth comparing that result with the outcome for the case where the dose–payoff curve (i.e., response minus cost) is monotonic. In the latter case, a strategy in an extreme situation (e.g., no defense or full defense) is chosen since a strategy with a higher payoff dominates a strategy with a lower payoff. The three-strategy game can then be simplified to a two-strategy game, which we have treated in the first part of the paper. This may lead to mixed Nash equilibria. Thus, the way the abovementioned paradox is resolved depends on several conditions and parameters. In particular, it is relevant whether the counterdefense is very efficient, whether the game is sequential or non-sequential, whether the costs exceed the benefit, and whether the dose–payoff curves are monotonic. The choice of payoff values may look quite arbitrary. However, payoff matrices can be scaled by adding a constant and by multiplying all payoffs by the same positive factor without changing the pure Nash equilibria. Thus, for these equilibria, only the order relations among the payoffs matter (Hofbauer and Sigmund, 1998; Gintis, 2009).
Mixed Nash equilibria can have different biological implications. Either, a cyclic behavior occurs in that defense and no defense alternate on evolutionary time scales. Silent genes (pseudogenes) may be an evolutionary remnant of another strategy used earlier (Pink et al., 2011; Wen et al., 2012). As discussed above, another option is that both players only produce a certain percentage of the maximum amount of defense and counterdefense, respectively. It is interesting that a model using two discrete strategies for either player points, in the mixed Nash equilibrium, to a third possible strategy. A further possible interpretation is that some hosts use a (full) defense while others do not (and analogously some pathogens use or do not use a counterdefense) and they stay with their strategy. This might explain why some host species use a strong defense while other species do not.
For example, it is interesting that some bacteria, such as Salmonella species, produce ß-lactamases, while others, such as Streptococcus pneumoniae, do not (Hakenbeck et al., 1999). Our results suggest that the ß-lactamase-producing species evolved under conditions where such a counterdefense is an appropriate strategy, which corresponds to the Nash equilibrium defense/counterdefense, while the other bacteria evolved under conditions favoring the Nash equilibrium defense/no counterdefense. Another explanation is that the behavior of the different species corresponds to different points in the cycle of a mixed Nash equilibrium.
In our paper, we used the classical Nash approach to game theory, which leads to new interesting insights. Such an approach was used in analyzing host–pathogen interactions earlier (Eswarappa, 2009; Tyc et al., 2014; Pollmächer et al., 2016; Dühring et al., 2017; Sharebiani et al., 2021). Another approach is based on the concept of evolutionarily stable strategies, which allows one to study the fate of a rare mutant with a new strategy (Maynard Smith, 1982; Hofbauer and Sigmund, 1998). However, that concept in its basic form is only applicable to symmetric games, although extensions to asymmetric situations were proposed (Hofbauer and Sigmund, 1998; Gintis, 2009). Importantly, every evolutionarily stable strategy corresponds to a Nash equilibrium but not necessarily vice versa. To check whether the mixed Nash equilibrium found above is evolutionarily stable, we refined the model to a three-strategy game and determined the payoffs using a dose–response curve.
Defense and counterdefense also occur in plant–herbivore and fungus–fungivore interactions (Szabo, 2015; Cavalcante et al., 2018; Blei et al., 2020; Malaca et al., 2020). Many plants such as Diplopterys cabrerana (Szabo, 2015), Psychotria viridis (Szabo, 2015; Cavalcante et al., 2018), Mimosa tenuiflora (Malaca et al., 2020), and also the fungal genus Psilocybe (Blei et al., 2020; Malaca et al., 2020) synthesize tryptamine compounds as defense chemicals. Higher animals produce, mainly in the brain, monoamine oxidase, which degrades tryptamines (Szabo, 2015; Blei et al., 2020; Malaca et al., 2020). It is worth extending the present model to plant–herbivore interactions. However, additional aspects should then be considered such as taste preferences, aversion and optimal foraging of herbivores, switch between plant individuals, and different turnover rates of toxins. Moreover, it is relevant whether only one plant species produces a toxin against only one herbivore species, which responds by an enzyme, or against several species (see the corresponding simplification in Section 2). If one specialist herbivore species comes up with a degrading enzyme, the toxin may still be useful against other herbivores.
In accordance with our prediction that depending on conditions, defense or no defense is the better option, it is worth mentioning that for some plant species, different varieties differ in their production of toxins. For example, the subspecies Cannabis sativa produces higher amounts of tetrahydrocannabinol than the subspecies Cannabis indica (Atakan, 2012). The rowan plant (Sorbus aucuparia) produces parasorbic acid, which irritates the gastric mucosa in humans. A variety of this plant, called Sorbus aucuparia var. moravica, has a lower amount of parasorbic acid and, thus, can be eaten raw (Mlcek et al., 2014).
To determine the stability of the obtained equilibria and to distinguish the different interpretations of the mixed Nash equilibrium, ordinary differential equations (ODEs) such as replicator equations (Hofbauer and Sigmund, 1998), adaptive dynamics (McGill and Brown, 2007; Allen et al., 2013; Cressman and Tao, 2014), or Lotka–Volterra equations (Hofbauer and Sigmund, 1998; Neumann and Schuster, 2007) are worth being used in future extensions of the model. Indeed, as an alternative to game theory, the interplay between defense and counterdefense is sometimes described quantitatively by ODEs (Lang et al., 2019; Schuster et al., 2019).
Both approaches have their pros and cons. The ODE approach can describe the time course but it needs a higher number of parameter values. It is very useful in distinguishing between oscillations in strategies and use of strategies with certain probabilities. For example, the time course in the rock-scissors-paper game can be simulated (Neumann and Schuster, 2007; Garde et al., 2020). If the oscillations are damped, they tend to an asymptotically stable state. Then, the two interpretations of the mixed Nash equilibrium in terms of oscillations and in terms of (asymptotically) stationary frequencies of strategies in the population are in line with each other.
Game theory has the advantage of having a much wider scope because the concrete nature and details of interactions do not matter that much. Here, we used the situation of a toxin and an enzyme degrading that as the paradigm. However, the game-theoretical analysis is more general. It applies whenever an organism uses a perfect or imperfect counterdefense against the defense of another organism and the net payoffs can be quantified for both.
An interesting question is whether information exchange between the players is allowed. As outlined in Section 1, we here use an interpretation in terms of populations, in which the equilibrium is found by natural selection without the necessity that the organisms have cognitive capabilities. Nevertheless, it will be interesting to shed light on the role of communication because many microorganisms can sense effector molecules produced by other organisms (Shapiro, 2007; Papenfort and Bassler, 2016; Grainha et al., 2020) and there is even cross-talk between pathogens and the human immune system (Bullard et al., 2022).
The present analysis bears manifold potential applications in fighting pathogens. A major problem in clinical treatments of bacterial infections is the increasing resistance due to, for example, ß-lactamases. Possible extensions to our model are to consider enzymatic pathways rather than single enzymes or to include the effect of counter-counterdefenses (Dühring et al., 2015; Schuster et al., 2019) into the payoff matrices.
A further biological example of defense and counterdefense is RNA silencing by plants against the bacterial or viral pathogens and action of suppressors of that process (Burgyán, 2008; Pumplin and Voinnet, 2013). To some extent, our model can be used to describe this as well. However, more features should then be considered, such as the arms race between changes in RNA sequence and evolution of the specific silencers (Burgyán, 2008; Pumplin and Voinnet, 2013). A promising application of our study concerns the evolution of drug resistance. For example, Plasmodium falciparum, the causative agent of malaria, keeps evolving resistance to pharmaceuticals such as chloroquine (Hecht and Fogel, 2012). The two strategies of the patient would be to take or not to take the drug, while the two strategies of P. falciparum are to evolve or not to evolve resistance. Obviously, this is related to a matching pennies game.
The original contributions presented in the study are included in the article/Supplementary Material. Further inquiries can be directed to the corresponding author.
SD: Conceptualization, Formal analysis, Investigation, Methodology, Validation, Visualization, Writing – original draft, Writing – review & editing. SS: Conceptualization, Funding acquisition, Methodology, Project administration, Supervision, Validation, Writing – original draft, Writing – review & editing. RG: Conceptualization, Formal analysis, Writing – review & editing.
The authors declare financial support was received for the research, authorship, and/or publication of this article. Financial support by the Carl-Zeiss-Stiftung in the Jena School of Microbial Communication (to SD), the Max Planck Society through the IMPRS “Exploration of Ecological Interactions with Molecular and Chemical Techniques” (to RG), and the German Research Foundation (DFG) through the TR 124 “FungiNet”, project numbers 210879364 and 512648189, as well as the Publication Fund of the Thueringer Universitaets- und Landesbibliothek is gratefully acknowledged.
The authors would like to thank Jan Ewald (Leipzig), Rosalind Allen and Suman Chakraborty (Jena), and Christian Kost and Leonardo Oña (Osnabrück) as well as Gary Fogel (San Diego) for stimulating discussions.
The authors declare that the research was conducted in the absence of any commercial or financial relationships that could be construed as a potential conflict of interest.
All claims expressed in this article are solely those of the authors and do not necessarily represent those of their affiliated organizations, or those of the publisher, the editors and the reviewers. Any product that may be evaluated in this article, or claim that may be made by its manufacturer, is not guaranteed or endorsed by the publisher.
The Supplementary Material for this article can be found online at: https://www.frontiersin.org/articles/10.3389/fevo.2024.1379868/full#supplementary-material
Allen B., Nowak M. A., Dieckmann U. (2013). Adaptive dynamics with interaction structure. Am. Naturalist 181, E139–E163. doi: 10.1086/670192
Alpern S., Gal S., Lee V., Casas J. (2019). A stochastic game model of searching predators and hiding prey. J. R. Soc Interface 16, 20190087. doi: 10.1098/rsif.2019.0087
Atakan Z. (2012). Cannabis, a complex plant: different compounds and different effects on individuals. Ther. Adv. Psychopharmacol. 2, 241–254. doi: 10.1177/2045125312457586
Bauer A. L., Beauchemin C. A., Perelson A. S. (2009). Agent-based modeling of host-pathogen systems: the successes and challenges. Inf. Sci. 179, 1379–1389. doi: 10.1016/j.ins.2008.11.012
Blei F., Dörner S., Fricke J., Baldeweg F., Trottmann F., Komor A. (2020). Simultaneous production of psilocybin and a cocktail of β-carboline monoamine oxidase inhibitors in “magic” mushrooms. Chem. Eur. 26, 729–734. doi: 10.1002/chem.201904363
Brunke S., Hube B. (2013). Two unlike cousins: Candida albicans and C. glabrata infection strategies. Cell Microbiol. 15, 701–708. doi: 10.1111/cmi.12091
Bullard B. M., VanderVeen B. N., McDonald S. J., Cardaci T. D., Murphy E. A. (2022). Cross talk between the gut microbiome and host immune response in ulcerative colitis: nonpharmacological strategies to improve homeostasis. Am. J. Physiol. Gastrointest. Liver Physiol. 323, G554–G561. doi: 10.1152/ajpgi.00210.2022
Burgyán J. (2008). “Role of silencing suppressor proteins. Chapter 5,” in Plant virology protocols. Eds. Foster G. D., Johansen I. E., Hong Y., Nagy P. D. (Humana Press, Totowa (NJ).
Calderone R. A., Fonzi W. A. (2001). Virulence factors of Candida albicans. Trends Microbiol. 9, 327–335. doi: 10.1016/s0966-842x(01)02094-7
Carlisle M. D., Srikantha R. N., Brogden K. A. (2009). Degradation of human α- and β-defensins by culture supernatants of Porphyromonas gingivalis strain 381. J. Innate Immun. 1, 118–122. doi: 10.1159/000181015
Cavalcante A. D., Cardoso G. A., Oliveira F. L., Bearzoti E., Okuma A. A., Duarte L. P., et al. (2018). Influence of environmental factors and cultural methods on the content of n,n-dimethyltryptamine in Psychotria viridis (Rubiaceae). J. Braz. Chem. Soc 29, 1245–1255. doi: 10.21577/0103-5053.20170221
Chou T. C., Talalay P. (1984). Quantitative analysis of dose-effect relationships: The combined effects of multiple drugs or enzyme inhibitors. Adv. Enzyme Regul. 22, 27–55. doi: 10.1016/0065-2571(84)90007-4
Cressman R., Tao Y. (2014). The replicator equation and other game dynamics. PNAS 111, 10810–10817. doi: 10.1073/pnas.1400823111
Drawz S. M., Bonomo R. A. (2010). Three decades of beta-lactamase inhibitors. Clin. Microbiol. Rev. 23, 160–201. doi: 10.1128/CMR.00037-09
Dühring S., Ewald J., Germerodt S., Kaleta C., Dandekar T., Schuster S. (2017). Modelling the host–pathogen interactions of macrophages and Candida albicans using game theory and dynamic optimization. J. R. Soc. Interface 14, 20170095. doi: 10.1098/rsif.2017.0095
Dühring S., Germerodt S., Skerka C., Zipfel P. F., Dandekar T., Schuster S. (2015). Host-pathogen interactions between the human innate immune system and Candida albicans - Understanding and modeling defense and evasion strategies. Front. Microbiol. 6, 625. doi: 10.3389/fmicb.2015.00625
Eswarappa S. M. (2009). Location of pathogenic bacteria during persistent infections: insights from an analysis using game theory. PloS One 4, e5383. doi: 10.1371/journal.pone.0005383
Ewald J., Sieber P., Garde R., Lang S. N., Schuster S., Ibrahim B. (2020). Trends in mathematical modeling of host-pathogen interactions. Cell Mol. Life Sci. 77, 467–480. doi: 10.1007/s00018-019-03382-0
Friedman D., Zhao S. (2021). When are mixed equilibria relevant? J. Econ. Behav. Organ. 191, 51–65. doi: 10.1016/j.jebo.2021.08.031
Frohner I. E., Bourgeois C., Yatsyk K., Majer O., Kuchler K. (2009). Candida albicans cell surface superoxide dismutases degrade host-derived reactive oxygen species to escape innate immune surveillance. Mol. Microbiol. 71, 240–252. doi: 10.1111/j.1365-2958.2008.06528.x
Gadagkar S. R., Call G. B. (2015). Computational tools for fitting the Hill equation to dose-response curves. J. Pharmacol. Toxicol. Meth. 71, 68–76. doi: 10.1016/j.vascn.2014.08.006
Garde R., Ewald J., Kovács Á. T., Schuster S. (2020). Modelling population dynamics in a unicellular social organism community using a minimal model and evolutionary game theory. Open Biol. 10, 200206. doi: 10.1098/rsob.200206
Goeree J. K., Holt C. A., Palfrey T. R. (2003). Risk averse behavior in generalized matching pennies games. Games Econ. Behav. 45, 97–113. doi: 10.1016/S0899-8256(03)00052-6
Grainha T., Jorge P., Alves D., Lopes S. P., Pereira M. O. (2020). Unraveling Pseudomonas aeruginosa and Candida albicans communication in coinfection scenarios: Insights through network analysis. Front. Cell. Infect. Microbiol. 10, 550505. doi: 10.3389/fcimb.2020.550505
Hakenbeck R., Grebe T., Zähner D., Stock J. B. (1999). Beta-lactam resistance in Streptococcus pneumoniae: penicillin-binding proteins and non-penicillin-binding proteins. Mol. Microbiol. 33, 673–678. doi: 10.1046/j.1365-2958.1999.01521.x
Halloway A. H., Heath K. D., McNickle G. G. (2022). When does mutualism offer a competitive advantage? A game-theoretic analysis of host-host competition in mutualism. AoB Plants 14, plac010. doi: 10.1093/aobpla/plac010
Hecht D., Fogel G. B. (2012). Modeling the evolution of drug resistance in malaria. J. Comput. Aided Mol. Des. 26, 1343–1353. doi: 10.1007/s10822-012-9618-2
Hofbauer J., Sigmund K. (1998). Evolutionary games and population dynamics (Cambridge: Cambridge University Press).
Hummert S., Bohl K., Basanta D., Deutsch A., Werner S., Theißen G., et al. (2014). Evolutionary game theory: cells as players. Mol. Biosyst. 10, 3044–3065. doi: 10.1039/c3mb70602h
Hummert S., Hummert C., Schröter A., Hube B., Schuster S. (2010). Game theoretical modelling of survival strategies of Candida albicans inside macrophages. J. Theor. Biol. 264, 312–318. doi: 10.1016/j.jtbi.2010.01.022
Javarone M. A. (2018). The host-pathogen game: an evolutionary approach to biological competitions. Front. Phys. 6, 94. doi: 10.3389/fphy.2018.00094
Lang S. N., Germerodt S., Glock C., Skerka C., Zipfel P. F., Schuster S. (2019). Molecular crypsis by pathogenic fungi using human factor H. A numerical model. PloS One 14, e0212187. doi: 10.1371/journal.pone.0212187
Mackel J. J., Steele C. (2019). Host defense mechanisms against Aspergillus fumigatus lung colonization and invasion. Curr. Opin. Microbiol. 52, 14–19. doi: 10.1016/j.mib.2019.04.003
Malaca S., Faro A. F. L., Tamborra A., Pichini S., Busardò F. P., Huestis M. A. (2020). Toxicology and analysis of psychoactive tryptamines. Int. J. Mol. Sci. 21, 9279. doi: 10.3390/ijms21239279
Maynard Smith J. (1982). Evolution and the theory of games (Cambridge: Cambridge University Press). doi: 10.1017/CBO9780511806292
McGill B. J., Brown J. S. (2007). Evolutionary game theory and adaptive dynamics of continuous traits. Annu. Rev. Ecol. Evol. Syst. 38, 403–435. doi: 10.1146/annurev.ecolsys.36.091704.175517
Mlcek J., Rop O., Jurikova T., Sochor J., Fisera M., Balla S., et al. (2014). Bioactive compounds in sweet rowanberry fruits of interspecific Rowan crosses. Cent. Eur. J. Biol. 9, 1078–1086. doi: 10.2478/s11535-014-0336-8
Neumann G., Schuster S. (2007). Continuous model for the rock-scissors-paper game between bacteriocin producing bacteria. J. Math. Biol. 54, 815–846. doi: 10.1007/s00285-006-0065-3
Papenfort K., Bassler B. (2016). Quorum sensing signal–response systems in Gram-negative bacteria. Nat. Rev. Microbiol. 14, 576–588. doi: 10.1038/nrmicro.2016.89
Park H. J., Wang W., Curlango-Rivera G., Xiong Z., Lin Z., Huskey D. A., et al. (2019). A DNase from a fungal phytopathogen is a virulence factor likely deployed as counter defense against host-secreted extracellular DNA. MBio 10, e02805-18. doi: 10.1128/mBio.02805-18
Pink R. C., Wicks K., Caley D. P., Punch E. K., Jacobs L., Carter D. R. F. (2011). Pseudogenes: Pseudo-functional or key regulators in health and disease? RNA 17, 792–798. doi: 10.1261/rna.2658311
Pollmächer J., Timme S., Schuster S., Brakhage A. A., Zipfel P. F., Figge M. T. (2016). Deciphering the counterplay of Aspergillus fumigatus infection and host inflammation by evolutionary games on graphs. Sci. Rep. 6, 27807. doi: 10.1038/srep27807
Pumplin N., Voinnet O. (2013). RNA silencing suppression by plant pathogens: defence, counter-defence and counter-counter-defence. Nat. Rev. Microbiol. 11, 745–760. doi: 10.1038/nrmicro3120
Renaud F., De Meeüs T. (1991). A simple model of host-parasite evolutionary relationships. parasitism: compromise or conflict? J. Theor. Biol. 152, 319–327. doi: 10.1016/s0022-5193(05)80197-3
Sanabria F., Thrailkill E. (2009). Pigeons (Columba livia) approach Nash equilibrium in experimental matching pennies competitions. J. Exp. Anal. Behav. 91, 169–183. doi: 10.1901/jeab.2009.91-169
Sasikaran J., Ziemski M., Zadora P. K., Fleig A., Berg I. A. (2014). Bacterial itaconate degradation promotes pathogenicity. Nat. Chem. Biol. 10, 371–377. doi: 10.1038/nchembio.1482
Schleicher J., Conrad T., Gustafsson M., Cedersund G., Guthke R., Linde J. (2017). Facing the challenges of multiscale modelling of bacterial and fungal pathogen-host interactions. Brief Funct. Genomics 16, 57–69. doi: 10.1093/bfgp/elv064
Schuster S., Ewald J., Dandekar T., Dühring S. (2019). Optimizing defence, counter-defence and counter-counter defence in parasitic and trophic interactions - A modelling study. ArXiv:1907.04820. doi: 10.48550/arXiv.1907.04820
Segel L. A. (1980). Mathematical models in molecular and cellular biology (Cambridge, UK: Cambridge University Press).
Shapiro J. A. (2007). Bacteria are small but not stupid: cognition, natural genetic engineering and socio-bacteriology. Stud. Hist. Phil. Biol. Biomed. Sci. 38, 807–819. doi: 10.1016/j.shpsc.2007.09.010
Sharebiani H., Hajimiri S., Abbasnia S., Soleimanpour S., Hashem Asnaashari A. M., Valizadeh N., et al. (2021). Game theory applications in host-microbe interactions toward disease manifestation: Mycobacterium tuberculosis infection as an example. Iran J. Basic Med. Sci. 24, 1324–1335. doi: 10.22038/IJBMS.2021.55471.12410
Siemens D. H., Keck A. G., Ziegenbein S. (2010). Optimal defense in plants: assessment of resource allocation costs. Evol. Ecol. 24, 1291–1305. doi: 10.1007/s10682-010-9374-5
Simms E. L., Rausher M. D. (1987). Costs and benefits of plant resistance to herbivory. Am. Nat. 130, 570–581. doi: 10.1086/284731
Srikant S., Guegler C. K., Laub M. T. (2022). The evolution of a counter-defense mechanism in a virus constrains its host range. Elife. 11, e79549. doi: 10.7554/eLife.79549
Szabo A. (2015). Psychedelics and immunomodulation: novel approaches and therapeutic opportunities. Front. Immunol. 6. doi: 10.3389/fimmu.2015.00358
Tyc K. M., Kühn C., Wilson D., Klipp E. (2014). Assessing the advantage of morphological changes in Candida albicans: a game theoretical study. Front. Microbiol. 5. doi: 10.3389/fmicb.2014.00041
Wen Y. Z., Zheng L. L., Qu L. H., Ayala F. J., Lun Z. R. (2012). Pseudogenes are not pseudo any more. RNA Biol. 9, 27–32. doi: 10.4161/rna.9.1.18277
Wu A., Ross D. (2016). Evolutionary game between commensal and pathogenic microbes in intestinal microbiota. Games 7, 26. doi: 10.3390/g7030026
Zhang D. Y., Jiang X. H. (2006). Interactive effects of habitat productivity and herbivore pressure on the evolution of anti-herbivore defense in invasive plant populations. J. Theor. Biol. 242, 935–940. doi: 10.1016/j.jtbi.2006.05.016
Keywords: counterdefense, defense chemical, game theory, game tree, host–pathogen interactions, matching pennies game, Nash equilibrium
Citation: Dwivedi S, Garde R and Schuster S (2025) How hosts and pathogens choose the strengths of defense and counterdefense: a game-theoretical view. Front. Ecol. Evol. 12:1379868. doi: 10.3389/fevo.2024.1379868
Received: 31 January 2024; Accepted: 10 December 2024;
Published: 30 January 2025.
Edited by:
Tobias L. Lenz, University of Hamburg, GermanyReviewed by:
Vandana Venkateswaran, Henry Ford Health System, United StatesCopyright © 2025 Dwivedi, Garde and Schuster. This is an open-access article distributed under the terms of the Creative Commons Attribution License (CC BY). The use, distribution or reproduction in other forums is permitted, provided the original author(s) and the copyright owner(s) are credited and that the original publication in this journal is cited, in accordance with accepted academic practice. No use, distribution or reproduction is permitted which does not comply with these terms.
*Correspondence: Stefan Schuster, c3RlZmFuLnNjaHVAdW5pLWplbmEuZGU=
†Present address: Ravindra Garde, Braunschweig Integrated Centre of Systems Biology, Helmholtz Centre for Infection Research, Braunschweig, Germany
Disclaimer: All claims expressed in this article are solely those of the authors and do not necessarily represent those of their affiliated organizations, or those of the publisher, the editors and the reviewers. Any product that may be evaluated in this article or claim that may be made by its manufacturer is not guaranteed or endorsed by the publisher.
Research integrity at Frontiers
Learn more about the work of our research integrity team to safeguard the quality of each article we publish.