 Weiping Shen
 Yuhao Jin*
95% of researchers rate our articles as excellent or good
Learn more about the work of our research integrity team to safeguard the quality of each article we publish.
Find out more
ORIGINAL RESEARCH article
Front. Ecol. Evol. , 03 November 2023
Sec. Environmental Informatics and Remote Sensing
Volume 11 - 2023 | https://doi.org/10.3389/fevo.2023.1283281
This article is part of the Research Topic Remote Sensing for Environmental Monitoring View all 13 articles
Typhoon rain events are important factors that trigger changes in dissolved oxygen concentrations in watersheds. The direction of the typhoon driving force is clear, but the mode of action and mechanism are complex. Moreover, quantifying the relationship between these actions and dissolved oxygen is challenging. This study collected measured data from water quality monitoring and remote sensing during the 2022 typhoon rain events. By analyzing the changes in typhoon driving factors and dissolved oxygen (DO) concentrations in water under various typhoon storms, extended MOORA plus the full multiplicative form (MULTIMOORA), Multiscale Geographic Weighted Regression (MGWR), and spatial autocorrelation analysis were used to evaluate the response of DO concentration. Furthermore, the effects of the atmospheric environment under the influence of human activities on the response distribution of the urban water environment were analyzed. The results of the study showed that under the effect of a typhoon with higher rainfall intensity, the response of DO concentration in the water body of the river in the center of the city was better. However, the response of DO concentration in the water body at the mouth of the sea had a tendency to become worse. Under the influence of typhoon rain events with smaller intensity, the scouring effect of rainwater dominated, and the DO concentration response in the water body had a tendency to become worse. The analysis of spatial heterogeneity under the influence of human activities showed that the ranking values of DO concentration response in rivers in the city area of Zhongshan, under the influence of typhoon rain events, were positively correlated with the distribution of ozone (O3) concentration and sulfur dioxide (SO2) concentration in the eastern, central, and western parts of Zhongshan. Conversely, it was negatively correlated with the distribution of O3 concentration and SO2 concentration in the northern and southern parts of Zhongshan. Based on the research results, we constructed a technique to evaluate the response of dissolved oxygen concentration during the typhoon transit period, which can provide an indicator reference for urban managers in water environment management.
Water environmental pollution has become one of the three major water problems in cities because urbanization has changed the conditions for the formation of surface and subsurface runoff, affecting the water cycle as well as the spatial and temporal distribution of water (Qi-ting et al., 2005). Deterioration of water quality, reduction of water quantity, and degradation of water ecology are important impediments to the sustainable development of urbanization (Yu et al., 2018). Studies have shown that nonpoint source pollutants from typhoon rain events are one of the major pollutants in urban surface water and have serious impacts on surface water quality (Fu et al., 2021). Under the subtropical oceanic monsoon climate, an average of seven typhoons land and affect the Greater Bay Area every year, with high intensity and frequency. These typhoons not only cause serious casualties and economic losses but also have a significant impact on the urban water environment conditions (Liu et al., 2009; Chen et al., 2020; Cui et al., 2022). Water scarcity and deterioration of water quality pose threats to human health and survival, making them major challenges for existing freshwater resources (Mishra et al., 2021). In order to achieve the United Nations 2030 Sustainable Development Goals (SDGs) and to deepen the understanding and management of water security, it is exploratory and valuable to assess the risk of the water environment. Multi-criteria decision analysis (MCDA) is one of the most widely used methods in the environmental decision-making process (Mardani et al., 2017).
Globally, environmental risk assessment is an effective measure to prevent and control environmental events. Typhoon rain events have received attention from researchers as an important causative factor in triggering environmental events (Han et al., 2019). Liang Huanhuan et al. (2016) conducted a hierarchical study on the risk of groundwater contamination at 37 hazardous waste landfills using the MCDA model based on the idea of contamination source-pathway-receptor risk throughout the whole process control. Cabrera and Lee (2019) used multi-criteria decision analysis to assess typhoon-induced flood-prone risk areas in Davao Oriental, Philippines, by integrating various indicators such as rainfall and elevation. The role of hierarchical analysis (AHP) as well as ratio weighting (RW) in determining indicator weights was also compared, and the AHP model was found to perform better in calculating the importance of indicators. Gao et al. (2020) combined the spatial analysis method of AHP and geographic information system (GIS) to conduct a comprehensive weighted risk assessment based on the spatial and temporal cumulative patterns of typhoon-induced flooding disasters in Guangdong Province as the research object. Guangdong Province was classified into six levels of risk zones based on the integrated typhoon disaster risk, and the indirect economic impacts were further analyzed on this basis. Wang et al. (2022) synthesized the risk, exposure, and vulnerability of three typhoon hazard chains, constructed a comprehensive typhoon hazard risk indicator for the Greater Bay Area, divided the risk level of typhoon hazard chains in important towns and cities as well as the comprehensive risk level, and verified the validity of the assessment methodology of the comprehensive risk indicator for typhoon hazards. In multi-attribute decision analysis, MULTIMOORA method has simple calculation, short time and strong robustness, and is widely used in process selection (Lixia et al., 2020; Qiong et al., 2021; Lei et al., 2022), location selection (Yuan-hua et al., 2023), risk assessment (Shenghua et al., 2019; Zhang et al., 2022) and other fields(Hafezalkotob et al., 2019).
DO concentration in water bodies plays a crucial role in the survival of aquatic organisms as well as the balanced development of ecosystems, and is one of the important indicators for evaluating the quality of the water environment (Songbai et al., 2017; Espinosa-Diaz et al., 2021). Under the influence of typhoon rain events, nitrogen dioxide (NO2), organic particulate matter, and other pollutants generated by human activities will be diluted by rainwater into the water environment, which affects the dissolved oxygen concentration of the water body under the effect of eutrophication and mineralization of organic particulate matter (Xiu-qin et al., 2019; Yufeng et al., 2023). Some scholars have conducted research on the potential influence mechanism between temperature, wind speed, rainfall, and DO concentration, and concluded that there is a positive correlation between DO concentration and temperature, wind speed, and rainfall (Xiaoran et al., 2013; Chen et al., 2016). Huang Weihui et al. (2021) and Huang Yuling et al. (2022) studied the natural factors such as geographical conditions on the concentration of saturated dissolved oxygen, and concluded that the concentration of dissolved oxygen was greatly affected by altitude and barometric pressure. In 2019, Jiayang Zhang (Zhang and Chen, 2019) assessed the risk of flooding disaster caused by typhoon rainstorms, and their evaluation indexes included wind speed, rainfall, and elevation. Ji-Myong Kim et al. (2020) selected maximum wind speed and distance as evaluation indicators in the vulnerability analysis of typhoons in Korea. Therefore, in this study, DEM, total rainfall, maximum rainfall in a single day, distance from typhoon landfall, and atmospheric PM2.5 concentration and NO2 concentration were comprehensively selected as evaluation indicators.
The process of urbanization is the transformation of rural territories into urban territories, involving the reshaping of natural landscapes, and it represents the most significant manifestation of human activities affecting hydrological systems (Liu et al., 2004). Nutrient export due to human activities has become a major cause of eutrophication and other ecological hazards in water bodies (Howarth, 2008; Howarth et al., 2011). Nutrient export due to human activities has become a major cause of eutrophication and other ecological hazards in water bodies. To comprehensively consider the source of non-point source pollution from human activities, Miao Jin-Dian et al. (2021) used NANI and NAPA models to analyze the spatial and temporal variation characteristics and driving factors of nitrogen and phosphorus in the Hangzhou section of the Qiandao Lake Basin. Fan Hongxiang et al. (2021) investigated the extent of the contribution of human activities to the change of water age in the lake area of Poyang Lake by coupling a deep learning network and a traditional two-dimensional hydrodynamic model. Yisong Zhao et al. (2022) took Dianchi Lake as the research object and discussed the response of surface temperature and lake surface temperature under the influence of human activities. Therefore, it is informative for this study to discuss the effects of anthropogenic O3 concentration and SO2 concentration on the distribution of DO concentration response in urban waters under typhoon rain events.
Scholars at home and abroad have mostly conducted research on typhoon disaster risk assessment with the purpose of considering the economy and safety (Chaojia et al., 2022). However, relatively few typhoon disaster risk assessments have been carried out from the perspective of river water quality indicators, and there have been limited studies on the DO response of urban waters under the influence of human activities. In this paper, based on the measured data of urban water bodies during the 2022 typhoon rain events and remote sensing image data, the extended MULTIMOORA method is used to establish the correlation between typhoon drivers and the response of DO concentration in urban water bodies. Furthermore, this study aims to assess and quantify the distribution of the DO concentration response in urban water bodies. The MGWR model and spatial autocorrelation analysis were used to analyze the effects of O3 concentration and SO2 concentration generated under the influence of human activities on the distribution of urban water environment response. The results of the study will contribute to a more intuitive and in-depth understanding of the effects of typhoon rain events, as well as human activities, on the distribution of DO concentration response in urban waters. Local government decision-makers can formulate more effective water environmental protection policies and disaster prevention and mitigation measures based on the results of this study.
The Guangdong-Hong Kong-Macao Greater Bay Area is located in the lower reaches of the Pearl River Basin, surrounded by mountains to the east, west, and north, and directly facing the South China Sea. It has a well-developed regional economy as well as a very high population density (Zhilin et al., 2022). Zhongshan is located in the heart of the Guangdong-Hong Kong-Macao Greater Bay Area, between latitude 22° 11’– 22° 47’ north and longitude 113° 09’– 113° 46’ east, with a total area of 1,783.67 km2. The city’s topography is dominated by plains, which are high in the middle and flat around the perimeter, with the plains sloping from northwest to southeast. Zhongshan City is located in the subtropical monsoon climate, abundant rainfall, the annual average rainfall is 1886 mm, the annual average inbound and transit water volume is 2662.94 billion m3 and 2678.92 billion m3 respectively. The disaster weather suffered by Zhongshan City mainly includes typhoons, heavy rainfall and strong convection, with high rainfall and intensity. Overall, the capacity of Zhongshan City to cope with emergencies such as pollution accidents and water quality-type water shortage conditions is relatively insufficient (Xuehua et al., 2022). The study area is shown in Figure 1.
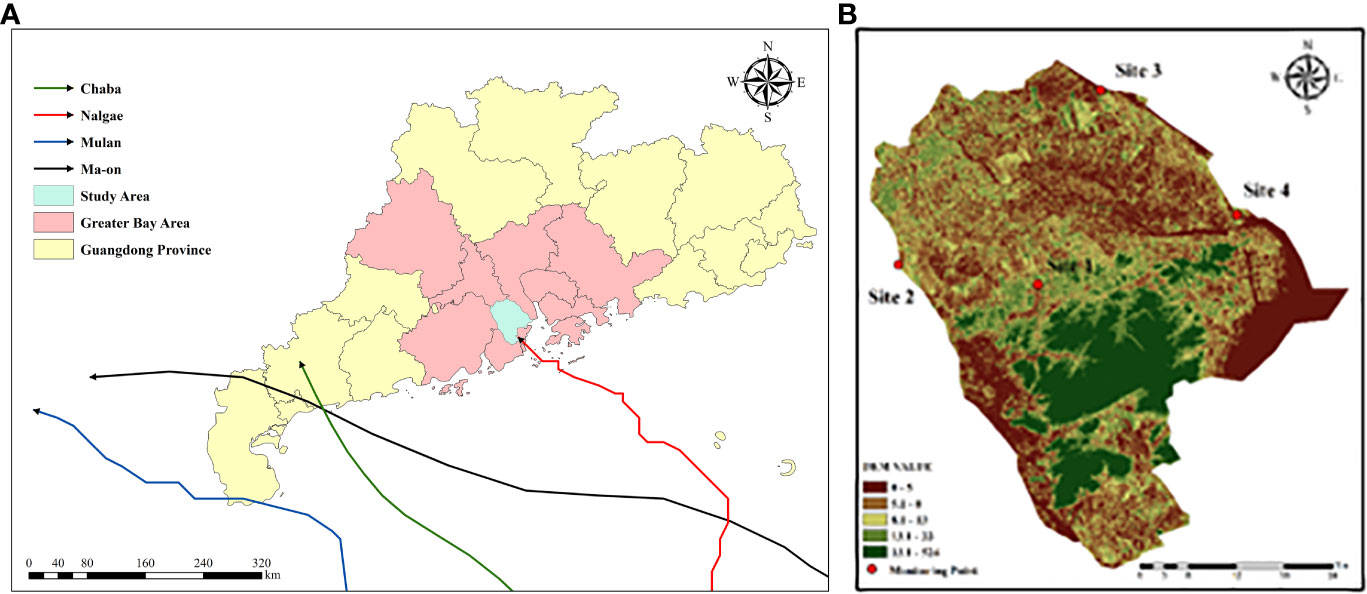
Figure 1 Research diagram. (A) Diagram of a typhoon. (B) Map of DEM.
In this study, four typhoon rain events (Chaba, Mulan, Ma-on, Nalgae) affecting Zhongshan City in 2022 were used as the study area. The extended MULTIMOORA theory was used to investigate the response of DO concentration in the water system of Zhongshan City during the transit of different typhoons. The selected indicators of the extended MULTIMOORA theory are: total rainfall, maximum rainfall in a single day, daily mean PM2.5 concentration, daily mean NO2 concentration, elevation, and distance from the station at the time of typhoon landfall.
Rainfall data from GPM (https://disc.gsfc.nasa.gov/; accessed on 7 June 2023) series of products. Global Precipitation Measurement (GPM) is an international satellite mission, carried out in cooperation with NASA and JAXA, which utilizes multi-sensor, multi-satellite and multi-algorithm in combination with satellite network and rain gauge inversion to obtain more accurate precipitation data. The GPM satellite carries ka-band precipitation radar and high-frequency microwave instrument, which can improve the observation of light rain and snowfall, and can provide higher spatial resolution and global coverage of precipitation observation data than TRMM satellite data.
Meteorological data (NO2, SO2, O3) from the TROPOMI (https://s5phub.copernicus.eu/dhus/#/home; accessed on 25 June 2023) series of products. Sentinel-5P is a global atmospheric pollution monitoring satellite launched by the European Space Agency (ESA) on 13 October 2017. The TROPOMI sensor on board the satellite can effectively observe trace gas components in the atmosphere around the globe, including NO2, O3, SO2, HCHO, CH4 and CO, which are important indicators closely related to human activities, and enhance the observation of aerosols and clouds.
PM2.5 data were obtained from Ventusky (https://www.ventusky.com/; accessed on 5 April 2023), with numerical results from FINNISH METEOROLOGICAL INSTITUTE, calculated from the SILAM model and MODIS Aqua and Terra remote sensing imagery data. DEM data were obtained from Geospatial Data Cloud (https://www.gscloud.cn/home; accessed on 26 January 2023).
The typhoon data used in this study were obtained from the Typhoon Network (http://typhoon.weather.com.cn/index.shtml; accessed on 8 March 2023). Four typhoon events (Chaba, Mulan, Ma-on, and Nalgae) affecting the study area in 2022 were used as study cases. Typhoon Chaba was generated in the South China Sea on 30 June 2022 and made landfall in Dianbai, Guangdong Province on 2 July with a landfall wind speed of 35 m/s. Chaba had an asymmetrical structure, a large circulation range of the cloud system, slow movement, a long influence time, and a wide range. Typhoon Mulan was generated in the South China Sea on 8 August 2022 and landed in Xuwen, Guangdong Province on 10 August with a landing wind speed of 23 m/s. Mulan had characteristics of, for example, a large size, a peculiar path, a short life cycle, a wide impact range, and strong local rain. Typhoon Ma-on was generated in the ocean east of the Philippines on 21 August 2022 and made landfall in Isabela Province, Philippines on 23 August and in Dianbai, Guangdong Province on 25 August. Ma-on was fast moving and had an asymmetric structure. Typhoon Nalgae was generated in the northwest Pacific Ocean on 27 October 2022 and made landfall in Catanduanes, Philippines on 29 October and Zhuhai, Guangdong Province on 3 November. Nalgae was characterised by low intensity and a loose structure with a large cloud scale.
Brauers and Zavadskas (2006) proposed a Multi-Objective-Optimization on basis of Ratio Analysis (MOORA) with discrete schemes. By constructing a decision matrix for multiple alternatives, decision makers are helped to choose the best option according to specific preference principles. The main steps are as follows:
Where: xij is the response of alternative j to target i, j = 1,2,…,m; m is the number of alternatives, i = 1,2,…,n; n is the number of targets. Nxij is a dimensionless number representing the normalized response of alternative j to objective i, with the response interval at [0; 1].
According to the ratio system method, different types of targets need to be dealt with separately due to the difference between benefit and cost in the selection of targets.
Where: i = 1,2,…,ɡ is the number of revenue targets, i = ɡ+1,ɡ+2,…,n is the number of cost class objectives. Evaluation value A under alternative j is obtained, and Rank1 is obtained by ranking according to the evaluation result of value A.
According to the reference point method, a maximum reference point is selected for the benefit target, whose coordinates are the largest among all responses. Select a minimal reference point for the cost class target whose coordinates are the smallest of all responses.
Where: Bij is the maximum reference distance of target i under alternive j, and B is the evaluation value under alternative j. Rank2 is obtained by ranking the results of value B.
Brauers and Zavadskas (2010) conducted a study on the robustness of multi-attribute decision making methods and pointed out that, in terms of robustness, the multi-attribute decision making method combining more decision-making methods has better effect. Therefore, the full multiplicative model is introduced into MOORA, and the full multiplicative form (MULTIMOORA) method is proposed. That is, the full multiplicative form of multiple objectives is added on the basis of the original, and the formula is as follows:
Where: is the utility of alternative j for the income objective, and is the utility of alternative j for the cost objective. C is the value of alternative j. Rank3 is obtained by ranking the results of value C.
Finally, by summing the above three kinds of sorting, the result of comprehensive sorting is obtained according to the dominant theory.
Although the MULTIMOORA method has good robustness, simple and effective calculation, and has a wide range of application scenarios. However, its shortcomings are that it does not consider the evaluation information support among experts and the non-negligible redundancy relationship between evaluation indicators, the lack of indicator weights (Jun and Shi-Hua, 2022). In this study, the subjective weight wi is calculated by using OWA operator, the objective weight wo is calculated by using random forest, and finally the comprehensive weight ws is obtained based on the principle of minimum discriminative information.
The Ordered Weighted Averaging (OWA) operator is one of the most commonly used aggregation operators, which can facilitate a more versatile data fusion process. Since the introduction of the OWA operator, many researchers have delved into various methods of obtaining weights (Xu, 2005). In this study, a method of calculating combinations is employed to assign weights to the OWA operator. The formula is as follows (Yu and Ze-Shui, 2008; Guo et al., 2020). See Appendix A for the detailed calculation process.
Random Forest is a highly flexible machine learning method that utilizes multiple decision trees to handle nonlinear data, address regression and classification problems, and perform feature selection based on its feature importance metrics. Random Forest employs the Bootstrap resampling method to extract a training set comprising 2/3 of the original samples and an Out-Of-Bag (OOB) data set consisting of 1/3 of the samples for feature importance computation (Shufang and Ruyang, 2021; Chen et al., 2023). The principle involves randomly perturbing a particular input parameter and calculating the resulting estimation error. The importance of this parameter is determined based on the magnitude of the error, where a higher importance value indicates greater significance of the parameter. The formula (LuanXiao et al., 2021; Xiao-wen et al., 2021) of objective weights is shown below. See Appendix B for the detailed calculation process.
Where: signifies the importance results of the feature variables.
For a discrete random variable X = (x1,x2,…,xn), the probability distribution of x is only related to the condition δ and the condition τ. Under the condition δ, the xk probability distribution function is δ(xk); similarly, under the condition τ, the xk probability distribution function is τ(xk). Thus, the discriminatory information (Lee et al., 2019) is expressed as:
Since both subjective and objective weight data are discrete random variables, in order to enhance the credibility and accuracy of the composite weight for evaluation metrics with smaller errors, this study employs the Minimum Discriminant Information Principle to determine a composite weight that closely approximates both. The solution is obtained by introducing Lagrange multipliers into the equation.
Where: θ(x) represents the original function, and δ(x) is the constraint condition function, and ψ denotes the Lagrange multiplier.
The formula is as follows. See Appendix C for the detailed calculation process.
Where: ws is the combined weight of the evaluation indicators, wi is the subjective weight of the evaluation indicators and wo is the objective weight of the evaluation indicators.
The formula for the extended MULTIMOORA method is shown below.
The theory of dominance is a method that can integrate multiple rankings into one ranking result based on various criteria such as dominance, equality, and transition (Brauers and Zavadskas, 2012). The extended MULTIMOORA method allows the ranking of three alternatives to be obtained, and then multiple rankings are integrated into one ranking based on the theory of dominance. Finally, the response analysis is performed based on the final ranking results.
After obtaining the extended MULTIMOORA sorting distribution data, the global Moran index (Ge et al., 2022) was used as the global spatial autocorrelation index to analyze the correlation and difference of DO concentration responses in river water bodies in Zhongshan City. The expression is as follows:
The local Moran index was further used to analyze the local spatial autocorrelation of the aggregation of DO concentration response in the river water bodies in Zhongshan City, to identify the high value aggregation area and the low value aggregation area of the DO concentration response, in order to reflect the spatial dependence and heterogeneity of the DO concentration response. The expression of the local Moran index is:
Where: n is the number of spatial grid cells, xi and xj are observations representing cell i and cell j respectively, is the deviation of the observation from the mean value on the ith grid cell, and wij is a spatial weight matrix based on spatial k-neighbourhood relationships.
In traditional regression analysis, the relationship between the independent variable and the dependent variable is considered to be stable throughout the whole area, so the estimated regression coefficients obtained are averaged over the whole study area, which cannot respond to the real spatial characteristics of the regression parameters. Drawing on the idea of local smoothing and embedding the spatial location of the data in the regression equations, Fotheringham et al. (1998) proposed a geographically weighted regression model (Geographically weighted regression, GWR), whose expression is as follows:
Where: yi is the dependent variable; β0(ui;vi) is the intercept; xik is the value of the kth independent variable at the ith sampling point; (ui;vi) is the coordinates of the sampling point, βk(ui;vi) is the kth regression parameter on the sampling point (ui;vi); ϵi is the random error.
MGWR, developed from GWR, takes into account different levels of spatial heterogeneity and allows each independent variable to have an optimized bandwidth based on itself (Jin et al., 2021). Its expression is as follows:
Where: Xij is the value of the independent variable; j is the number of independent variables; βj is the regression coefficient of the global variable; βj is the regression coefficient of the local variable.
In order to study the DO response at different water quality automatic monitoring stations under the influence of the same typhoon. In this study, the distance from the station at the time of typhoon Ma-on’s landfall, station elevation, total rainfall, maximum rainfall in a single day, average daily PM2.5 concentration, and average daily NO2 concentration were selected as the evaluation indexes, and the extended MULTIMOORA method was applied to carry out the study. The evaluation indicators for the different typhoons are shown in Table 1.
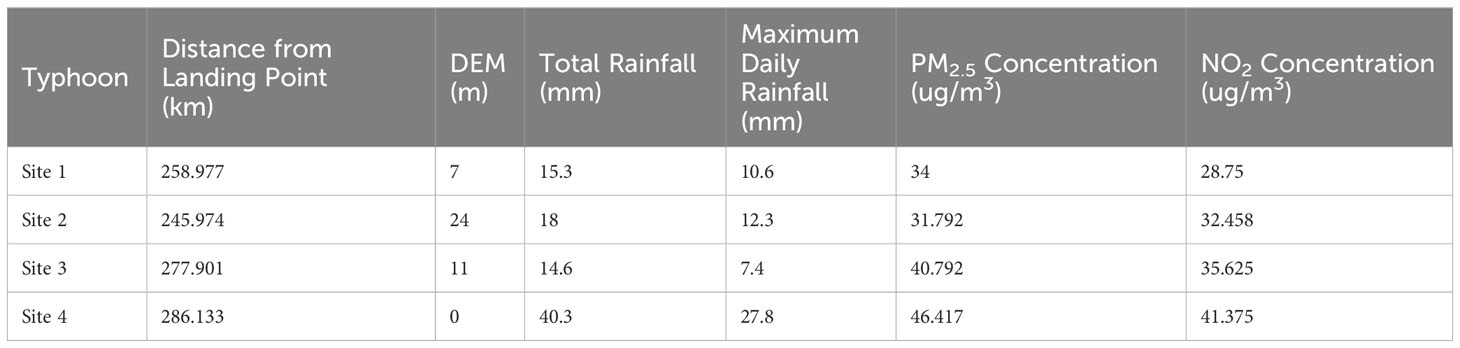
Table 1 Evaluation indicators for different stations under Typhoon Ma-on.
Five experienced experts with a long history of research in the water environment were invited to rate each indicator. The scale ranges from 1 to 10, with higher ratings indicating that the indicator has a greater impact on DO concentrations in the water system. The expert scores are shown in Table 2. The indicators were ranked in descending order according to the experts’ scores, and the subjective weights wi = (0.12,0.14,0.23,0.22,0.12,0.17) for each indicator were subsequently calculated by combining equations (7).
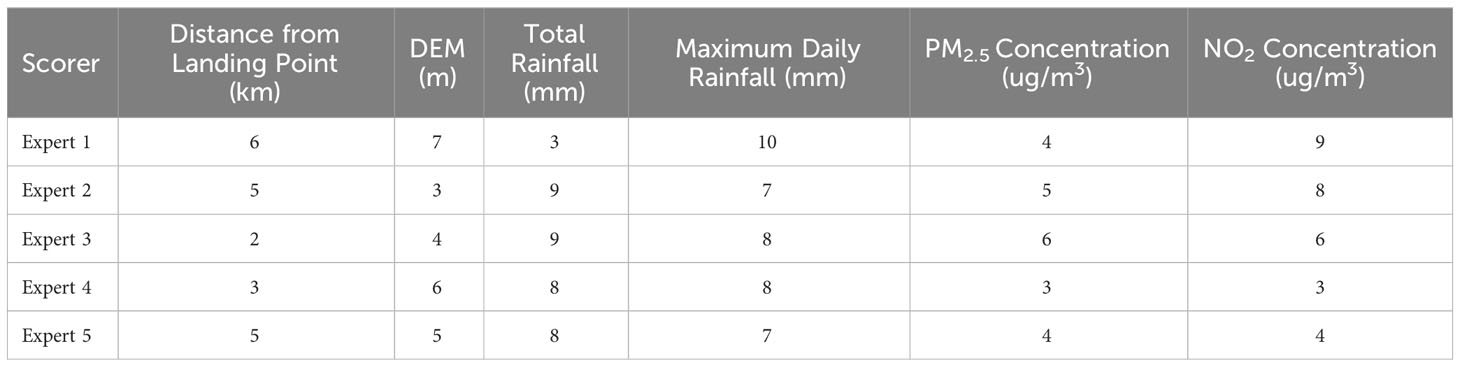
Table 2 Expert evaluation form.
Using the distance from the station at the time of typhoon Ma-on landfall, station elevation, total rainfall, single-day maximum rainfall, daily average PM2.5 concentration and daily average NO2 concentration as inputs and the change in DO concentration as outputs, the above data were input as training samples into a random forest model to build a regression prediction model, as shown in Figure 2. In this case, the training samples are set up with a training set and a test set, which account for 80% and 20% of the number of training samples respectively. The objective weights wo = (0.16,0.14,0.16,0.2,0.15,0.19) of each indicator were obtained by normalising the importance of each feature based on the solved one.
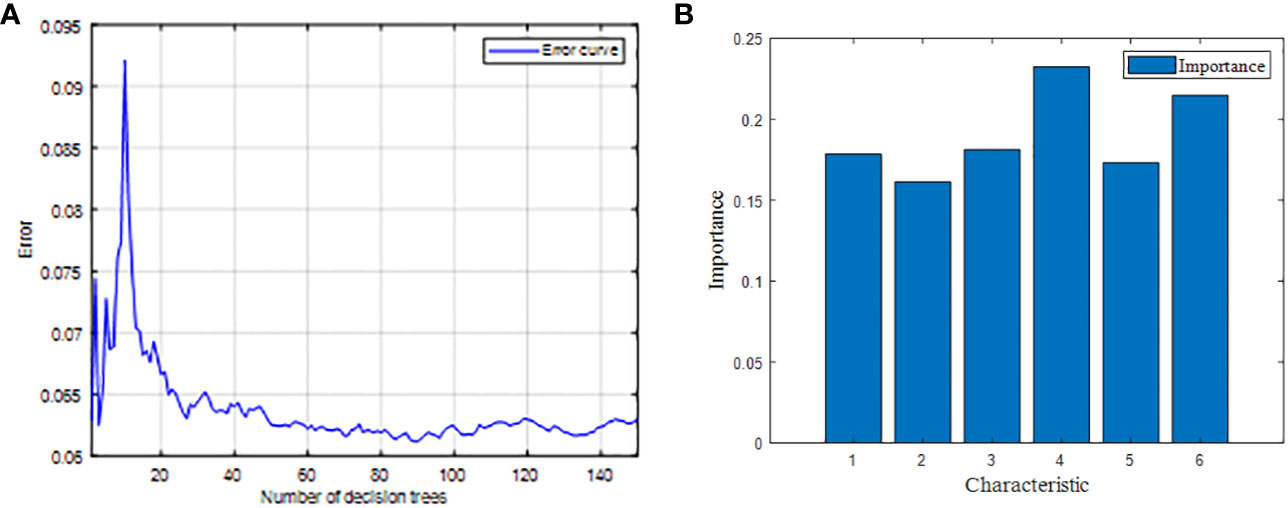
Figure 2 Schematic diagram of random forest regression analysis. (A) Diagram of the training process. (B) Schematic representation of the importance of features.
Finally, after coupling the subjective weight wi and the objective weight wo through equation (9) to equation (11), the combined weight ws = (0.14,0.14,0.19,0.21,0.14,0.18) of each indicator is obtained.
In order to eliminate the difference in scale between each indicator, the evaluation indicator data of different sites were first standardised, and the processing results are shown in Table 3.
Table 3 Indicators for the different sites after standardization.
After standardisation of the indicator data, the indicators in Table 4 were calculated using the ratio system, the reference point approach and the full multiplication form of the extended MULTIMOORA method via equations (12) to (14) respectively. The rating values for each indicator were determined as shown in Table 4. Where A is the rating value of the ratio system, B is the rating value of the reference point approach and C is the rating value of the full multiplication form.
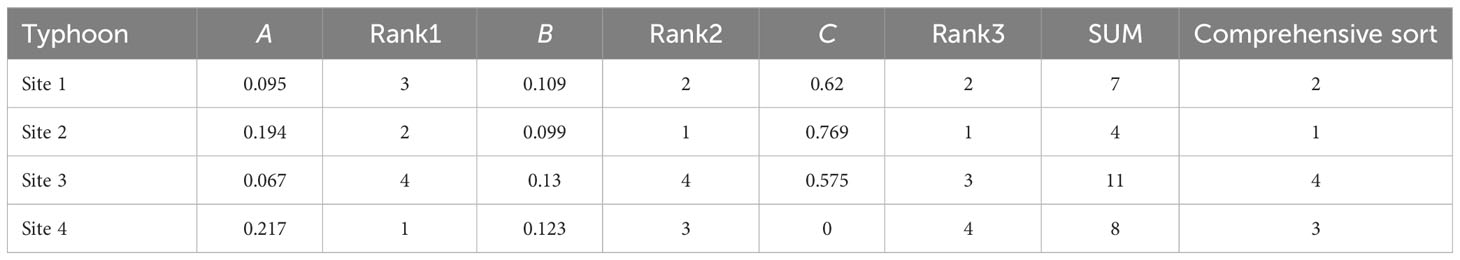
Table 4 Ratings of different stations under Typhoon Ma-on.
As can be seen from Table 4, the response of DO concentrations in the water at different sites under the influence of Typhoon Ma-on is ranked from largest to smallest: Site 2 > Site 1 > Site 4 > Site 3. In terms of DO concentrations, the variation in DO concentrations measured before and after the typhoon at the four automatic water quality monitoring stations in the study area during Typhoon Ma-on was 0.4 (Site 2) > 0.15 (Site 1) > −0.1 (Site 4) > −2.4 (Site 3). A positive value means that the DO concentration in the water column has increased after the typhoon, indicating a positive trend; a negative value means that the DO concentration in the water column has decreased after the typhoon, indicating a negative trend; this is in line with the expert scoring and the MULTIMOORA theory of ranking. The urban pattern of Zhongshan City shows that Site 2 and Site 1 are in the more urbanised population centres, while Site 4 and Site 3 are in the less urbanised river inlets. DO concentrations are relatively low in water bodies at large population centres, and tend to increase as a result of rainfall dilution; DO concentrations are relatively high in water bodies at the mouths of less urbanised rivers, and tend to decrease as a result of rainfall scouring. Combined with the data for the selected indicators, the results of this method of ranking are considered reasonable.
An in-depth understanding of the response status of DO concentration in urban water bodies under the influence of different typhoon rain events is helpful in revealing the trend of changes in the urban water environment under the influence of typhoon rain events, and in formulating strategies for controlling the water environment during the transit of typhoons. In some studies, an information system based on multi-criteria decision analysis is the preferred method because it involves multiple weighted combinations and also produces visualization results (Kut and Pietrucha-Urbanik, 2022), which is important for decision-making on the environmental risks of typhoon disasters. In this study, the extended MULTIMOORA theory is combined with geographic information system (GIS) to extract the above six evaluation index values using remote sensing image data, and the extracted index values are substituted into the formula for calculating the DO concentration response ranking under the influence of field typhoon and rainfall, and finally the DO concentration response under the influence of typhoon rain events is visualized. In this study, four typhoons (Chaba, Mulan, Ma-on, and Nalgae) affecting Zhongshan City in 2022 were visualized and analyzed separately, in which the metrics were extracted as shown in Figures 3–6, and the response of DO concentration in Zhongshan City under the influence of typhoon rain events in each scene is shown in Figure 7.
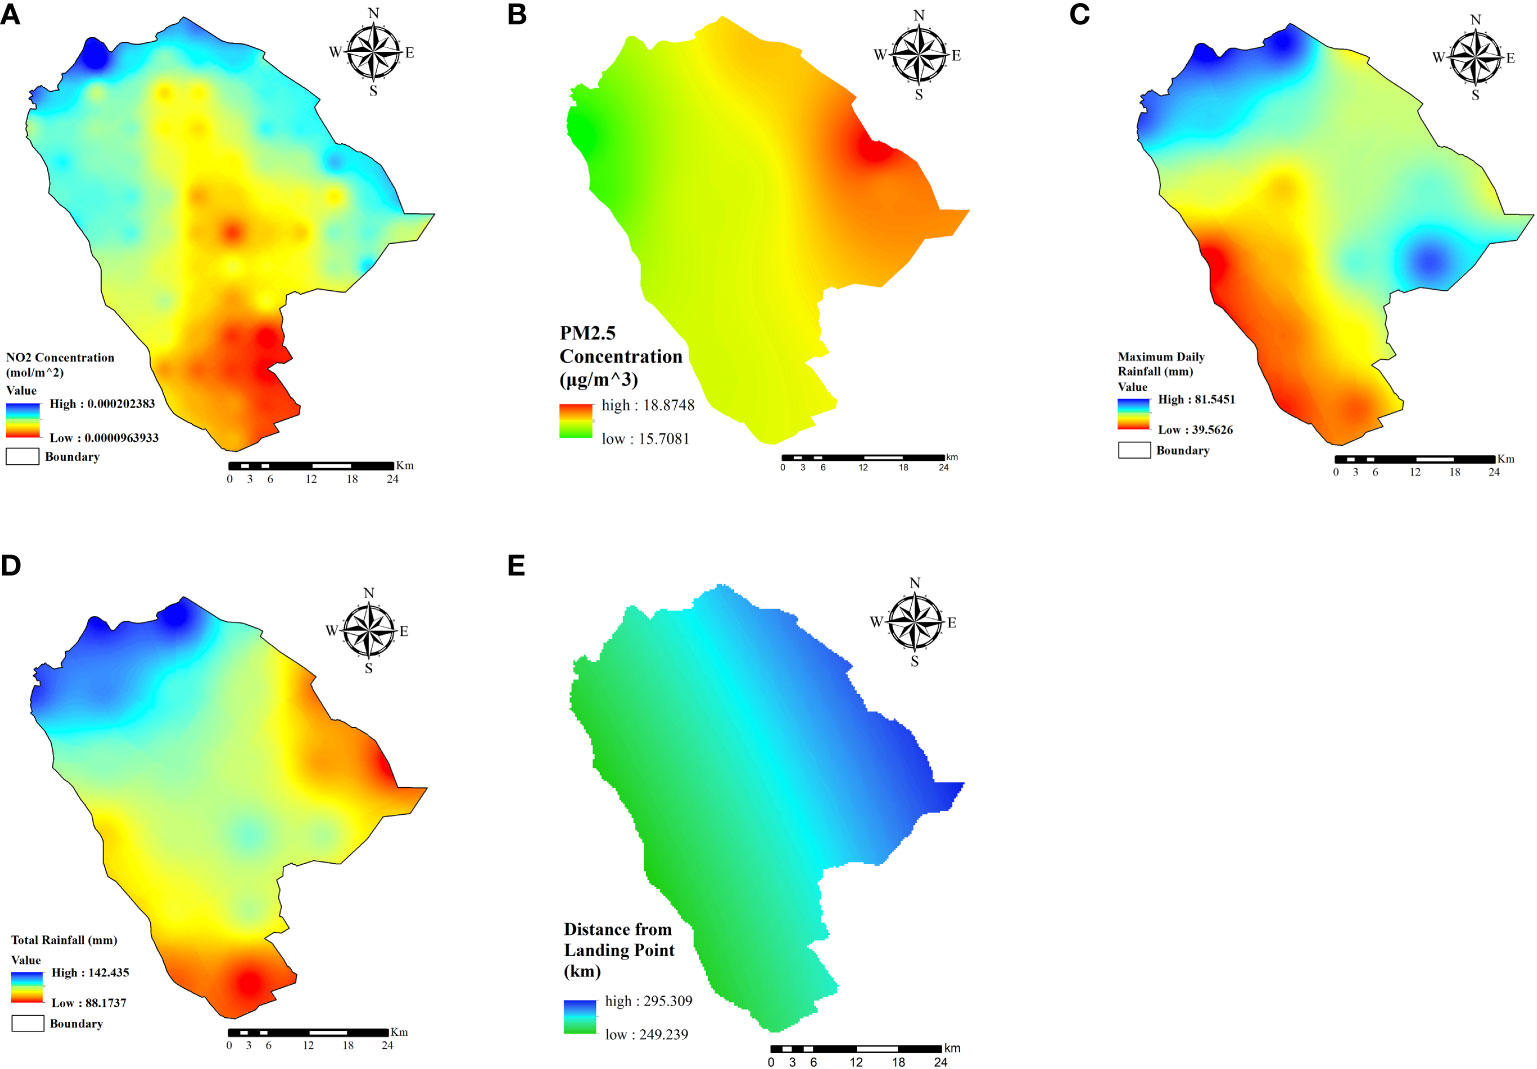
Figure 3 Distribution of indicators in Zhongshan under the impact of Typhoon Chaba. (A) Distribution of NO2 concentration. (B) Distribution of PM2.5 concentration. (C) Distribution of maximum rainfall in a single day. (D) Distribution of total rainfall. (E) Distance from landing site to site.
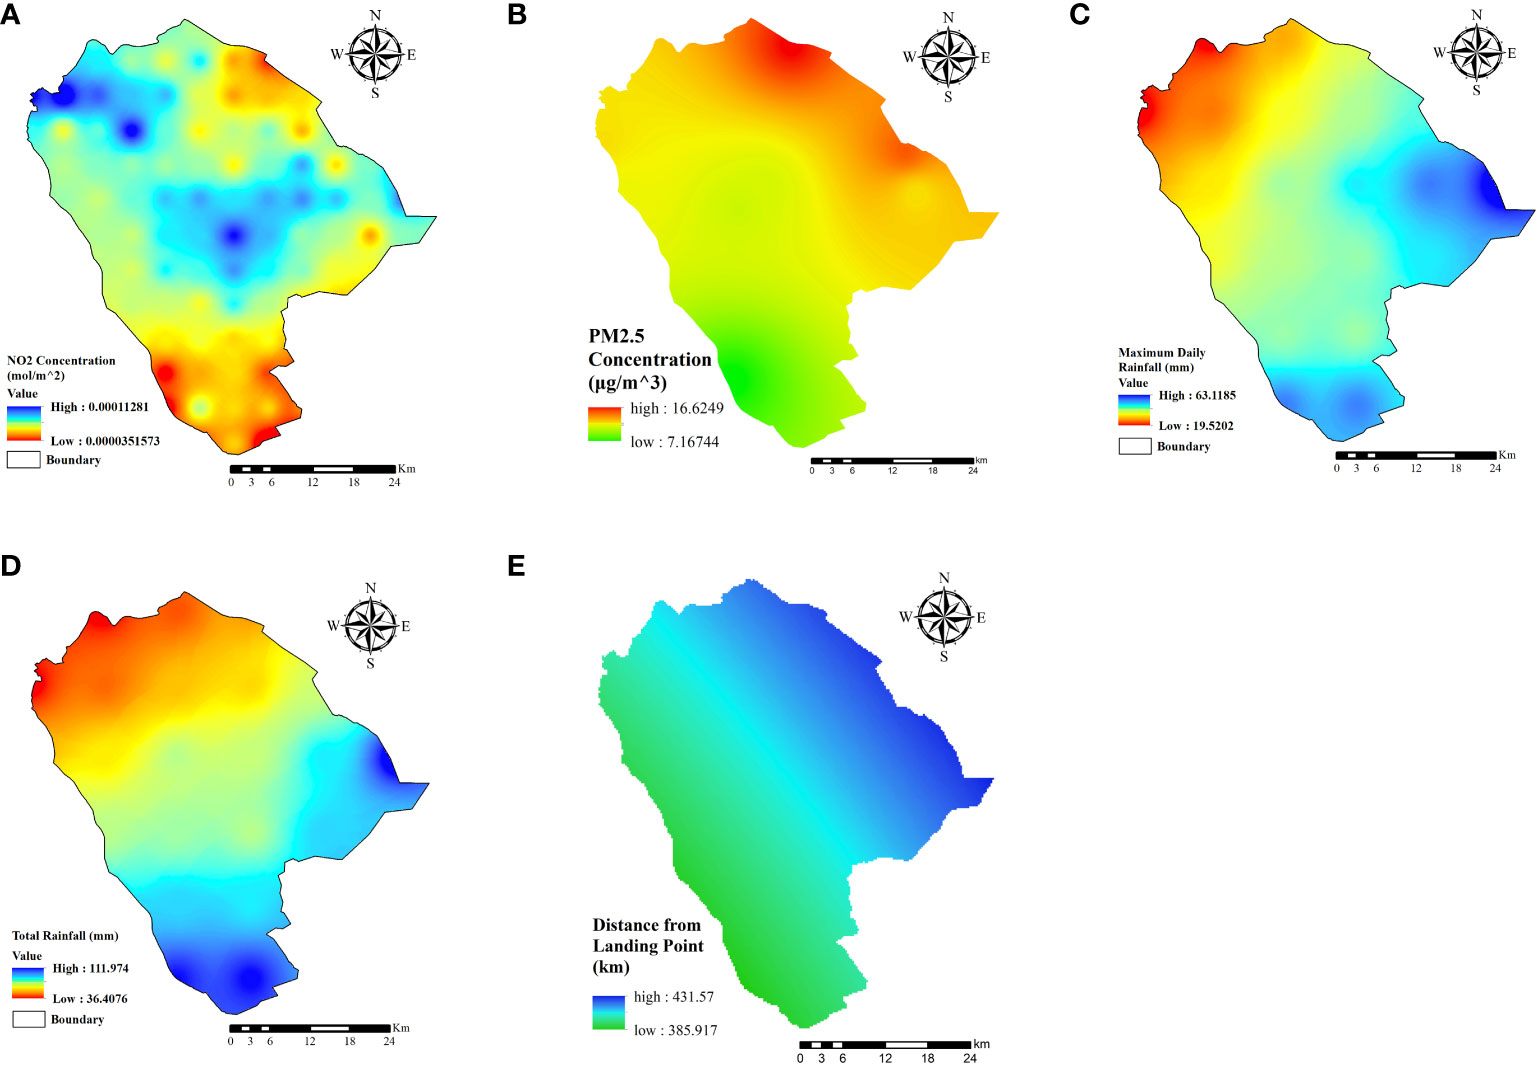
Figure 4 Distribution of indicators in Zhongshan under the impact of Typhoon Mulan. (A) Distribution of NO2 concentration. (B) Distribution of PM2.5 concentration. (C) Distribution of maximum rainfall in a single day. (D) Distribution of total rainfall. (E) Distance from landing site to site.
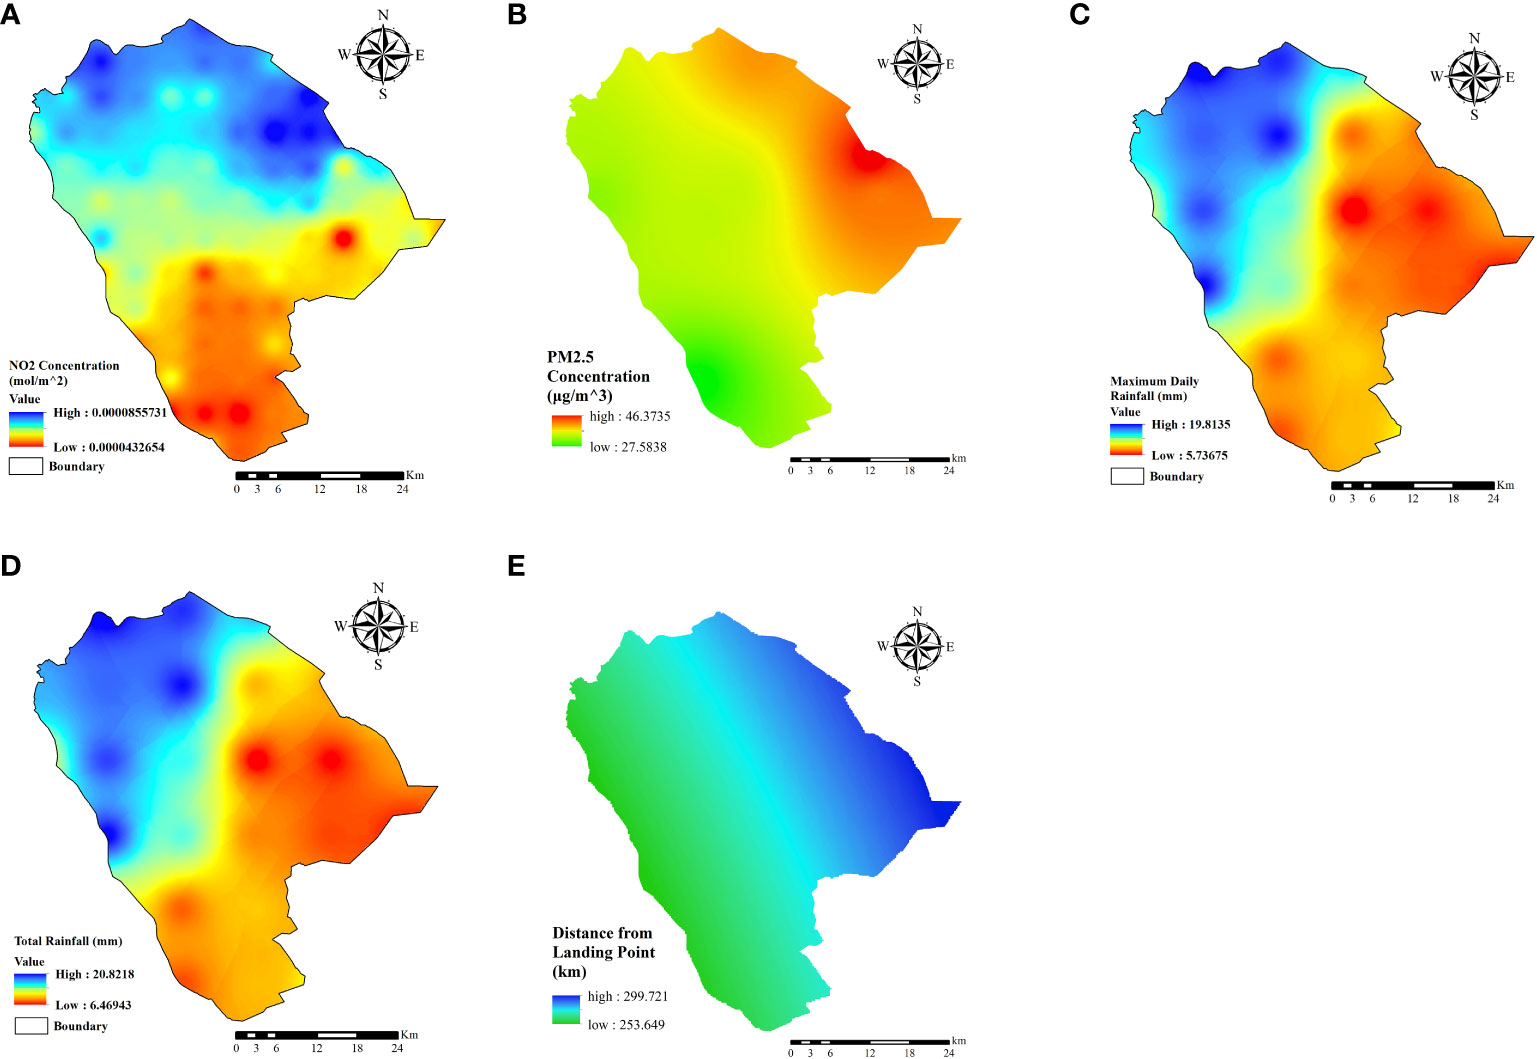
Figure 5 Distribution of indicators in Zhongshan under the impact of Typhoon Ma-on. (A) Distribution of NO2 concentration. (B) Distribution of PM2.5 concentration. (C) Distribution of maximum rainfall in a single day. (D) Distribution of total rainfall. (E) Distance from landing site to site.
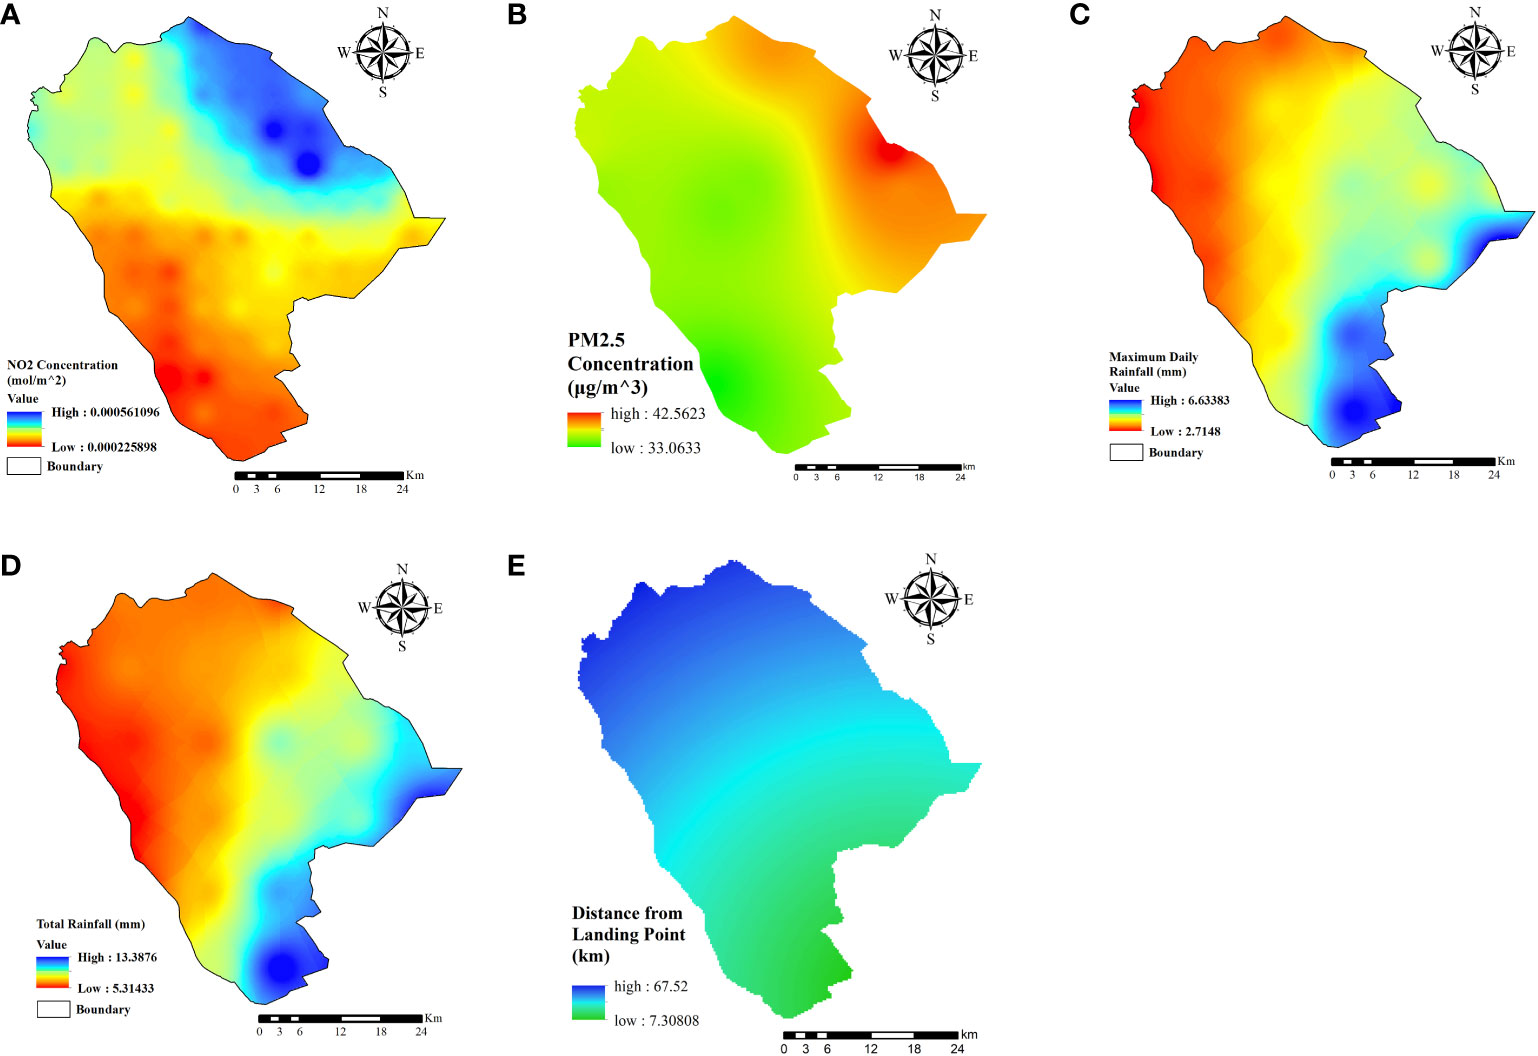
Figure 6 Distribution of indicators in Zhongshan under the impact of Typhoon Nalgae. (A) Distribution of NO2 concentration. (B) Distribution of PM2.5 concentration. (C) Distribution of maximum rainfall in a single day. (D) Distribution of total rainfall. (E) Distance from landing site to site.
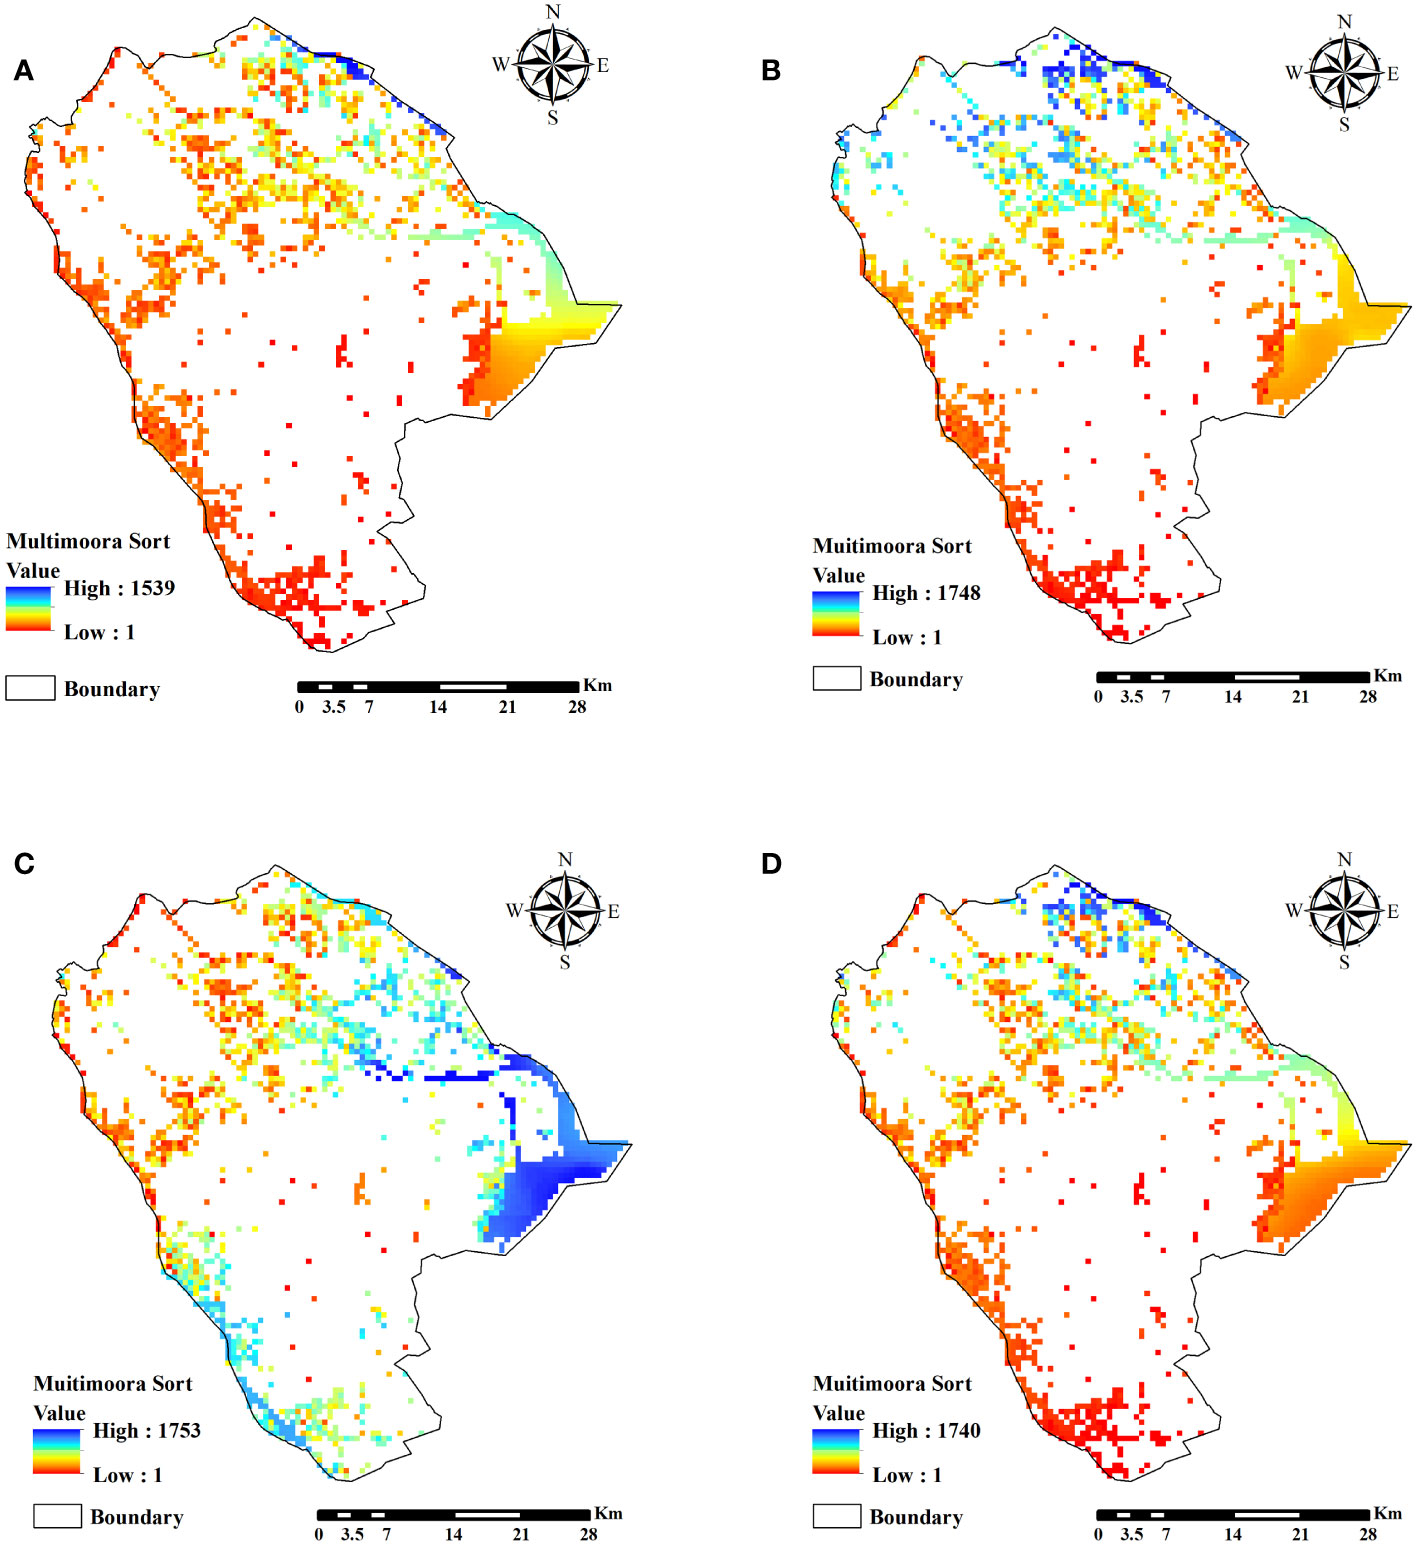
Figure 7 Response of DO concentration in Zhongshan City water bodies under the influence of Typhoon Rain Events. (A) Influenced by Chaba. (B) Influenced by Mulan. (C) Influenced by Ma-on. (D) Influenced by Nalgae.
Chaba was generated in the South China Sea on 30 June 2022, and landed in the coastal area of Guangdong Dianbai at 15:00 on 2 July, with landing winds reaching 35 m/s. As can be seen from Figure 3, from 2 to 4 July, the cumulative rainfall in Zhongshan City ranged from 88.1737 mm to 142.435 mm under the influence of Chaba, with the maximum single-day rainfall ranging from 39.5626 mm to 81.5451 mm. The daily average PM2.5 concentration ranged from 15.7081 μg/m3 to 18.8748 μg/m3 and NO2 concentration ranged from 0.0000963933 mol/m2 to 0.000202383 mol/m2.
Mulan intensified from a tropical storm in the South China Sea on 9 August 2022, and made landfall in Xuwen, Guangdong at 10:00 a.m. on 10 August, with landfall winds reaching 23 m/s. As can be seen from Figure 4, the cumulative rainfall in Zhongshan City from 9 to 11 August under the influence of Mulan ranged from 36.4076 mm to 111.974 mm, with the maximum single-day rainfall ranging from 19.5202 mm to 63.1185 mm, the daily average PM2.5 concentration ranged from 7.16744 μg/m3 to 16.6249 μg/m3 and NO2 concentration ranged from 0.0000351573 mol/m2 to 0.00011281 mol/m2.
Ma-on was generated on 22 August 2022 over the ocean east of the Philippines and landed on the coast of Guangdong Dianbai at 10:00 a.m. on 25 August, with landing winds reaching 33 m/s. As can be seen from Figure 5, the cumulative rainfall in Zhongshan City from 24 to 26 August under the influence of Ma-on ranged from 6.46943 mm to 20.8218 mm, with the maximum single-day rainfall ranging from 5.73675 mm to 19.8135 mm, with daily average PM2.5 concentrations ranging from 27.5838 μg/m3 to 46.3735 μg/m3 and NO2 concentrations ranging from 0.0000432654 mol/m2 to 0.0000855731 mol/m2.
Nalgae was generated in the northwest Pacific Ocean on 27 October 2022 and landed in Xiangzhou District, Zhuhai, Guangdong on 3 November, with landing winds reaching 16 m/s. As can be seen from Figure 6, the cumulative rainfall in Zhongshan City from 31 October to 3 November was between 5.31433 mm to 13.3876 mm under the influence of Nalgae, with the maximum single-day rainfall ranging from 2.7148 mm to 6.63383 mm, with daily average PM2.5 concentrations ranging from 33.0633 μg/m3 to 42.5623 μg/m3 and NO2 concentrations ranging from 0.000225898 mol/m2 to 0.000561096 mol/m2.
The lower the ranking value calculated based on the extended MULTIMOORA theory, the more likely the DO concentration in the water body at that location will respond in a good direction under the influence of the typhoon rain events; the higher the ranking value calculated based on the extended MULTIMOORA theory, the more likely the DO concentration in the water body at that location will respond in a bad direction under the influence of the typhoon rain events. As can be seen from Figure 7, the DO concentration response of the rivers in the Zhongshan city area under the influence of Chaba, Mulan and Nalgae is such that there is a tendency for the south-western water bodies to develop to the good side, while the north-eastern water bodies have a tendency to become worse. Under the influence of Ma-on, the DO concentration response in the Zhongshan municipal rivers is a trend towards worse water bodies in the south-west as well as in the north.
An accurate understanding of the regional distribution of DO concentration response in urban waters under the influence of different typhoon rain events is helpful in revealing the regional distribution of urban water environment risks under the influence of typhoon rain events, and in formulating targeted disaster prevention and mitigation efforts. In this study, the ranked values calculated by the extended MULTIMOORA theory are clustered and analyzed, as shown in Figure 8.
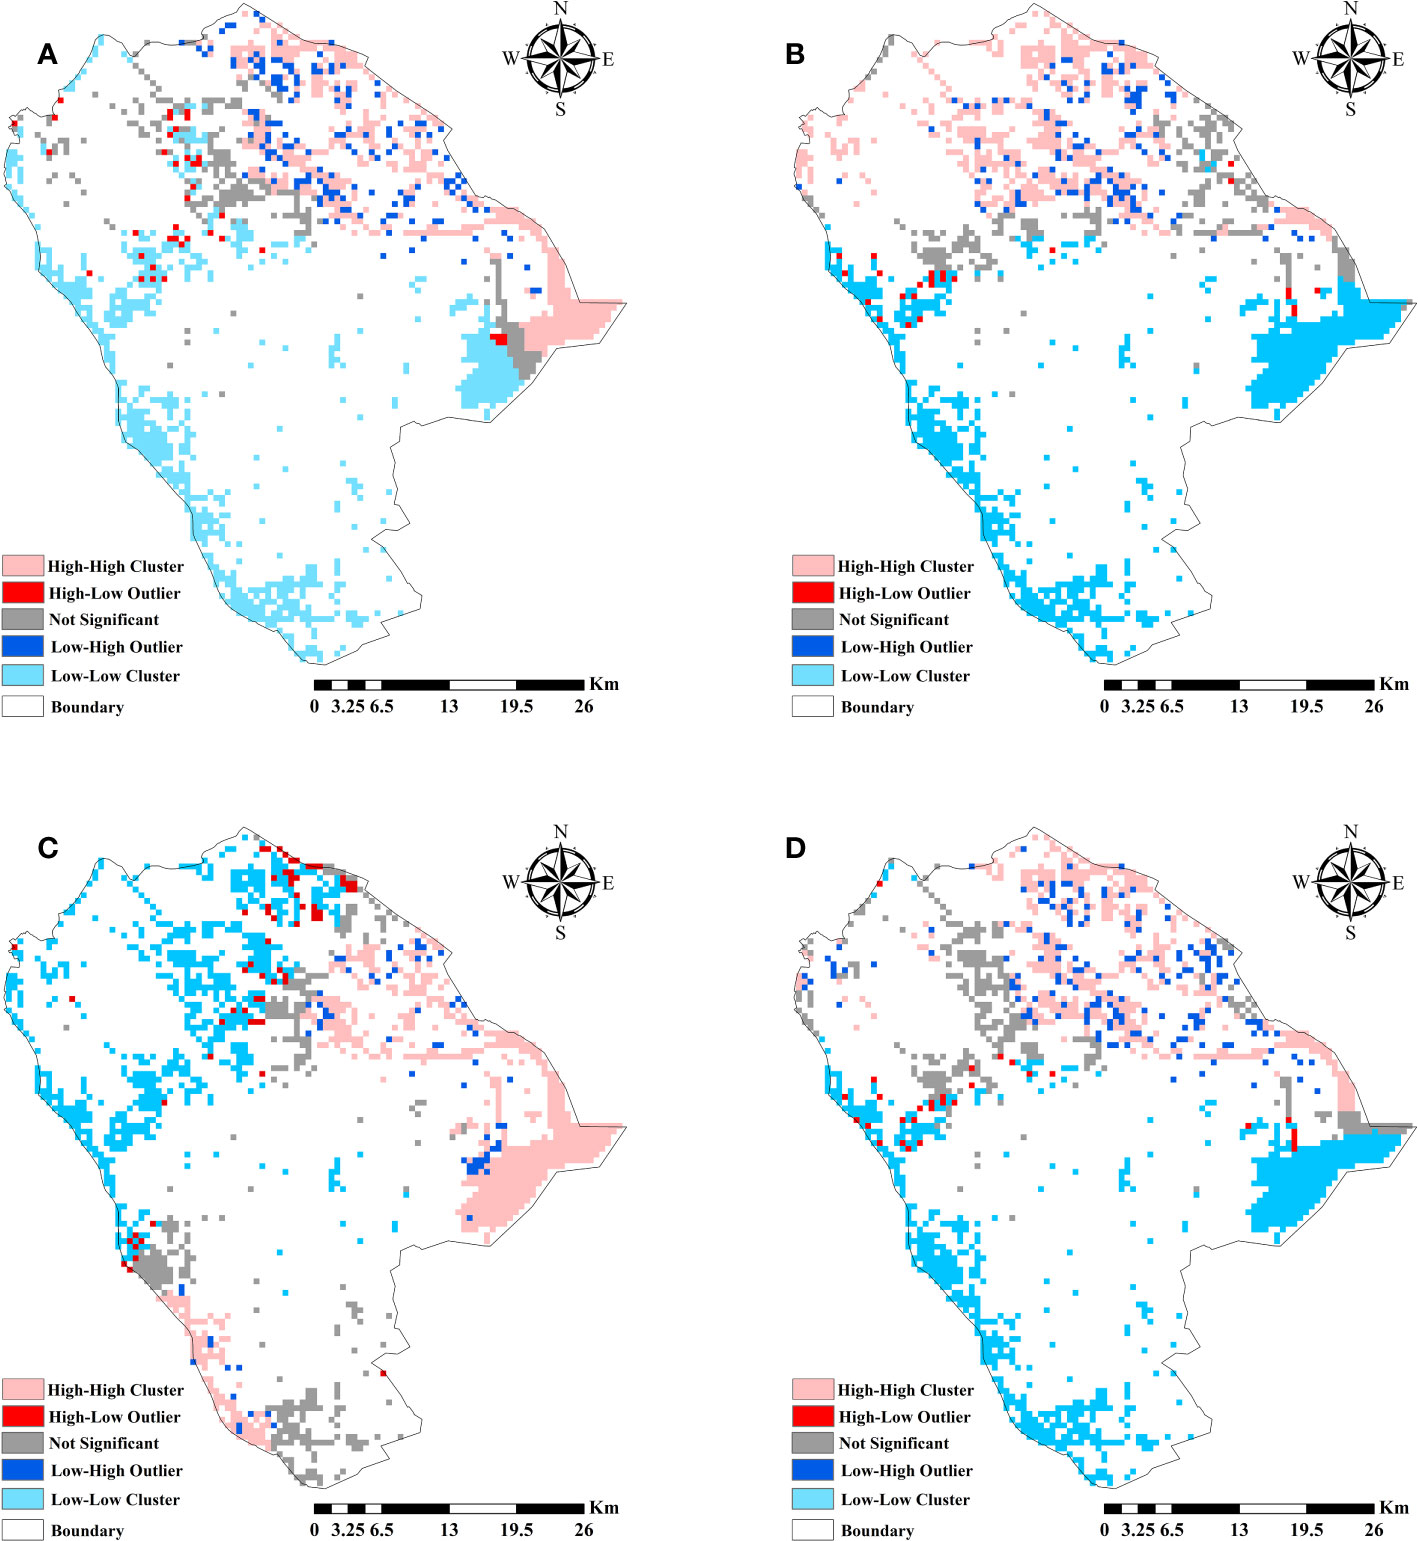
Figure 8 Cluster Analysis of DO Concentration Response in Zhongshan City Water Bodies under the Impact of Typhoon Rain Events. (A) Influenced by Chaba. (B) Influenced by Mulan. (C) Influenced by Ma-on. (D) Influenced by Nalgae.
As can be seen from Figure 8, under the influence of Chaba, Mulan and Nalgae, the southern and northwestern parts of Zhongshan City show low-low aggregation phenomena, indicating that the response of DO concentration in this region has a tendency to develop for the better, and it is a low-risk area; the northern and northeastern parts of Zhongshan City show high-high aggregation phenomena, indicating that the response of DO concentration in this region has a tendency to deteriorate, and it is a high-risk area. Under the influence of Ma-on, the localized areas in the northeast and southwest of Zhongshan City showed the phenomenon of high-high aggregation, indicating that the response of DO concentration in this region has a tendency to become worse and is a high-risk area; the phenomenon of low-low aggregation in the northwest of Zhongshan City indicates that the response of DO concentration in this region has a tendency to develop in a better direction and is a low-risk area.
Human activities are the main drivers of atmospheric pollution (Shuping et al., 2016). SO2 and O3 are important gases affecting atmospheric quality, of which O3 is a very important greenhouse gas with an uneven global distribution, which is significantly affected by human activities (Bing and Hua, 2014). SO2 mainly originates from human activities such as industrial activities, fossil fuel combustion and biomass combustion (Jie et al., 2011), therefore SO2 can be used to characterize the intensity of human activities. Spatial heterogeneity in population distribution has been suggested (Zhipeng et al., 2022), and thus the same spatial heterogeneity exists in SO2 concentration distribution and O3 concentration distribution driven by anthropogenic intensity. In this study, the MGWR model was used to explore the correlation between the O3 concentration distribution and SO2 concentration distribution driven by the intensity of human activities and the DO concentration response ranking values of urban streams, and the calculated results are shown in Figure 9. (a), (c), (e), (g), and (b), (d), (f), (h) are the spatial distributions of the coefficients of influence of the O3 concentration distributions and the SO2 concentration distributions on the sorted values of the DO concentration response for Chaba, Mulan, Ma-on, and Nalgae, respectively.
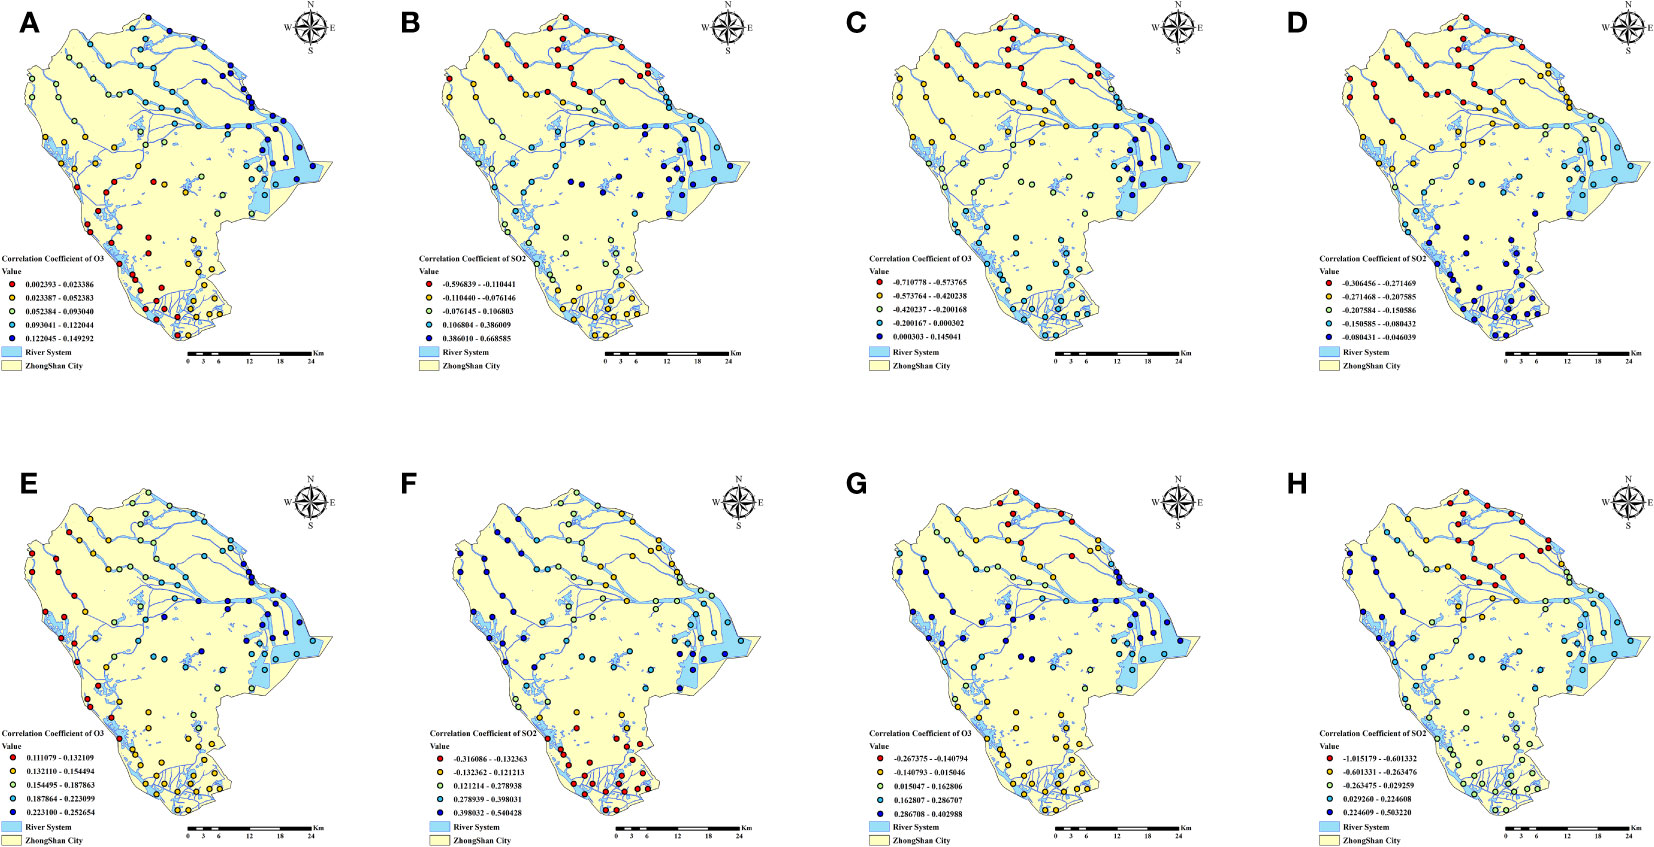
Figure 9 (A) Spatial distributions of the coefficients of influence of the O3 concentration distributions on the sorted values of the DO concentration response influenced of Chaba. (B) Spatial distributions of the coefficients of influence of the SO2 concentration distributions on the sorted values of the DO concentration response influenced of Chaba. (C) Spatial distributions of the coefficients of influence of the O3 concentration distributions on the sorted values of the DO concentration response influenced of Mulan. (D) Spatial distributions of the coefficients of influence of the SO2 concentration distributions on the sorted values of the DO concentration response influenced of Mulan. (E) Spatial distributions of the coefficients of influence of the O3 concentration distributions on the sorted values of the DO concentration response influenced of Ma-on. (F) Spatial distributions of the coefficients of influence of the SO2 concentration distributions on the sorted values of the DO concentration response influenced of Ma-on. (G) Spatial distributions of the coefficients of influence of the O3 concentration distributions on the sorted values of the DO concentration response influenced of Nalgae. (H) Spatial distributions of the coefficients of influence of the SO2 concentration distributions on the sorted values of the DO concentration response influenced of Nalgae.
As shown in Figure 9, there is a certain correlation between the DO concentration response ordering values and the O3 concentration distribution and SO2 concentration distribution. In terms of O3 concentration distribution, under the influence of the four typhoon events, the maximum positive correlation between DO concentration response ranking values and O3 concentration distribution occurred in the eastern part of Zhongshan City, the minimum positive correlation occurred in the western part of Zhongshan City, and the maximum negative correlation occurred in the northern part of Zhongshan City. In terms of SO2 concentration distribution, under the influence of the four typhoon rains, the maximum positive correlations between the ranked DO concentration response values and the SO2 concentration distribution occurred in the eastern and western parts of Zhongshan City, the minimum negative correlations occurred in the southern part of Zhongshan City, and the maximum negative correlations occurred in the northern part of Zhongshan City.
In recent years, a series of research results have been achieved in both environmental risk assessment and typhoon disaster risk assessment. And in the existing studies, economy and safety are mostly taken as the assessment objectives. In this study, an attempt is made to introduce the expanded MULTIMOORA theory in multi-criteria decision analysis to carry out the environmental risk assessment of typhoon disaster with the response of DO concentration in the water body as the assessment objective. Meanwhile, combining the measured water quality data and corresponding public information, the results of this study are considered reasonable, and the findings can provide some reference for the local government in formulating disaster prevention and mitigation plans and water environment control strategies during typhoons.
As can be seen in Figures 7, 8, the effect of field typhoon rains on the response of DO concentrations in urban rivers is two-sided, which is consistent with previous reports (Zhou et al., 2012; Ye et al., 2014). In general, rainfall with higher DO concentration into the river can effectively increase the DO concentration of the river(Muñoz et al., 2015), and at the same time, rainfall can also cause a large amount of oxygen-depleting compounds and organic matter to enter into the river, which can cause a rapid decrease in the DO content of the river. Combined with the results of the study, this paper concludes that: in the rainfall intensity of the larger typhoon rain events, rich in dissolved oxygen rainfall will play a dilution effect, increase the dissolved oxygen content in the water body of the urban water network; and in the production of convergence and the role of surface scouring to reduce in the water body at the mouth of the sea in the content of dissolved oxygen. This is consistent with existing research. Pearce and Schumann (2003) documented a 13-month period of dissolved oxygen concentration measurements in the Gamtoos Estuary, South Africa, noting that hypoxic conditions occurred throughout the estuary following a large-scale extreme rainfall event. In 2011, Mitra.A. (Mitra et al., 2011a; Mitra et al., 2011b) et al. conducted an in-situ study of hydrological parameters in the Bay of Bengal and neighboring estuaries under the influence of AILA and found that dissolved oxygen showed a decreasing trend at all the sampling points during the transit of AILA, and gradually recovered to the pre-AILA level in the water column 10 days after the end of the AILA event. Geng Ye et al. (2021) analyzed urban surface water quality under the influence of Lekima based on automatic monitoring data, and concluded that during the typhoon’s transit, the DO concentration in the Jinan section of the Xiaoqing River showed an overall upward trend accompanied by small fluctuations under the combined effect of upstream inflow and surface tributary inflow during the same period. Under the action of the typhoon rain events with lower rainfall intensity, the scouring action of rainwater dominates, washing pollutants from urban impervious surfaces as well as organic matter from mountainous soils into the river water body, leading to a trend of worse overall DO concentration response in the water body. This is consistent with existing studies. Yihui et al. (2022) analyzed in detail the characteristics of the impacts of typhoon rain events on the water environment of lakes and showed that the effect of typhoon rain events would cause a decrease in the concentration of DO in the water body. In terms of rainfall intensity, the results of this paper are consistent with existing studies that different rainfall characteristics produce different runoff loads and runoff concentrations, which in turn lead to different runoff water quality (An et al., 2014).
As can be seen from Figure 9, the ranked values of DO concentration response in the rivers of Zhongshan city area under the influence of typhoon rain events show some correlation with the distribution of O3 concentration and the distribution of SO2 concentration. Specifically, the response rankings of DO concentration were positively correlated with the distribution of O3 and SO2 concentrations in the eastern, central and western parts of Zhongshan City, i.e., the larger the concentrations of O3 and SO2, the larger the response rankings of DO concentration, and the water quality in the river had a tendency to deteriorate under the impacts of the typhoon rain events; The response ranking of DO concentration is negatively correlated with the distribution of O3 and SO2 concentrations in the north and south of Zhongshan City, i.e., the larger the concentrations of O3 and SO2 are, the smaller the response ranking of DO concentration is, and there is a tendency for the water quality in the river to be better under the influence of the typhoon rain events. This result is consistent with conventional knowledge: the central, western and eastern parts of Zhongshan City are densely populated urban centers, where intensive human activities provide a large amount of O3 precursors and SO2; while the southern and northern parts of Zhongshan City are not only set up as agroforestry ecological zones, but also as an agricultural development area in the southern part of the city, where the content of O3 precursors and SO2 is lower. Under the condition of similar rainfall, the DO concentration response ranking values showed positive correlation with O3 concentration distribution and SO2 concentration distribution in the east, center and west of Zhongshan City, and negative correlation in the north and south of Zhongshan City, which is in line with the reality.
In conclusion, the results of this study are accurate and credible, and can provide a visual reference and theoretical basis for urban managers to develop adaptive water governance and carry out targeted disaster prevention and mitigation work (Liya et al., 2022).
Characterizing the response of dissolved oxygen concentration in urban water bodies under the influence of a single typhoon is essential for city managers to make decisions on response programs and input budgets. In this study, the extended MULTIMOORA method was used to establish the correlation between typhoon drivers and the response of DO concentration in urban water bodies, and to quantify and evaluate the characteristics of the response distribution of DO concentration in urban water bodies. The results showed that the response of DO concentration in the water body of the river in the center of the city under the action of the more intense typhoon rain events was developed to be better; the response of DO concentration in the water body at the mouth of the sea tended to be worse. Under the effect of less intense typhoon rain events, the scouring effect of rainwater dominates and there is a tendency for the response of DO concentration in the water body to become worse. Meanwhile, this study used the MGWR model and spatial autocorrelation analysis to explore the impact of human activities on the distribution of urban water environment response. The results show that the response ranking values of DO concentration in rivers in Zhongshan city under the influence of the typhoon rain events are positively correlated with the distribution of O3 concentration and SO2 concentration in the east, center and west of Zhongshan city, and negatively correlated with the distribution of O3 concentration and SO2 concentration in the north and south of Zhongshan city. The results of this study can provide visual reference and theoretical support for local governments and city managers in developing adaptive water management and targeted disaster prevention and mitigation programs.
The original contributions presented in the study are included in the article/supplementary material. Further inquiries can be directed to the corresponding authors.
WS: Writing – original draft. YJ: Funding acquisition, Methodology, Writing – review & editing. GL: Funding acquisition, Resources, Writing – review & editing. PC: Funding acquisition, Writing – review & editing.
The author(s) declare financial support was received for the research, authorship, and/or publication of this article. This research was funded by the National Natural Science Foundation of China (grant no. 42101422 and no. 52178209) and the Science and Technology Program of Guangzhou (grant no. 201605030009 and no. 201803020036). The project was supported by the Guangdong Engineering and Research Center for Unmanned Aerial Vehicle Remote Sensing of Agricultural Water and Soil Information.
The authors would like to thank the editors and reviewers for their useful comments, which was helpful in improving the quality of the manuscript.
The authors declare that the research was conducted in the absence of any commercial or financial relationships that could be construed as a potential conflict of interest.
All claims expressed in this article are solely those of the authors and do not necessarily represent those of their affiliated organizations, or those of the publisher, the editors and the reviewers. Any product that may be evaluated in this article, or claim that may be made by its manufacturer, is not guaranteed or endorsed by the publisher.
An L., Yuntao G., Liang L. (2014). Impact of catchment and rainfall characteristics on urban runoff quality (in Chinese). J. Tsinghua University(Science Technology) 54, 7. doi: 10.16511/j.cnki.qhdxxb.2014.07.004
Bing X., Hua Z. (2014). Main progresses in the Research on ozone (in Chinese). Sci. Technol. Eng. 14, 9. doi: 10.3969/j.issn.1671-1815.2014.08.019
Brauers W. K. M., Zavadskas E. K. (2006). The MOORA method and its application to privatization in a transition economy. Control Cybern. 35, 25. doi: 10.1007/s10458-005-3783-9
Brauers W. K. M., Zavadskas E. K. (2010). Project management by multimoora as an instrument for transition economies / projektŲ Vadyba su multimoora kaip priemonĖ Pereinamojo laikotarpio ūkiams. Technol. Econ. Dev. Econ. 16, 5–24. doi: 10.3846/tede.2010.01
Brauers W. K. M., Zavadskas E. K. (2012). Robustness of MULTIMOORA: A method for multi-objective optimization. Informatica 23, 1–25. doi: 10.15388/Informatica.2012.346
Cabrera J. S., Lee H. S. (2019). Flood-prone area assessment using GIS-based multi-criteria analysis: A case study in Davao oriental, Philippines. Water 11. doi: 10.3390/w11112203
Chaojia N., Huichun Y., Shiwen Z., Jiawei G., Bei C., Wenjiang H. (2022). Risk assessment and sustainable development countermeasures of agricultural typhoon disaster for Hainan Island of China (in Chinese). Trans. Chin. Soc. Agric. Eng. 38, 10. doi: 10.11975/j.issn.1002-6819.2022.23.025
Chen H., Zhu Y., Zhang Y., Chen X., Wang R., Zhu W. (2020). Cyanobacterial bloom expansion caused by typhoon disturbance in Lake Taihu China. Environ. Sci. pollut. Res. Int. 27, 42294–42303. doi: 10.1007/s11356-020-09292-0
Chen R., Xue W., Zi-Wen W., Hao Q., Tie-Min M., Zheng-Guang C., et al. (2023). Wavelength selection method of near-infrared spectrum based on random forest feature importance and interval partial least square method (in Chinese). Spectrosc. Spectral Anal. 43, 8. doi: 10.3964/j.issn.1000-0593(2023)04-1043-08
Chen Z., Han-An L., Xue-Ping G., Wen-Na Z. (2016). Potential impacts of climate change on phosphorus and DO in Yuqiao reservoir (in Chinese). Environ. Sci. 37, 8. doi: 10.13227/j.hjkx.2016.08.014
Cui Y., Jin J., Huang Q., Yuan K., Xu C. (2022). A data-driven model for spatial shallow landslide probability of occurrence due to a typhoon in Ningguo City, Anhui province, China. Forests 13. doi: 10.3390/f13050732
Espinosa-Diaz L. F., Zapata-Rey Y. T., Ibarra-Gutierrez K., Bernal C. A. (2021). Spatial and temporal changes of dissolved oxygen in waters of the Pajarales complex, Cienaga Grande de Santa Marta: Two decades of monitoring. Sci. Total Environ. 785, 147203. doi: 10.1016/j.scitotenv.2021.147203
Fotheringham A. S., Charlton M. E., Brunsdon C. (1998). Geographically weighted regression: a natural evolution of the expansion method for spatial data analysis. Environ. Plann. A 30, 23. doi: 10.1068/a301905
Fu X., Liu J., Mei C., Luan Q., Wang H., Shao W., et al. (2021). Effect of typhoon rainstorm patterns on the spatio-temporal distribution of non-point source pollution in a coastal urbanized watershed. J. Clean Prod. 292. doi: 10.1016/j.jclepro.2021.126098
Gao Z., Geddes R. R., Ma T. (2020). Direct and indirect economic losses using typhoon-flood disaster analysis: an application to Guangdong province, China. Sustainability 12. doi: 10.3390/su12218980
Ge W., Qiang Y., Di Y., Teng N., Qian-Qian L. (2022). Retrieval of dust retention distribution in Beijing urban green space based on spectral characteristics. Spectrosc. Spectral Anal. 42, 7. doi: 10.3964/j.issn.1000-0593(2022)08-2572-07
Guo L., Wang M., Zhong L., Zhang Y. (2020). Calculation model for the mixing amount of internal curing materials in high-strength concrete based on modified MULTIMOORA. Sci. Eng. Compos. Mater. 27, 455–463. doi: 10.1515/secm-2020-0048
Hafezalkotob A., Hafezalkotob A., Liao H., Herrera F. (2019). An overview of MULTIMOORA for multi-criteria decision-making: Theory, developments, applications, and challenges. Inf. Fusion 51, 145–177. doi: 10.1016/j.inffus.2018.12.002
Han R., Zhou B., An L., Jin H., Ma L., Li N., et al. (2019). Quantitative assessment of enterprise environmental risk mitigation in the context of Na-tech disasters. Environ. Monit Assess. 191, 210. doi: 10.1007/s10661-019-7351-1
Hongxiang F., Ligang X., Hua Z., Zhao L., Yuxian C., Yakun W., et al. (2021). Distinguishing the relative of climate change and anthropogenic activities on variation of water age in the Lake Poyang (in Chinese). J. Lake Sci. 33, 13. doi: 10.18307/2021.0419
Howarth R. W. (2008). Coastal nitrogen pollution: A review of sources and trends globally and regionally. Harmful Algae 8, 14–20. doi: 10.1016/j.hal.2008.08.015
Howarth R., Chan F., Conley D. J., Garnier J., Doney S. C., Marino R., et al. (2011). Coupled biogeochemical cycles: eutrophication and hypoxia in temperate estuaries and coastal marine ecosystems. Front. Ecol. Environ. 9, 18–26. doi: 10.1890/100008
Huanhuan L., Da A., Yu Y., Yue W., Beidou X., Minghong W., et al. (2016). Risk ranking for groundwater pollution from hazardous waste landfills by MCDA model (in Chinese). Res. Environ. Sci. 29, 7. doi: 10.13198/j.issn.1001-6929.2016.01.17
Jie J., Yong Z., Xiao-Qiang C., Dan S. (2011). Study on concentration and transport characteristics of sulfur dioxide over the Bohai Sea (in Chinese). Acta OCEANOLOGICA Sin. 33, 6.
Jin Y., Zhang H., Shi H., Wang H., Wei Z., Han Y., et al. (2021). Assessing spatial heterogeneity of factor interactions on PM2.5 concentrations in Chinese cities. Remote Sens. 13. doi: 10.3390/RS13245079
Jin-Dian M., Xiao-Ming Z., Tian-Xing W., Yang Z., Peng L., Li-Gang Z. (2021). Temporal and spatial distribution characteristics of net nitrogen and phosphorus input from human activity: A case study of Hangzhou section of Qiandao Lake Basin (in Chinese). China Environ. Sci. 41, 12. doi: 10.19674/j.cnki.issn1000-6923.2021.0287
Jun L., Shi-Hua L. (2022). Probabilistic hesitant Fermatean fuzzy extension MULTIMOORA method for evaluation of regional green restoration level (in Chinese). Control Decision 37, 11. doi: 10.13195/j.kzyjc.2021.0437
Kim J.-M., Son K., Yum S.-G., Ahn S., Ferreira T. (2020). Typhoon vulnerability analysis in South Korea utilizing damage record of typhoon Maemi. Adv. Civil Eng. 2020, 1–10. doi: 10.1155/2020/8885916
Kut P., Pietrucha-Urbanik K. (2022). Most searched topics in the scientific literature on failures in photovoltaic installations. Energies 15. doi: 10.3390/en15218108
Lee Y. H., J.Haberman S., Dorans N. J. (2019). Use of adjustment by minimum discriminant information in linking constructed-response test scores in the absence of common items. J. Educ. Measurement 56, 21. doi: 10.1111/jedm.12216
Lei G., Sihao L., Lixia G., Jun W., Pingping C., Jiantao Z. (2022). Optimization of PCCP welding process parameters based on improved MULTIMOORA method (in Chinese). Trans. OF THE China WELDING INSTITUTION 43, 8. doi: 10.12073/j.hjxb.20211018001
Liu Y., Ke-Ming M., Qing-Hai G., Jing-Zhu Z. (2004). Impacts of the urbanization on waters non-point source pollution. Environ. Sci. 25, 8. doi: 10.13227/j.hjkx.2004.06.007
Liu D., Pang L., Xie B. (2009). Typhoon disaster in China: prediction, prevention, and mitigation. Nat. Hazards 49, 421–436. doi: 10.1007/s11069-008-9262-2
Lixia G., Minghua W., Yuan T., Yanan Z. (2020). Performance evaluation on internal curing high-strength concrete based on improved MULTIMOORA (in Chinese). Yangtze River 51, 6. doi: 10.16232/j.cnki.1001-4179.2020.11.028
Liya G., Linruo Z., Zhiran X. (2022). Water security under the impact of climate change and sustainable solutions (in Chinese). China Water Resour. 9, 3.
LuanXiao Z., Jinshui L., Yunxia Y., Kai Z., Jiqiang M., Caifeng Z., et al. (2021). Quantitative seismic characterization of source rocks in lacustrine depositional setting using the Random Forest method: An example from the Changjiang sag in East China Sea basin (in Chinese). Chin. J. Geophys. 64, 16. doi: 10.6038/cjg2021O0123
Mardani A., Zavadskas E. K., Khalifah Z., Zakuan N., Jusoh A., Nor K. M., et al. (2017). A review of multi-criteria decision-making applications to solve energy management problems: Two decades from 1995 to 2015. Renewable Sustain. Energy Rev. 71, 216–256. doi: 10.1016/j.rser.2016.12.053
Mishra B., Kumar P., Saraswat C., Chakraborty S., Gautam A. (2021). Water security in a changing environment: concept, challenges and solutions. Water 13. doi: 10.3390/w13040490
Mitra A., Banerjee K., Sengupta K. (2011a). Impact of AILA, a tropical cyclone on salinity, pH and dissolved oxygen of an aquatic sub-system of Indian Sundarbans. Proc. Natl. Acad. Sci. India Section B-Biological Sci. 81, 198–205.
Mitra A., Halder P., Banerjee K. (2011b). Changes of selected hydrological parameters in Hooghly estuary in response to a severe tropical cyclone (Aila). Indian J. Geo-Marine Sci. 40, 32–36.
Muñoz H., Orozco S., Vera A., Suárez J., García E., Neria M., et al. (2015). Relación entre ox ígeno disuelto, precipitación pluvial y temperatura: río Zahuapan, Tla xcala, México. Water Technol. Sci. (in Spanish) 6, 16.
Pearce M. W., Schumann E. H. (2003). Dissolved oxygen characteristics of the gamtoos estuary, South Africa. Afr. J. Mar. Sci. 25, 99–109. doi: 10.2989/18142320309504003
Qiong Y., Haijun Z., Guohui Z., Hang L., Yueyan L., Zhengming X. (2021). Research on green degree evaluation of cutting process based on MULTIMOORA (in Chinese). Modern Manufacturing Eng. 7, 10–16. doi: 10.16731/j.cnki.1671-3133.2021.11.002
Qi-ting Z., Jun-Xia M., Chuan-Chang G. (2005). Study on carrying capacity of urban water environment (in Chinese). Adv. Water Sci. 16, 6. doi: 10.14042/j.cnki.32.1309.2005.01.019
Shenghua X., Zhengsong C., Yonggang C., Qiang H. (2019). Recognition method of airline fleet reliability based on index fuzzy segmentation and MULTIMOORA (in Chinese). Comput. Integrated Manufacturing Syst. 25, 8. doi: 10.13196/j.cims.2019.02.016
Shufang S., Ruyang H. (2021). Importance measure index system based on random forest (in Chinese). JOURNAL OF Natl. UNIVERSITY OF DEFENSE Technol. 43, 8. doi: 10.11887/j.cn.202102004
Shuping Z., Lijian H., Weiqi Z., Weifeng L. (2016). Impact of urban population on concentrations of nitrogen dioxide ( NO2 ) and fine particles ( PM2.5 ) in China (in Chinese). Acta ECOLOGICA Sin. 36, 9. doi: 10.5846/stxb201502050292
Songbai G., Aiguo G., Guantao N., Xuxu Z., Yanpo Z., Yuting H. (2017). Progress in research of hypoxia in estuaries and coastal areas in China (in Chinese). Water Resour. Prot. 33, 8. doi: 10.3880/j.issn.1004-6933.2017.04.010
Wang Y., Yin Y., Song L. (2022). Risk assessment of typhoon disaster chains in the Guangdong–Hong Kong–Macau greater bay area, China. Front. Earth Sci. 10. doi: 10.3389/feart.2022.839733
Weihui H., Chunzi M., Wenpan L., Zhuoshi H., Hanxiao Z., Shouliang H. (2021). Spatial-temporal variations of dissolved oxygen and their response to global warming in China (in Chinese). Acta Scientiae Circumstantiae 41, 11. doi: 10.13671/j.hjkxxb.2020.0330
Xiaoran O., Qiaohua Z., Yingzhu W. (2013). A preliminary exploration of dissolved oxygen based on FVCOM in Meiliang Bay,Lake Taihu and its influence mechanism (in Chinese). J. Lake Sci. 25, 11.
Xiao-wen L., Lu-Quan W., Ya-Guang Z., Yun-Zhao C., Ming-Yi W., Jun-Ping Z., et al. (2021). Random forest retinal segmentation in OCT images based on principal component analysis (in Chinese). Prog. Biochem. Biophys. 48, 8. doi: 10.16476/j.pibb.2020.0270
Xiu-qin O., Bo W., Jian-Lin S., Xiao Z., Jie-Fei W., Yong L., et al. (2019). Atmospheric nitrogen dioxide,Nitric acid,Nitrate nitrogen concentrations,and wet and dry deposition Rates in a double Rice Region in subtropical China (in Chinese). Environ. Sci. 40, 8. doi: 10.13227/j.hjkx.201810252
Xu Z. (2005). An overview of methods for determining OWA weights. Int. J. Intell. Syst. 20, 843–865. doi: 10.1002/int.20097
Xuehua G., Zhihe C., Zhiheng Y. (2022). Dynamic simulation and sensitivity analysis of water resources system in Zhongshan City (in Chinese). Water Resour. Prot. 38, 9. doi: 10.3880/j.issn.1004-6933.2022.02.015
Ye H., Chen C., Tang S., Tian L., Sun Z., Yang C., et al. (2014). Remote sensing assessment of sediment variation in the Pearl River Estuary induced by Typhoon Vicente. Aquat. Ecosyst. Health Manage. 17, 271–279. doi: 10.1080/14634988.2014.944475
Ye G., Tian-Jun D., Jian-Hui X., Guo-Dong Q., Xue-Jun Y. (2021). Analysis of the impact of typhoon “Lekima” Rainfall on urban surface water quality based on automatic monitoring (in Chinese). Environ. Sci. Technol. 34, 6. doi: 10.19824/j.cnki.cn32-1786/x.2021.0013
Yihui Z., Yuemin H., Zhaoliang P., Weiping H., Jinge Z. (2022). Fast-changing wind waves and their environmental effects in Lake Chaohu (in Chinese). J. Lake Sci. 34, 9. doi: 10.18307/2022.0322
Yu H., Song Y., Chang X., Gao H., Peng J. (2018). A scheme for a sustainable urban water environmental system during the urbanization process in China. Engineering 4, 190–193. doi: 10.1016/j.eng.2018.03.009
Yu W., Ze-Shui X. (2008). A new method of giving OWA weights (in Chinese). Mathematics Pract. Theory 38, 11.
Yuan-hua H., Yi-Lan H., Sheng-Hua X. (2023). An evaluation model of airport fire station site selection based on entropy weight intuitionistic fuzzy extended MULTIMOORA (in Chinese). Control Decision 38, 9. doi: 10.13195/j.kzyjc.2021.0247
Yufeng Z., Liu S., Liqing L., Hong Z., Wenzhong T. (2023). Treatment of black and odorous water I : Effects of water oxygen state on speciation and bioavailability of heavy metals in sediments (in Chinese). Acta Scientiae Circumstantiae 43, 10. doi: 10.13671/j.hjkxxb.2022.0199
Yuling H., Jinxin F., Zeping W., Mengnan G., Shunxin F. (2022). Assessing requirements for dissolved oxygen in Yunnan plateau lakes (in Chinese). J. China Institute Water Resour. Hydropower Res. 20, 7. doi: 10.13244/j.cnki.jiwhr.20210300
Zhang J., Chen Y. (2019). Risk assessment of flood disaster induced by typhoon rainstorms in Guangdong province, China. Sustainability 11. doi: 10.3390/su11102738
Zhang W., Zhou X., Wei W., Cheng X. (2022). Risk assessment of water inrush in tunnels: A case study of a tunnel in Guangdong province, China. Sustainability 14. doi: 10.3390/su141811443
Zhao Y., Yang K., Luo Y., Yu Z. (2022). Spatial–temporal characteristics of surface thermal environment and its effect on Lake surface water temperature in Dianchi Lake basin. Front. Ecol. Evol. 10. doi: 10.3389/fevo.2022.984692
Zhilin Z., Jing Q., Tao C., Bensheng H., Ziying F. (2022). Urban flood issues and analysis in the Guangdong-Hong Kong-Macao Greater Bay Area (in Chinese). J. Hydraulic Eng. 53, 10. doi: 10.13243/j.cnki.slxb.20220207
Zhipeng G., Yuao M., Huayi W., Rui L. (2022). Urban population spatialization by considering the heterogeneity on local resident attraction force of POIs (in Chinese). J. Geo-information Sci. 24, 15. doi: 10.12082/dqxxkx.2022.220384
Zhou W., Yin K., Harrison P. J., Lee J. H. W. (2012). The influence of late summer typhoons and high river discharge on water quality in Hong Kong waters. Estuarine Coast. Shelf Sci. 111, 35–47. doi: 10.1016/j.ecss.2012.06.004
First, P experts are invited to rate the target Q. The rating results are then arranged in descending order, resulting in (), where . The weight yj+1 for aj is determined by combinatorial calculations.
According to the weights yj+1, the target data is sequentially weighted to obtain the absolute weights of the target, denoted as .
Hence, the subjective weights wi calculated by the OWA operator can be obtained.
The formulae (LuanXiao et al., 2021; Xiao-wen et al., 2021) are shown below.
Where: g(D|O) is the information gain value, H(D) is the overall entropy value before branching, H(D|O) is the entropy value after pre-branching in condition O. Y represents the true values, YP represents the predicted values, denotes the predicted values after modifying the feature variables, represents the mean squared error of the feature variables for decision tree tm, T is the number of decision trees, and signifies the importance results of the feature variables.
Calculate the objective weights wo as follows:
For a discrete random variable , the probability distribution of x is only related to the condition δ and the condition τ. Under the condition δ, the xk probability distribution function is δ(xk); similarly, under the condition τ, the xk probability distribution function is τ(xk). Thus, the discriminatory information (Lee et al., 2019) is expressed as:
Since both subjective and objective weight data are discrete random variables, in order to enhance the credibility and accuracy of the composite weight for evaluation metrics with smaller errors, this study employs the Minimum Discriminant Information Principle to determine a composite weight that closely approximates both. The solution is obtained by introducing Lagrange multipliers into the equation.
Where: θ(x) represents the original function, and δ(x) is the constraint condition function, and ψ denotes the Lagrange multiplier.
Establishing the objective function as follows:
Substituting the Lagrange multiplier yields:
Taking the partial derivative of Equation 4 results in:
Where: ws is the combined weight of the evaluation indicators, wi is the subjective weight of the evaluation indicators and wo is the objective weight of the evaluation indicators.
Keywords: typhoon events, dissolved oxygen, urban, environment, river
Citation: Shen W, Jin Y, Li G and Cong P (2023) Analyzing the response distribution of DO concentration and its environmental factors under the influence of typhoon rain events with remote sensing. Front. Ecol. Evol. 11:1283281. doi: 10.3389/fevo.2023.1283281
Received: 25 August 2023; Accepted: 19 October 2023;
Published: 03 November 2023.
Edited by:
Samy Ismail Elmahdy, United Arab Emirates University, United Arab EmiratesReviewed by:
Yulong Guo, Henan Agricultural University, ChinaCopyright © 2023 Shen, Jin, Li and Cong. This is an open-access article distributed under the terms of the Creative Commons Attribution License (CC BY). The use, distribution or reproduction in other forums is permitted, provided the original author(s) and the copyright owner(s) are credited and that the original publication in this journal is cited, in accordance with accepted academic practice. No use, distribution or reproduction is permitted which does not comply with these terms.
*Correspondence: Yuhao Jin, eXVoYW8uamluQHNjYXUuZWR1LmNu; Peitong Cong, c2x4eWt5QHNjYXUuZWR1LmNu
Disclaimer: All claims expressed in this article are solely those of the authors and do not necessarily represent those of their affiliated organizations, or those of the publisher, the editors and the reviewers. Any product that may be evaluated in this article or claim that may be made by its manufacturer is not guaranteed or endorsed by the publisher.
Research integrity at Frontiers
Learn more about the work of our research integrity team to safeguard the quality of each article we publish.