 Alexandre Delplanque
 Richard Lamprey
 Samuel Foucher
 Jérôme Théau
 Philippe Lejeune
- 1TERRA Teaching and Research Centre – Forest Is Life, Gembloux Agro-Bio Tech, University of Liège (ULiège), Gembloux, Belgium
- 2Department of Natural Resources, Faculty of Geo-Information Science and Earth Observation (ITC), University of Twente, Enschede, Netherlands
- 3Department of Applied Geomatics, Université de Sherbrooke, Sherbrooke, QC, Canada
- 4Quebec Centre for Biodiversity Science (QCBS), Stewart Biology, McGill University, Montréal Québec, QC, Canada
As the need to accurately monitor key-species populations grows amid increasing pressures on global biodiversity, the counting of large mammals in savannas has traditionally relied on the Systematic-Reconnaissance-Flight (SRF) technique using light aircrafts and human observers. However, this method has limitations, including non-systematic human errors. In recent years, the Oblique-Camera-Count (OCC) approach developed in East Africa has utilized cameras to capture high-resolution imagery replicating aircraft observers’ oblique view. Whilst demonstrating that human observers have missed many animals, OCC relies on labor-intensive human interpretation of thousands of images. This study explores the potential of Deep Learning (DL) to reduce the interpretation workload associated with OCC surveys. Using oblique aerial imagery of 2.1 hectares footprint collected during an SRF-OCC survey of Queen Elizabeth Protected Area in Uganda, a DL model (HerdNet) was trained and evaluated to detect and count 12 wildlife and livestock mammal species. The model’s performance was assessed both at the animal instance-based and image-based levels, achieving accurate detection performance (F1 score of 85%) in positive images (i.e. containing animals) and reducing manual interpretation workload by 74% on a realistic dataset showing less than 10% of positive images. However, it struggled to differentiate visually related species and overestimated animal counts due to false positives generated by landscape items resembling animals. These challenges may be addressed through improved training and verification processes. The results highlight DL’s potential to semi-automate processing of aerial survey wildlife imagery, reducing manual interpretation burden. By incorporating DL models into existing counting standards, future surveys may increase sampling efforts, improve accuracy, and enhance aerial survey safety.
1 Introduction
As pressures on biodiversity increase across the globe, accurately determining key-species populations is seen as critical in the ‘Essential Biodiversity Variables’ (EBV) approach to monitoring ecosystem health (Brummitt et al., 2017; Jetz et al., 2019). For over 60 years, the counting of large wildlife species in the expansive savannas of eastern and southern Africa has been addressed using light aircrafts and human counting crews (Gwynne and Croze, 1975; Norton-Griffiths, 1978; Jachmann, 2001). The ‘Systematic Reconnaissance Flight’ (SRF) technique involves flying an aircraft at low altitude along transects, whilst Rear-Seat-Observers (RSOs) count animals to left and right in strips of terrain defined by markers on the aircraft (Caughley, 1977; Norton-Griffiths, 1978; Grimsdell and Westley, 1981; Stelfox and Peden, 1981). The transects are the sample units, and analysis to derive estimates and margins of error is conducted using the Jolly II Method (Jolly, 1969; Caughley, 1977).
SRF ‘counting standards’ have been adopted by many eastern and southern African countries to ensure that data meet minimum quality requirements for national and continental-wide trend-analysis of critical flagship such as elephants (Norton-Griffiths, 1978; Craig, 2012; PAEAS, 2014; CITES-MIKE, 2019). These standards define inter alia the flying heights and strip-widths for counting, the sampling intensities that should be used, the length of time that RSOs should count animals before rest-breaks, the recording methods and the statistical analysis techniques used. Although these standards can ensure that important technical criteria are met, they cannot account for all human counting bias. Observers may miss cryptic animals, become overstretched when faced with large herds or multi-species groups, and lose concentration in long hot, turbulent flights over monotonous landscapes (Caughley, 1974; Jachmann, 2002; Fleming and Tracey, 2008; Schlossberg et al., 2016). In regard to detection, they have very little time to search and record animals; as the aircraft moves at a ground-speed of 170–180 km.hr−1 along the transect, the RSO can hold any particular feature in view for 5–7 seconds (Fleming and Tracey, 2008). For this reason, an optimum RSO strip width of 150 m on each side of the aircraft was derived from experimental studies in the 1970s, and this metric was subsequently embedded within counting standards (Pennycuick and Western, 1969; Caughley and Goddard, 1975; Norton-Griffiths, 1978; Stelfox and Peden, 1981; Ottichilo and Khaemba, 2001).
Despite the long-recognized constraints of RSO-viewing, consistency of method over decades is seen as key in determining trends (Ogutu et al., 2016). Therefore, advances in methods will need to be made incrementally to ensure harmonization with previous surveys. A recent SRF advance in East Africa, known as the ‘Oblique-Camera-Count’ (OCC), uses digital cameras to record the counting strips to left and right of the aircraft (Lamprey et al., 2019; Lamprey et al., 2020). This replicates the oblique view of the RSOs where animals can be detected under tree canopies. With OCC the observers are not in the aircraft but in the laboratory, and their job is to interpret the many thousands of images obtained in a flight mission.
In recent years, multiple RSO-OCC comparisons have been conducted. Bröker et al. (2019) showed that the abundance estimate of narwhal in Greenland (Monodon monoceros) based on oblique-imaging was not significantly different from RSO one. However, Lethbridge et al. (2019) found 30% higher oblique-imaging estimates than RSO ones when surveying Kangaroos in Australia. OCC counts in Kenya and Uganda over the last decade revealed that RSOs had been missing up to 70% of large mammal species, including key cryptic species such as giraffe (Lamprey et al., 2019). Estimates for smaller animals were greatly increased. In Murchison Falls National Park in Uganda for example, an RSO-based survey estimated 600 oribi (Ourebia ourebi ssp. cottoni), whilst an OCC survey the following year estimated 12,000 (Lamprey et al., 2020). Thus the use of cameras is important in resetting baseline population estimates.
The primary advantage of camera-based counts is that time can be spent in the lab to carefully study each image for animals, and that interpreters can cross-check scenes for verification. Conversely, the primary constraint of aerial imaging methods is that thousands of images are acquired that need to be visually interpreted. This is a time-consuming and costly exercise. For example, a standard counting flight transect, involving just 30 minutes of RSO time for detection and recording, would obtain 900 OCC images taken each side of the aircraft. These images will take 4 days to interpret by two interpreters (left and right cameras). It is therefore not surprising that conservation agencies balk at the time and labour costs of OCC counts and other imaging exercises (Bröker et al., 2019; Peng et al., 2020).
Another limitation of the OCC approach is that a very high percentage of aerial images will have no animals. In the arid Tsavo NP in Kenya for example, just 2% of the 160,000 images acquired had animals present (Lamprey et al., 2019). In Uganda’s sub-humid national parks with higher density of wildlife, some 10% of images are positive (Lamprey et al., 2020). In general, therefore, over 90% of the time of OCC image interpretation is spent on True Negative (TN) images – images with no animals – and if these can be identified and eliminated then there can be significant reductions in human labor.
The next incremental step up from RSO to image-based counting is therefore to accelerate the detection of animals on images. Deep Learning (DL) offers this possibility (Tuia et al., 2022). DL is a subgroup of artificial intelligence approach regrouping machine learning methods based on artificial neural networks, capable of learning and integrating multi-level representation from large datasets (LeCun et al., 2015). Significant progress has already been made in identifying a range of key species in Africa using DL-based object detectors and aerial imagery (Kellenberger et al., 2018; Eikelboom et al., 2019; Naudé and Joubert, 2019; Torney et al., 2019; Delplanque et al., 2021; Delplanque et al., 2023). However, DL models produced biased counts because of their current high false positive rate, usually generated by animal-look-alike background objects. Thus, detections still need to be reviewed by humans. Furthermore, the field of animal detection in oblique aerial imagery is not yet as well developed as that of camera traps, where models trained on large and varied datasets are available for image (pre-)processing (Tabak et al., 2019; Shepley et al., 2021). At the moment, it is therefore often necessary to develop one’s own model for application in a given protected area.
Being aware that current DL models need humans for prediction verification, we conducted a study to determine the potential of DL for reducing the interpretation workload of OCC surveys. We asked two specific questions:
(1) When the model detects animals in an image that we know are present, how well does it locate, count and identify them?
(2) For a ‘practical’ evaluation to reduce interpretation, can the model discriminate correctly the images which do not contain animals?
2 Methods
We trained a DL model using annotations of a sample of images obtained in an SRF-OCC survey of Queen Elizabeth Protected Area in Uganda. These images had been previously visually interpreted to count animals, with the counts entered into a meta-database. An image could contain nothing and be a TN, or it could be a True Positive (TP) image with (for example) a single warthog, and/or 20 elephants and/or 100 Uganda kob. Having trained the DL model on a range of species from the annotated samples, we then tested the model on a realistic dataset, i.e. visually interpreted images that had not been used in the DL training, which contains both positive and negative images.
2.1 Study area and dataset
The study area is the Queen Elizabeth Protected Area (QEPA) located in southwestern Uganda. The census zone included the Queen Elizabeth National Park and the contiguous Kyambura and Kigezi Wildlife Reserves, covering 2,560 km² of bushed grassland, thicket, open woodlands and forest. Our study is based on aerial imagery acquired for a previous study of wildlife populations of QEPA, conducted in 2018. Only the information necessary for the understanding of the present paper is provided here, for more details the reader is referred to the study of Lamprey et al. (2023).
High-resolution images were acquired using two 24-megapixel Nikon DSLR cameras obliquely mounted at 45° through a camera hatch of a Cessna 182 aircraft. At 600 ft (183 m) above ground level coupled with an aircraft ground speed of 105 knots (194 km.hr−1), a 2 second timing interval on cameras provided a continuous sample-strip of 150 m width on the ground (‘strip-width’) with a 40% overlap between sequential images and frame footprint of 2.1 hectares. The cameras generated sequentially numbered images, stored in incremental folders on the camera cards. Flight transects were spaced at 1 km intervals and a total of 37,000 images were collected with Ground-Sampling Distance (GSD) 2.4 cm at the inner edge and 5.0 cm at the outer edge. These were manually interpreted by a team of four Ugandan interpreters during a six-week period. For each image, species name and numbers were recorded into a data spreadsheet. Where large herds spanned overlapping images, animals in the overlap area were counted into Even-Number Images (ENIs), while animals were counted in the center portion of Odd-Number Images (ONIs) to avoid any possibility of double counting. Therefore, ENIs contained total counts while ONIs contained partial counts (i.e. only the animals within the gaps between ENIs).
From the manual photo-interpretation, 12 wildlife and livestock species were detected: elephant (Loxodonta africana), buffalo (Syncerus caffer), topi (Damaliscus lunatus ssp. jimela), Uganda kob (Kobus kob ssp. thomasi), waterbuck (Kobus ellipsiprymnus ssp. defassa), warthog (Phacochoerus africanus ssp. massaicus), giant forest hog (Hylochoerus meinertzhageni), hippopotamus (Hippopotamus amphibius), crocodile (Crocodylus niloticus), cow (Bos taurus), sheep (Ovis aries) and goat (Capra hircus). Since the management of double counting is beyond the scope of this paper, only ENIs were selected. From all ENIs (18,833), approximately 70% (12,806) were randomly selected for creating annotations, used for training, validation and animal instance-based testing of the DL model, keeping the remaining 30% (6,027) for image-based model testing. Therefore two test sets were established to answer the 2 research questions: 1) the ‘animal instance-based’ test set, where the annotated points are the ground truth; it was used to answer the first question, and 2) the ‘image-based’ test set, containing less than 10% of positive images and more than 90% of negative images, where the species counts are the ground truth. This second test set served as a case study and was used to answer the second question.
The animal instance-based dataset was initially annotated as bounding boxes by a team of 4 experienced Ugandan interpreters, using VGG Image Annotator (Dutta and Zisserman, 2019). However, since point annotation has emerged as a faster and better alternative for the detection of animals with DL-based object detectors (Delplanque et al., 2022; Delplanque et al., 2023), pseudo-points were created by selecting the center of the bounding boxes. These pseudo-points were finally reviewed by an experienced annotator to obtain body-centered points, as the camera’s viewing angle, animal pose or tightness of bounding box drawn may result in a point being outside the animal’s body. This has been done using Label Studio software (Tkachenko et al., 2021). The images and points of the animal instance-based dataset were randomly split into training, validation and testing sets following a common allocation of 70%–10%–20% respectively, while taking the species numbers distribution into account (Table 1). Sheep and goat were amalgamated as a single class due to their great similarity in shape and color given the image resolution.
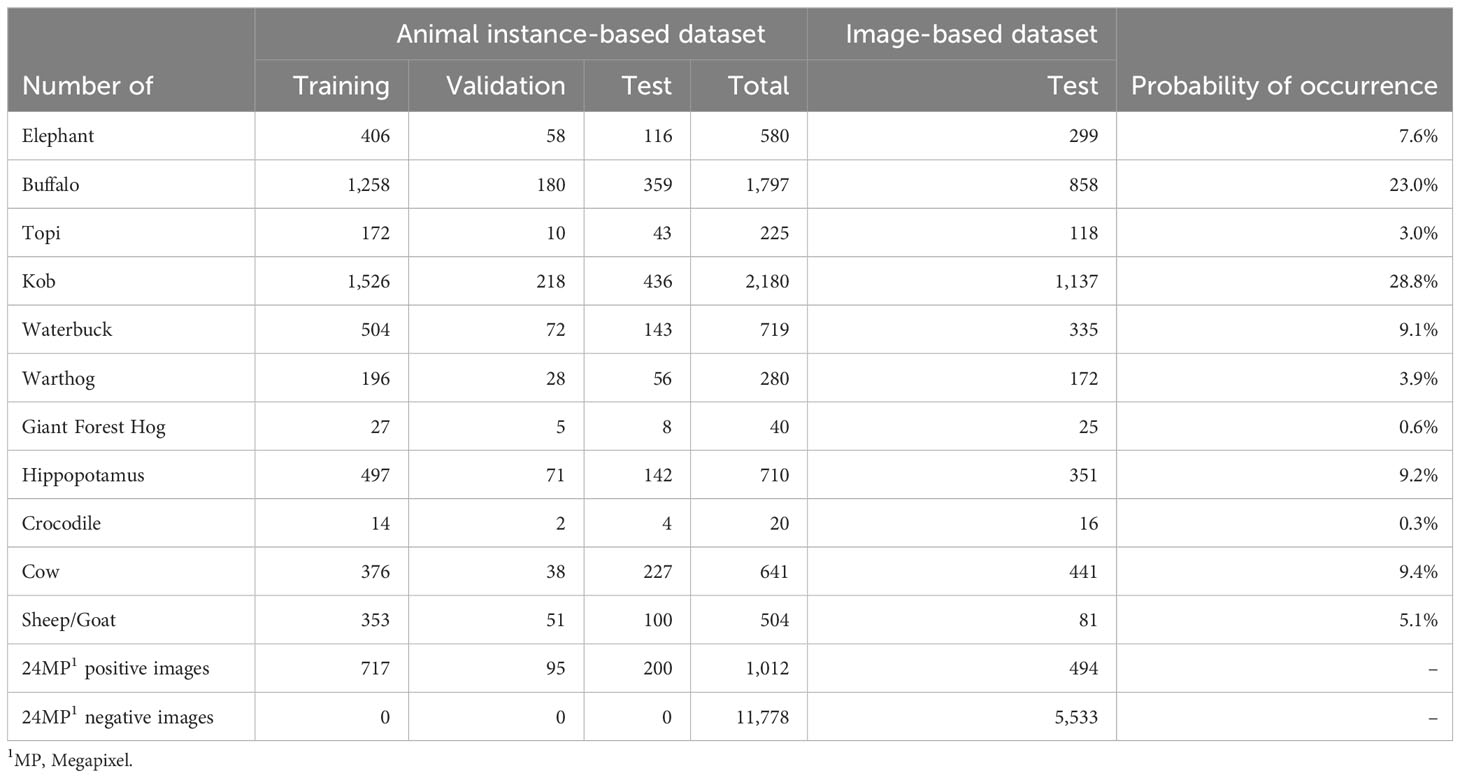
Table 1 Details of the dataset split.
2.2 Deep Learning model
Given its better performances in detecting and counting animals in oblique aerial imagery compared to common DL models, HerdNet (Delplanque et al., 2023) was chosen to process the dataset. Briefly, HerdNet is a single-stage point-based CNN consisting of two heads, one dedicated to the accurate localization of animals in the image (i.e., points), and the other to their classification, both trained in a pixel-wise manner using the Focal and the Cross-Entropy losses respectively. The training scheme was the same as that presented in Delplanque et al. (2023) and consisted of two steps: 1) training the architecture using positive patches only, and 2) harvesting and including Hard Negative Patches (HNPs) to further train the model in order to reduce the number of false positives. The patch size was set to 1,024 × 1,024 pixels and following original paper values and early ablation studies, the hyperparameters were set as follows: the learning rate to 10−5, the batch size to 2 and the number of epochs to 100. Horizontal flipping was used for data augmentation, using a 50% probability of occurrence and the Adam optimizer was used for neural network’s parameters optimization. During testing, points were obtained by extracting local maxima from the pixel map produced by the localization head, in which a pixel value close to 1 indicates the presence of an animal. Each point was then used to pin the classification maps and obtain the associated class and confidence score. An image was considered as negative if the maximum pixel value of the localization map did not exceed 0.1. Each full-resolution test image was scanned in a moving-window fashion with a patch overlap was set to 256 pixels. A radial distance threshold of 20 pixels was used to compare ground truths and detections during animal instance-based evaluation. Finally, only detections with confidence score above 50% were retained for image-based evaluation. For more details, the reader is referred to the reference paper. Operations were performed on a Windows-10 workstation using a 64 GB AMD Ryzen 9 5900X central processing unit (CPU) and an 8 GB NVIDIA GeForce RTX 3070 graphics processing unit (GPU).
HerdNet was evaluated in two ways: 1) The ‘standard’ machine learning way, by calculating common detection metrics on the animal instance-based test set, containing positive images only; and 2) The ‘practical’ way, by running the model on unseen images of the image-based test set, containing both negative and positive images, and comparing the DL model’s counts with interpreters’ visual counts. Recall, precision, and F1 score were calculated for each species on the animal instance-based test set for the standard evaluation:
where #TP, #FN, and #FP are the number of true positives (i.e., exact detection and identification), false negatives (i.e., missed animals) and false positives (i.e., wrong detections) respectively.
Recall, also referred to as ‘true positive rate’, measures the proportion of animals correctly detected and identified by the model, while precision measures the proportion of true animals among all detections. The F1 score is the harmonic mean of these two metrics and is higher when recall and precision are balanced.
Concerning the practical evaluation on the image-based test set, only counting comparisons were made as no annotated points were available for calculating the above metrics. The true counting rate, representing the proportion of the human count found by the DL model, and the counting precision, representing the ratio of human count by DL model count, were calculated for each species.
3 Results
3.1 Animal instance-based performance
All species combined, HerdNet reached 85% for both recall, precision and F1 score with little variation in performance according to distance from the aircraft (Figures 1A, B). Kob, buffalo, waterbuck and elephant were particularly well detected and located, as expressed by recall above 80% in Figure 1C. Hippopotamus and topi stood just after with a recall close to 60%, and the other species were much less detected. Except for the crocodile and the giant forest hog (i.e., minority species), the precision varied from 44 to 90%, meaning that the model produced respectively between 1.3 and 0.1 false positives per true positive. The least confused species were elephant, hippo and kob while the most confused were cow, warthog and topi. The highest confusions were between cow and buffalo and between topi and kob (Figure 2).
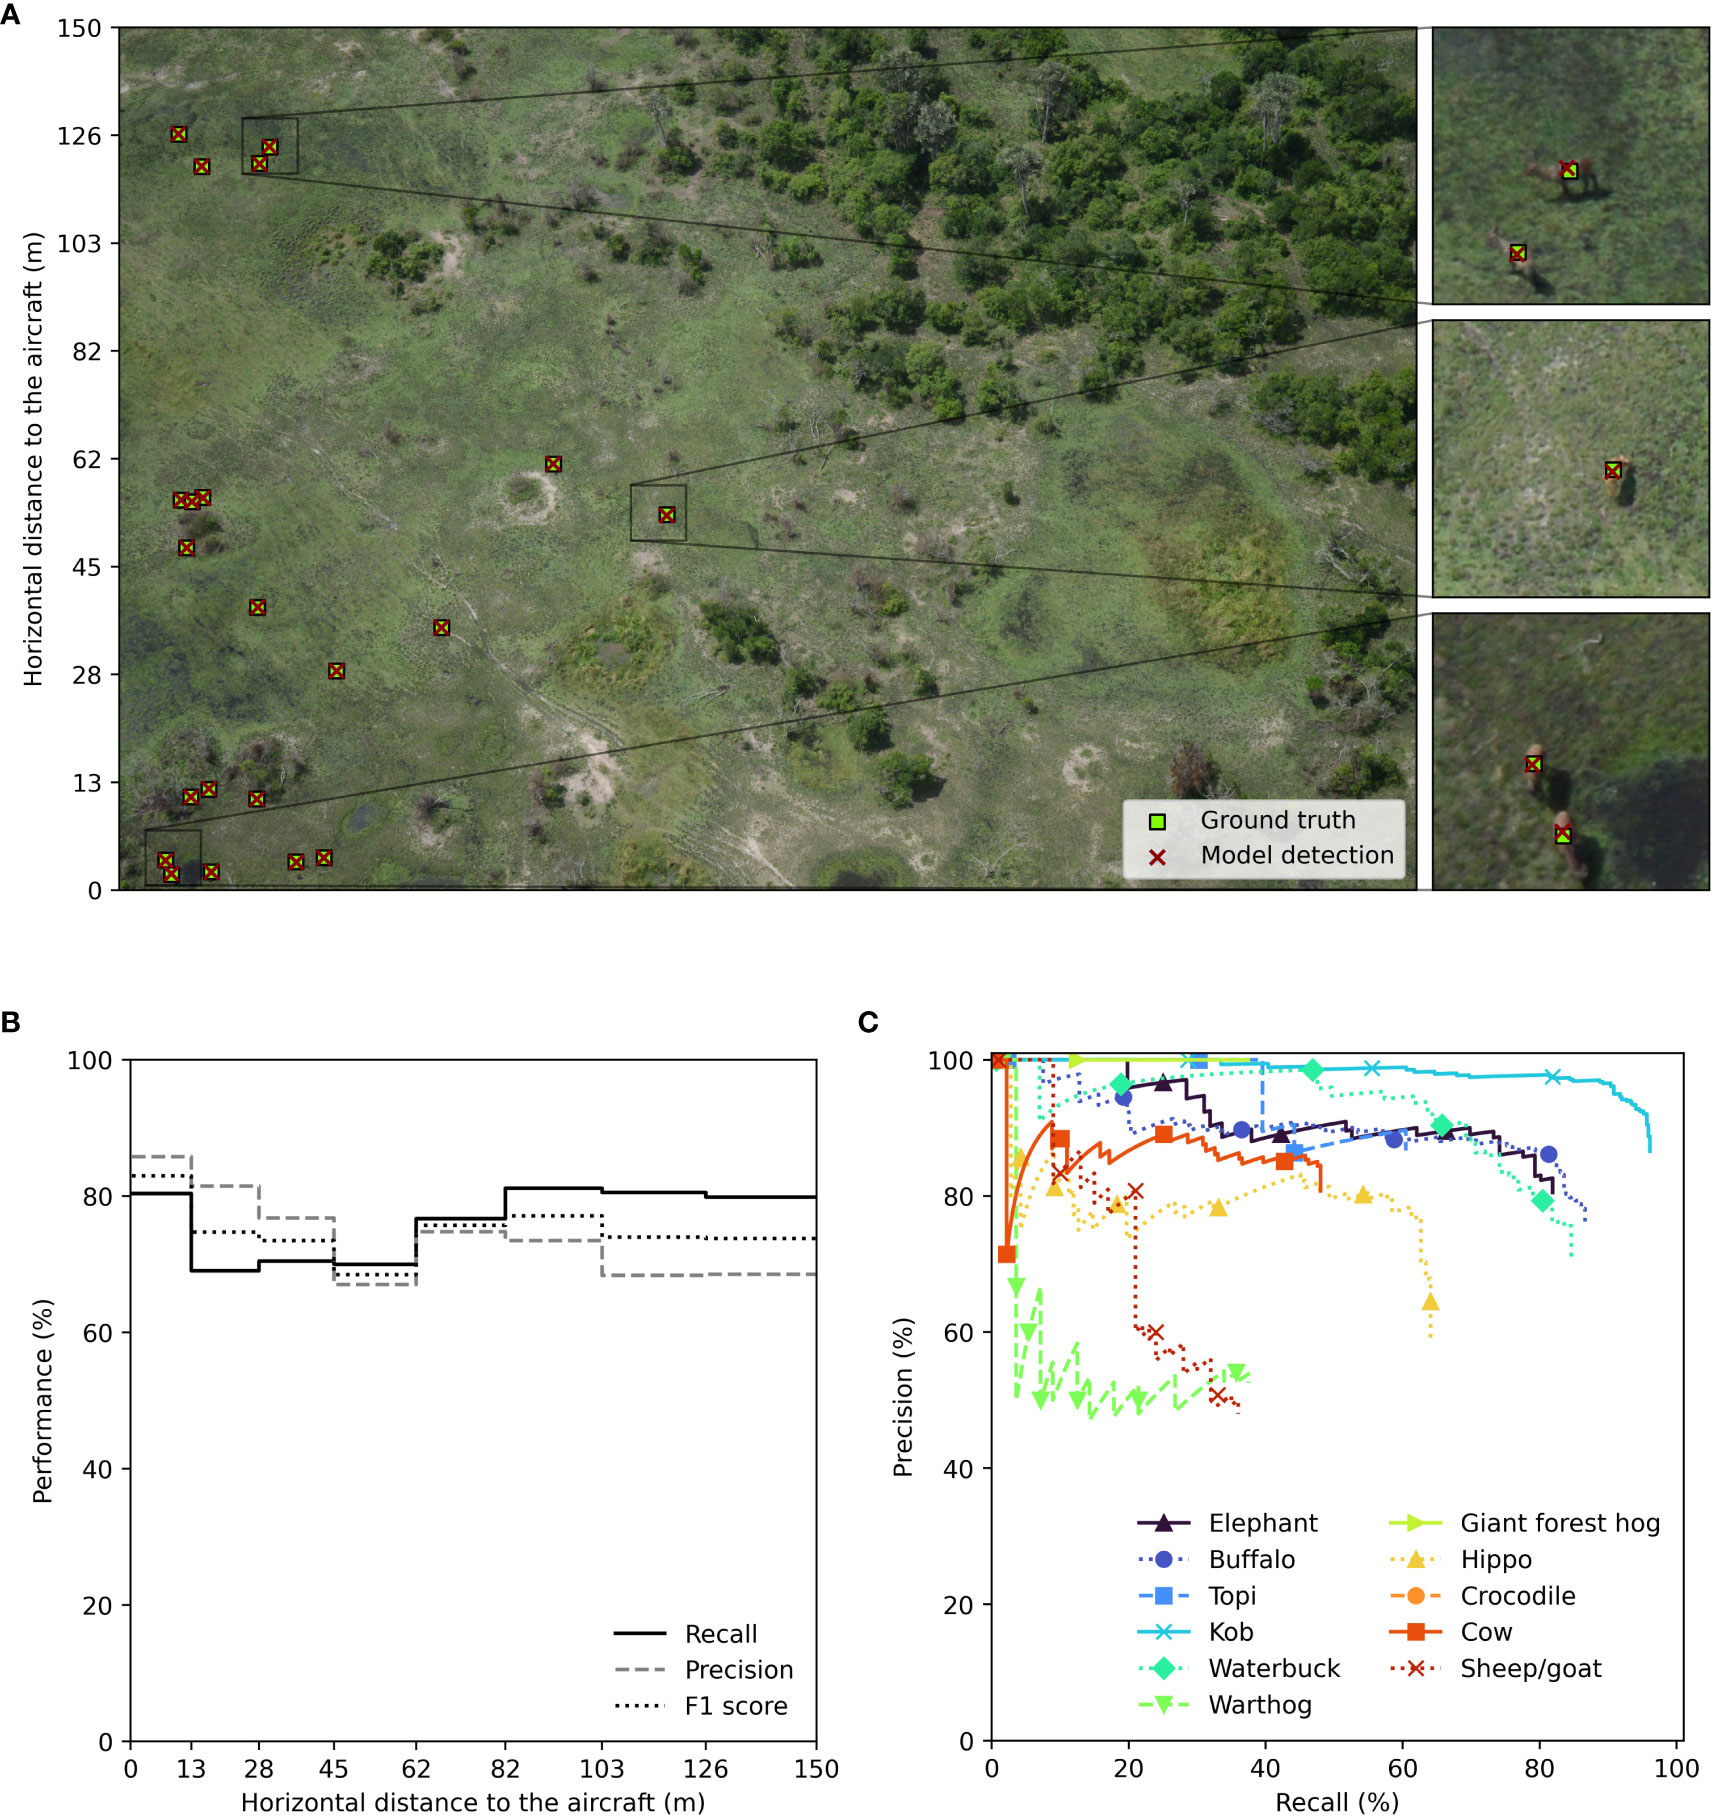
Figure 1 Animal instance-based detection performance of the DL model (HerdNet): (A) Example of model detection on a full oblique image, (B) model performance relative to the horizontal distance to the aircraft, and (C) species precision-recall curves.
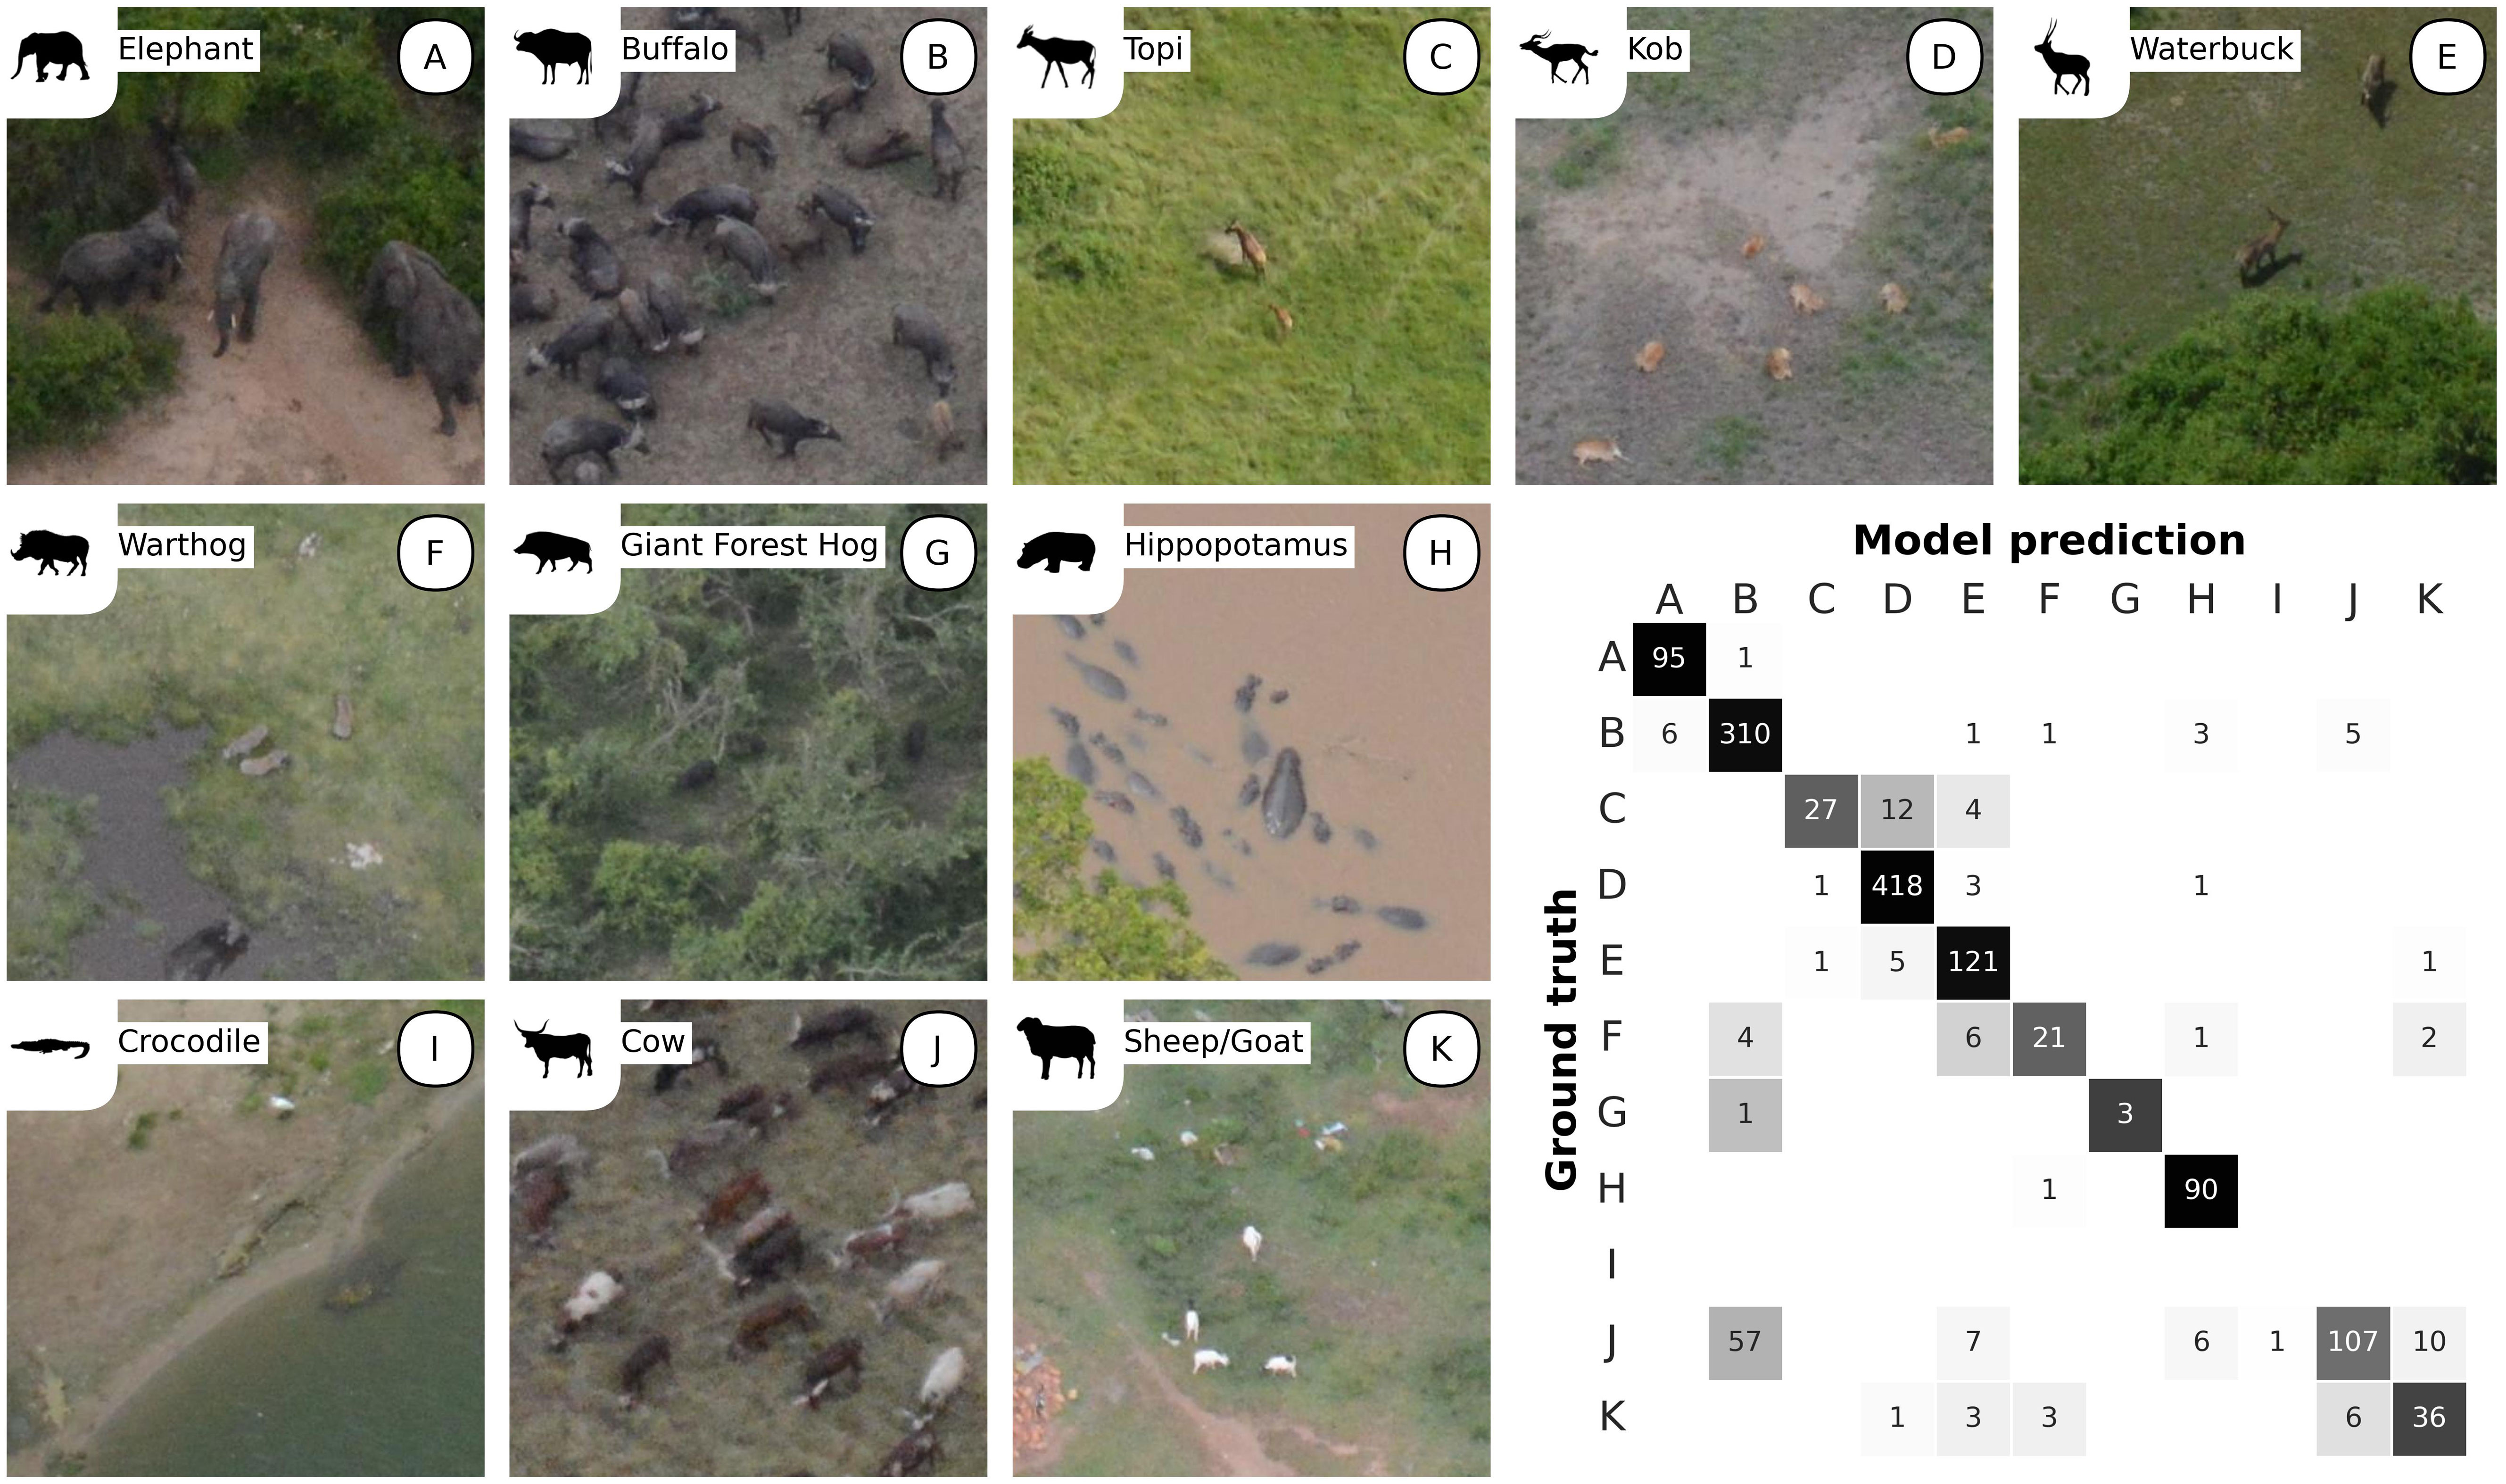
Figure 2 Animal instance-based identification performance of the DL model (HerdNet). Each species was assigned a letter for referencing in the confusion matrix (bottom right): (A) Elephant, (B) buffalo, (C) topi, (D) kob, (E) waterbuck, (F) warthog, (G) giant forest hog, (H) hippopotamus, (I) crocodile, (J) cow, and (K) sheep/goat. The confusion matrix shows the comparison between the identification assigned during annotation by the human (‘Ground truth’) and that predicted by the DL model (‘Model prediction’).
3.2 Image-based performance
From the image-based test set of 6,027 images, the DL model correctly identified 81.1% of the negative images (4,486/5,533), thus reducing the manual interpretation workload by 74.4% (4,486/6,027). The same tendency was observed when applying the model to the whole set of ENIs: HerdNet identified 80.1% of the negative images (9,487/11,778), reducing the workload by 74.1% (9,487/12,806). In addition, it is worth mentioning that the DL model processed images on the workstation at a rate of about 2.8 seconds per 24-megapixel image, which corresponded to around 10 hours for the entire ENI dataset.
Focusing on detection by species, the model guides the interpreters to 95% or more of the animals for almost all the species studied except warthog, as expressed by the high detection rate in Table 2. Overall, the model detected 98.2% of animals previously identified in the original 2018 count by interpreters. Meanwhile, the counting precision of the model was low overall at< 50%, but was reasonable for elephant (50.1%) and buffalo (54.1%), and high for topi (92.9%) and cow (90%).
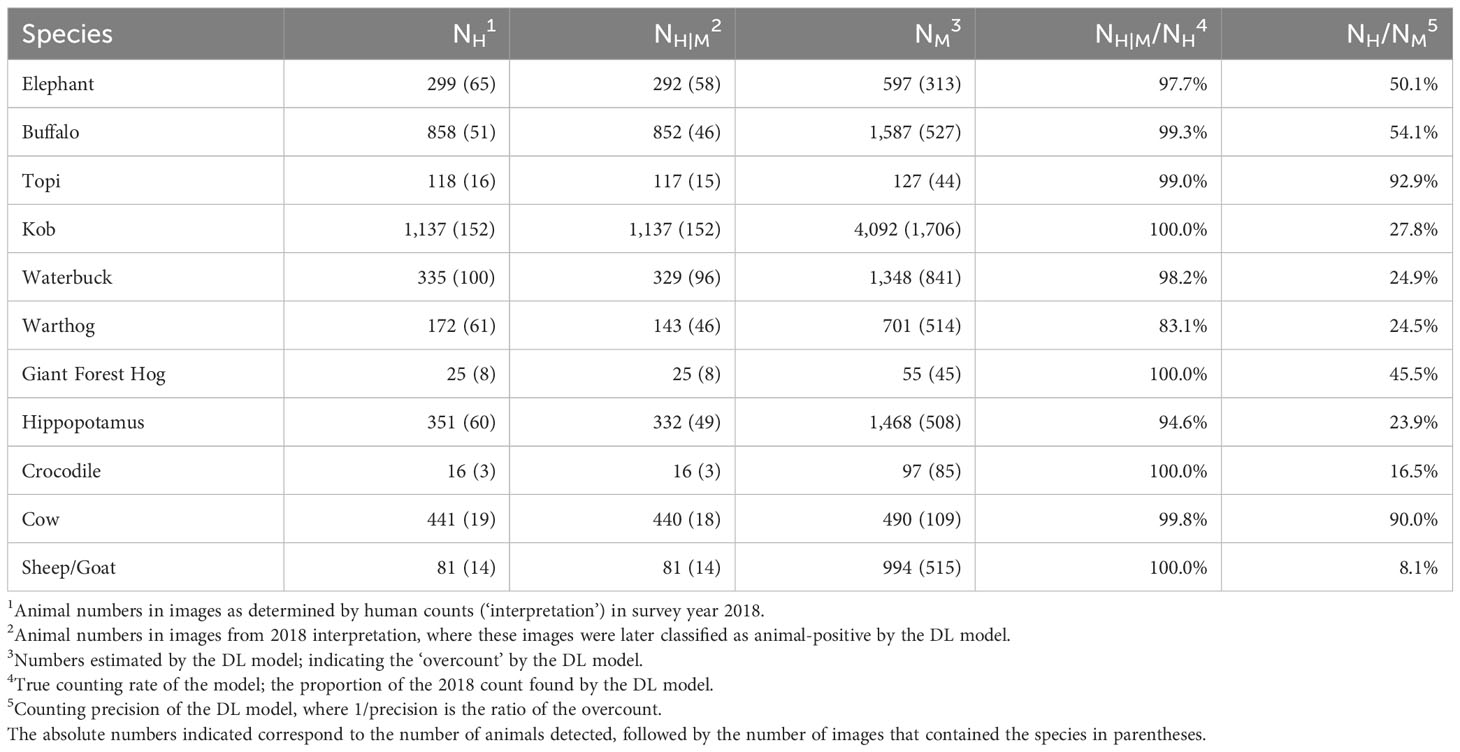
Table 2 Results of the DL model (HerdNet) on the image-based test images (N=6,027).
4 Discussion
In the context of improving multi-species SRF surveys in Africa, we trained a DL model based on aerial imagery of a Ugandan protected area acquired under standardized criteria for OCC surveys, specifically pixel density, camera angles, image footprint size and ground-sampling distance. Our DL model detected human-identified wildlife in positive images at high recall and precision rates (85%). It showed equivalent or better performance than previous DL models developed in similar conditions or habitats (Kellenberger et al., 2018; Eikelboom et al., 2019; Delplanque et al., 2021; Delplanque et al., 2023). The CNN used here (i.e., HerdNet) revealed better performance than the study of the original paper (Delplanque et al., 2023). This may be explained by the higher resolution of current images and their more controlled and standardized acquisition, which should allow for better differentiation of animals in the landscape and within herds and reduced scale variation among individuals.
As previously observed, our model struggles to detect minority species (i.e., crocodile and giant forest hog) certainly due to a lack of training samples for the CNN to develop robust features. In addition, the inherently small test sample sizes for these species reduce the statistical credibility of the performance. Some of the species showed a low recall while they do not seem more challenging to detect at first sight. This is explained by the difficulty for the model to differentiate visually related species, causing confusion between detected animals. As an example, cow and topi seemed to be poorly detected, but their recall may rise from 47% to 83%, and from 63% to 100% respectively, considering the entire group of confused detected animals (i.e. amalgamated cow and topi). Thus, majority species weighting appears to confuse identification of look-alike species (e.g., cow-to-buffalo confusion). In fact, this phenomenon is common in object detection tasks and is related to ‘foreground–foreground class imbalance’ (Oksuz et al., 2020), inherent to the imbalance of objects frequencies in nature. Future research should investigate other approaches such as efficient sampling strategies, progressive fine tuning or generative methods (e.g., Wang et al., 2017) to reduce such bias.
We were surprised by the low detection performance of sheep/goat, considering the good results of previous studies involving these species (Sarwar et al., 2021; Delplanque et al., 2023). We suspect that the use of the HNP mining method during training degraded the sheep/goat detection ability of the model. In this area in Uganda, sheep and goats were mostly found in the villages, where they are not herded (as in arid lands) but roam in small groups around households; villages were an major source of false positives due to the particular bright items found in them, appearing as ‘white shapes’ of various sizes. Training the model to discard these sheep- or goat-like objects certainly confused the model, as expressed by the 25% drop of recall obtained on the validation set after the second training step.
HerdNet thus correctly detects and counts our studied species in positive images, but what about its performance on a realistic dataset, i.e. containing less than 10% of positive images and more than 90% of negative images? We observed that our DL model succeeded in guiding interpreters to 98.2% of the animals (all species combined). It discriminated more than 80% of negative images, reducing the workload of manual interpretation by 74%. Nevertheless, the counting performance is not yet satisfactory as the model tended to overestimate the true number of animals. This is the result of a high number of false positives, typically generated by unknown or animal-like landscape items such as particular shapes of trunks, shadows, rocks, termite mounds and mud. This model behavior was expected as such landscape items have previously shown to be the main cause of false positives (Kellenberger et al., 2018; Delplanque et al., 2021). Precision could be improved by properly re-training the DL model on these particular landscape items, following a short-time human verification session.
At this time, a sufficient annotated wildlife training dataset acquired of the target area, or of areas with the same wildlife species is required to process all the image data. This training and verification can be accelerated by using point detections, because adding, deleting or moving points is much faster than adjusting bounding boxes, which makes our model more appropriate for processing aerial surveys images.
Our results confirm and validate that we have entered the era of using DL as a tool to semi-automatically process aerial survey wildlife imagery acquired under standard SRF conditions, with demonstrated effectiveness to reduce human interpretation workloads by over 70%. Humans must remain in the process to study positive images, as filtered by the DL model. Annotated image databases and models will also improve with each new acquisition, and we can therefore anticipate a growing improvement in DL models. Current counting standards such as CITES-MIKE V3 (CITES-MIKE, 2019) can now evolve further to prescribe image-based animal detection based on a combination of manual interpretation and high-performance DL models. Following surveys can invest in increased sampling effort, as the DL model is insensitive to fatigue unlike humans. This can be effected by increasing sampling strip widths, flying higher and using higher resolution cameras, such as the new generation of 40–60 MP mirrorless cameras (Lamprey et al., 2020). On one hand, this would allow for the transfer of the observers’ real-time visual counting work to the verification of the model detections. On the other hand, this would decrease the human-life risks associated with traditional aerial surveys while increasing the sampling effort at no extra costs.
In our study we have emphasized the potential use of DL for detection in strip transects. However, the method also has potential for detection in line transects where the population is calculated from a function of the drop-off of observations with distance from a line defined to the side of the aircraft (Eberhardt, 1978; Buckland et al., 2004). To date, problems in measuring distance to aircraft, together with meeting a key assumption of 100% animal detection by observers on the line itself, have precluded the wide use of line transects in Africa (Kruger et al., 2008). However, where pixel position can define the distance from the aircraft, and detection through DL is improved, our approach has the capability to greatly enhance line-transect counts.
Next work will consist of manually verifying detections and producing population estimates. This will enable us to assess the performance of our semi-automated detection model at the scale of an entire aerial survey. On a more general scale, it would be important to develop efficient semi-automated approaches to process large volumes of aerial survey images, integrating Deep Learning and humans with minimal verification time investment, to ensure accurate and precise derived estimates.
Data availability statement
The original contributions presented in the study are included in the article/supplementary files, futher inquiries can be directed to the corresponding author/s.
Author contributions
AD: Conceptualization, Data curation, Formal Analysis, Methodology, Software, Writing – original draft. RL: Conceptualization, Data curation, Formal Analysis, Methodology, Writing – original draft. SF: Writing – review & editing. JT: Writing – review & editing. PL: Supervision, Writing – review & editing.
Funding
The author(s) declare financial support was received for the research, authorship, and/or publication of this article. The work of A. Delplanque was supported under a grant from the Fund for Research Training in Industry and Agriculture (FRIA, F.R.S.-FNRS). The annotation work was supported under a grant from Global Conservation of California, USA to R. Lamprey and the WildSpace-Image-Analytics team of Uganda (www.wildspace-image-analytics.com). Sharing of annotation data was conducted under a Memorandum of Understanding between Uganda Conservation Foundation (UCF) and the University of Liege. The original aerial 2018 survey of QENP, from which this experimental imagery was collected, was funded by UCF with support from Global Conservation, Vulcan Inc., Save the Elephants and the Uganda Wildlife Authority.
Acknowledgments
We are grateful to Jeff Morgan of Global Conservation and Mike Keigwin of the Uganda Conservation Foundation who supported R. Lamprey and the WildSpace-Image-Analytics team in Uganda in conducting the first-stage image annotation work of this project. We would like to thank the Uganda Wildlife Authority for their assistance in the original QEPA aerial survey of 2018, and especially to Mr Charles Tumwesigye, Director of Conservation at UWA, who kindly obtained the necessary authorizations.
Conflict of interest
The authors declare that this study received funding from the not-for-profit organizations Uganda Conservation Foundation, Global Conservation, Save the Elephants, Vulcan Inc. and Uganda Wildlife Authority. The funders were not involved in the study design, collection, analysis, interpretation of data, the writing of this article or the decision to submit it for publication.
Publisher’s note
All claims expressed in this article are solely those of the authors and do not necessarily represent those of their affiliated organizations, or those of the publisher, the editors and the reviewers. Any product that may be evaluated in this article, or claim that may be made by its manufacturer, is not guaranteed or endorsed by the publisher.
References
Bröker K. C. A., Hansen R. G., Leonard K. E., Koski W. R., Heide-Jørgensen M. P. (2019). A comparison of image and observer based aerial surveys of narwhal. Mar. Mammal Sci. 35 (4), 1253–1279. doi: 10.1111/mms.12586
Brummitt N., Regan E. C., Weatherdon L. V., Martin C. S., Geijzendorffer I. R., Rocchini D., et al. (2017). Taking stock of nature: Essential biodiversity variables explained. Biol. Conserv. 213, 252–255. doi: 10.1016/j.biocon.2016.09.006
Buckland S. T., Anderson D. R., Burnham K. P., Laake J. L., Borchers D. L., Thomas L. (2004). Advanced distance sampling. (Oxford, United Kingdom: Oxford University Press).
Caughley G., Goddard J. (1975). Abundance and distribution of elephants in the Luangwa Valley, Zambia. Afr. J. Ecol. 13 (1), 39–48. doi: 10.1111/j.1365-2028.1975.tb00122.x
CITES-MIKE (2019). Monitoring the Illegal Killing of Elephants: Aerial Survey Standards for the MIKE Programme. Version 3.0. Convention on International Trade in Endangered Species - Monitoring the Illegal Killing of Elephants Programme (CITES-MIKE) (Nairobi, Kenya: United Nations Environment Programme).
Craig G. C. (2012). Aerial survey standards for the CITES-MIKE Programme, Version 2 (UNEP/DELC, Nairobi, Kenya: CITES-MIKE Programme).
Delplanque A., Foucher S., Lejeune P., Linchant J., Théau J. (2021). Multispecies detection and identification of African mammals in aerial imagery using convolutional neural networks. In: Remote Sens. Ecol. Conserv. 8 (2), pp.166–pp.179. doi: 10.1002/rse2.234
Delplanque A., Foucher S., Lejeune P., Théau J. (2022). “Counting African mammal herds in aerial imagery using deep learning: are anchor-based algorithms the most suitable?,” in 10th International Conference on Agro-Geoinformatics and 43rd Canadian Symposium on Remote Sensing, Québec, Canada. 14 July 2022. https://hdl.handle.net/2268/293320.
Delplanque A., Foucher S., Théau J., Bussière E., Vermeulen C., Lejeune P. (2023). From crowd to herd counting: how to precisely detect and count African mammals using aerial imagery and deep learning? ISPRS J. Photogrammetry Remote Sens. 197, 167–180. doi: 10.1016/j.isprsjprs.2023.01.025
Dutta A., Zisserman A. (2019). “The VIA annotation software for images, audio and video,” in Proceedings of the 27th ACM International Conference on Multimedia, New York, USA. (Association for Computing Machinery, New York (United States of America)), p.2276–2279. doi: 10.1145/3343031.3350535
Eberhardt L. L. (1978). Transect methods for population studies. J. Wildl. Manage. 42 (1), 1–31. doi: 10.2307/3800685
Eikelboom J. A. J., Wind J., van de Ven E., Kenana L. M., Schroder B., de Knegt H. J., et al. (2019). Improving the precision and accuracy of animal population estimates with aerial image object detection. Methods Ecol. Evol. 10 (11), 1875–1887. doi: 10.1111/2041-210x.13277
Fleming P. J. S., Tracey J. P. (2008). Some human, aircraft and animal factors affecting aerial surveys: how to enumerate animals from the air. Wildl. Res. 35 (4), 258. doi: 10.1071/wr07081
Grimsdell J. J. R., Westley S. B. (1981). Low-level aerial survey techniques. Addis Ababa: Monograph 4 (Addis Ababa (Ethiopia): International Livestock Centre for Africa).
Gwynne M. D., Croze H. (1975). “East African habitat monitoring practice: a review of methods and application,” in Evaluation and Mapping of Tropical African Rangelands; Proceedings of the Seminar in Bamako, Mali. (International Livestock Centre for Africa, Addis Ababa (Ethiopia)), 95–136.
Jachmann H. (2001). Estimating the abundance of African wildlife (New York United States of America: Springer Science & Business Media).
Jachmann H. (2002). Comparison of aerial counts with ground counts for large African herbivores. J. Appl. Ecol. 39 (5), 841–852. doi: 10.1046/j.1365-2664.2002.00752.x
Jetz W., McGeoch M. A., Guralnick R., Ferrier S., Beck J., Costello M. J., et al. (2019). Essential biodiversity variables for mapping and monitoring species populations. Nat. Ecol. Evol. 3 (4), 539–551. doi: 10.1038/s41559-019-0826-1
Jolly G. M. (1969). Sampling methods for aerial censuses of wildlife populations. East African. Agric. Forest. J. 34 (1), 46–49. doi: 10.1080/00128325.1969.11662347
Kellenberger B., Marcos D., Tuia D. (2018). Detecting mammals in UAV images: Best practices to address a substantially imbalanced dataset with deep learning. Remote Sens. Environ. 216, 139–153. doi: 10.1016/j.rse.2018.06.028
Kruger J. M., Reilly B. K., Whyte I. J. (2008). Application of distance sampling to estimate population densities of large herbivores in Kruger National Park. Wildl. Res. 35 (4), 371–376. doi: 10.1071/WR07084
Lamprey R. H., Keigwin M., Tumwesigye C. (2023)A high-resolution aerial camera survey of Uganda’s Queen Elizabeth Protected Area improves detection of wildlife and delivers a surprisingly high estimate of the elephant population (Accessed February 15, 2023).
Lamprey R. H., Ochanda D., Brett R., Tumwesigye C., Douglas-Hamilton I. (2020). Cameras replace human observers in multi-species aerial counts in Murchison Falls, Uganda. Remote Sens. Ecol. Conserv. 6, 529–545. doi: 10.1002/rse2.154
Lamprey R. H., Pope F., Ngene S., Norton-Griffiths M., Frederick H., Okita-Ouma B., et al. (2019). Comparing an automated high-definition oblique camera system to rear-seat-observers in a wildlife survey in Tsavo, Kenya: Taking multi-species aerial counts to the next level. Biol. Conserv. 241, 108243. doi: 10.1016/j.biocon.2019.108243
LeCun Y., Bengio Y., Hinton G. (2015). Deep learning. Nature 521 (753), 436–444. doi: 10.1038/nature14539
Lethbridge M., Stead M., Wells C. (2019). Estimating kangaroo density by aerial survey: A comparison of thermal cameras with human observers. Wildl. Res. 46 (8), 639–648. doi: 10.1071/WR18122
Naudé J., Joubert D. (2019). “The aerial elephant dataset: A new public benchmark for aerial object detection,” in Proceedings of the IEEE/CVF Conference on Computer Vision and Pattern Recognition Workshops, (Institute for Electrical and Electronics Engineers (IEEE), New York City (United States of America)) Vol. pp. 48–55.
Norton-Griffiths M. (1978). Counting animals (Washington DC: African Wildlife Foundation Handbook Number 1).
Ogutu J. O., Piepho H. P., Said M. Y., Ojwang G. O., Njino L. W., Kifugo S. C., et al. (2016). Extreme wildlife declines and concurrent increase in livestock numbers in Kenya: What are the causes? PloS One 11 (9), 1–46. doi: 10.1371/journal.pone.0163249
Oksuz K., Cam B. C., Kalkan S., Akbas E. (2020). Imbalance problems in object detection: A review. IEEE Trans. Pattern Anal. Mach. Intell. 43 (10), 3388–3415. doi: 10.1109/TPAMI.2020.2981890
Ottichilo W. K., Khaemba W. M. (2001). Validation of observer and aircraft calibration for aerial surveys of animals. Afr. J. Ecol. 39 (1), 45–50. doi: 10.1046/j.1365-2028.2001.00268.x
PAEAS (2014). Aerial survey standards and guidelines for the Pan-African Elephant Aerial Survey (Seattle, USA: Vulcan Inc).
Peng J., Wang D., Liao X., Shao Q., Sun Z., Yue H., et al. (2020). Wild animal survey using UAS imagery and deep learning: modified Faster R-CNN for kiang detection in Tibetan Plateau. ISPRS J. Photogrammetry Remote Sens. 169, 364–376. doi: 10.1016/j.isprsjprs.2020.08.026
Pennycuick C. J., Western D. (1969). An investigation of some sources of bias in aerial transect sampling of large mammal populations. Afr. J. Ecol. 10 (3), pp.175–pp.191. doi: 10.1111/j.1365-2028.1972.tb00726.x
Sarwar F., Griffin A., Rehman S. U., Pasang T. (2021). Detecting sheep in UAV images. Comput. Electron. Agric. 187, 106219. doi: 10.1016/j.compag.2021.106219
Schlossberg S., Chase M. J., Griffin C. R. (2016). Testing the accuracy of aerial surveys for large mammals: An experiment with African savanna elephants (Loxodonta africana). PloS One 11 (10), e0164904. doi: 10.1371/journal.pone.0164904
Shepley A., Falzon G., Meek P., Kwan P. (2021). Automated location invariant animal detection in camera trap images using publicly available data sources. Ecol. Evol. 11, 4494–4506. doi: 10.1002/ece3.7344
Stelfox J. G., Peden D. G. (1981). “The aerial survey programme of the Kenya Rangeland Ecological Monitoring Unit,” in Low-Level Aerial Survey Techniques. Eds. Grimsdell J. J. R., Westley S. B. (Addis Ababa, Ethiopia: ILCA Monographs 4), 69–83.
Tabak M. A., Norouzzadeh M. S., Wolfson D. W., Sweeney S. J., VerCauteren K. C., Snow N. P., et al. (2019). Machine learning to classify animal species in camera trap images: Applications in ecology. Methods Ecol. Evol. 10 (4), 585–590. doi: 10.1111/2041-210X.13120
Tkachenko M., Malyuk M., Shevchenko N., Holmanyuk A., Liubimov N. (2021) Label Studio: Data labeling software [Python]. Available at: https://github.com/heartexlabs/label-studio.
Torney C. J., Lloyd-Jones D. J., Chevallier M., Moyer D. C., Maliti H. T., Mwita M., et al. (2019). A comparison of deep learning and citizen science techniques for counting wildlife in aerial survey images. Methods Ecol. Evol. 10 (6), 779–787. doi: 10.1111/2041-210X.13165
Tuia D., Kellenberger B., Beery S., Costelloe B. R., Zuffi S., Risse B., et al. (2022). Perspectives in machine learning for wildlife conservation. Nat Commun. 13 (1), 792. doi: 10.1038/s41467-022-27980-y
Wang X., Shrivastava A., Gupta A. (2017). “A-fast-rcnn: Hard positive generation via adversary for object detection,” in Proceedings of the IEEE conference on computer vision and pattern recognition. (New York City, United States of America: Institute for Electrical and Electronics Engineers (IEEE)), 2606–2615.
Keywords: wildlife, aerial survey, Deep Learning, remote sensing, convolutional neural networks, animal conservation, livestock, object detection
Citation: Delplanque A, Lamprey R, Foucher S, Théau J and Lejeune P (2023) Surveying wildlife and livestock in Uganda with aerial cameras: Deep Learning reduces the workload of human interpretation by over 70%. Front. Ecol. Evol. 11:1270857. doi: 10.3389/fevo.2023.1270857
Received: 01 August 2023; Accepted: 31 October 2023;
Published: 17 November 2023.
Edited by:
Erhan Sener, Süleyman Demirel University, TürkiyeReviewed by:
Peter John Sabine Fleming, NSW Government, AustraliaBenjamin Kellenberger, Yale University, United States
Copyright © 2023 Delplanque, Lamprey, Foucher, Théau and Lejeune. This is an open-access article distributed under the terms of the Creative Commons Attribution License (CC BY). The use, distribution or reproduction in other forums is permitted, provided the original author(s) and the copyright owner(s) are credited and that the original publication in this journal is cited, in accordance with accepted academic practice. No use, distribution or reproduction is permitted which does not comply with these terms.
*Correspondence: Alexandre Delplanque, YWxleGFuZHJlLmRlbHBsYW5xdWVAdWxpZWdlLmJl; Richard Lamprey, bGFtcHJleS5yaWNoYXJkQGdtYWlsLmNvbQ==