 Yaosheng Liu1
 Ang Li
95% of researchers rate our articles as excellent or good
Learn more about the work of our research integrity team to safeguard the quality of each article we publish.
Find out more
ORIGINAL RESEARCH article
Front. Ecol. Evol. , 04 September 2023
Sec. Environmental Informatics and Remote Sensing
Volume 11 - 2023 | https://doi.org/10.3389/fevo.2023.1255384
This article is part of the Research Topic Response and Catastrophe Mechanisms of Geotechnical Underground Exploration: Theories and Numerical Modeling View all 14 articles
Engineering projects are confronted with many problems resulting from overbreak in tunnel blasting, necessitating the optimization of design parameters to minimize overbreak. In this study, an AI-based model for overbreak prediction and optimization is proposed, aiming to mitigate the hazards associated with overbreak. Firstly, the Extreme Gradient Boosting (XGBoost) model is integrated with three distinct metaheuristic algorithms, namely Particle Swarm Optimization (PSO), Whale Optimization Algorithm (WOA), and Sparrow Search Algorithm (SSA), respectively. Consequently, the hyperparameters are optimized, and the performance of predictions is enhanced. Meanwhile, to overcome the limitations of a small dataset and enhance the generalization ability of the three developed models, a 5-fold cross-validation is employed. Then, the performance of the different models with five distinct swarm sizes is evaluated via four metrics, including coefficient of determination (), mean square error (), mean absolute error (), and variance accounted for (). Subsequently, by comparing the aforementioned developed models, the optimal prediction model with the highest accuracy can be obtained, which is then used for parameter optimization research. Finally, individual studies are conducted to address the issue of overbreak caused by the adoption of identical blasting parameters due to geological variations, aiming to minimize overbreak in different sections of the tunnel. By comparing the optimization abilities of PSO, WOA, and SSA, the objective of finding the minimum value of overbreak within a short timeframe is achieved. The results indicate that the model developed in this study accurately predicts overbreak, and effectively optimizes blast parameters for different sections of the tunnel.
Drilling and blasting methods are widely used in tunnel excavation due to their cost-effectiveness and unique rock-breaking approach (Zare and Bruland, 2006; Mandal et al., 2008; Ak et al., 2009; Wang et al., 2018; Tian et al., 2019). However, a multitude of adverse consequences often occur during the actual process of tunnel blasting (Zhao et al., 2022; Zhao et al., 2023), encompassing the phenomena of overbreak and underbreak. Overbreak is defined as the excavation profile exceeding the design profile, while underbreak refers to the design profile less than the intended excavation profile (Koopialipoor et al., 2019b). In summary, overbreak is mainly influenced by the geological conditions and blasting design factors (Jang and Topal, 2013; Mottahedi et al., 2018). While geological parameters are often measured but cannot be altered (Mohammadi and Azad, 2020; Chai et al., 2023), contrast with design parameters, which can be adjusted as per specific circumstances (Jang and Topal, 2013). Consequently, optimizing blasting design parameters becomes an imperative measure to mitigate overbreak and underbreak. Compared to underbreak, the occurrence frequency of overbreak is often higher in practical engineering projects (Foderà et al., 2020). Overbreak results in resource wastage and compromises the stability of the surrounding rock, thereby posing hazards to tunnel construction and operation (Mohammadi et al., 2015; Tang et al., 2019; Chen et al., 2021). Hence the optimization of tunnel blasting design parameters is necessitated, resulting in the minimization of the extent of overbreak induced by tunnel blasting.
To address the challenge of optimizing blasting design to minimization overbreak, the initial step involves the precise prediction of overbreak induced by various tunnel blasting designs. Extensive research has been conducted, employing various methods to predict overbreak in tunnel construction, including empirical, statistical, and numerical approaches. For instance, Jang et al. (2019) proposed an empirical approach by analyzing the relationship between overbreak and its influencing factors, introducing a resistance factor for predicting overbreak caused by blasting. Dey and Murthy (2012), based on statistical analysis, established the relationship between overbreak and rock parameters, explosive parameters, and blasting design parameters to develop a comprehensive overbreak prediction model, demonstrating an error within 10%. Daraei and Zare (2018) first simulated the excavation damage zone in tunnel excavation using numerical simulation, and then calculated the depth of overbreak using a rock strength factor.
Factors contributing to overbreak typically encompass multiple blasting parameters (Salmi and Sellers, 2021). However, due to the nonlinear relationship between these parameters and the ultimate overbreak, formulating an equation that accurately accounts for all factors is challenging (He et al., 2023). In this context, artificial intelligence (AI) emerges as a burgeoning and highly promising technology, showcasing its advantages in tackling complex nonlinear problems and achieving high predictive performance. Research on utilizing AI for predicting overbreak is increasingly prevalent (Koopialipoor et al., 2019c; He et al., 2023). For example, Koopialipoor et al. (2019c) developed an artificial neural network (ANN) model optimized using a genetic algorithm (GA) to predict overbreak. The performance of the models was evaluated based on , , and values between the predicted and measured values, leading to the conclusion that the GA-ANN model exhibited superior predictive capability. Five neural network overbreak prediction models were established by Jang et al. (2019), followed by a thorough analysis of the influential factors impacting overbreak to distinguish their contributions to overbreak.
Once overbreak can be accurately predicted, key steps in reducing overbreak can be taken through optimizing blasting design based on the prediction model. In previous studies, the focus was mainly on establishing accurate prediction models and forming overbreak warning and prevention systems. Specifically, for a given engineering project, design parameters were input into the prediction model to obtain the overbreak value associated with those parameters. If the obtained overbreak value exceeded the requirement, design parameters were adjusted accordingly to minimize overbreak. For instance, Jang and Topal (2013) developed a system that accurately predicts overbreak by comparing different prediction models. They demonstrated that this model could serve as an overbreak warning system, providing a basis for adjusting actual blasting parameters. In recent years, the widespread utilization of heuristic algorithms has opened up new directions for optimization design. Within the realm of meeting design criteria, the exploration for blast parameters that minimize overbreak and correspond to the minimal value of overbreak can be pursued. For example, Koopialipoor et al. (2019b) employed the Artificial Bee Colony algorithm to seek the minimum overbreak value for a Rock Mass Rating (RMR) of 36, resulting in a 47% reduction compared to the unoptimized overbreak value.
The aforementioned prediction and optimization models have achieved significant progress, yet some issues still remain. Firstly, as previously analyzed, one significant cause of overbreak is geological factors. Due to the varying formation mechanisms in different sections of the tunnel face, employing the same blasting parameters can lead to severe overbreak (Zhang, 2019). Therefore, it is essential to predict and optimize overbreak for different tunnel sections separately. Secondly, in the construction of existing overbreak prediction models, the selection of hyperparameters may not adhere to standardized methods and may overlook certain more effective hyperparameters (Dimitraki et al., 2019; Li et al., 2021b). Additionally, the absence of cross-validation in previous research studies makes the results less persuasive (Ebrahimi et al., 2016). Finally, most studies have focused solely on overbreak prediction and the comparison of different prediction models, with limited research on actual parameter optimization. Some parameter optimization studies are specific to particular projects, lacking widespread applicability. While utilizing metaheuristic algorithms for overbreak optimization is promising, its accuracy also needs to be validated.
In this study, an AI-based overbreak prediction and optimization model is proposed, which can accurately predict overbreak and optimize parameters to minimize overbreak. In Sect. 2, a database is collected and established for model training. The basic algorithms for model prediction and parameter optimization are introduced in Sect. 3. Sect. 4 focuses on the auxiliary means and initial parameter settings during the model construction process. In Sect. 5, all prediction models are compared using four evaluation metrics, and the best prediction model is selected. Finally, three methods are employed in Sect. 6 to separately optimize blasting parameters for achieving the minimum overbreak.
To assess the relationship between various influencing factors and overbreak in tunnel excavation, a comprehensive dataset encompassing different tunnel face sections is essential for the prediction and optimization of overbreak. In this study, 95 groups of blasting overbreak datasets were collected from Zhang (2019) for the purpose of predicting overbreak area and optimizing blasting parameters, which 48 groups were associated with the upper section of the tunnel face spanning from the arch crown to the shoulder (crown to shoulder), while 47 groups were attributed to the lower section encompassing the tunnel shoulder to the haunch (shoulder to haunch).
The dataset consisted of 12 input parameters and one output parameter. The input parameters comprised the uniaxial compressive strength of surrounding rock () (MPa), Surrounding Rock Grade (), jointing degree (), depth of burial () (m), number of blastholes (), spacing between perimeter holes () (cm), spacing between relief holes (SR) (cm), burden of perimeter holes () (cm), total explosive charge () (kg), explosive charge structure of perimeter holes (), and maximum charge per single cut hole () (kg), charge concentration of perimeter holes () (kg/m). The output parameter, on the other hand, represented the overbreak area () ().
The distribution ranges for each parameter were visualized using violin plots with boxes, as shown in Figure 1. The central bold pentagram denoted the median of each parameter, while the black rectangular box represented the range from the lower quartile to the upper quartile. The black lines indicated 1.5 times the interquartile range (). The original dataset was divided, with 80% allocated for training purposes and the remaining 20% withheld for testing the performance of the developed model (Li et al., 2021b).
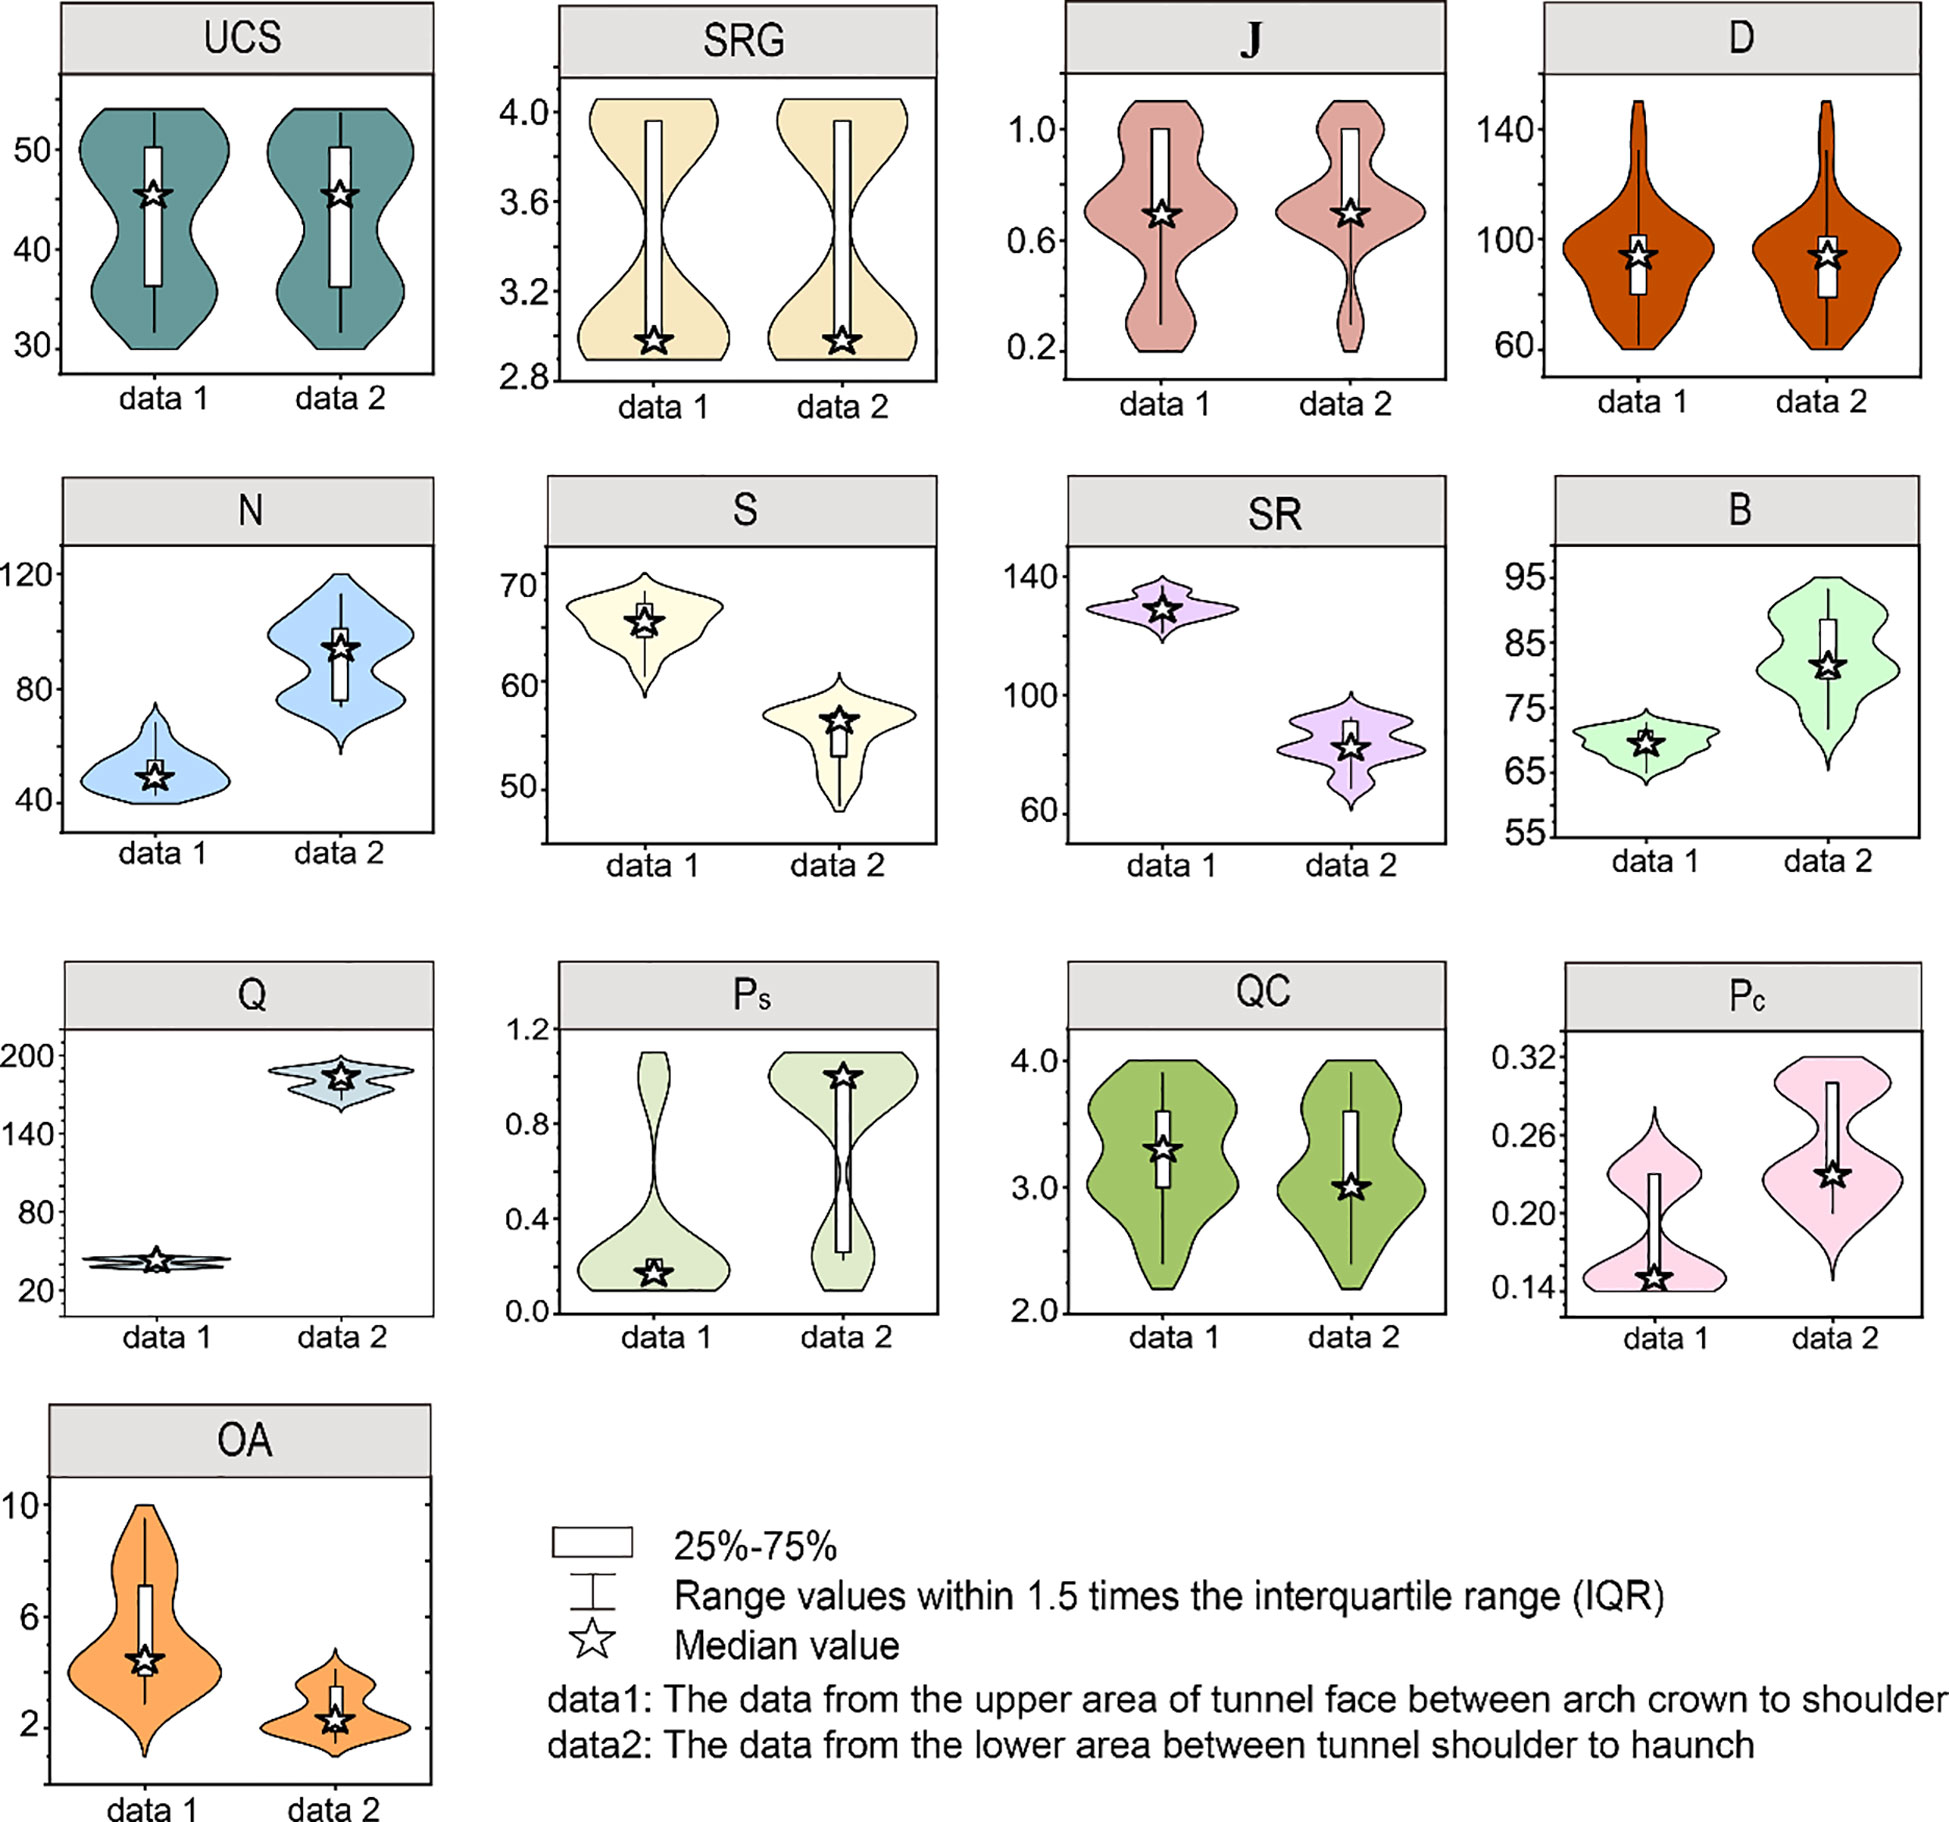
Figure 1 The data distribution of all parameters employed in the development of models obtained from Zhang (2019).
XGBoost, a highly efficient, flexible, and portable optimized distributed gradient boosting tree, is specifically designed to enhance performance (Chen and Guestrin, 2016). It has been convincingly proven that XGBoost is an immensely effective approach for addressing both regression and classification tasks (Zhou et al., 2016; Xu et al., 2019; Ding et al., 2020; Nguyen et al., 2020).
XGBoost has experienced meticulous optimizations based on the original Gradient Boosting Decision Tree, resulting in enhanced performance and prevention of overfitting. The prediction target in the dataset , which comprises samples and features, is modeled as an additive combination of base models. This is expressed as (Qiu et al., 2021):
where represents the prediction value for the ith sample; represents the i-th data sample, and denotes the the i-th sample experiences a base model transformation; represents the collection of regression trees, which comprises a set of tree structure parameters denoted by , and ; denotes the weighting of the terminal nodes within the regression trees, whereas represents the number of leaves.
The XGBoost algorithm employs a second-order Taylor expansion on the objective function, which is composed of two parts i.e. the loss function and the regularization term. The aim is to assess the operational efficiency of the algorithm. The traditional representation of the loss function is as Eq. (3):
While the regularization term can be expressed by Eq. (4):
where is the i-th instance in the dataset, while represents the aggregate volume of data utilized in the -th tree; and are utilized to adapt the intricacy of the tree (Qiu et al., 2021).
PSO stands as a prominent metaheuristic algorithm, initially put forth by Kennedy and Eberhart (1995). This algorithm finds its inspiration from the foraging behaviors witnessed among avian flocks and fish schools, showcasing its adaptive and exploratory nature.
During the search process, individual particles are treated as autonomous entities with unique attributes of velocity and position. The velocity attribute corresponds to the speed of particle movement, while the position attribute indicates the direction in which the particle is headed. The assessment of each is contingent upon the employed problem-solving methodology, while the individual optimum solution refers to the most favorable solution found by a single particle. The global optimal solution is ascertained by selecting the most superior solution among these individual optimal solutions and subsequently contrasting it with the past historical global optimum. Throughout the iterative process, the velocities and positions of the particles experience constant adjustments, ultimately converging towards the globally optimal solution. The update equations for the particle velocity () and position () are presented as follows:
where denotes the -th particle in the population, while represents the search dimension; where denotes the present iteration count, represents the inertia weight, assumes a critical role in effectively harmonizing the delicate balance between local exploitation and global exploration capabilities within the algorithm (Poli et al., 2007); and denote the acceleration coefficients that govern learning behavior of the particle; and represent random numbers in the range (0,1); denotes the best solution found by each particle individually, while represents the overall best solution found globally.
WOA is an innovative optimization algorithm rooted in the swarm intelligence exhibited by whales in their foraging behavior (Mirjalili and Lewis, 2016). The primary objective of whale foraging behavior is to capture prey. In a collective search for prey, there is always a whale that detects the prey first. Subsequently, other whales swim towards the leading whale to compete for the prey. This predatory behavior serves as a basis for the problem-solving process in WOA, wherein an individual whale represents a solution, and multiple solutions are embodied by multiple whale individuals. Employing WOA to search for problem solutions entails the continuous updating of positions by multiple whale individuals until a satisfactory solution is obtained.
Before applying WOA for problem-solving purposes, it is crucial to formulate mathematical equations that accurately depict the three distinct predatory behaviors of whales: encircling prey, bubble-net attacking, and searching for prey. These equations will serve as the foundation for simulating the problem-solving process using WOA, where individual whales represent potential solutions and their positions are continuously updated until a satisfactory solution is found.
1) In the encircling prey behavior, the global optimal position is considered to be the closest position to the prey. Once an individual whale detects the prey, it will swim towards the location of the global optimum, utilizing it as the target for updating its own position. This process involves gradually reducing the encirclement around the prey. The underlying principle can be summarized as follows:
where denotes the present iteration count, whereas denotes the size of the encircling step; denotes the most optimal solution in the context of the problem being addressed; The coefficient vectors, and , are of utmost importance, with governing the alterations of throughout the computational process, it progressively diminishes from 2 to 0 in a linear fashion as the parameter increases; as a vector constrained to values between 0 and 1, exercises control over the collective update of the swarm. The position of prey has a significant impact on the position and distance of whale. A greater value of results in a stronger effect on the whale, while a smaller value of leads to a weaker effect.
2) Two strategies have been developed to simulate the bubble-net attacking behavior observed in humpback whales. The whale moving in a spiral trajectory around the prey, while simultaneously generating bubbles along this path, thereby creating a trap.
a) Shrink encircling: Achieved by reducing the value of in Eq. (8). By randomly assigning values to the coefficient vector “ “ from the range of −1 to 1, a new position for a search agent can be determined, which lies between the original position of the agent and the position of the current best agent. This process effectively enables encircling predation, enhancing the search capabilities of the algorithm.
b) Spiral updating of positions: As depicted in Figure 2, the distance between the position of the whale, and the position of the prey, is calculated. Subsequently, a spiral equation is formulated to establish a mathematical relationship between these two positions, thereby replicating the distinctive spiral movement exhibited by humpback whales:
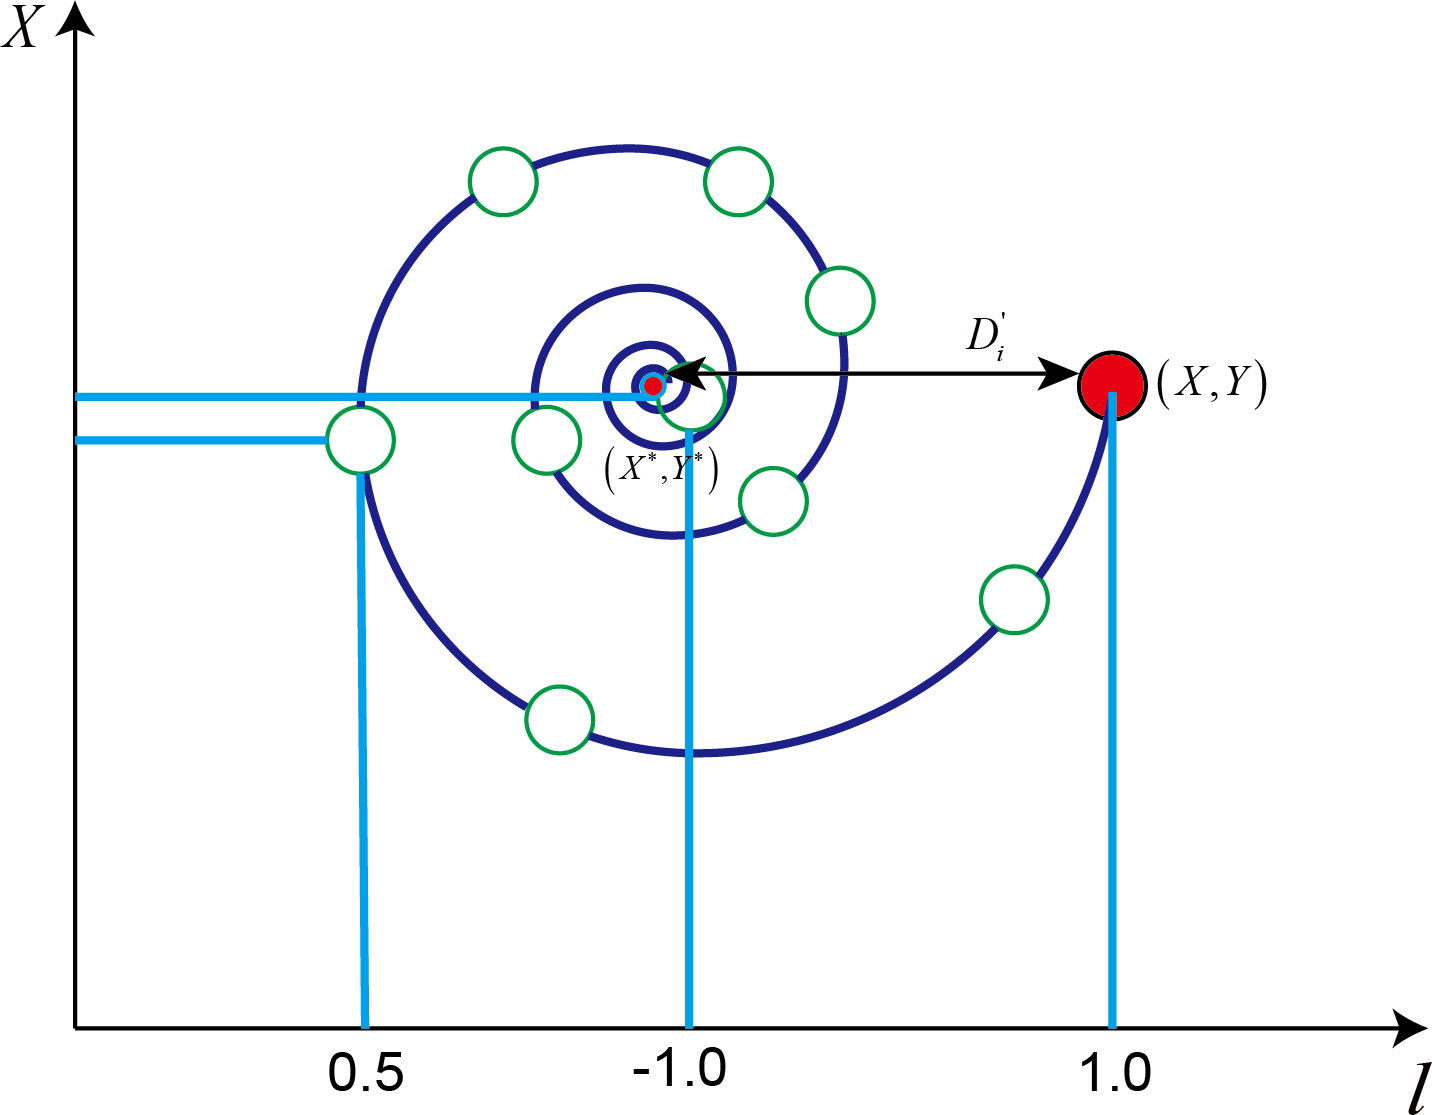
Figure 2 Spiral updating position.
where represents the parameter that defines the shape of the spiral line, and is a random variable ranging from −1 to 1.
To emulate the bubble-net attacking behavior, a stochastic approach is employed, assuming a 50% probability for humpback whales to exhibit both the shrinking encircling mechanism and the spiral position updating. The mathematical representations describing these behaviors are as follows:
3) In addition to the bubble-net method, another strategy employed by humpback whales involves the random search for prey. This stage is characterized by global exploration, where the entire whale population engages in the search process. When , indicating a certain level of exploration, the whale population discontinues updating their positions based on the current best solution. Instead, they select a random whale and update their positions accordingly, with the objective of expanding the search range and exploring optimal solutions to maintain population diversity.
where represents the position of the randomly selected whale.
Similar to the previous two metaheuristic algorithms, SSA is also inspired by the predatory behavior observed in natural ecosystems (Xue and Shen, 2020). Sparrows are a ubiquitous presence in our environment, and their adept predatory characteristics, have been ingeniously employed in the pursuit of optimal solutions, showcasing remarkable optimization capabilities.
The optimization process is characterized using a population consisting of sparrows. Throughout the entire process, the sparrows are categorized into two roles: producers and scroungers. The producers are responsible for surveying food resources and providing the regions and directions for food search, while the scroungers rely on the producers to obtain food. The composition of the population is illustrated as follows:
where denotes the position of all sparrows; represents the dimension of the variables in a given problem; represents the total quantity of sparrows; and denotes the -th dimension of the -th sparrow. The fitness values of all sparrows can be expressed as Eq. (16):
where represents the fitness calculation formula for determining the adaptability value of each sparrow.
In SSA, individuals within the population, endowed with the highest fitness values, are bestowed with the capability to acquire food resources with priority. As producers, they possess a significantly broader range of search, whereas scroungers have comparatively limited search capabilities. During each iteration process, the positions of producers are updated according to the following procedure:
where represents the current iteration, while denotes the maximum number of iterations; The random variable follows a uniform distribution within the range of (0, 1); is a random variable following a normal distribution; is a matrix of size , with all elements equal to 1; the value of ranges from 0 to 1, while takes values between 0.5 and 1, representing the threshold values for alert and safety, respectively.
When is less than , it signifies the absence of predators in the vicinity, enabling the producers to engage in extensive search operations. When exceeds or equals the threshold , it implies that some sparrows have already detected the presence of predators and are issuing warnings to other sparrows. In this scenario, all sparrows are required to swiftly fly to secure locations for foraging.
The producers are constantly being monitored by certain scroungers. When the producers discover better food, the scroungers promptly abandon their current positions and move towards competing for the food. If they succeed in winning the competition, they can immediately obtain the food. The position of scroungers is updated as Eq. (18):
where represents the optimal position occupied by the current producers, while denotes the globally worst position; is a matrix of size 1×d, where each element is randomly assigned a value of 1 or -1; is defined as .When exceeds , it implies that the th scrounger with lower fitness has not obtained food and needs to fly to another location for foraging.
In the foraging process, certain sparrows possess the ability to perceive the presence of potential threats in their surroundings. The initial positions of these sparrows are randomly determined. Their strategies for updating their positions as Eq. (19):
where represents the current global best position; is a parameter that controls the step size, following a normal distribution with mean 0 and variance 1; is a random number indicating the direction of sparrow movement, serving as a step size control parameter; denotes the current individual fitness value, while and represent the current global best and worst fitness values, respectively; is a minimal constant, which utilized to prevent division by zero (Gharehchopogh et al., 2023).
In order to assess the accuracy of each model, as described in Sect. 2, 80% of the data was utilized for training, while the remaining 20% was employed for testing. The evaluation methods employed were identical for both the training and testing datasets, allowing for the assessment of the fitting and generalization capabilities of models. The square of the correlation between the anticipated and measured values is denoted as . Prediction performance is described by , which compares the standard deviation of the fitting error with the standard deviation of the measured value. and serve as metrics for evaluating the prediction accuracy of the model, while can assess the robustness of the model (Tang and Na, 2021; He et al., 2023). In this current study, the performance was evaluated using , , , and as metrics. The equations for these metrics are provided below:
where , and represent the original, predicted and mean values of the overbreak area, respectively; and represents the total amount of data.
The value of ranges from 0 to 1, with higher values indicating a better degree of model fit. The value of is typically greater than 0, and the closer it is to 0, the better performance of the model, ranging from 0% to 100%, exhibits better predictive capability as the value increases. When the predicted and measured values of the overbreak are identical, equals 1, equals 0 and equals 100% (Mottahedi et al., 2018; He et al., 2023).
To bolster the persuasiveness of the constructed model and mitigate the drawback of limited original data, this study incorporates the practice of cross-validation. The underlying principle involves partitioning a portion of the data as the training set, while the remaining data serves as the validation set. There exist diverse methodologies for conducting cross-validation, with k-fold cross-validation being a prominent choice, where k is commonly set to 5 or 10 (Kohavi, 1995; Rodriguez et al., 2010). Figure 3 illustrates the utilization of 5-fold cross-validation in this study, whereby the training set is divided into five subsets, each of which has the potential to serve as either the training or validation set. The performance of the model on the validation set serves as an indicator of its generalization capability. The final performance of model is determined by averaging the results obtained from five repeated tests (Zhang et al., 2022). The assessment of machine learning model performance is based on its generalization ability, focusing on the ultimate measure of generalization error rather than empirical error. In this study, the introduction of 5-fold cross-validation entails averaging the performance of the model across five distinct validation sets, serving as the final performance metric.
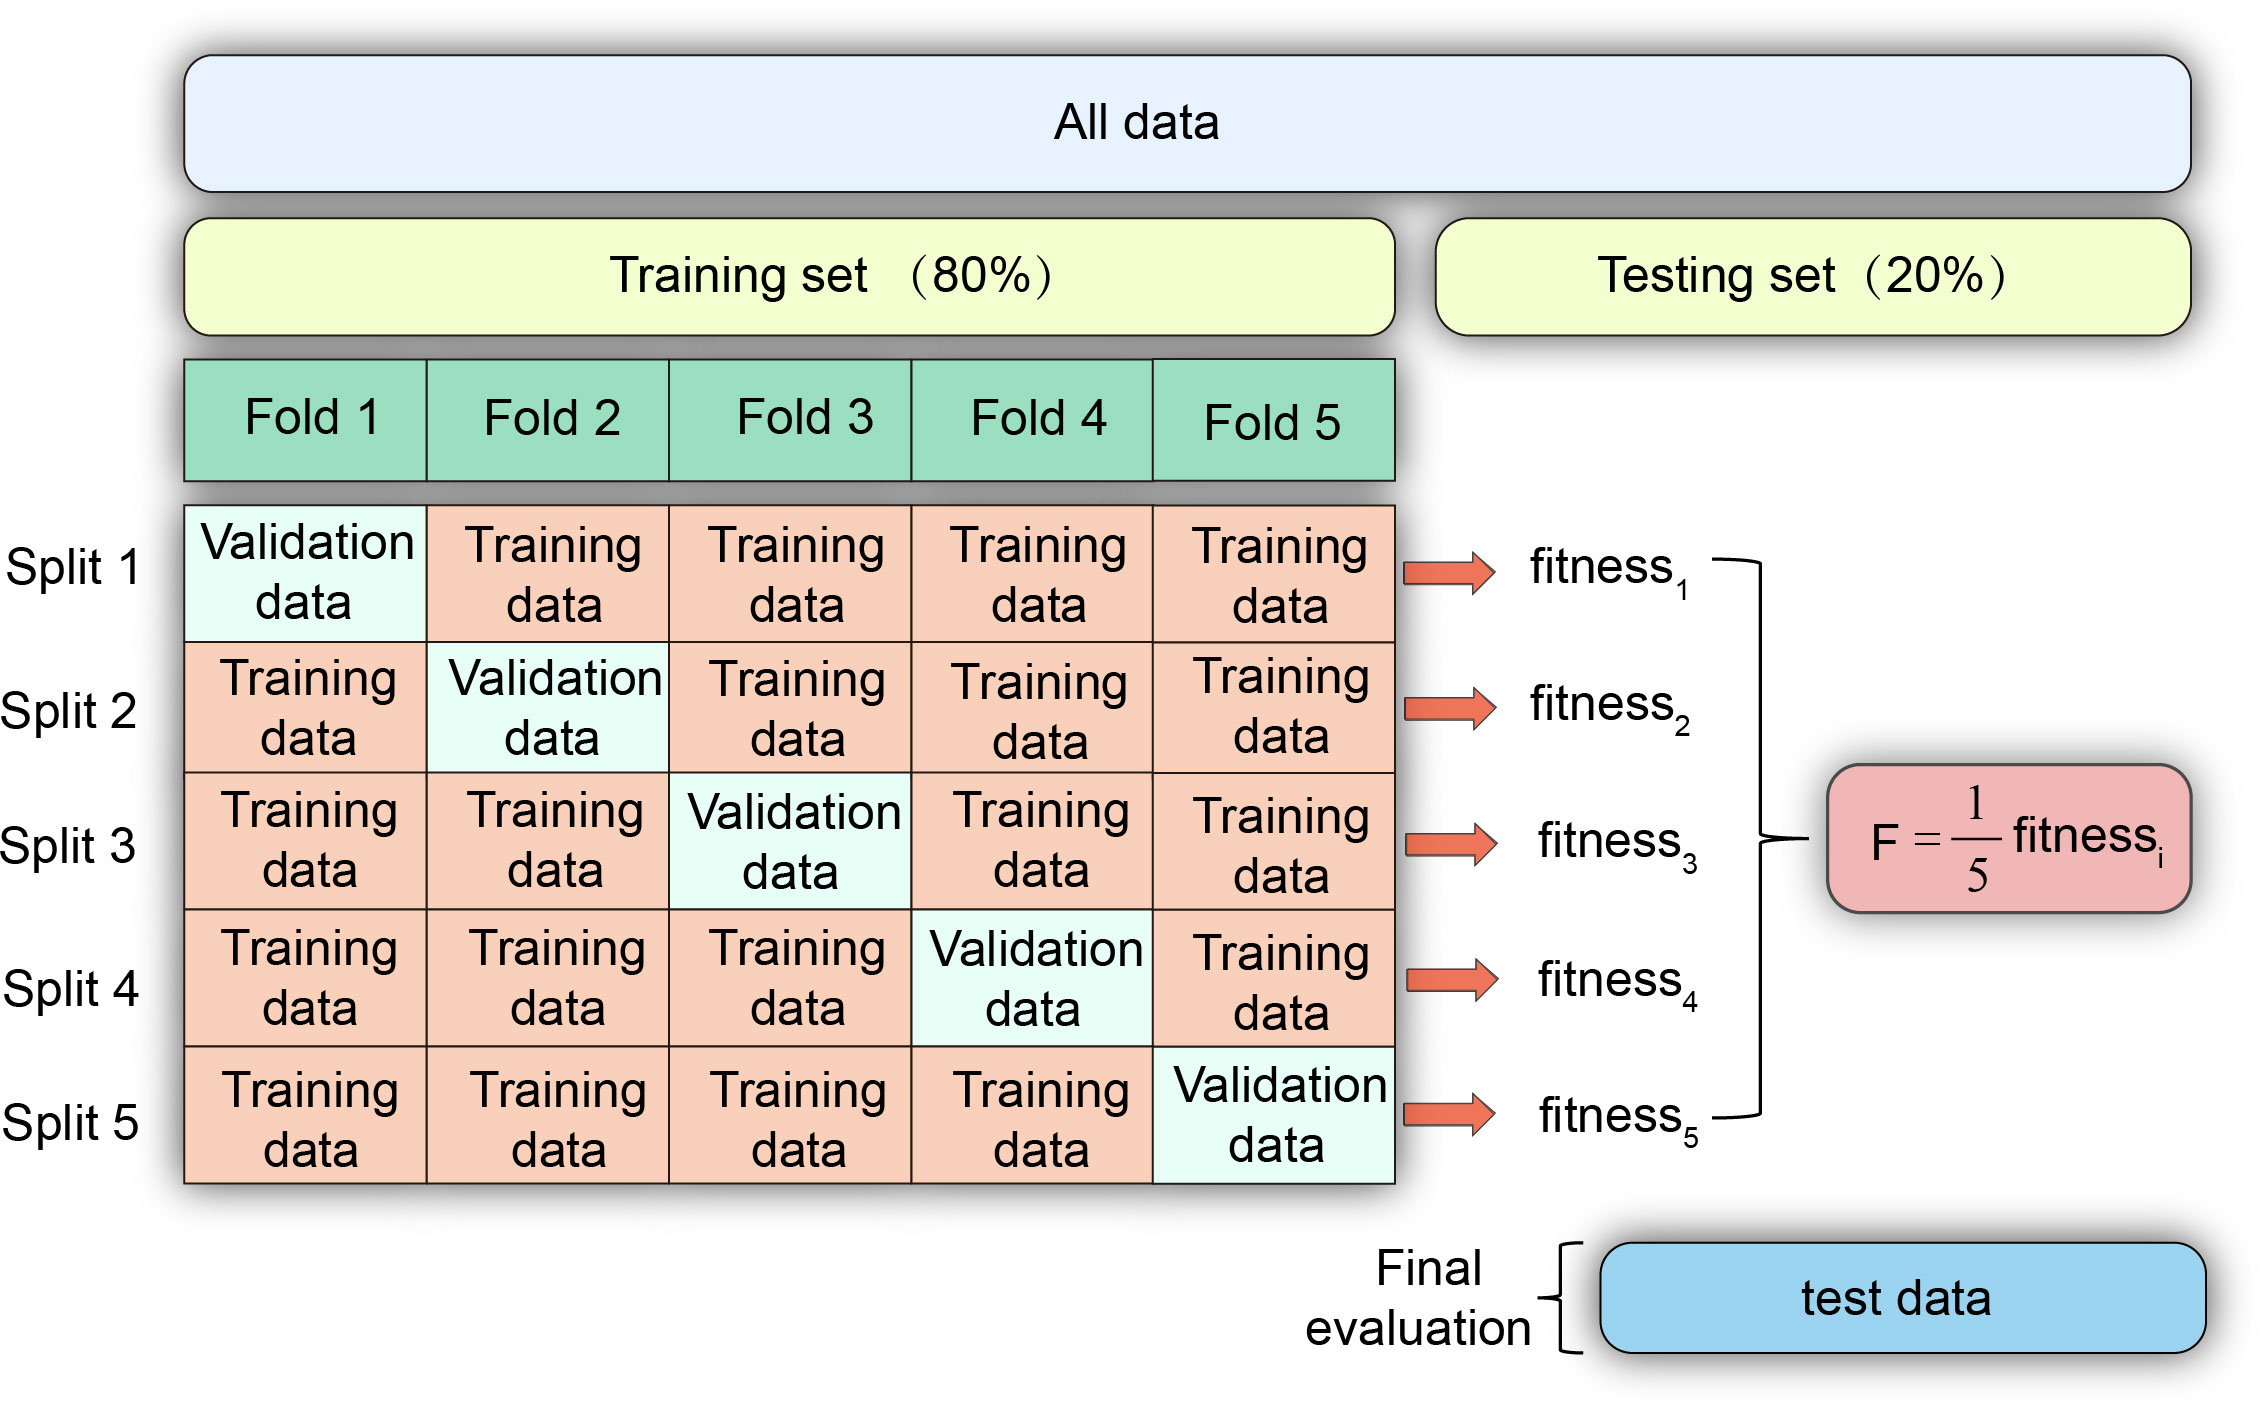
Figure 3 Schematic representation of 5-fold cross-validation.
Additional benefits can be obtained through cross-validation, including the identification of overfitting or underfitting phenomena. This leads to a more standardized selection of hyperparameters, thereby yielding more reliable outcomes. However, the drawbacks of k-fold cross-validation are evident. Due to its repetitive nature, it necessitates significant computational time, with efficiency largely reliant on the capabilities of the computer system. Furthermore, it is not advisable to employ k-fold cross-validation when the data exhibits repetitive patterns, as this would entail redundant processing of the same dataset.
In this study, three optimization methods from Sect. 3 are utilized to adjust the hyperparameters of XGBoost, including the learning_rate, max_depth and n_estimators. For crucial parameter details and their corresponding upper and lower bounds, refer to Table 1. The stability of model training is evaluated by computing the fitness value, and stability is deemed to be achieved when the fitness value no longer changes. Typically, an increase in the number of iterations leads to a stabilization of the optimization performance (Li et al., 2021b). The design of the fitness function should be able to reflect the relationship between predicted values and measured values, in order to determine the performance of the model. This discrepancy can include, but is not limited to, metrics such as mean absolute error, root mean square error, correlation coefficient, and others. By selecting an appropriate fitness function, a better understanding of the capabilities and reliability of the predictive model can be attained, thereby offering compelling guidance for further enhancing and optimizing the model. The fitness function employed in this research is defined as Eq. (24):
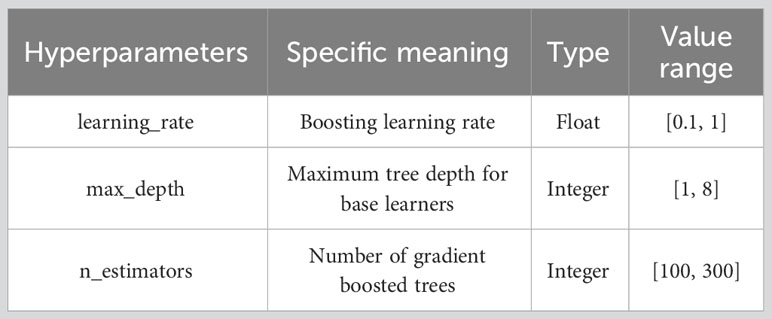
Table 1 Information on optimizing critical hyperparameters of XGBoost.
where and represent the predicted value and the true value of overbreak, respectively, denotes the total amount of test samples.
By employing metaheuristic algorithms, the optimal hyperparameters for XGBoost can be determined. Coupled with five-fold cross-validation, the hyperparameters that minimize Eq. (25) can be identified, indicating the superior predictive performance of the model. However, the performance of these metaheuristic algorithms is influenced by multiple factors, with swarm size and the number of iterations being the two most significant ones (Koopialipoor et al., 2019a; Li et al., 2021a; Yu et al., 2021). In this current study, a careful comparison and selection will be conducted for these two parameters. The remaining parameter configurations are presented in Table 2.
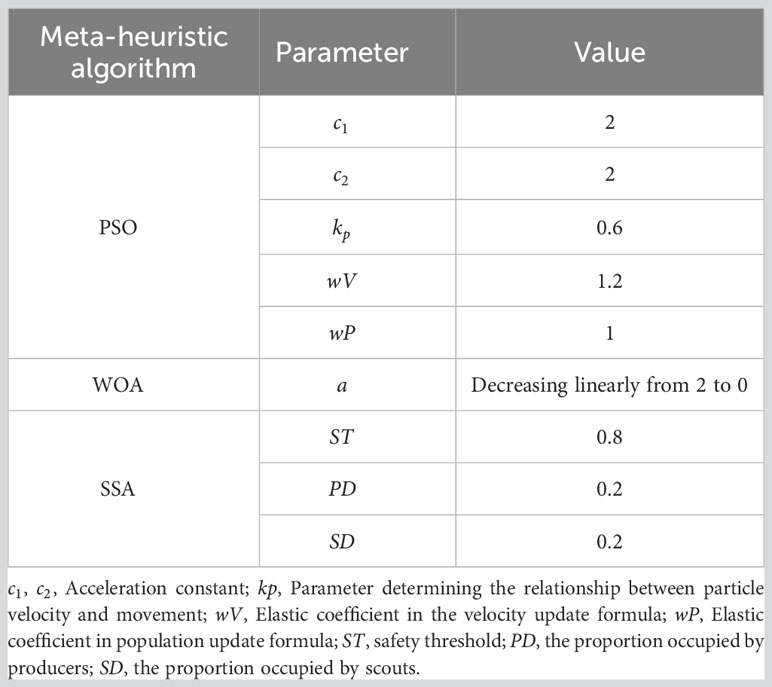
Table 2 Parameter settings of three optimization algorithms.
In consideration of the limited data and the prominent predictive ability of XGBoost, the selection of the swarm size requires careful consideration. If the particle number is excessively large, it will inevitably result in time wastage and potential overfitting. Furthermore, with a total of 12 input parameters in the model, the dimension of the search space increases significantly, thereby necessitating an adequate number of particles. Therefore, opting for a swarm size between 50 and 90 proves to be a favorable choice. Consequently, a comparison was conducted among swarm sizes of 50, 60, 70, 80, and 90 to identify the optimal swarm size for optimizing XGBoost predictions. From Figures 4–12, it is evident that the swarm size within the range of 60 to 90 exhibits strong predictive performance. Moreover, the optimal predictions are found in the middle range of 50 to 90, rather than at the extremes. This finding provides compelling evidence supporting the correctness of selecting the swarm size within this range. To ensure a fair comparison with equivalent conditions, the number of iterations is typically chosen to match the stable values observed for all models as mentioned in the relevant literature. Based on Figures 4, 7 and 10 around the vicinity of 100 iterations, the change in fitness value starts to diminish, but to guarantee stable training for all models, a choice of 300 iterations is deemed even more favorable. At this stage, the value of the fitness function ceases to experience any further changes, indicating convergence.
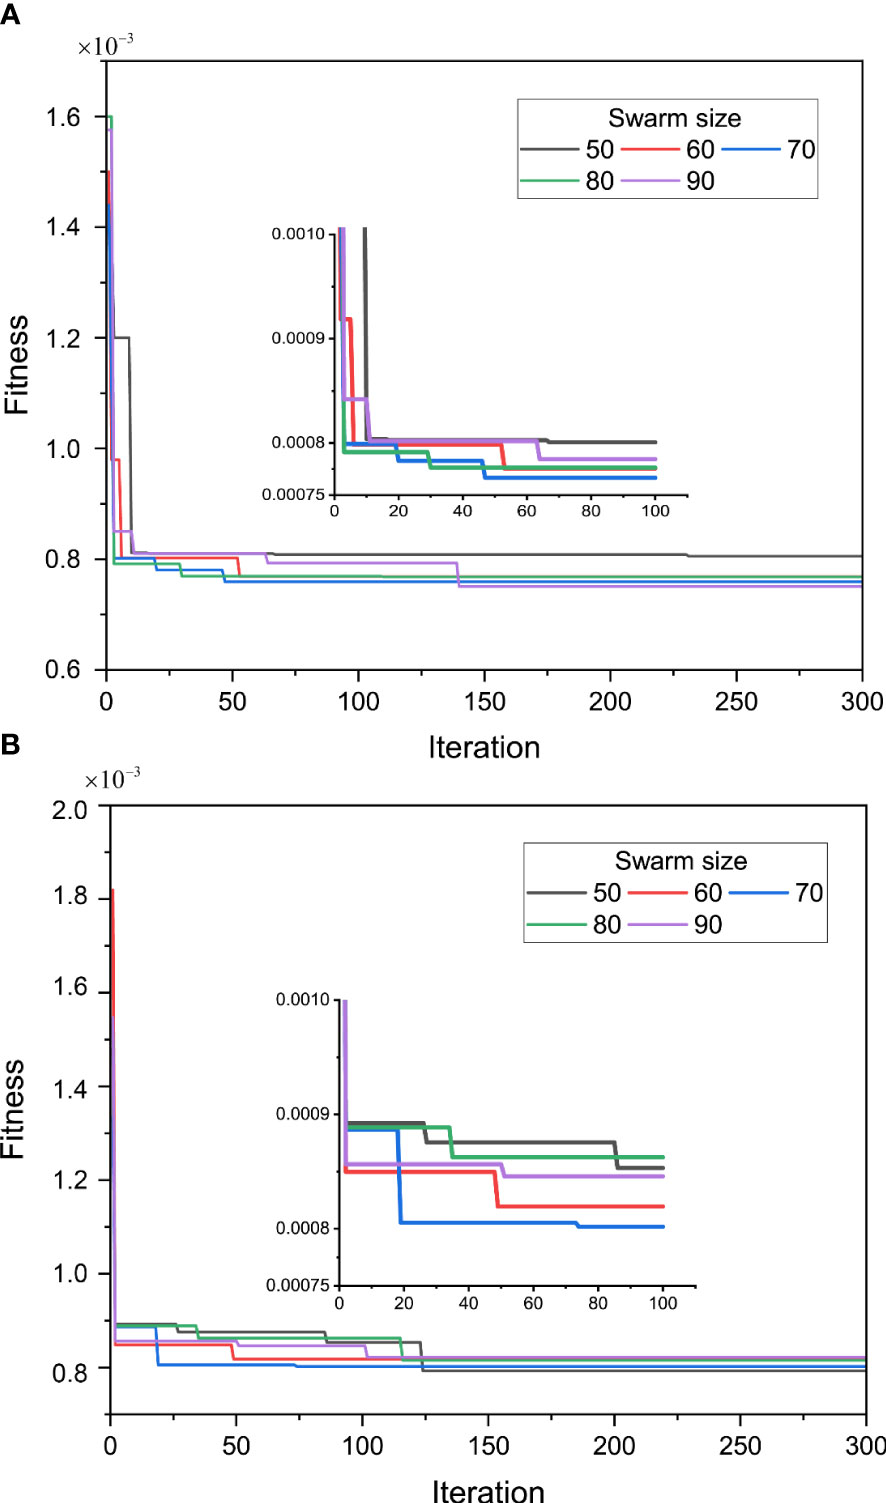
Figure 4 Optimization performance of XGBoost-PSO with different swarm sizes: (A) crown to shoulder and (B) shoulder to haunch.
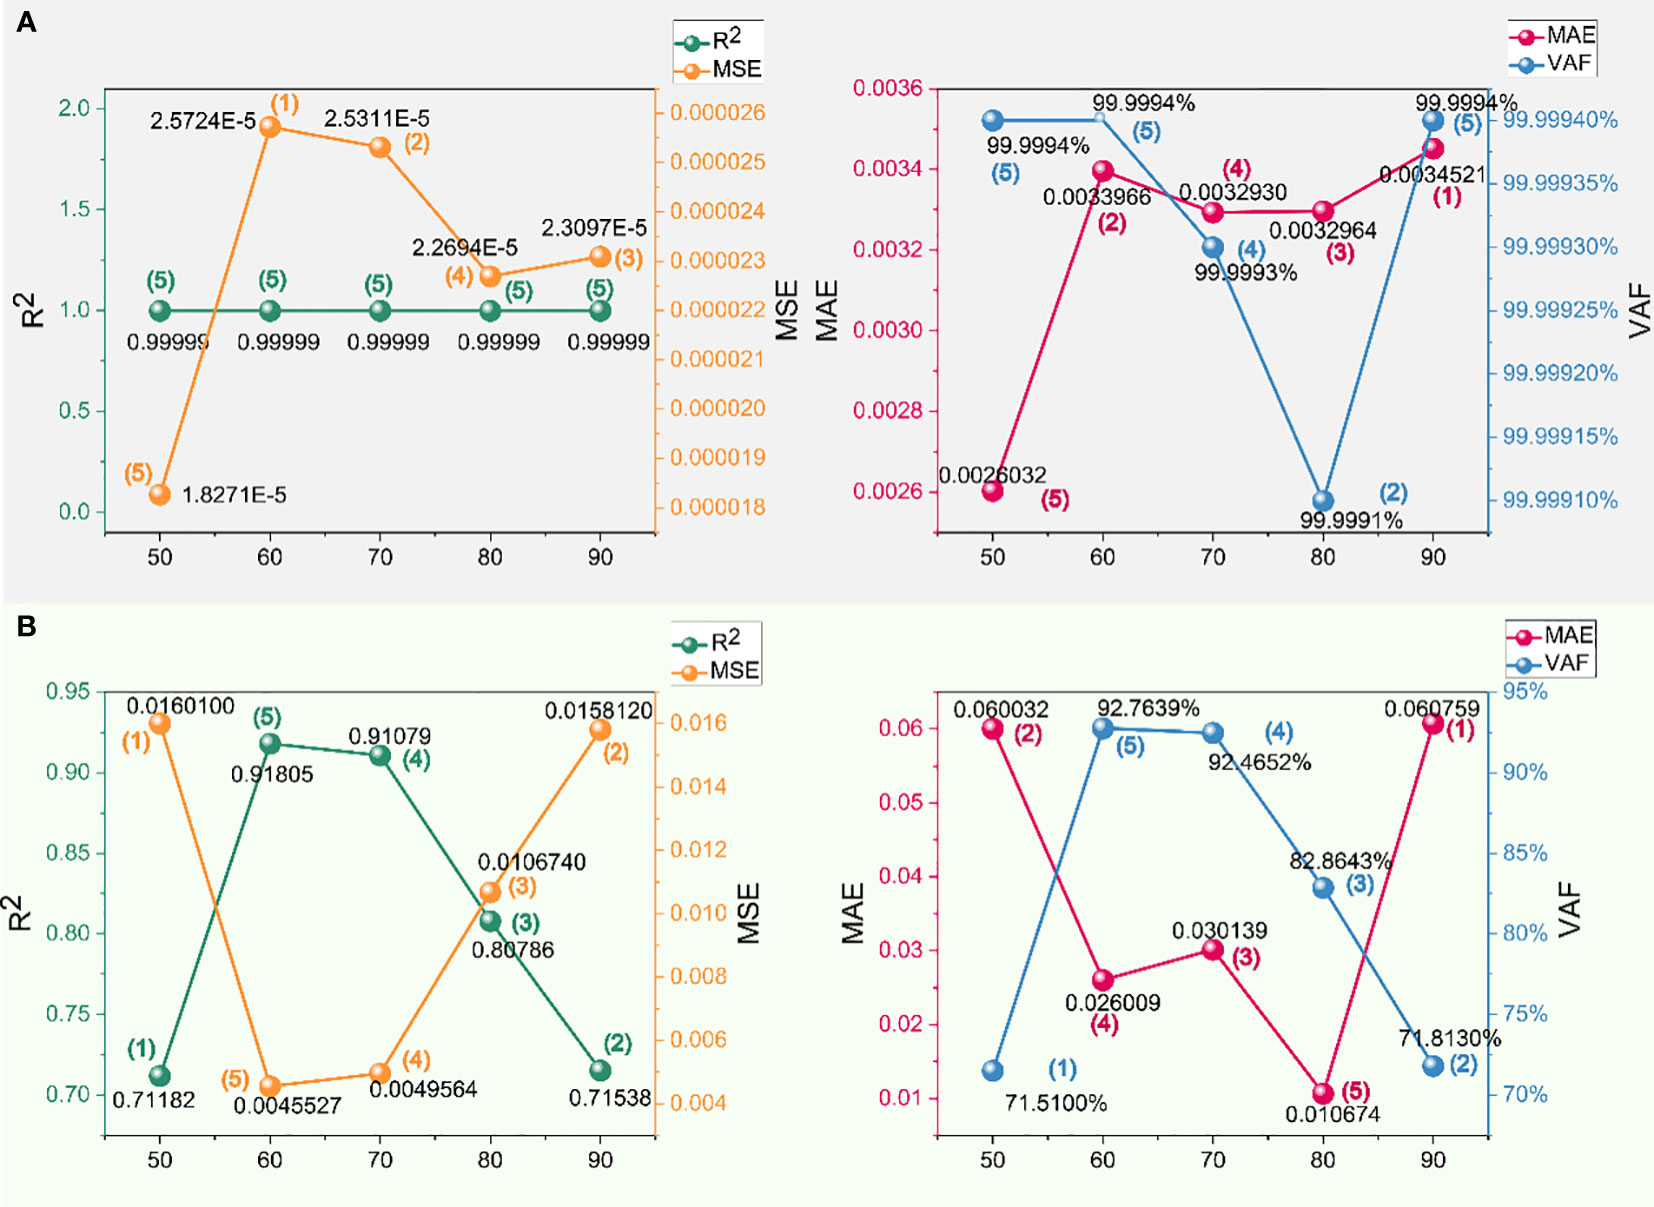
Figure 5 Performance and scores of different swarm sizes in the crown to shoulder dataset of XGBoost-PSO: (A) training set and (B) testing set.
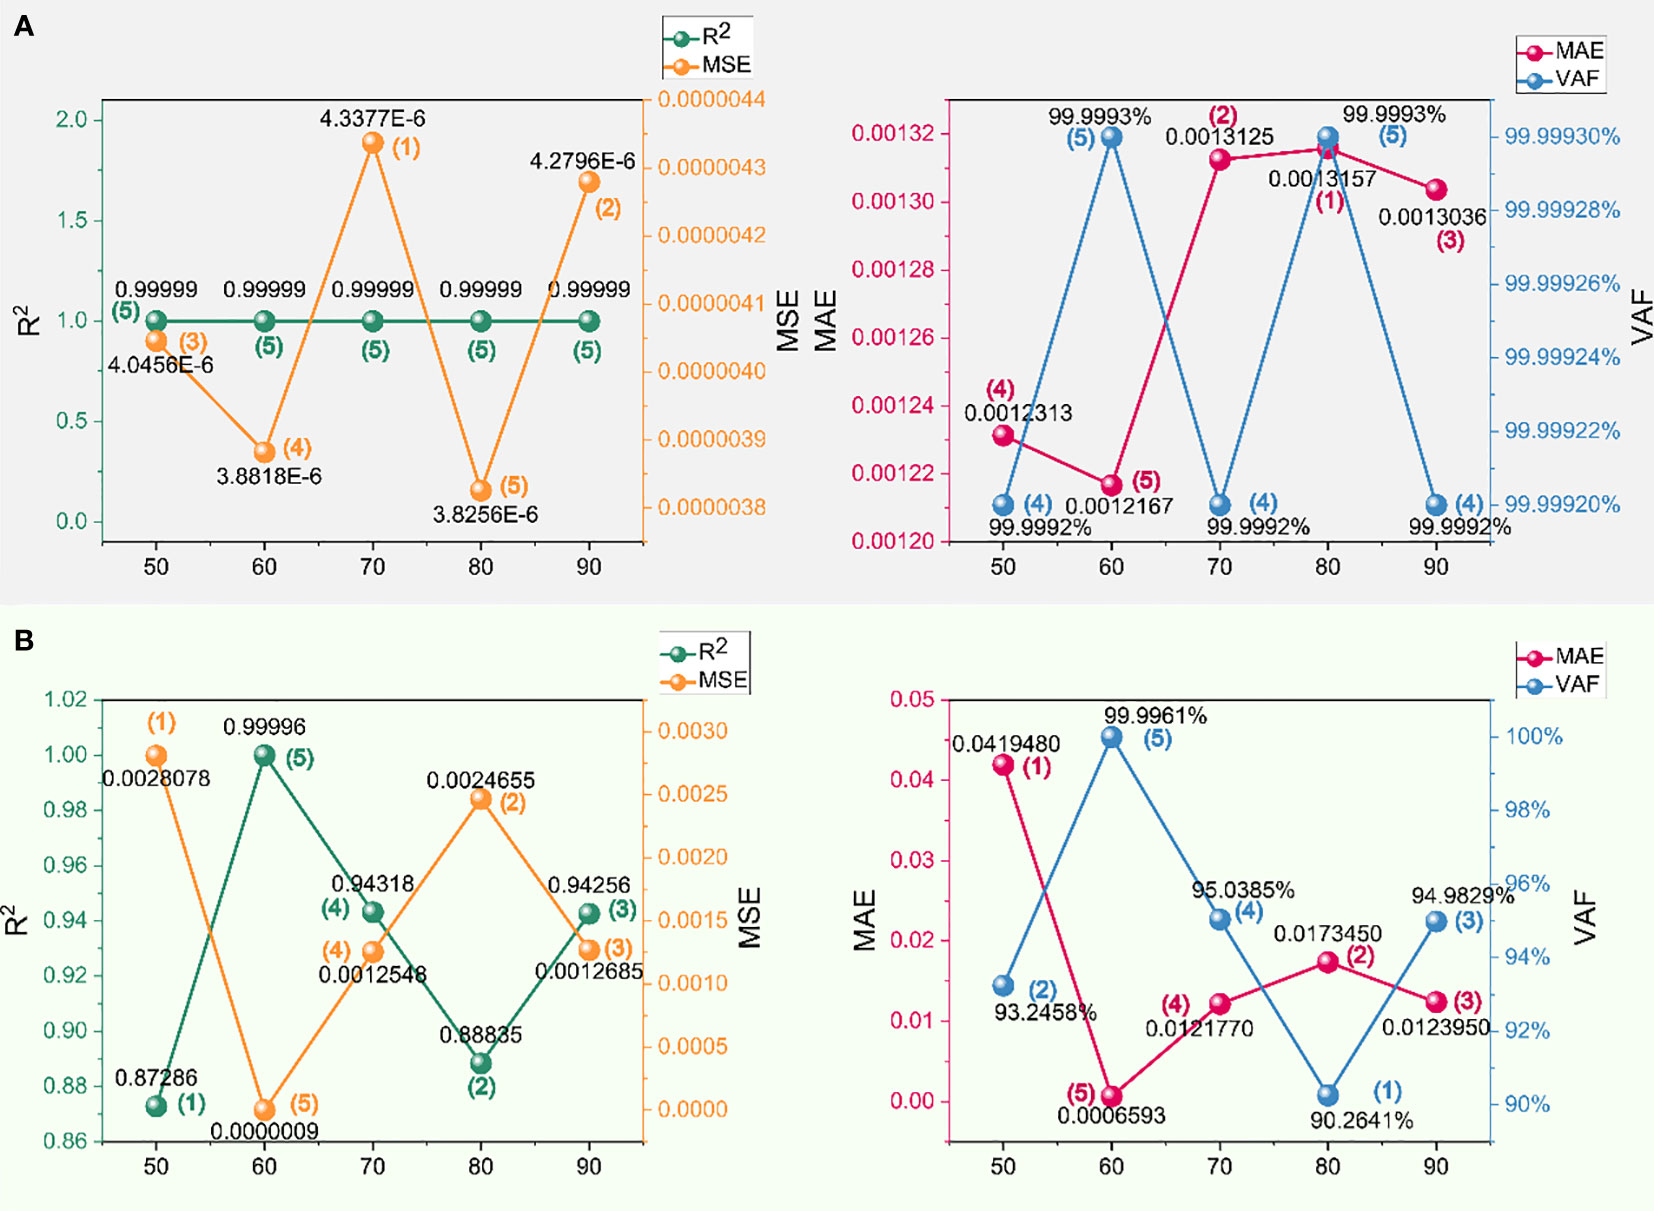
Figure 6 Performance and scores of different swarm sizes in the shoulder to haunch dataset of XGBoost-PSO: (A) training set and (B) testing set.
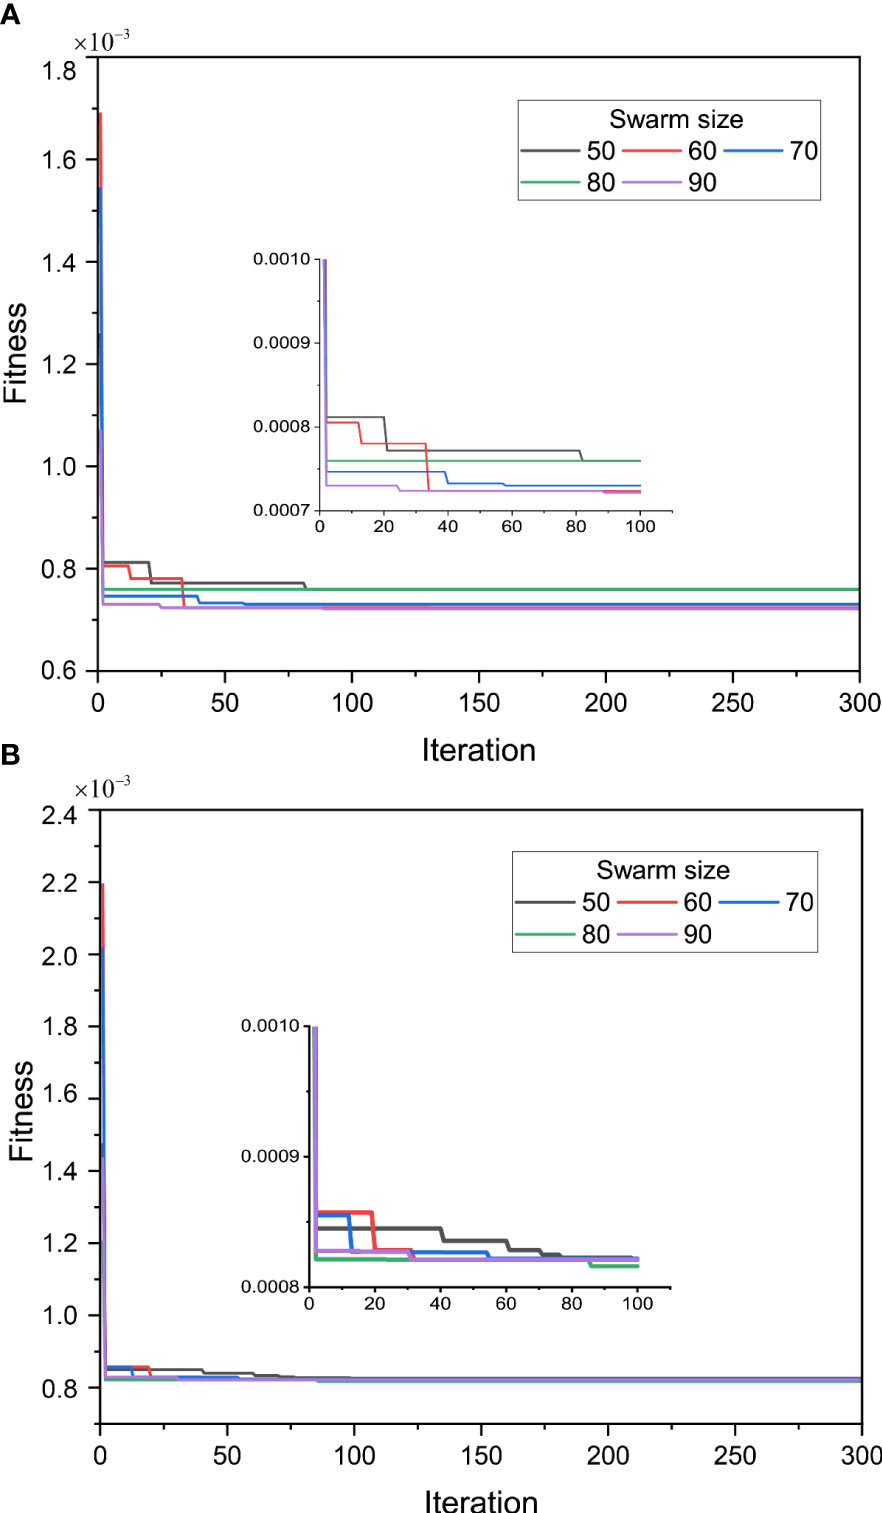
Figure 7 Optimization performance of XGBoost-WOA with different swarm sizes: (A) crown to shoulder and (B) shoulder to haunch.
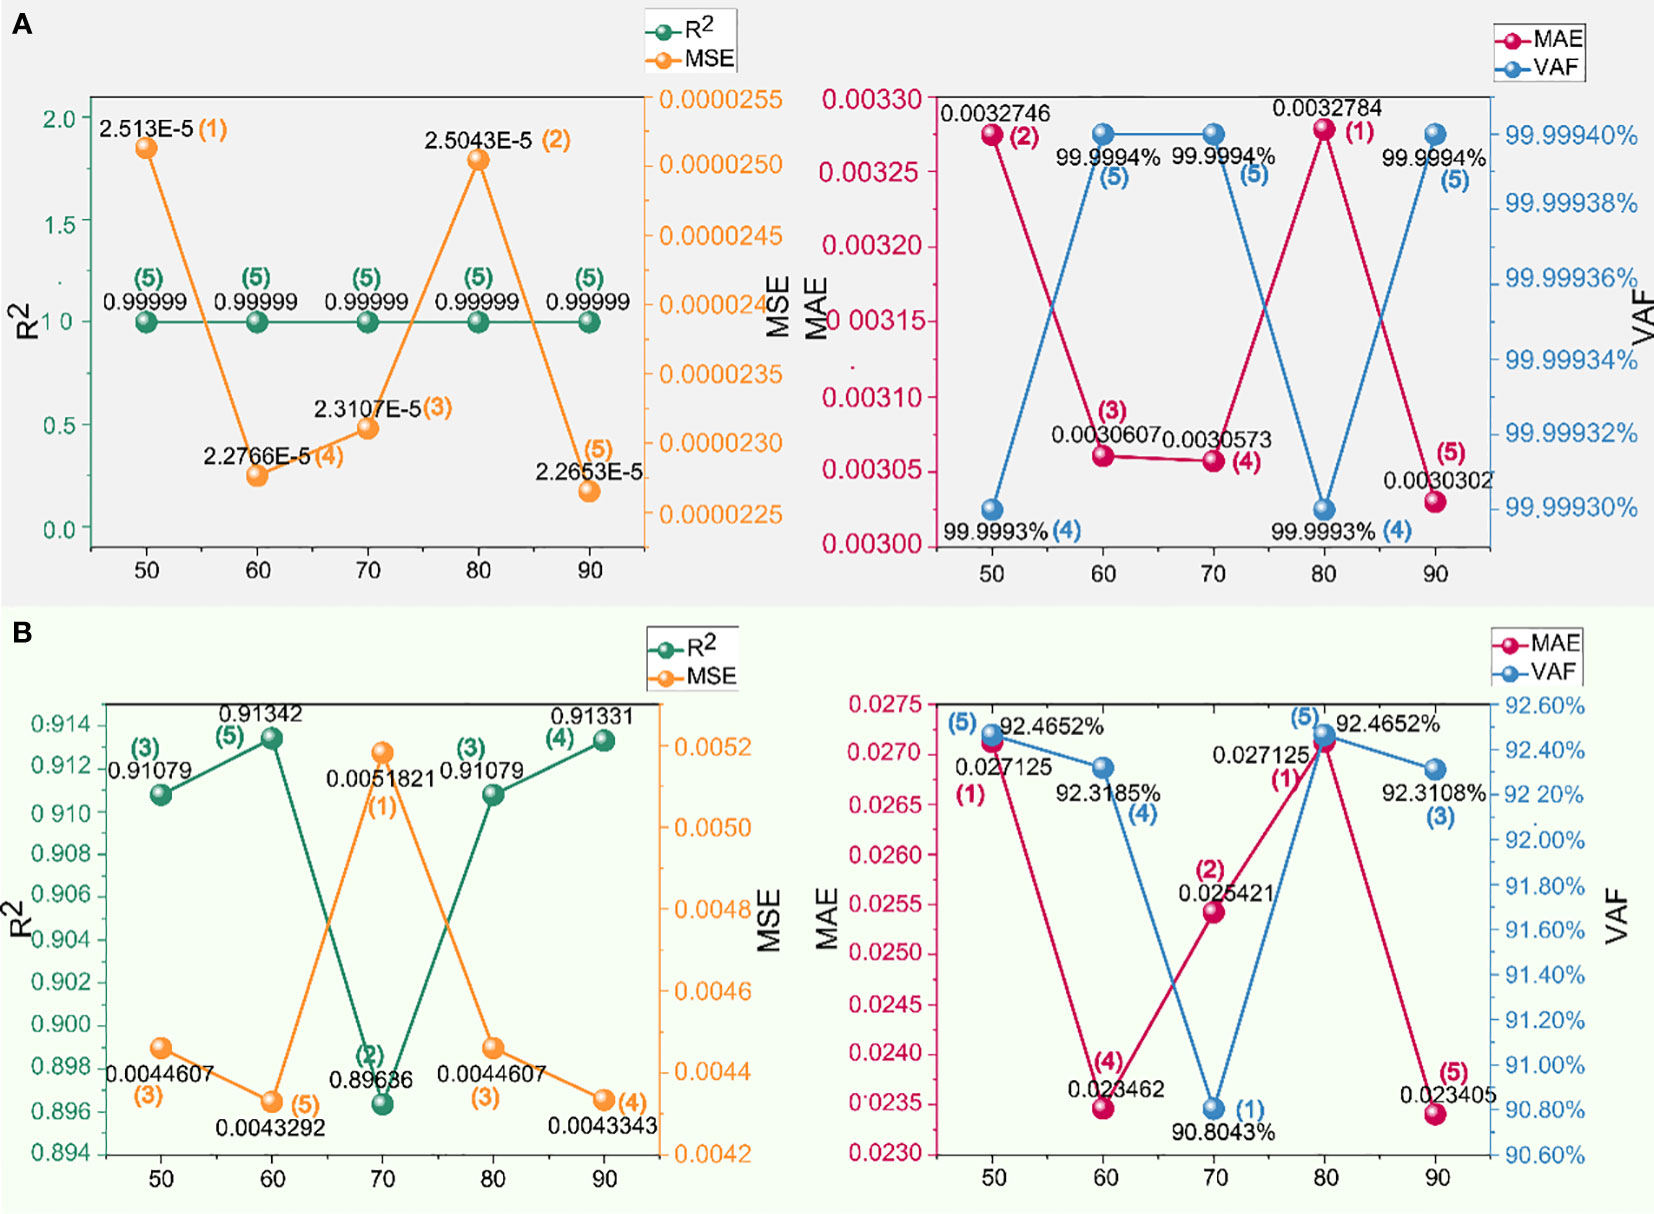
Figure 8 Performance and scores of different swarm sizes in the crown to shoulder dataset of XGBoost-WOA: (A) training set and (B) testing set.
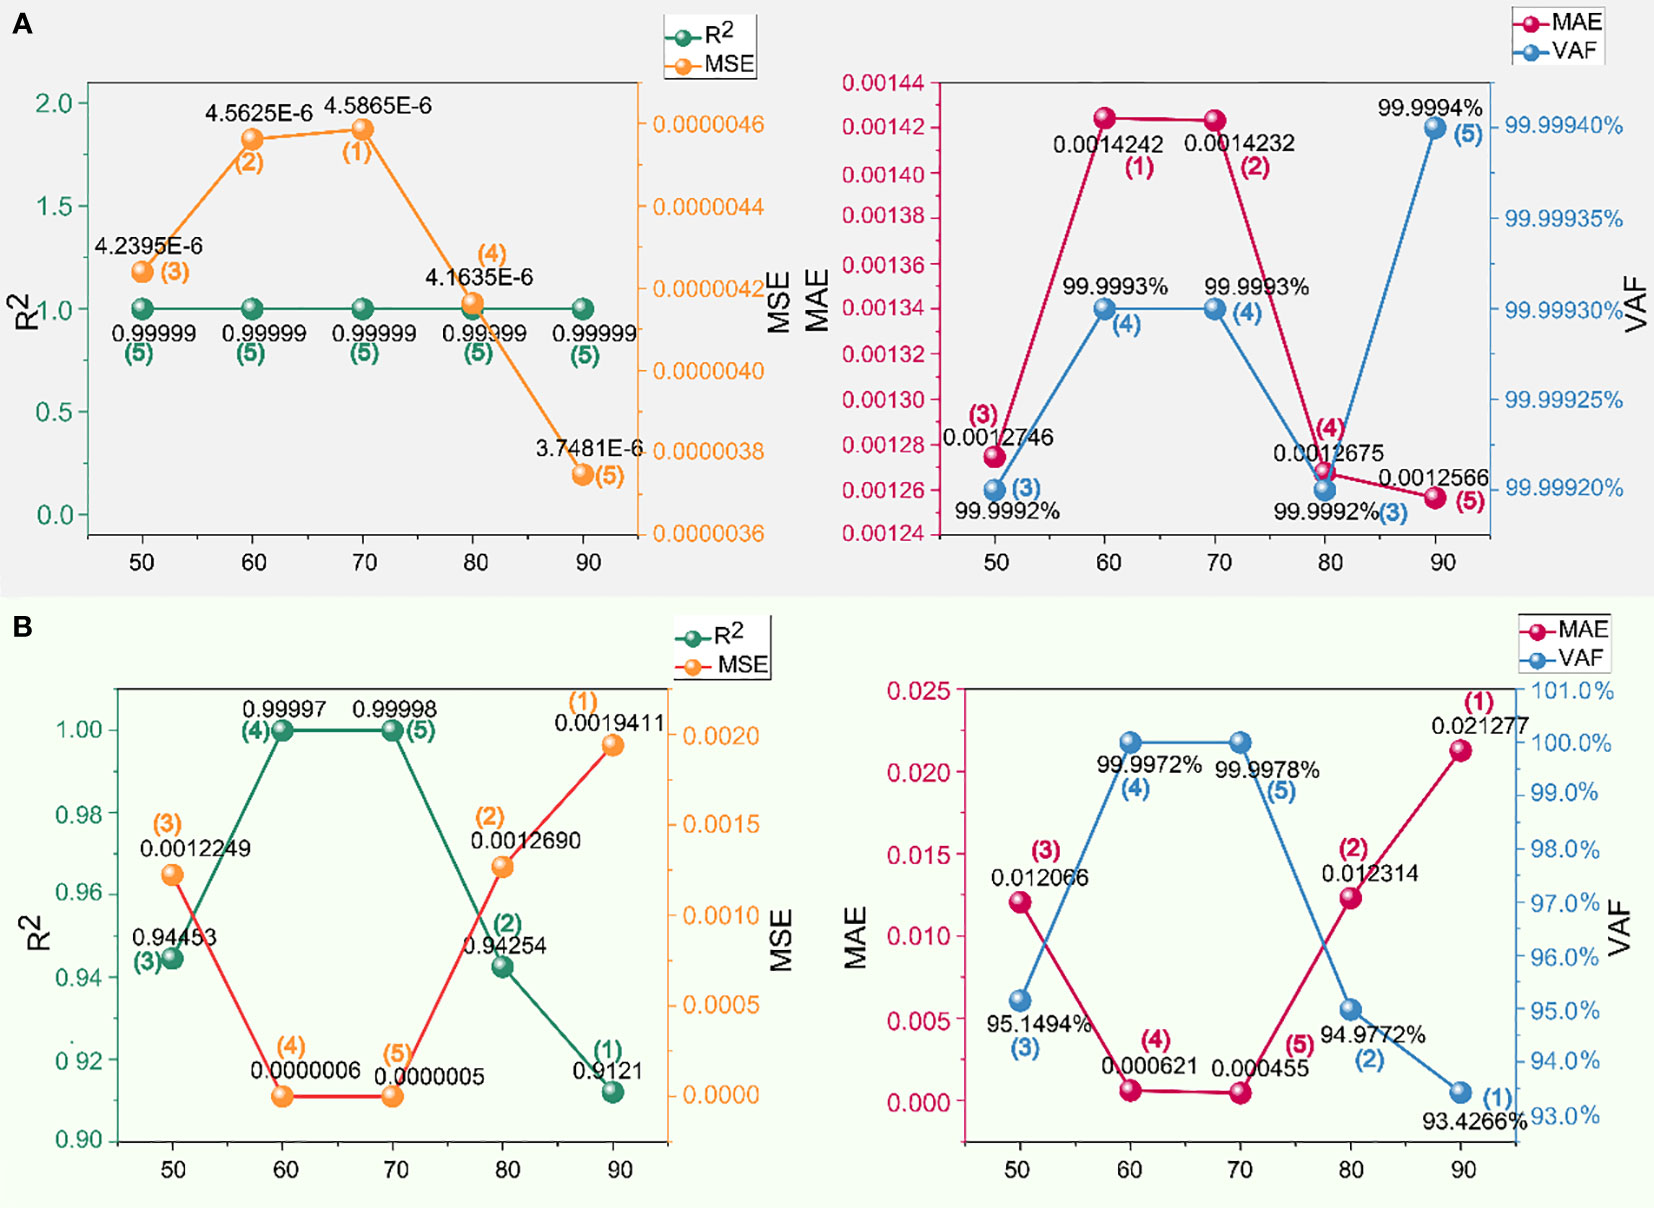
Figure 9 Performance and scores of different swarm sizes in the shoulder to haunch dataset of XGBoost-WOA: (A) training set and (B) testing set.
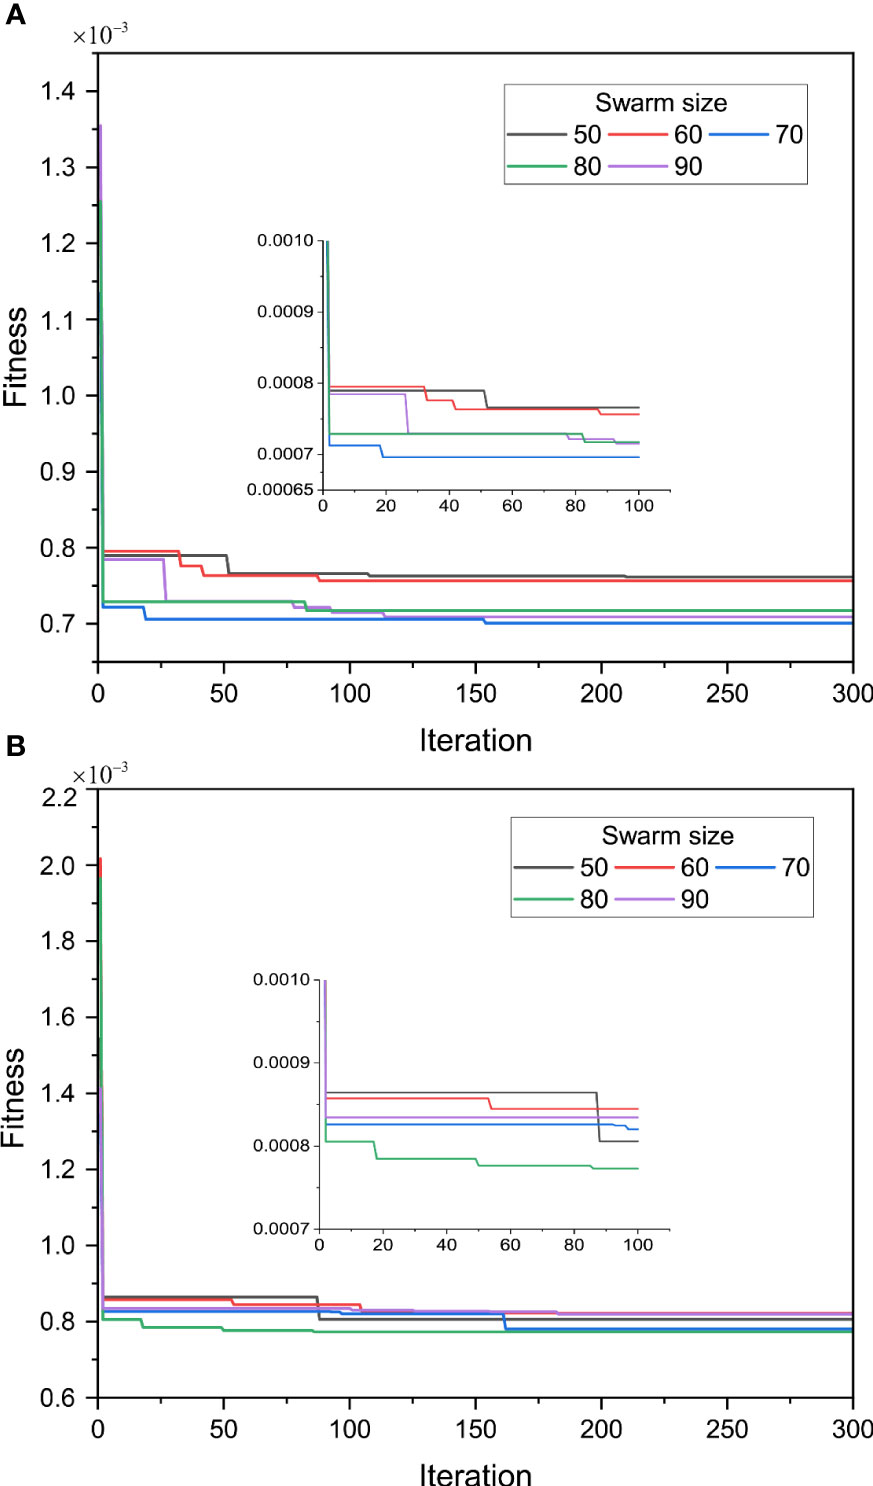
Figure 10 Optimization performance of XGBoost-SSA with different swarm sizes: (A) crown to shoulder and (B) shoulder to haunch.
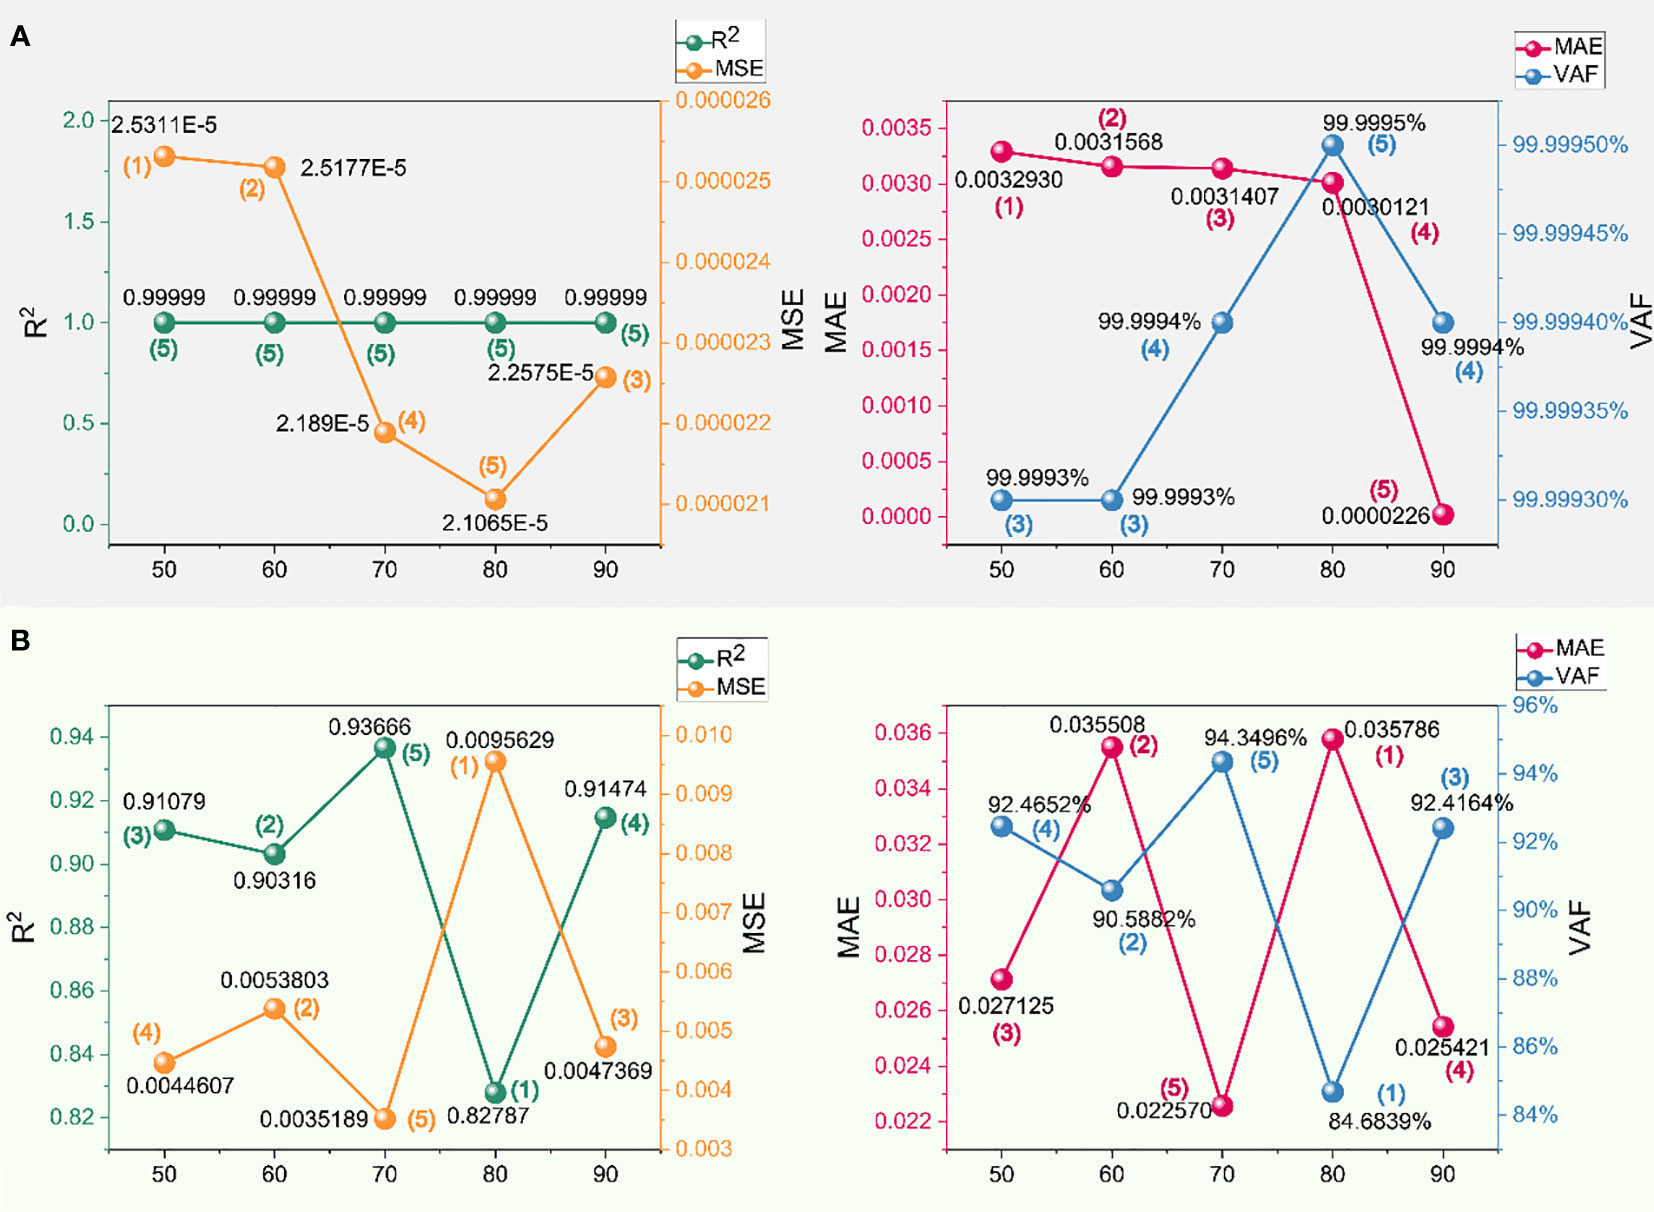
Figure 11 Performance and scores of different swarm sizes in the crown to shoulder dataset of XGBoost-SSA: (A) training set and (B) testing set.
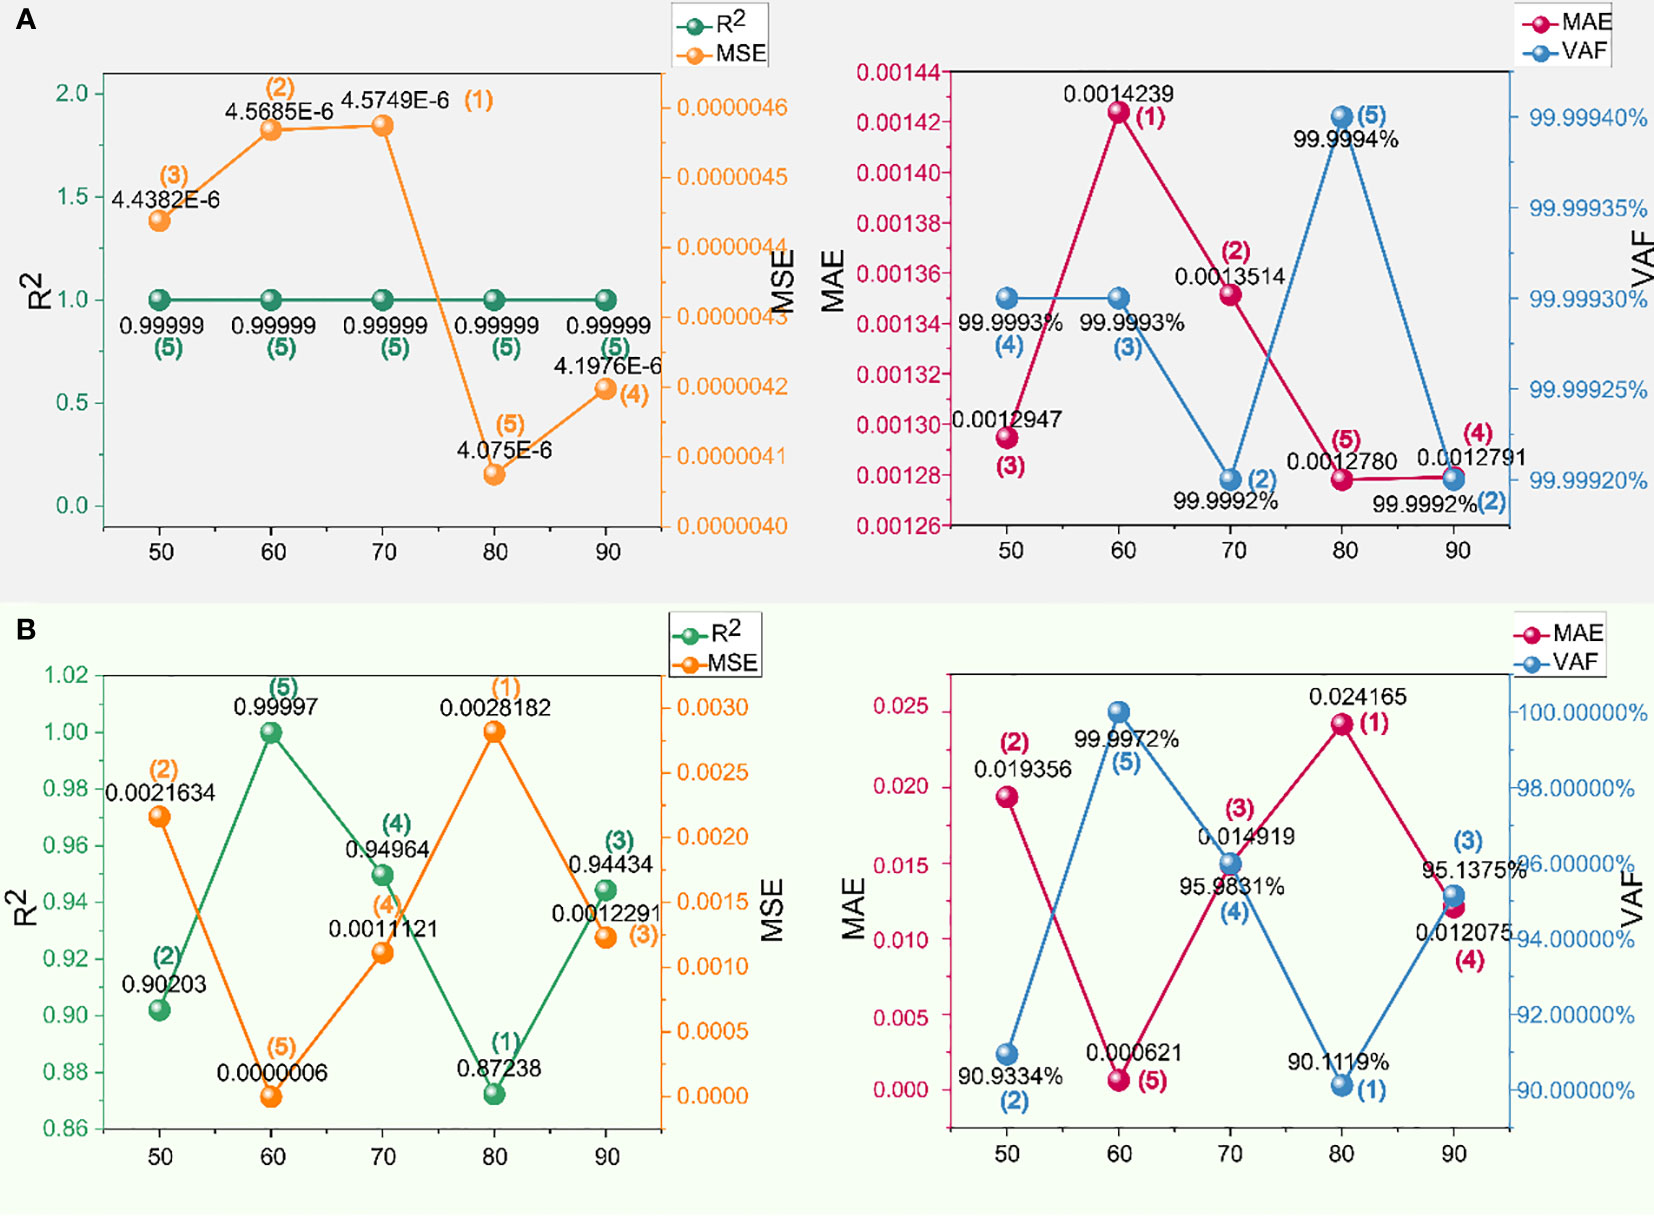
Figure 12 Performance and scores of different swarm sizes in the shoulder to haunch dataset of XGBoost-SSA: (A) training set and (B) testing set.
In the pursuit of developing an optimized prediction model for overbreak based on XGBoost, this study integrates three metaheuristic algorithms with XGBoost, yielding prediction models known as XGBoost-PSO, XGBoost-WOA, and XGBoost-SSA. The datasets for tunnel crown to shoulder and shoulder to haunch are individually utilized for prediction, resulting in a total of six models being compared. Throughout the entirety of the construction process for the predictive model, the incorporation of 5-fold cross-validation remains intact. The workflow for the prediction and comparison of all the mentioned models is depicted in Figure 13A. The evaluation of model performance follows the assessment method proposed by Zorlu et al. (2008). Each performance metric is assigned a specific score, wherein higher scores indicate superior performance. Ultimately, all scores are aggregated to determine the best model.
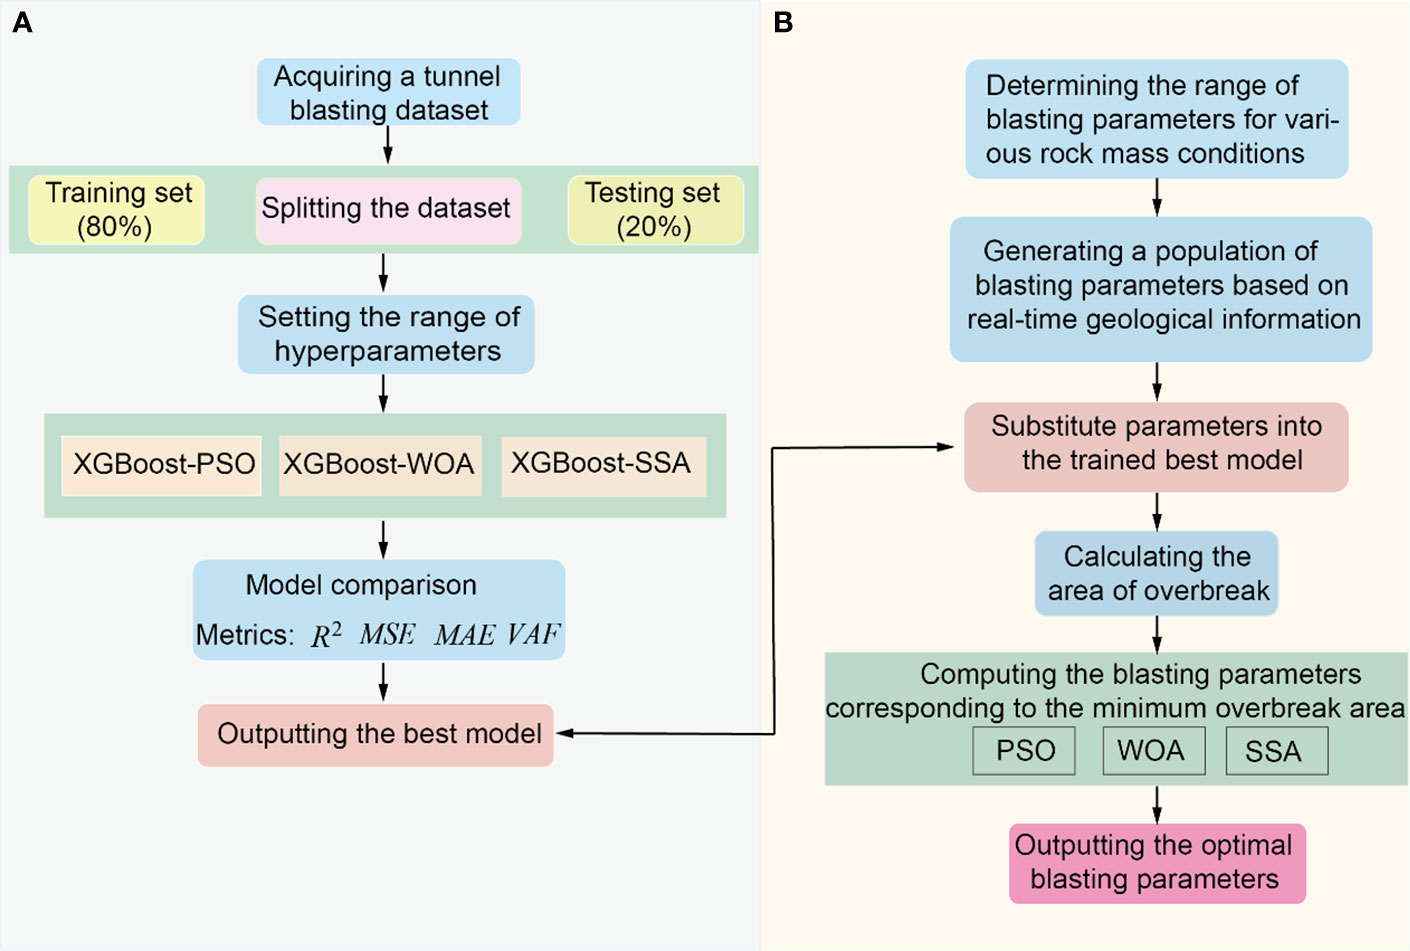
Figure 13 Specific process: (A) comparison of models and (B) comparison of parameter optimization.
Figure 4 illustrates the optimization process of PSO with different swarm sizes, showcasing the diverse optimization performance between the two data sets. It is evident that the variation in swarm sizes does not directly impact the stability of convergence. Merely relying on this optimization process cannot determine the optimal model. For instance, at a swarm size of 90, the convergence appears to be the best in Figure 4A, while in Figure 4B, its convergence behavior closely aligns with the others, and even its convergence value slightly exceeds the rest. All fitness function values remain around 0.0008 with insignificant fluctuations, indicating that the models trained with different swarm sizes have attained stability. This assertion is further supported by the values presented in Figures 5A, 6A.
Further comparison was conducted on models with different swarm sizes, evaluating them based on four distinct metrics, as illustrated in Figure 5. The fluctuations in and exhibit a similar pattern, while the variation patterns of and VAF exhibit similar tendencies. Figures 5, 6 provide a clearer visualization of the performance of the model, enabling a comprehensive assessment of its performance scores and trends. Both the training and testing sets demonstrate optimal performance with a swarm size of 60. However, it is important to acknowledge exceptional cases. For instance, at a swarm size of 80, the minimum values of and are observed in Figures 5B, 6A, respectively. Hence, employing an aggregate score for a comprehensive evaluation of the model performance is a more scientifically robust approach. Table 3 presents the total scores of models corresponding to different swarm sizes for both sets of data, clearly indicating that the model performs optimally with a swarm size of 60, corroborated by Figures 5, 6. This swarm size yields the best performance for both the training and testing sets. The robustness of the model is confirmed at this swarm size. Conversely, when the swarm sizes are 50 and 90, despite its satisfactory performance on the training set, the model demonstrates inferior performance on the testing set, indicating a lack of robustness in generalizing to new data.
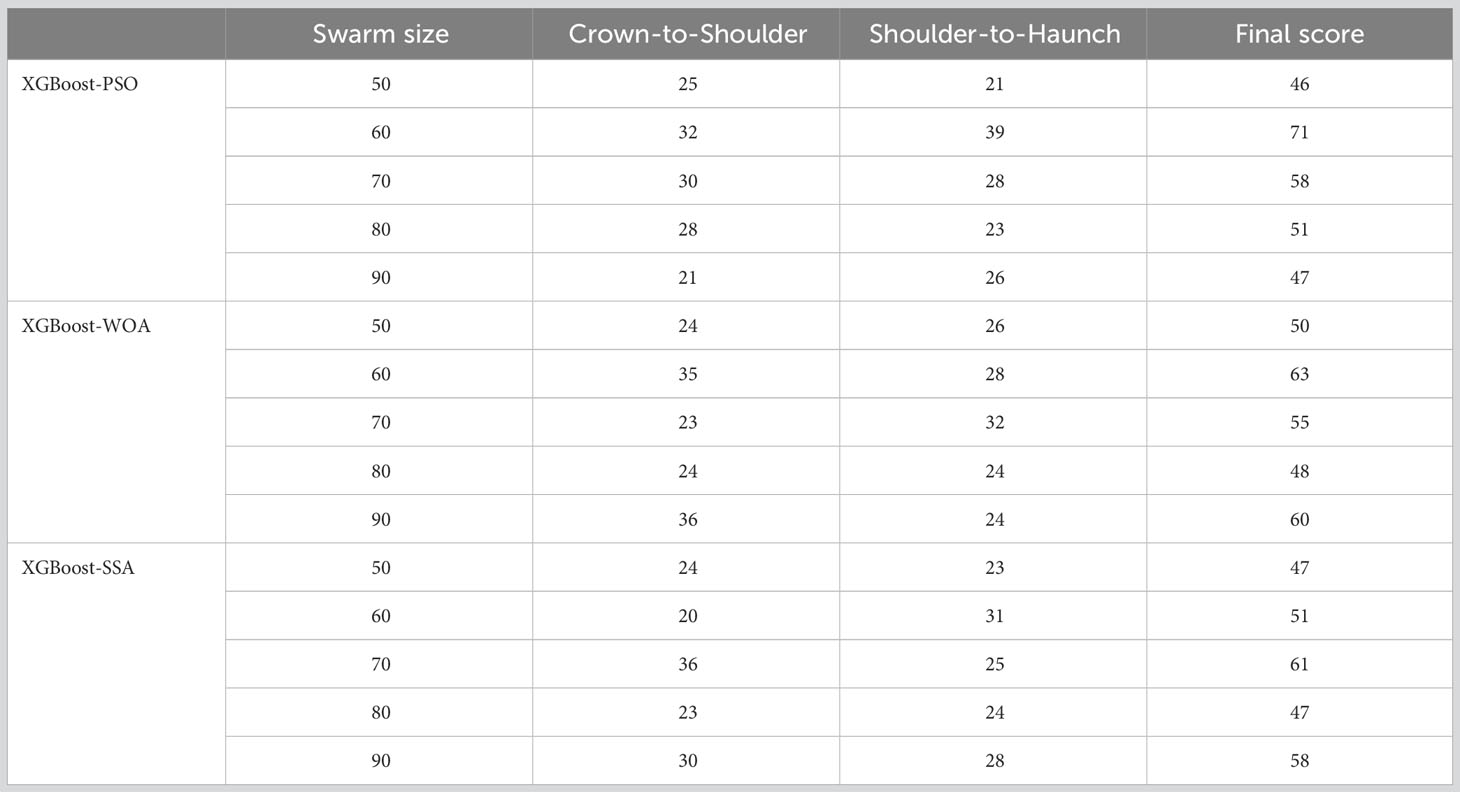
Table 3 Total performance scores for different swarm sizes of the predictive model.
To achieve optimal prediction of tunnel overbreak using PSO optimization, a swarm size of 60 demonstrates the strongest predictive capability. In the arch crown to shoulder section, the , , , and values for the training set are 0.99999, 0.000025724, 0.0033966, and 99.9994%, respectively. For the testing set in the same section, the corresponding values are 0.91805, 0.0045527, 0.026009, and 92.7639%. Remarkably, this swarm size also exhibits impressive predictive performance for the shoulder to haunch section of the tunnel. In the training set for this section, the , , , and values are 0.99999, 0.0000038818, 0.0012167, and 99.9993%, respectively, while in the testing set, the values are 0.99996, 0.0000009, 0.0006593, and 99.9961%. These findings highlight the impressive predictive abilities of the chosen swarm size, effectively estimating tunnel overbreak for both the arch crown to shoulder and shoulder to haunch sections, respectively.
Similar to XGBoost-PSO, the optimization process of WOA is showcased initially, as depicted in Figure 7. Merely based on the distinction in swarm size, it remains challenging to differentiate significantly, with similar degrees of convergence during iterations. The convergence during iterations serves as the first step to evaluate the stability and training adequacy of the model. If this step fails to provide distinguishing characteristics, differentiation becomes necessary through the summation of scores. In Figures 8, 9, a comprehensive depiction is presented, illustrating the detailed metric data and corresponding scores for each indicator with different swarm sizes and tunnel sections, in the context of WOA optimization. The optimal swarm size can be identified through Figures 8, 9, but to optimize the expression and address the numerous indicators and lack of direct relationships among them, Table 3 is introduced, which represents the cumulative scores of indicators for the arch crown to shoulder and shoulder to haunch sections, obtained with swarm sizes ranging from 50 to 90. This approach facilitates a more comprehensive assessment by integrating numerical and visual elements, enabling the determination of superiority or inferiority.
Analyzing the data in Table 4, it is evident that in XGBoost-WOA, the swarm size of 60 exhibits the overall highest predictive capability, although its score for the arch crown to shoulder section is lower than that of the swarm size of 90. However, this does not imply that the former has weaker predictive ability compared to the latter. By considering Figure 8, it can be observed that the swarm size of 90 primarily achieves higher scores on the training set, while the predictive performance of testing set does not surpass that of the swarm size of 60. Similarly, the predictive capability of the swarm size of 70 deserves recognition, particularly for the shoulder to haunch section. However, it does not demonstrate such prominence in the other dataset, indicating a need for further verification of its generalization ability. This also implies that the model at this stage should not be adopted, as it may exhibit poor predictions on new data. Furthermore, accurate prediction is an integral part of blasting optimization, necessitating the utilization of a model with strong generalization capability and accurate predictions.
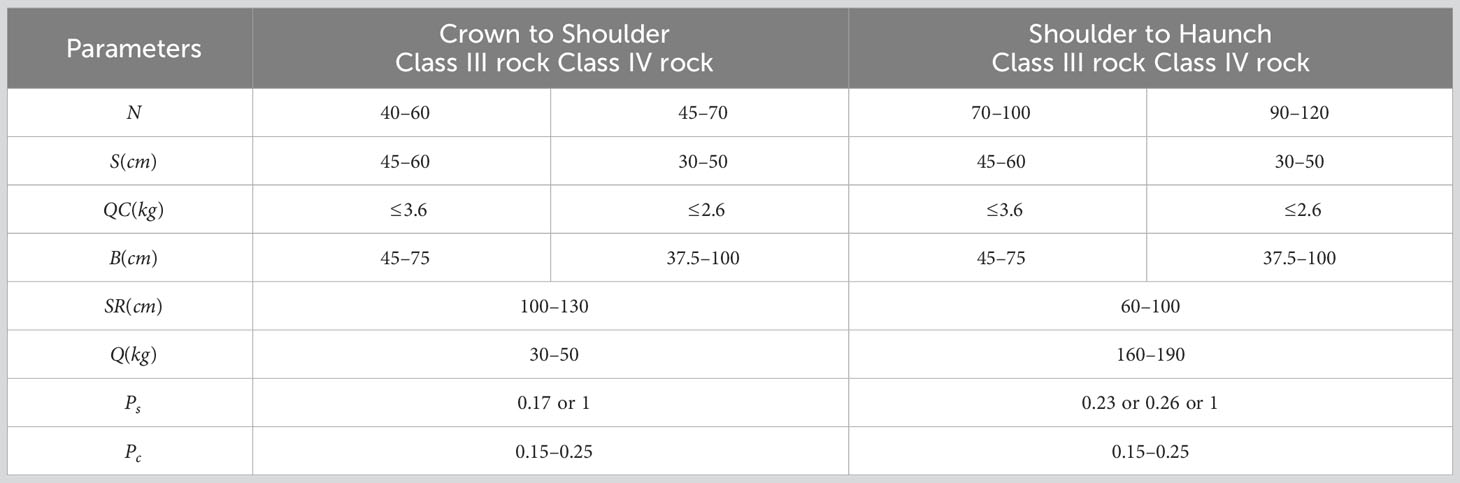
Table 4 Range of blasting parameter values for different geological conditions.
In summary, the optimal swarm size of 60 is determined for the WOA-optimized XGBoost model used in predicting tunnel overbreak. At this swarm size, the measured and predicted values exhibit a close alignment, Specifically, for the arch crown to shoulder section, the metrics , , , and demonstrate remarkable values in the training set are 0.99999, 0.000022766, 0.0030607, and 99.9994%, respectively. In the testing set, the corresponding values are 0.91342, 0.0043292, 0.023462, and 92.3185%. For the shoulder to haunch section, the , , , and values between the measured and predicted values are noteworthy in the training set are 0.99999, 0.0000045625, 0.0014242, and 99.9993%. In the testing set, the corresponding values are 0.99997, 0.0000006, 0.000621, and 99.9972%.
The novel metaheuristic algorithm SSA has demonstrated favorable performance in optimization tasks (Lu et al., 2022; Xu et al., 2023; Zhou et al., 2023). However, its suitability for this particular problem needs to be further evaluated through comparative screening. Analysis of the optimization process of SSA with varying swarm sizes, as depicted in Figure 10, In Figure 10A, it can be observed that the fitness values for swarm sizes of 50 and 60 are relatively higher, indicating poor convergence compared to the other three swarm sizes. The calculation of fitness values, as described by Eq. (24), involves the relationship between the measured and predicted values, indicating its capability to capture the fitting ability to the training set. Consequently, for the optimization process from arch crown to shoulder, these two swarm sizes are directly discarded. For fitness values that show no apparent distinction, a selection process is applied by comparing the scores of four metrics.
After discarding swarm sizes of 50 and 60, the performance of swarm size 70 draws attention from Table 3 and Figures 11, 12, achieving the highest overall score, particularly in the arch crown to shoulder section, exhibiting the most exceptional performance among all. The performance of swarm size 90 should not be overlooked either, as it demonstrates notable capabilities. From the scores in Table 3, it can be inferred that the performance of the swarm size is relatively stable. However, it is premature to draw conclusions solely based on this information. It is imperative to meticulously analyze the data presented in Figures 11, 12, evaluating the actual performance of the swarm size. From Figures 11A, 12A, it can be observed that there is minimal disparity in the performance metrics of all models on the training set, despite the provision of graded ratings. Within the spectrum of SSA-based optimization models, the values for the training set are close to 1, indicating rapid convergence and steadfast terminal values during model training. Hence, the primary differentiation lies in the predictive performance on the testing set, wherein the swarm size of 70 exhibits superior capabilities compared to the performance scores of different metrics with various swarm sizes, as depicted in Figures 11B, 12B. The scores for swarm sizes of 50 and 60 have also been statistically analyzed in Table 3, confirming their relatively poor predictive abilities, and validating the observed phenomenon of high fitness values in Figure 10A. It is not excluded that when the swarm size is 80, there may be lower fitness values and correspondingly lower scores for evaluation metrics, as the calculation methods for predicted values and measured values in the fitness function, as well as in the evaluation metrics of the model, lack a direct connection or correspondence. In practical model training processes, simpler approaches can be employed to determine the expression of the fitness function. For instance, utilizing a metric like , which reflects the relationship between predicted values and measured values, researchers have directly employed similar metrics as fitness calculation methods for model training (Urbanek et al., 2015).
In optimizing the prediction of XGBoost using SSA, the selection of a swarm size of 70 is representative in this type of optimization. It can accurately predict the extent of overbreak after tunnel blasting. The , , , and values between the predicted overbreak values and the measured values for the training set from the arch crown to the arch shoulder are 0.99999, 0.00002189, 0.0031407, and 99.9994%, respectively. Similarly, for the testing set within the same section, the values are 0.93666, 0.0035189, 0.02257, and 94.3496%. Exceptional performance is also observed in the dataset from the shoulder to haunch, the training set covering the shoulder to the haunch yields values of 0.99999, 0.0000045749, 0.0013514, and 99.9992%. The testing set in the same section exhibits values of 0.94964, 0.0011121, 0.014919, and 95.9831%.
PSO, WOA, and SSA were employed to optimize XGBoost with varying swarm sizes. It is noteworthy that the optimal swarm size differs among these optimization algorithms. The optimal swarm sizes corresponding to these three distinct optimization algorithms have been identified in Sects. 5.1, 5.2, and 5.3, respectively. However, the previous categorization was limited to comparisons within each algorithm. to further optimize the parameters, a comparison among the selected models is still necessary to identify the most suitable model for prediction. As discussed in Sect. 5.3, the differences in the training set among the SSA models are minimal. In fact, not only that, based on the metrics of the training set depicted in Figures 5A, 6A, 8A, 9A, it can be observed that all models in the entire research article exhibit exceptional performance on the training set, with minimal variation among them. This indirectly indicates the suitability of XGBoost for this problem. Distinctions and selections should be made regarding the predictive capabilities on the testing set. Figure 14 illustrates the relationship between the predicted values and the measured values for the testing set using PSO, WOA and SSA optimization approaches. The first nine data points in Figure 14 correspond to the prediction of the arch crown to the arch shoulder, while the subsequent eight data points correspond to the prediction of the shoulder to the haunch.
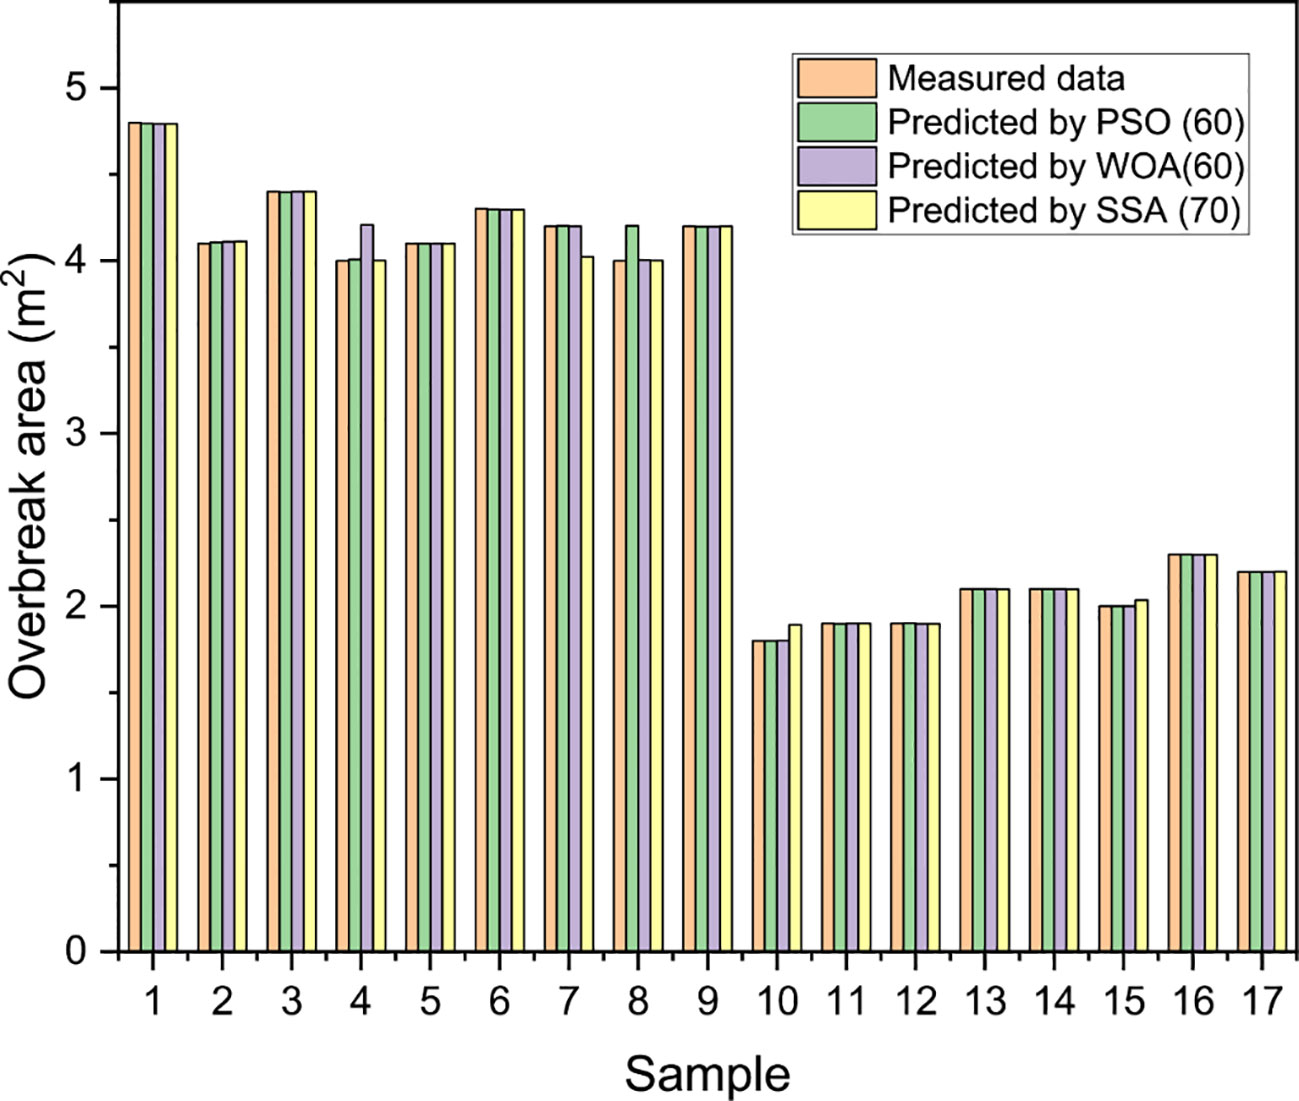
Figure 14 Comparison between measured and predicted value.
The predicted values and actual measurements in Figure 14, as well as the differences among the predicted values, exhibit minimal discrepancies. The conclusion drawn from these minute differences is that all three algorithm-optimized models can be employed for overbreak prediction. The values of each metric with the optimal swarm size for each optimization algorithm are presented in Figure 15, revealing that each optimization algorithm is suitable for specific data sets. For instance, in the overbreak prediction of the testing set from the arch crown to the arch shoulder, the and values obtained through PSO and WOA optimization are lower than those achieved through SSA optimization, while the and values are higher compared to SSA optimization. This observation indicates that PSO and WOA demonstrate lower optimization capabilities compared to SSA in this particular dataset. However, in the dataset from the shoulder to the waist section, a completely contrasting outcome emerges, challenging the aforementioned conclusion.
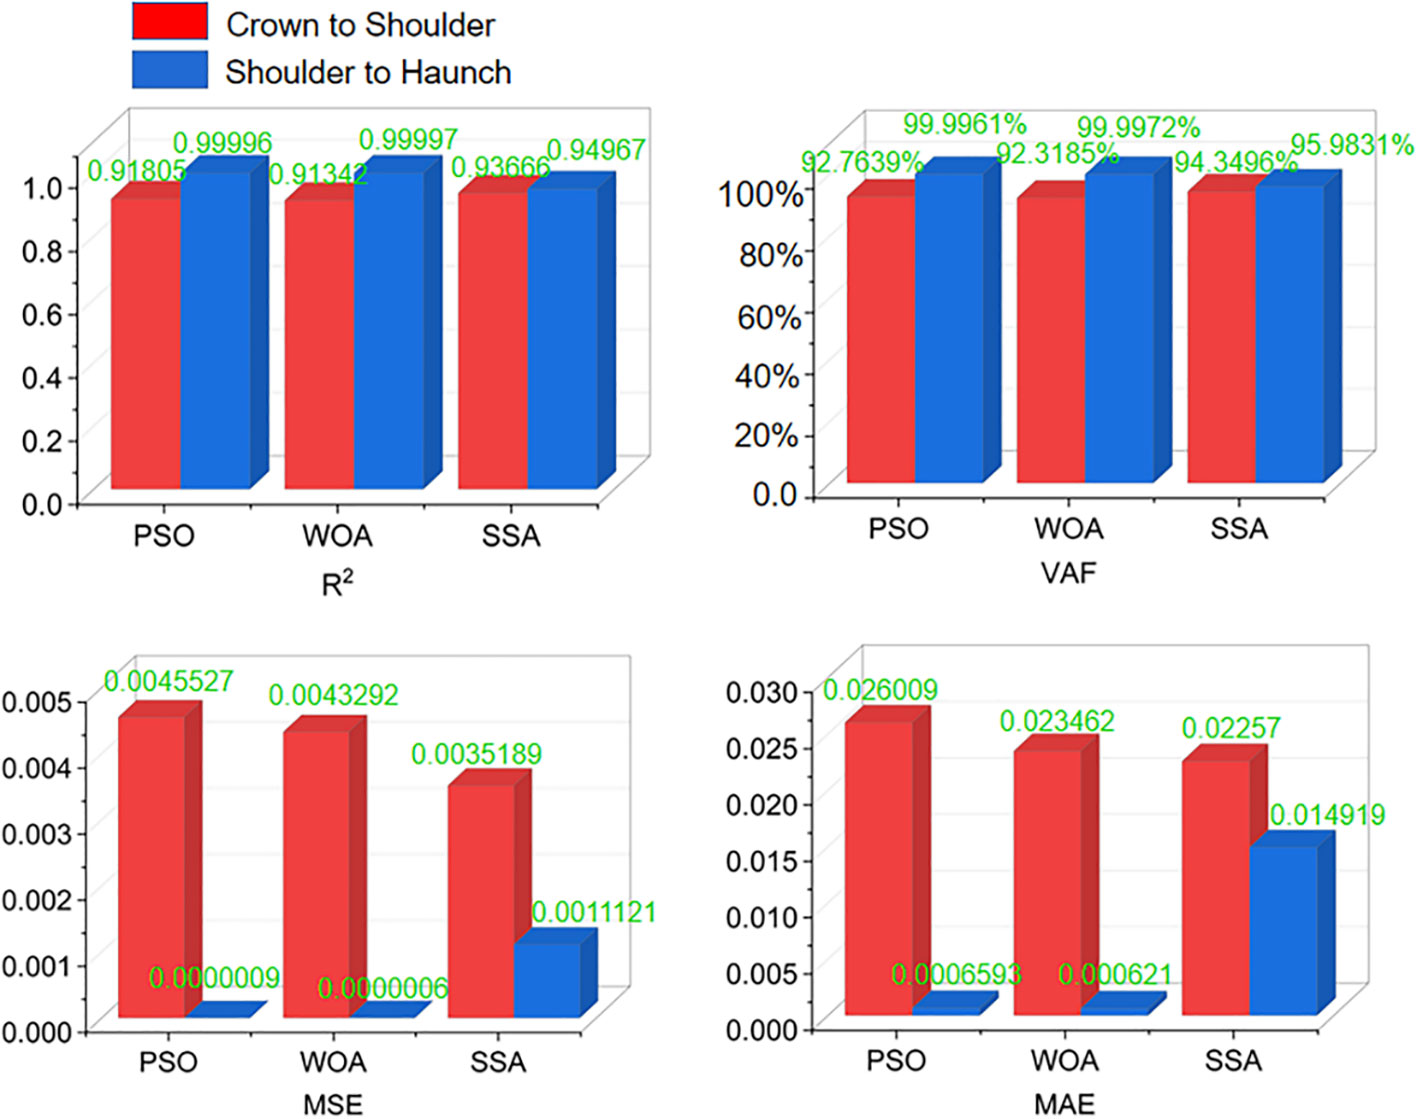
Figure 15 Performance of four metrics on the testing set with the optimal swarm size.
The generalization ability of a model is a crucial evaluation criterion that must be considered (Jin et al., 2019). The difference in values for each metric between the two datasets in Figure 15, also reflects generalization capability of the model. Based on the observed trends in Figure 15, it is evident that SSA exhibits the highest stability. It consistently yields elevated values for both datasets, indicating its strong robustness. Conversely, PSO and WOA demonstrate drastic fluctuations. In XGBoost optimized using various metaheuristic algorithms, similar to SSA, its advantages are magnified with increasing dataset sizes, leading to a significant reduction in overbreak in practical engineering applications. Hence, the optimal model derived from this study is the XGBoost-SSA model with a swarm size of 70, which will be employed for subsequent parameter optimization research.
For the already selected optimal predictive model, mere prediction alone is insufficient to achieve the objective of reducing overbreak. Leveraging the accurate predictive capability of the established model, it is possible to forecast the overbreak values corresponding to all blasting parameters within the design range. Subsequently, by exploiting the characteristics of the PSO, WOA, and SSA algorithms, the minimal overbreak value along with the corresponding blasting parameters can be identified. The specific process is depicted in Figure 13B. The detailed description of the steps is as follows:
1) A swarm size of 70 particles was set, and the XGBoost model was optimized using the SSA algorithm for a total of 300 iterations. The training process involved separate training of the arch crown to shoulder and arch shoulder to waist datasets. Subsequently, the trained and completed XGBoost-SSA model is outputted, which was ready for use.
2) The real-time geological information of the tunnel face is determined. The real-time geological information of the tunnel face is determined, and based on this information, a range of blasting parameters is generated. In the context of this study, the geological conditions that need to be determined include , , and . The range of blasting parameters varies according to different sections of the tunnel. In this study, based on the findings of Zhang (2019) and the guidelines provided by the Ministry of Transport of the People’s Republic of China (2020), the ranges of parameters can be obtained as presented in Table 4.
3) The algorithm generates a swarm of smooth blasting parameter sets based on the geological conditions and Table 4. The overbreak values corresponding to the parameter sets are calculated using the trained optimal model.
4) By employing three distinct optimization algorithms, i.e. PSO, WOA, and SSA, the minimum overbreak value and the corresponding blasting parameters that minimize the overbreak are identified.
5) The optimization results, as well as the required optimization time with the same conditions, are compared for each algorithm.
Reducing overbreak has always been a challenge (Kim and Moon, 2013), and the objective of this study is to provide a solution that minimizes overbreak control. In the optimization approach described in Sect. 6.1, by calculating the overbreak values corresponding to all blast parameter combinations that meet the rock conditions, we can utilize the optimization algorithm to find the minimum overbreak value and its corresponding blast parameter values. Different optimization algorithms will inevitably yield different results.
In this study, a comparison is made between the final overbreak values and the overall optimization time, to showcase the applicability and advantages of the optimization algorithms. It should be noted that the parameter settings for each optimization algorithm are still based on Table 2. For the sake of convenient comparison, the optimization process continues to employ the previously determined iteration count and swarm size, with a swarm size of 70 and an iteration count of 300. Each set of particles represents a unique combination of blast parameters, resulting in a total of 21,000 possible combinations of particles representing different blasting parameter configurations being considered, aiming to comprehensively identify potential overbreak values while meeting the specified criteria. To minimize errors, the operations are performed on the same computer.
Based on a specific tunnel face data from Zhang (2019), which includes a of 36.8 kPa, grade IV, of 72m, and of 0.7, optimization of parameters was conducted for two sections, i.e. from the crown to the shoulder and from the shoulder to the haunch. Figure 16 illustrates the final minimum values and the corresponding time required for the three algorithms. The unit of is measured in square meters (), and the unit of time is measured in seconds (). The area of the circular disk in Figure 16 is divided into three segments, with each segment representing the area of the final , while the radius of each ring represents the time required for the entire optimization process.
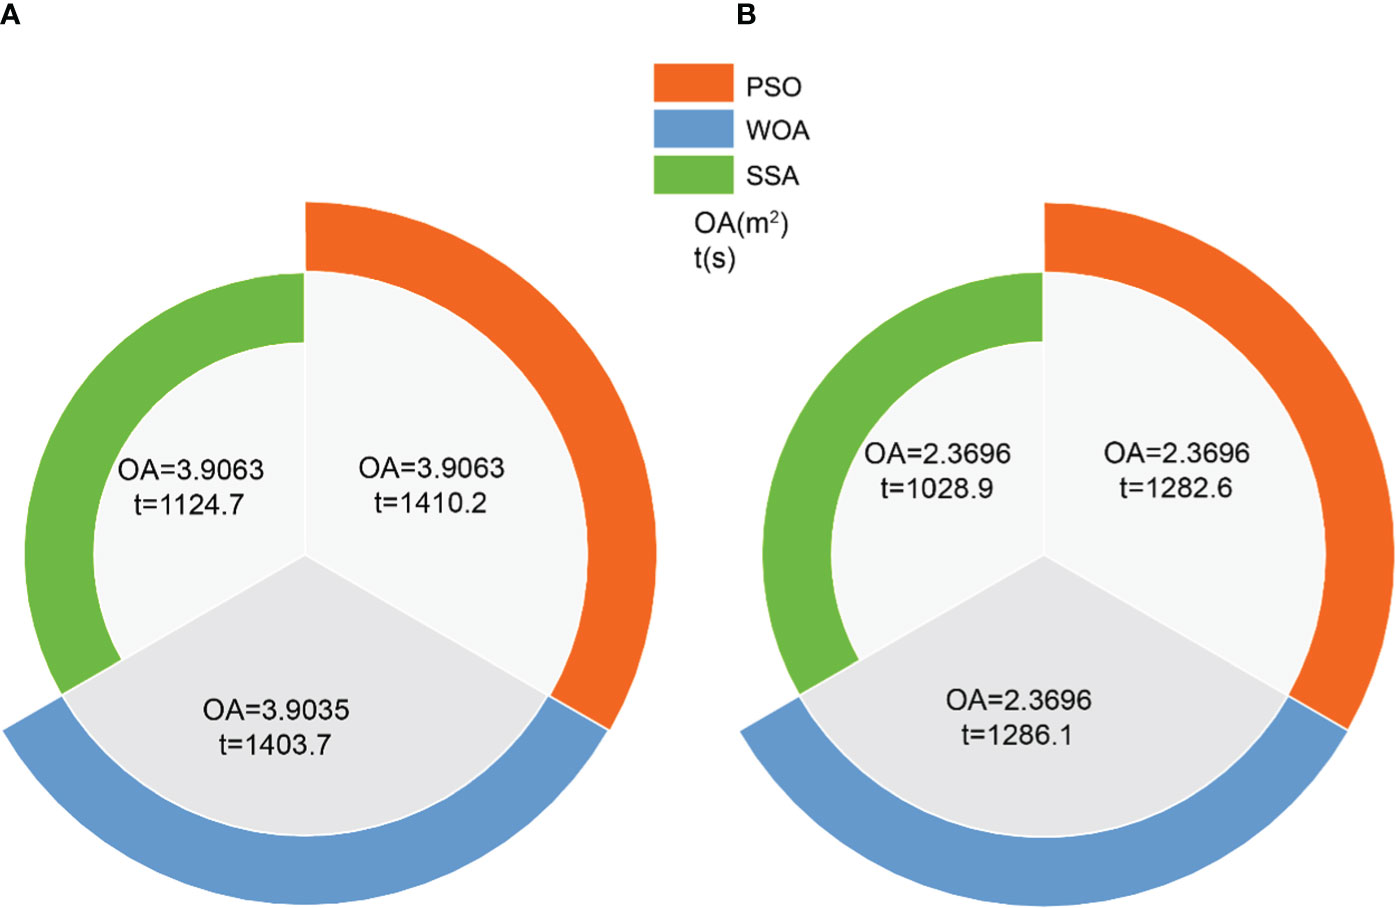
Figure 16 Optimized value for overbreak and the corresponding time: (A) crown to shoulder and (B) shoulder to haunch.
According to Figure 16, it is evident that for the two sections of the tunnel, the SSA algorithm requires significantly less time compared to the other two algorithms, with a difference of approximately 4–5 minutes. This establishes a clear advantage for the SSA algorithm in terms of time efficiency. Observing the minimized in Figure 16, the WOA algorithm yields a slightly smaller value of 3.9035 for the arch crown to shoulder section, while the other two algorithms produce a value of 3.9063 . The values are identical for the remaining sections. However, the WOA algorithm takes a much longer time, specifically 306 more than the SSA algorithm, which puts it at a significant weakness. When considering the marginal difference of 0.0028 in the overbreak area, the time disadvantage becomes more crucial.
In accord with the aforementioned analysis, SSA stands out as the optimal tool for uncovering the minimal overbreak. Within the realm of seeking the minimum , an exceptional capability is exhibited by the algorithm to achieve this objective, while substantially diminishing the associated time requirements. When dealing with engineering problems such as tunnel blasting, the slight difference in can be disregarded, considering the time savings that can be achieved. This allows for a more efficient handling of multiple cross-sections, thereby increasing productivity. In the face of large-scale projects involving multiple tunnel sections, the dominance of SSA over the other two optimization algorithms is undeniable.
To address the severe issue of overbreak caused by tunnel blasting, an urgent need arises to resolve it through the optimization of blasting parameters. In this study, a model is proposed for overbreak prediction and optimization in different sections of the tunnel, aiming to tackle this problem. To achieve this objective, a combination of XGBoost and three renowned metaheuristic algorithms, namely PSO, WOA, and SSA, is employed, resulting in the formation of XGBoost-PSO, XGBoost-WOA, and XGBoost-SSA for prediction purposes. By integrating with 5-fold cross-validation, the metaheuristic algorithm successfully identifies the optimal hyperparameters. A scoring system based on four metrics is used to evaluate the performance of the model, considering the significant impact of swarm size and iteration count on optimization effectiveness. The results demonstrate that XGBoost-SSA exhibits the best predictive capability and generalization ability, making it the optimal choice for subsequent parameter optimization research.
Based real-time geological conditions, the algorithm generates corresponding blast parameter ranges for different sections of the tunnel. By utilizing the best predictive model, the overbreak values corresponding to all blasting parameters within this range are computed. Subsequently, the best overbreak value is determined through the application of three optimization algorithms i.e. PSO, WOA and SSA. The results indicate that when a sufficiently large swarm size is generated, meaning that there are enough different blasting parameter combinations corresponding to blasting design scenarios, the optimization algorithm consistently identifies nearly identical minimum values. Even in the presence of disparities, these variations can be completely ignored in tunnel blasting engineering problems. The primary divergence lies in the computational time required for the entirety of the optimization process. According to the parameter optimization results from this study, SSA can achieve the optimal overbreak result in the shortest time. SSA saves 4–5 minutes compared to PSO and WOA while achieving the same outcomes. Expanding the time savings to multiple cross-sections, can yield substantial temporal benefits for the entire project duration.
The original contributions presented in the study are included in the article/supplementary material. Further inquiries can be directed to the corresponding author.
YL: Methodology, Writing – original draft. AL: Formal Analysis, Methodology, Software, Supervision, Writing – review & editing. HZ: Investigation, Resources, Writing – original draft. JW: Software, Writing – original draft. FL: Software, Writing – original draft. RC: Investigation, Methodology, Software, Writing – review & editing. SW: Investigation, Resources, Writing – original draft. JY: Investigation, Resources, Writing – original draft.
The authors acknowledge the financial support provided by the National Natural Science Foundation of China (No. 52009002), the Fundamental Research Funds for the Central Universities, CHD (No. 300102212207), the Natural Science Foundation of Shaanxi Province (No. 2022JM-228), the Research Funds of Department of Transport of Shaanxi Province (Nos. 22-37K and 23-81X).
Author HZ is employed by Shaanxi Provincial Transport Planning Design and Research Institute Co., Ltd. Author JY is employed by Shaanxi Provincial Transport Planning Design and Research Institute Co., Ltd. Author SW is employed by CCCC Second Highway Engineering Co., Ltd.
The remaining authors declare that the research was conducted in the absence of any commercial or financial relationships that could be construed as a potential conflict of interest.
All claims expressed in this article are solely those of the authors and do not necessarily represent those of their affiliated organizations, or those of the publisher, the editors and the reviewers. Any product that may be evaluated in this article, or claim that may be made by its manufacturer, is not guaranteed or endorsed by the publisher.
Ak H., Iphar M., Yavuz M., Konuk A. (2009). Evaluation of ground vibration effect of blasting operations in a magnesite mine. Soil Dyn. Earthq. Eng. 29 (4), 669–676. doi: 10.1016/j.soildyn.2008.07.003
Chai S., Liu H., Song L., Li X., Fu X., Zhou Y. (2023). Static pressure and dynamic impact characteristics of filled jointed rock after frozen-thaw cycle damage. Front. Ecol. Evol. 11. doi: 10.3389/fevo.2023.1222676
Chen T., Guestrin C. (2016). “XGBoost: a scalable tree boosting system.” In: Proceedings of the 22nd ACM SIGKDD International Conference on Knowledge Discovery and Data. (New York, USA: Association for Computing Machinery), pp. 785e794.
Chen J., Qiu W., Zhao X., Rai P., Ai X., Wang H. (2021). Experimental and numerical investigation on overbreak control considering the influence of initial support in tunnels. Tunn. Undergr. Space. Technol. 115, 104017. doi: 10.1016/j.tust.2021.104017
Daraei A., Zare S. (2018). Prediction of overbreak depth in Ghalaje road tunnel using strength factor. Int. J. Min. Sci. Technol. 28 (4), 679–684. doi: 10.1016/j.ijmst.2018.04.013
Dey K., Murthy V. M. S. R. (2012). Prediction of blast-induced overbreak from uncontrolled burn-cut blasting in tunnels driven through medium rock class. Tunn. Undergr. Space. Technol. 28, 49–56. doi: 10.1016/j.tust.2011.09.004
Dimitraki L., Christaras B., Marinos V., Vlahavas I., Arampelos N. (2019). Predicting the average size of blasted rocks in aggregate quarries using artificial neural networks. Bull. Eng. Geol. Environ. 78, 2717–2729. doi: 10.1007/s10064-018-1270-1
Ding Z., Nguyen H., Bui X. N., Zhou J., Moayedi H. (2020). Computational intelligence model for estimating intensity of blastinduced ground vibration in a mine based on imperialist competitive and extreme gradient boosting algorithms. Nat. ResourRes. 29, 751–769. doi: 10.1007/s11053-019-09548-8
Ebrahimi E., Monjezi M., Khalesi M. R., Armaghani D. J. (2016). Prediction and optimization of back-break and rock fragmentation using an artificial neural network and a bee colony algorithm. Bull. Eng. Geol. Environ. 75, 27–36. doi: 10.1007/s10064-015-0720-2
Foderà G. M., Voza A., Barovero G., Tinti F., Boldini D. (2020). Factors influencing overbreak volumes in drill-and-blast tunnel excavation. A statistical analysis applied to the case study of the Brenner Base Tunnel–BBT. Tunn. Undergr. Space. Technol. 105, 103475. doi: 10.1016/j.tust.2020.103475
Gharehchopogh F. S., Namazi M., Ebrahimi L., Abdollahzadeh B. (2023). Advances in sparrow search algorithm: a comprehensive survey. Arch. Comput. Methods Eng. 30 (1), 427–455. doi: 10.1007/s11831-022-09804-w
He B., Armaghani D. J., Lai S. H. (2023). Assessment of tunnel blasting-induced overbreak: A novel metaheuristic-based random forest approach. Tunn. Undergr. Space. Technol. 133, 104979. doi: 10.1016/j.tust.2022.104979
Jang H., Kawamura Y., Shinji U. (2019). An empirical approach of overbreak resistance factor for tunnel blasting. Tunn. Undergr. Space. Technol. 92, 103060. doi: 10.1016/j.tust.2019.103060
Jang H., Topal E. (2013). Optimizing overbreak prediction based on geological parameters comparing multiple regression analysis and artificial neural network. Tunn. Undergr. Space. Technol. 38, 161–169. doi: 10.1016/j.tust.2013.06.003
Jin Y. F., Yin Z. Y., Zhou W. H., Shao J. F. (2019). Bayesian model selection for sand with generalization ability evaluation. Int. J. Numerical. Analytical. Methods Geomechanics. 43 (14), 2305–2327. doi: 10.1002/nag.2979
Kennedy J., Eberhart R. (1995). “Particle swarm optimization,” In: Proceedings of ICNN'95 - International Conference on Neural Networks (Perth, WA, Australia) 4, 1942–1948. doi: 10.1109/ICNN.1995.488968
Kim Y., Moon H. K. (2013). Application of the guideline for overbreak control in granitic rock masses in Korean tunnels. Tunn. Undergr. Space. Technol. 35, 67–77. doi: 10.1016/j.tust.2012.11.008
Kohavi R. (1995). “A study of cross-validation and bootstrap for accuracy estimation and model selection,” in Proceedings of the 14th international joint conference on artificial intelligence (IJCAI’95), vol. vol. 2. (San Francisco, USA: Morgan Kaufmann Publishers Inc.), 1137e1143.
Koopialipoor M., Armaghani D. J., Hedayat A., Marto A., Gordan B. (2019a). Applying various hybrid intelligent systems to evaluate and predict slope stability under static and dynamic conditions. Soft. Comput. 23 (14), 5913e5929. doi: 10.1007/s00500-018-3253-3
Koopialipoor M., Ghaleini E. N., Haghighi M., Kanagarajan S., Maarefvand P., Mohamad E. T. (2019b). Overbreak prediction and optimization in tunnel using neural network and bee colony techniques. Eng. Comput. 35, 1191–1202. doi: 10.1007/s00366-018-0658-7
Koopialipoor M., Jahed Armaghani D., Haghighi M., Ghaleini E. N. (2019c). A neuro-genetic predictive model to approximate overbreak induced by drilling and blasting operation in tunnels. Bull. Eng. Geol. Environ. 78, 981–990. doi: 10.1007/s10064-017-1116-2
Li E., Zhou J., Shi X., Armaghani D. J., Yu Z., Chen X., et al. (2021a). Developing a hybrid model of salp swarm algorithm-based support vector machine to predict the strength of fiber-reinforced cemented paste backfill. Eng. Comput. 37, 3519e3540. doi: 10.1007/s00366-020-01014-x
Li E., Yang F., Ren M., Zhang X., Zhou J., Khandelwal M. (2021b). Prediction of blasting mean fragment size using support vector regression combined with five optimization algorithms. J. Rock. Mech. Geotech. Eng. 13 (6), 1380–1397. doi: 10.1016/j.jrmge.2021.07.013
Lu D., Ma Y., Kong F., Guo C., Miao J., Du X. (2022). Support vector regression with heuristic optimization algorithms for predicting the ground surface displacement induced by EPB shield tunneling. Gondwana. Res. doi: 10.1016/j.gr.2022.07.002
Mandal S., Singh M., Dasgupta S. (2008). Theoretical concept to understand plan and design smooth blasting pattern. Geotech. Geol. Eng. 26, 399–416. doi: 10.1007/s10706-008-9177-4
Ministry of Transport of the People’s Republic of China (2020). Technical specifications for construction of highway tunnel (JTG/T3660—2020). Beijing: China Communications Press (in Chinese).
Mirjalili S., Lewis A. (2016). The whale optimization algorithm. AdvEng. Softw. 95, 51–67. doi: 10.1016/j.advengsoft.2016.01.008
Mohammadi H., Azad A. (2020). Applying rock engineering systems approach for prediction of overbreak produced in tunnels driven in hard rock. Geotech. Geol. Eng. 38 (3), 2447–2463. doi: 10.1007/s10706-019-01161-z
Mohammadi M., Hossaini M. F., Mirzapour B., Hajiantilaki N. (2015). Use of fuzzy set theory for minimizing overbreak in underground blasting operations–A case study of Alborz Tunnel, Iran. Int. J. Min. Sci. Technol. 25 (3), 439–445. doi: 10.1016/j.ijmst.2015.03.018
Mottahedi A., Sereshki F., Ataei M. (2018). Overbreak prediction in underground excavations using hybrid ANFIS-PSO model. Tunn. Undergr. Space. Technol. 80, 1–9. doi: 10.1016/j.tust.2018.05.023
Nguyen H., Drebenstedt C., Bui X. N., Bui D. T. (2020). Prediction of blast-induced ground vibration in an open-pit mine by a novel hybrid model based on clustering and artificial neural network. Nat. Resour. Res. 29 (2), 691–709. doi: 10.1007/s11053-019-09470-z
Poli R., Kennedy J., Blackwell T. (2007). Particle swarm optimization. Swarm. Intell. 1 (1), 33e57. doi: 10.1007/s11721-007-0002-0
Qiu Y., Zhou J., Khandelwal M., Yang H., Yang P., Li C. (2021). Performance evaluation of hybrid WOA-XGBoost, GWO-XGBoost and BO-XGBoost models to predict blast-induced ground vibration. Eng. Comput., 1–18. doi: 10.1007/s00366-021-01393-9
Rodriguez J. D., Perez A., Lozano J. A. (2010). Sensitivity analysis of k-fold cross validation in prediction error estimation. IEEE Trans. Pattern Anal. Mach. Intell. 32, 569e575. doi: 10.1109/TPAMI.2009.187
Salmi E. F., Sellers E. J. (2021). A review of the methods to incorporate the geological and geotechnical characteristics of rock masses in blastability assessments for selective blast design. Eng. Geol. 281, 105970. doi: 10.1016/j.enggeo.2020.105970
Tang L., Na S. (2021). Comparison of machine learning methods for ground settlement prediction with different tunneling datasets. J. Rock. Mech. Geotech. Eng. 13 (6), 1274–1289. doi: 10.1016/j.jrmge.2021.08.006
Tang Z., Yao W., Zhang J., Xu Q., Xia K. (2019). Experimental evaluation of PMMA simulated tunnel stability under dynamic disturbance using digital image correlation. Tunn. Undergr. Space. Technol. 92, 103039. doi: 10.1016/j.tust.2019.103039
Tian X., Song Z., Wang J. (2019). Study on the propagation law of tunnel blasting vibration in stratum and blasting vibration reduction technology. Soil Dyn. Earthq. Eng. 126, 105813. doi: 10.1016/j.soildyn.2019.105813
Urbanek T., Prokopova Z., Silhavy R., Vesela V. (2015). Prediction accuracy measurements as a fitness function for software effort estimation. SpringerPlus 4, 1–17. doi: 10.1186/s40064-015-1555-9
Wang M., Shi X., Zhou J. (2018). Charge design scheme optimization for ring blasting based on the developed Scaled Heelan model. Int. J. Rock. Mech. Min. Sci. 110, 199–209. doi: 10.1016/j.ijrmms.2018.08.004
Xu H., Zhou J., Asteris P. G., Jahed Armaghani D., Tahir M. M. (2019). Supervised machine learning techniques to the prediction of tunnel boring machine penetration rate. Appl. Sci. 9 (18), 3715. doi: 10.3390/app9183715
Xu C., Zhou K., Xiong X., Gao F., Lu Y. (2023). Prediction of mining induced subsidence by sparrow search algorithm with extreme gradient boosting and TOPSIS method. Acta Geotechnica., 1–17. doi: 10.1007/s11440-023-01830-7
Xue J., Shen B. (2021). A novel swarm intelligence optimization approach: sparrow search algorithm. Syst. Sci. Control. Eng. 8 (1), 22–34. doi: 10.1080/21642583.2019.1708830
Yu Z., Shi X., Zhou J., Rao D., Chen X., Dong W., et al. (2021). Feasibility of the indirect determination of blast-induced rock movement based on three new hybrid intelligent models. Eng. Comput. 37 (2), 991e1006. doi: 10.1007/s00366-019-00868-0
Zare S., Bruland A. (2006). Comparison of tunnel blast design models. Tunn. Undergr. Space. Technol. 21 (5), 533–541. doi: 10.1016/j.tust.2005.09.001
Zhang W. (2020). Research on blasthole image recognition algorithms and optimization of smooth blasting parameters of rock tunnel (Shandong, China: Shandong University, PhD dissertation.). doi: 10.27272/d.cnki.gshdu.2019.000354
Zhang D., Shen Y., Huang Z., Xie X. (2022). Auto machine learning-based modelling and prediction of excavation-induced tunnel displacement. J. Rock. Mech. Geotech. Eng. 14 (4), 1100–1114. doi: 10.1016/j.jrmge.2022.03.005
Zhao J. S., Jiang Q., Lu J. F., Chen B. R., Pei S. F., Wang Z. L. (2022). Rock fracturing observation based on microseismic monitoring and borehole imaging: In situ investigation in a large underground cavern under high geostress. Tunn. Undergr. Space. Technol. 126, 104549. doi: 10.1016/j.tust.2022.104549
Zhao J. S., Jiang Q., Pei S. F., Chen B. R., Xu D. P., Song L. B. (2023). Microseismicity and focal mechanism of blasting-induced block falling of intersecting chamber of large underground cavern under high geostress. J. Cent. South Univ. 30 (2), 542–554. doi: 10.1007/s11771-023-5259-y
Zhou J., Dai Y., Huang S., Armaghani D. J., Qiu Y. (2023). Proposing several hybrid SSA—Machine learning techniques for estimating rock cuttability by conical pick with relieved cutting modes. Acta Geotechnica. 18 (3), 1431–1446. doi: 10.1007/s11440-022-01685-4
Zhou J., Li X., Mitri H. S. (2016). Classification of rockburst in underground projects: comparison of ten supervised learning methods. J. Comput. Civ. Eng. 30 (5), 04016003. doi: 10.1061/(ASCE)CP.1943-5487.0000553
Keywords: tunnel blasting, overbreak prediction, parameter optimization, metaheuristic algorithms, geological condition
Citation: Liu Y, Li A, Zhang H, Wang J, Li F, Chen R, Wang S and Yao J (2023) Minimization of overbreak in different tunnel sections through predictive modeling and optimization of blasting parameters. Front. Ecol. Evol. 11:1255384. doi: 10.3389/fevo.2023.1255384
Received: 08 July 2023; Accepted: 07 August 2023;
Published: 04 September 2023.
Edited by:
Yongqiang Zhou, Chinese Academy of Sciences (CAS), ChinaReviewed by:
Tianjiao Li, Dalian University of Technology, ChinaCopyright © 2023 Liu, Li, Zhang, Wang, Li, Chen, Wang and Yao. This is an open-access article distributed under the terms of the Creative Commons Attribution License (CC BY). The use, distribution or reproduction in other forums is permitted, provided the original author(s) and the copyright owner(s) are credited and that the original publication in this journal is cited, in accordance with accepted academic practice. No use, distribution or reproduction is permitted which does not comply with these terms.
*Correspondence: Ang Li, YW5nbGlfNjEzQGNoZC5lZHUuY24=
Disclaimer: All claims expressed in this article are solely those of the authors and do not necessarily represent those of their affiliated organizations, or those of the publisher, the editors and the reviewers. Any product that may be evaluated in this article or claim that may be made by its manufacturer is not guaranteed or endorsed by the publisher.
Research integrity at Frontiers
Learn more about the work of our research integrity team to safeguard the quality of each article we publish.