 Tangjin Ye1,2
95% of researchers rate our articles as excellent or good
Learn more about the work of our research integrity team to safeguard the quality of each article we publish.
Find out more
ORIGINAL RESEARCH article
Front. Ecol. Evol. , 03 July 2023
Sec. Environmental Informatics and Remote Sensing
Volume 11 - 2023 | https://doi.org/10.3389/fevo.2023.1221915
Rockfalls on debris slopes pose a significant hazard to canyon roads on the Tibetan Plateau. In order to assess risks and develop effective engineering solutions, it is crucial to fully understand the characteristics and processes of rockfall movement. This research utilizes UAVs and three-dimensional (3D) laser scanners to capture images and data, while Pix4D is employed to create a high-precision 3D model from the collected data. Unity3D is utilized to analyze the movement characteristics and deposition positions of rockfall. Various movement characteristic indexes, such as velocity, acceleration, displacement, energy loss, and deposit position, are computed and examined for blocks with different shapes, sizes, instability types on the debris slope, and blocks composed of various slope materials and inclinations. The aim is to obtain insights into the specific movement mechanisms of debris slopes, which differ from conventional slopes. Field experiments have confirmed the effectiveness of the Unity3D simulation approach. Building upon this foundation, a high-precision 3D simulation model for the debris slope of the G318 Highway on the Tibetan Plateau is developed using Unity3D. This model is used to calculate the movement characteristics, energy variation, and deposition positions of rockfall. The findings are then compared with those of common models. The results demonstrate that the high-precision 3D simulation model computed by Unity3D provides more accurate and reasonable results compared to the common model. Moreover, the movement characteristics, energy variation, and deposition positions of rockfall on debris slopes exhibit specific characteristics. By employing Unity3D simulation analysis, a comprehensive understanding of the phenomena and behavior of rockfall on debris slopes can be achieved, enabling the proposal of more reasonable engineering protection measures.
The debris slope rockfall disease is the most common and special geological disaster in the Qinghai Tibet Plateau, which seriously impacts highway traffic, as shown in Figure 1. The debris slope, with loose rock debris, which essential component is Qesl, such as broken stone and sandy gravel, is formed by a unique geology and climatic conditions (Woltjer et al., 2008; Lin et al., 2022; Zhang et al., 2023). There is no cementation or weak cementation between particles characterized by instability. Rockfall disasters are caused by the debris particles down from the slope based on gravity, earthquake, and freeze–thaw. For the research on debris slope (Sharpe, 1938), the concept of debris slope was proposed and classified. Caine (Caine, 1980) discovered that earthquakes and rainfall are the major factors of debris slope instability. Evans and Hungr (Evans and Hungr, 1993) evaluated the risk of rockfalls on debris slopes using geological evidence, an empirical approach, physical modeling, and an analytical model based on a calculating machine. After 2000 years, with infrastructural development in western China (Zhang et al., 2010; Zhang et al., 2014; Ye et al., 2018; Wang et al., 2021), research on debris slopes has been conducted based on highway engineering. However, very few studies have focused on disasters caused by a broken stone falling from a debris slope; studies in the literature mainly focused on the debris slope’s reason, instability, and accumulated characteristics.
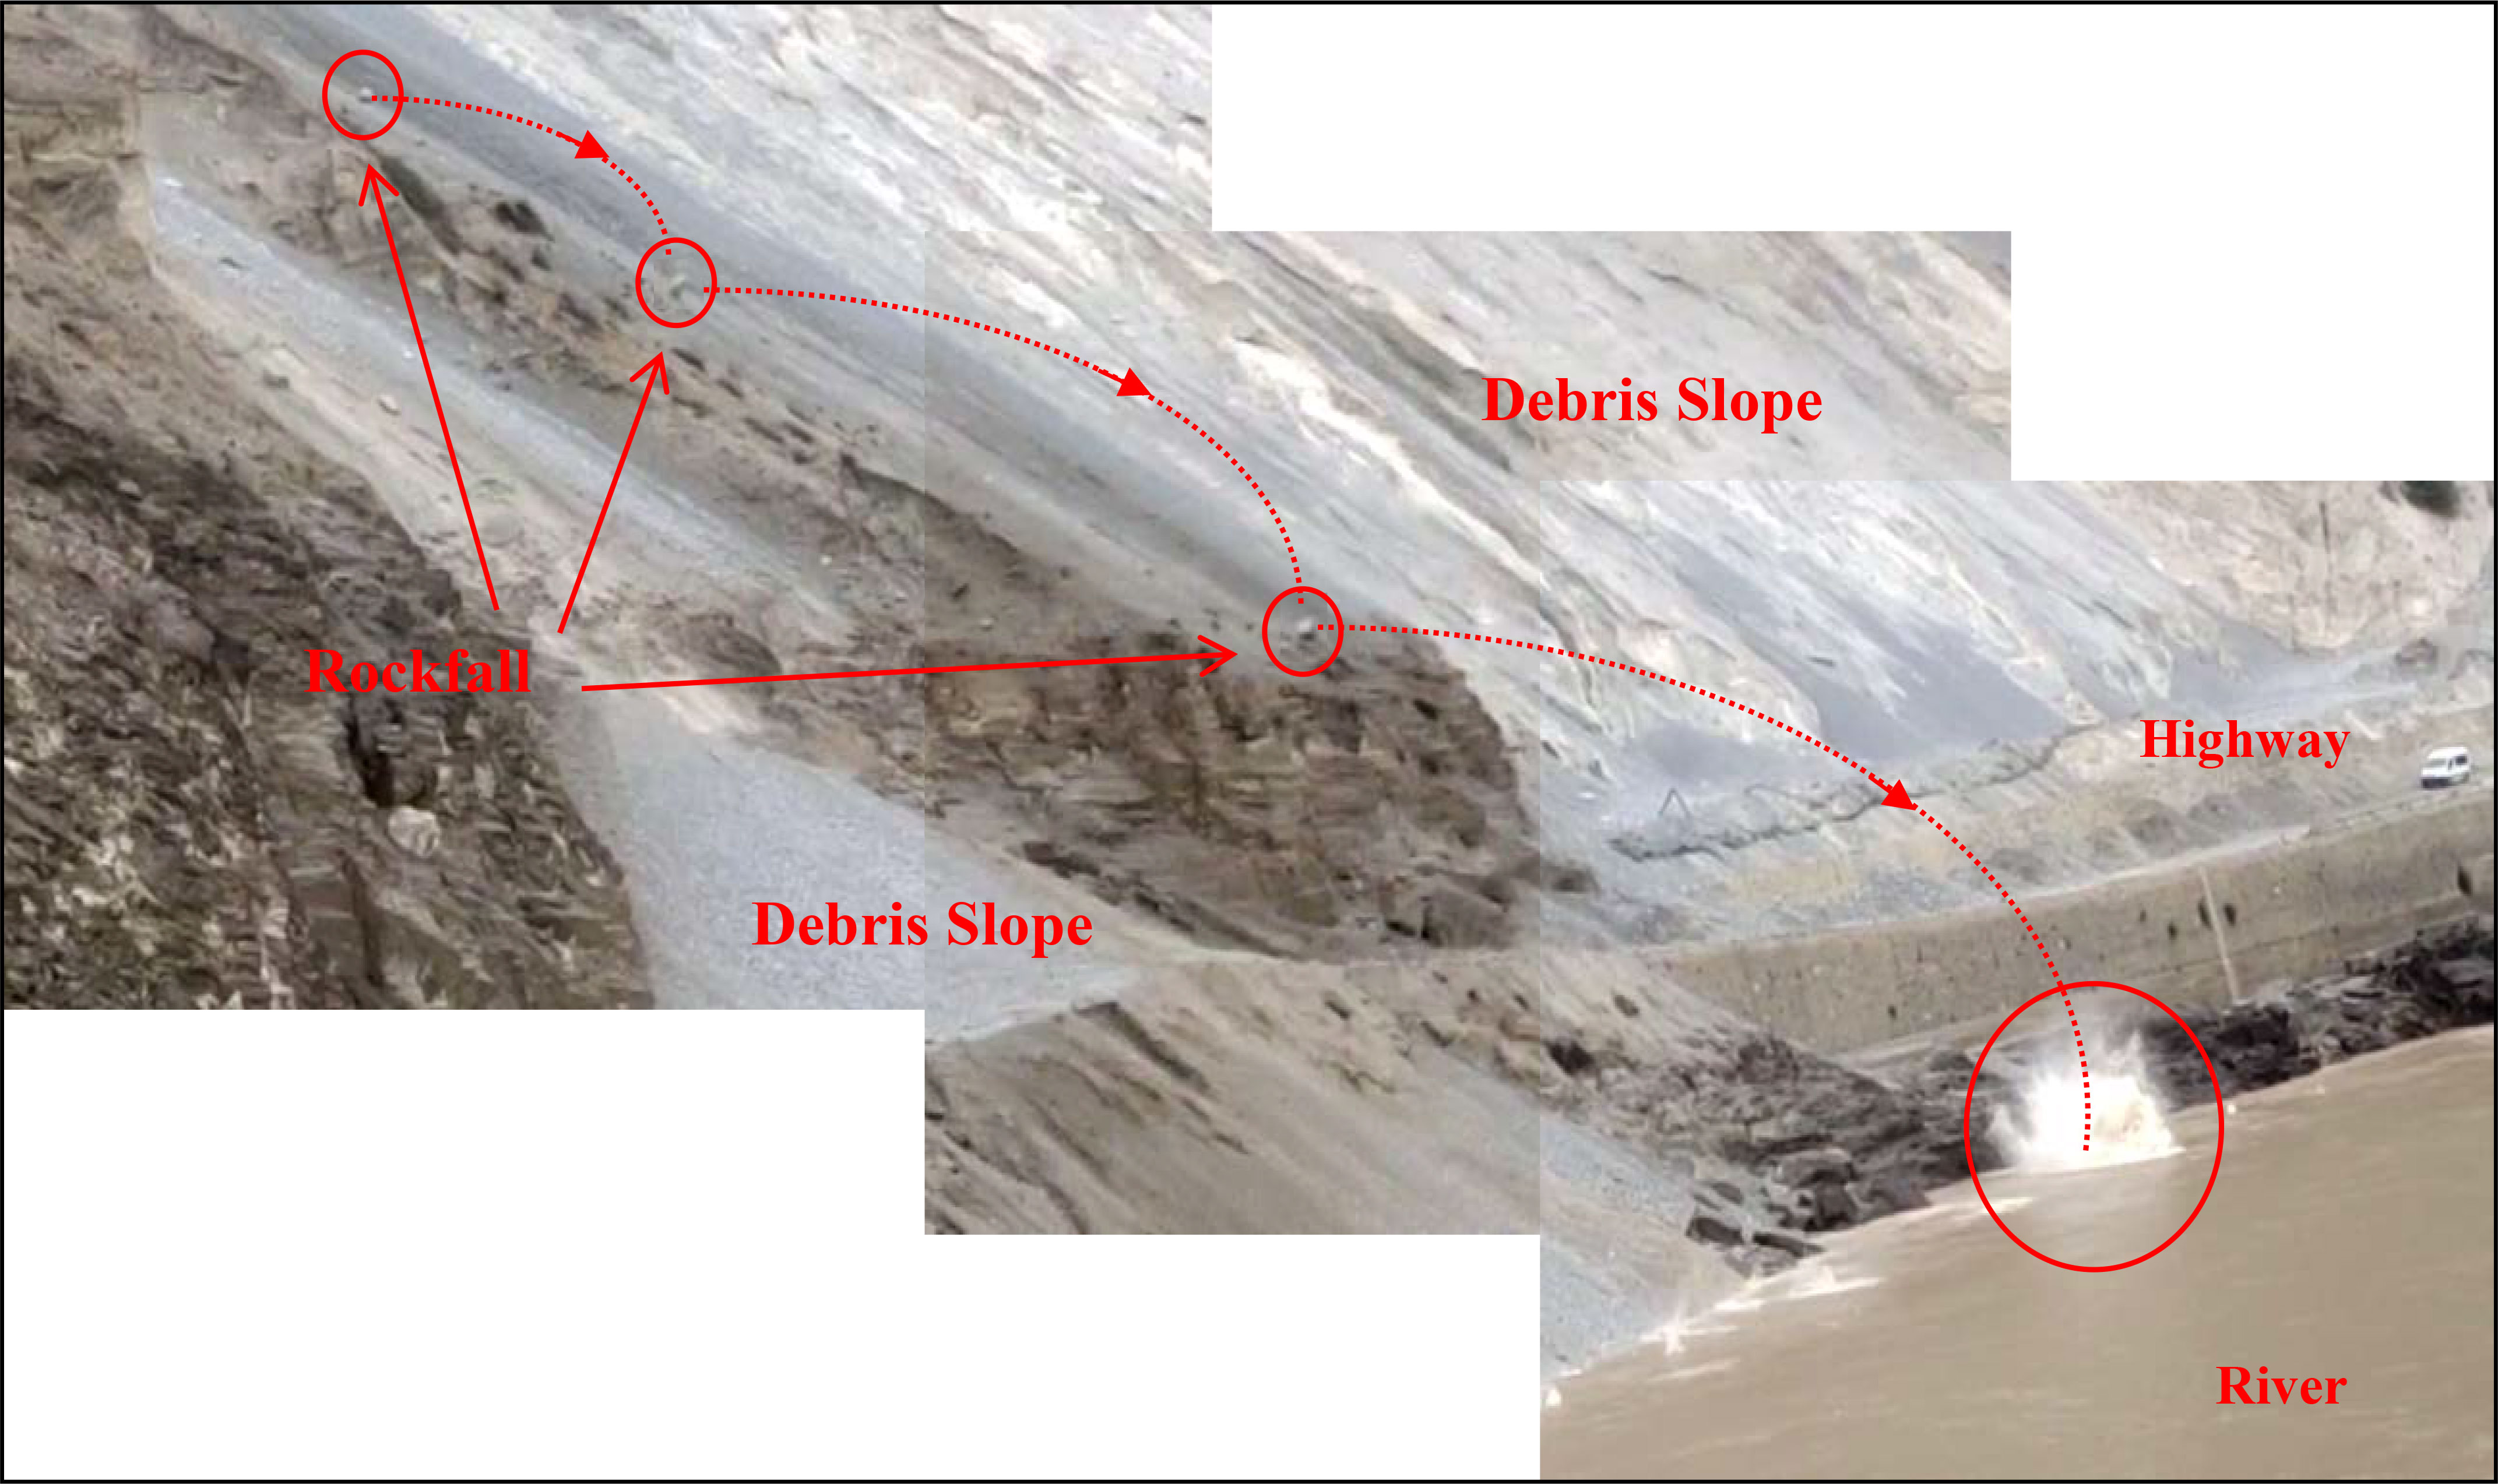
Figure 1 The movement of falling rocks on a debris slope.
There are many softwares for numerical simulation analysis of rockfall movement (Jones et al., 2000), such as Rockfall, STONE, GeoRock, and UEDC, all of which have advantages and disadvantages (Chen et al., 2013). A multi-quality system approach is extremely popular, and it assumes that both the block and slope are in an ideal condition and that the block is in the dimensionless context, the mass is concentrated in the centroid, and the slope is homogeneous and smooth. The influence of the rock block’s geometry and size on its movement characteristics is neglected (Guzzetti et al., 2002; Hu et al., 2020); thus, the results of the numerical simulation approach are inconsistent with the actual rockfall phenomenon. The movement characteristics, energy loss, and deposited position of rockfall are not only affected by inclination, slope material, and rockfall instability type but also affected by geometrical shape and size. Thus, it is crucial to examine rockfall movement characteristics with a more ideal numerical simulation approach (Fu et al., 2021; Bonneau et al., 2022; Zheng et al., 2022).
Recently, data acquisition using unmanned aerial vehicles (UAV; Ruzgienė et al., 2015) and three-dimensional (3D) laser scanners (Feng et al., 2013; Liu et al., 2019) has become more popular (Vu et al., 2011). A 3D high-precision simulation model (Dorren et al., 2006) has been developed for numerical analysis; the results are more accurate and reasonable, and the images are more realistic (Chiu et al., 2015; Yu et al., 2021). Thus, this modal is being increasingly favored by researchers. The Unity3D software developed by Unity Technologies company in Denmark is characterized by the following advantages: supporting several model formats, easy import of resources, and improved visualization effect (Wang et al., 2020); the blocks’ process and motion trail can be obtained by writing the script in the analysis of the whole process of 3D movement of rockfalls (Wang, 2009). In the simulation computation, Phys X integrated with the Unity3D engine can simultaneously detect the continuous collisions of multiple rockfalls, simulate the physical conditions such as the rolling, sliding, and bouncing off the rigid body (Cui, 2012), solve the issues of motion velocity, energy, and movement trail; and finally solve the visualization (Ondercin, 2016) of the process and deposit. This approach enhances numerical simulation accuracy effectively and can detect the movement and deposit position of multiple rockfalls (Sala, 2018). This result indicates that the Unity3D software has significant advantages in researching rockfall movement on debris slopes.
Whether the process and result of the simulation are reliable or not, an effective approach to confirm the result is by performing a physical model experiment, which can provide parameters for the simulation computation. In the physical model experiment (Liu et al., 2019), it is essential to accurately obtain rock blocks’ motion state, contact collision, and deposit characteristics. A high-speed camera can acquire abundant, clear image data and physical parameters, such as movement characteristics. Thus, it is ideal to employ a binocular high-speed camera system in physical model experience to study rockfalls’ movement law and deposit position.
To investigate the movement characteristics and deposit position of rocks on the debris slope of the Tibetan Plateau and to guarantee that the data is more accurate, images more realistic, and analysis results more reliable, UAV tilt photography was performed to obtain a Digital Surface Model of debris slope; moreover, 3D laser scanning was employed to obtain the position and size of the rocks on the slope in this research (Fu et al., 2021; Xue et al., 2021; He et al., 2022; Li et al., 2023). Then, Pix4D was employed to develop a high-precision simulation model, and Unity3D was employed to examine and simulate the process (Wu et al., 2022). Therefore, the data and images could be obtained, such as movement characteristics, the process of contact collision, the law of energy variation, and the rock deposit position on the debris slope. Finally, making the physical model experience and verifying the simulation results in the field by employing a binocular high-speed and high-definition camera system. Comparing these results with Unity3D, the effectiveness of Unity3D and the movement characteristics of rockfalls can be confirmed and investigated, respectively. Furthermore, Unity3D numerical parameters can be determined as per the experience results. The movement characteristics and disaster process of rockfall on the debris slope of the G318 Highway are quantitatively examined using Unity3D based on a field experiment.
In the research of debris slope, it is particularly difficult to accurately obtain 3D data on the slope and geometric parameters of rock fall. The key to examining the movement characteristics of rockfalls is establishing a 3D model of the slope with high-precision and geometric parameters of the rockfalls. Thus, this study employs RTK and UAV to collect a 3D model, then uses ILRIS-3D to obtain the geometric parameters and rockfalls’ position, and finally employs Pix4D to develop a high-precision 3D simulation model.
Real-Time Kinematic is an approach of differences for the real-time processing of carrier phase observations of two measuring stations. The user receiver can receive the carrier phase collected by a base station, compute the difference, and coordinate, which can achieve centimeter-level accuracy. This approach has the advantages of fast speed and high precision (Famiglietti et al., 2021). Thus, RTK is employed in this study to obtain 3D coordinates (longitude, dimension, and elevation) of marking points in different parts of the slope, the points are selected in the place where UAV can accurately recognize the position, and the number of the points should be more than three. To ensure accuracy, the marker points are generally arranged in different parts of the slope, with a number of nine or more. Furthermore, marker boards or marker paper are attached to the marker points, and parameters, such as the coordinates of the marker points, are measured with RTK and used in 3D modeling.
UAV has the advantages of simple and convenient operation, low price, clear images, abundant information, and not restricted by spatial position. Thus, the DJI UAV has been used to obtain images (Hawke and McConchie, 2011; Naus and Angel, 2017). As per the region of image acquisition and the requirement of post-processing for the date, the flight range, velocity, route, height, photo overlap, and shooting time of the UAV can be determined; furthermore, it is essential to take the whole photo and local photo. To guarantee the accuracy of 3D data processing for the latter slope, the repeatability of the photos was controlled to >70%, flight speed was controlled at 3 m/s, and speed was maintained at one photo per second.
In analyzing movement characteristics for rockfalls, it is crucial to ensure their spatial position and geometric data such as size, shape, and location. The 3D laser scanner (ILRIS-3D) is characterized by high-speed, high-density, high precision, and 3D spatial data that can be obtained without touching rock blocks (Hristov et al., 2019; Liu et al., 2019; Liu et al., 2020). Thus, a 3D laser scanner (ILRIS-3D) is employed to collect the data on rockfalls in this study. First, it is crucial to determine the position of the rockfalls and then determine the location, distance, and acquisition parameters of the 3D laser scanner. To ensure accuracy, in this study, the distance between a 3D laser scanner and rockfalls has to be controlled within 100–300 m to fulfill the accuracy requirement of rockfall blocks. Finally, PolyWorks 15, installed in the binocular high-speed camera system, can be employed to read gravel blocks’ geometric parameters and positions in field data.
First, screen the images collected by UAV, process the data, and delete unclear photos. Then, Pix4D was employed to deal with the photos captured by the UAV (Li and Shi, 2020); in this process, it is necessary to export the image and find landmarks, then mark RTK coordinate data, Digital Surface Model file for slope can be generated. The next step is trimming the 3D point cloud-operated using 3D MAX software and translating it into DSM format. Finally, PolyWorks15 was employed to process the data collected by the IlRIS-3D laser scanner; thus, the data, such as spatial position and geometrical shape of rockfall, can be obtained, calibrated, and generated on the debris slope. Based on these steps, the Unity3D high-precision simulation computation model can be obtained, as shown in Figure 2.
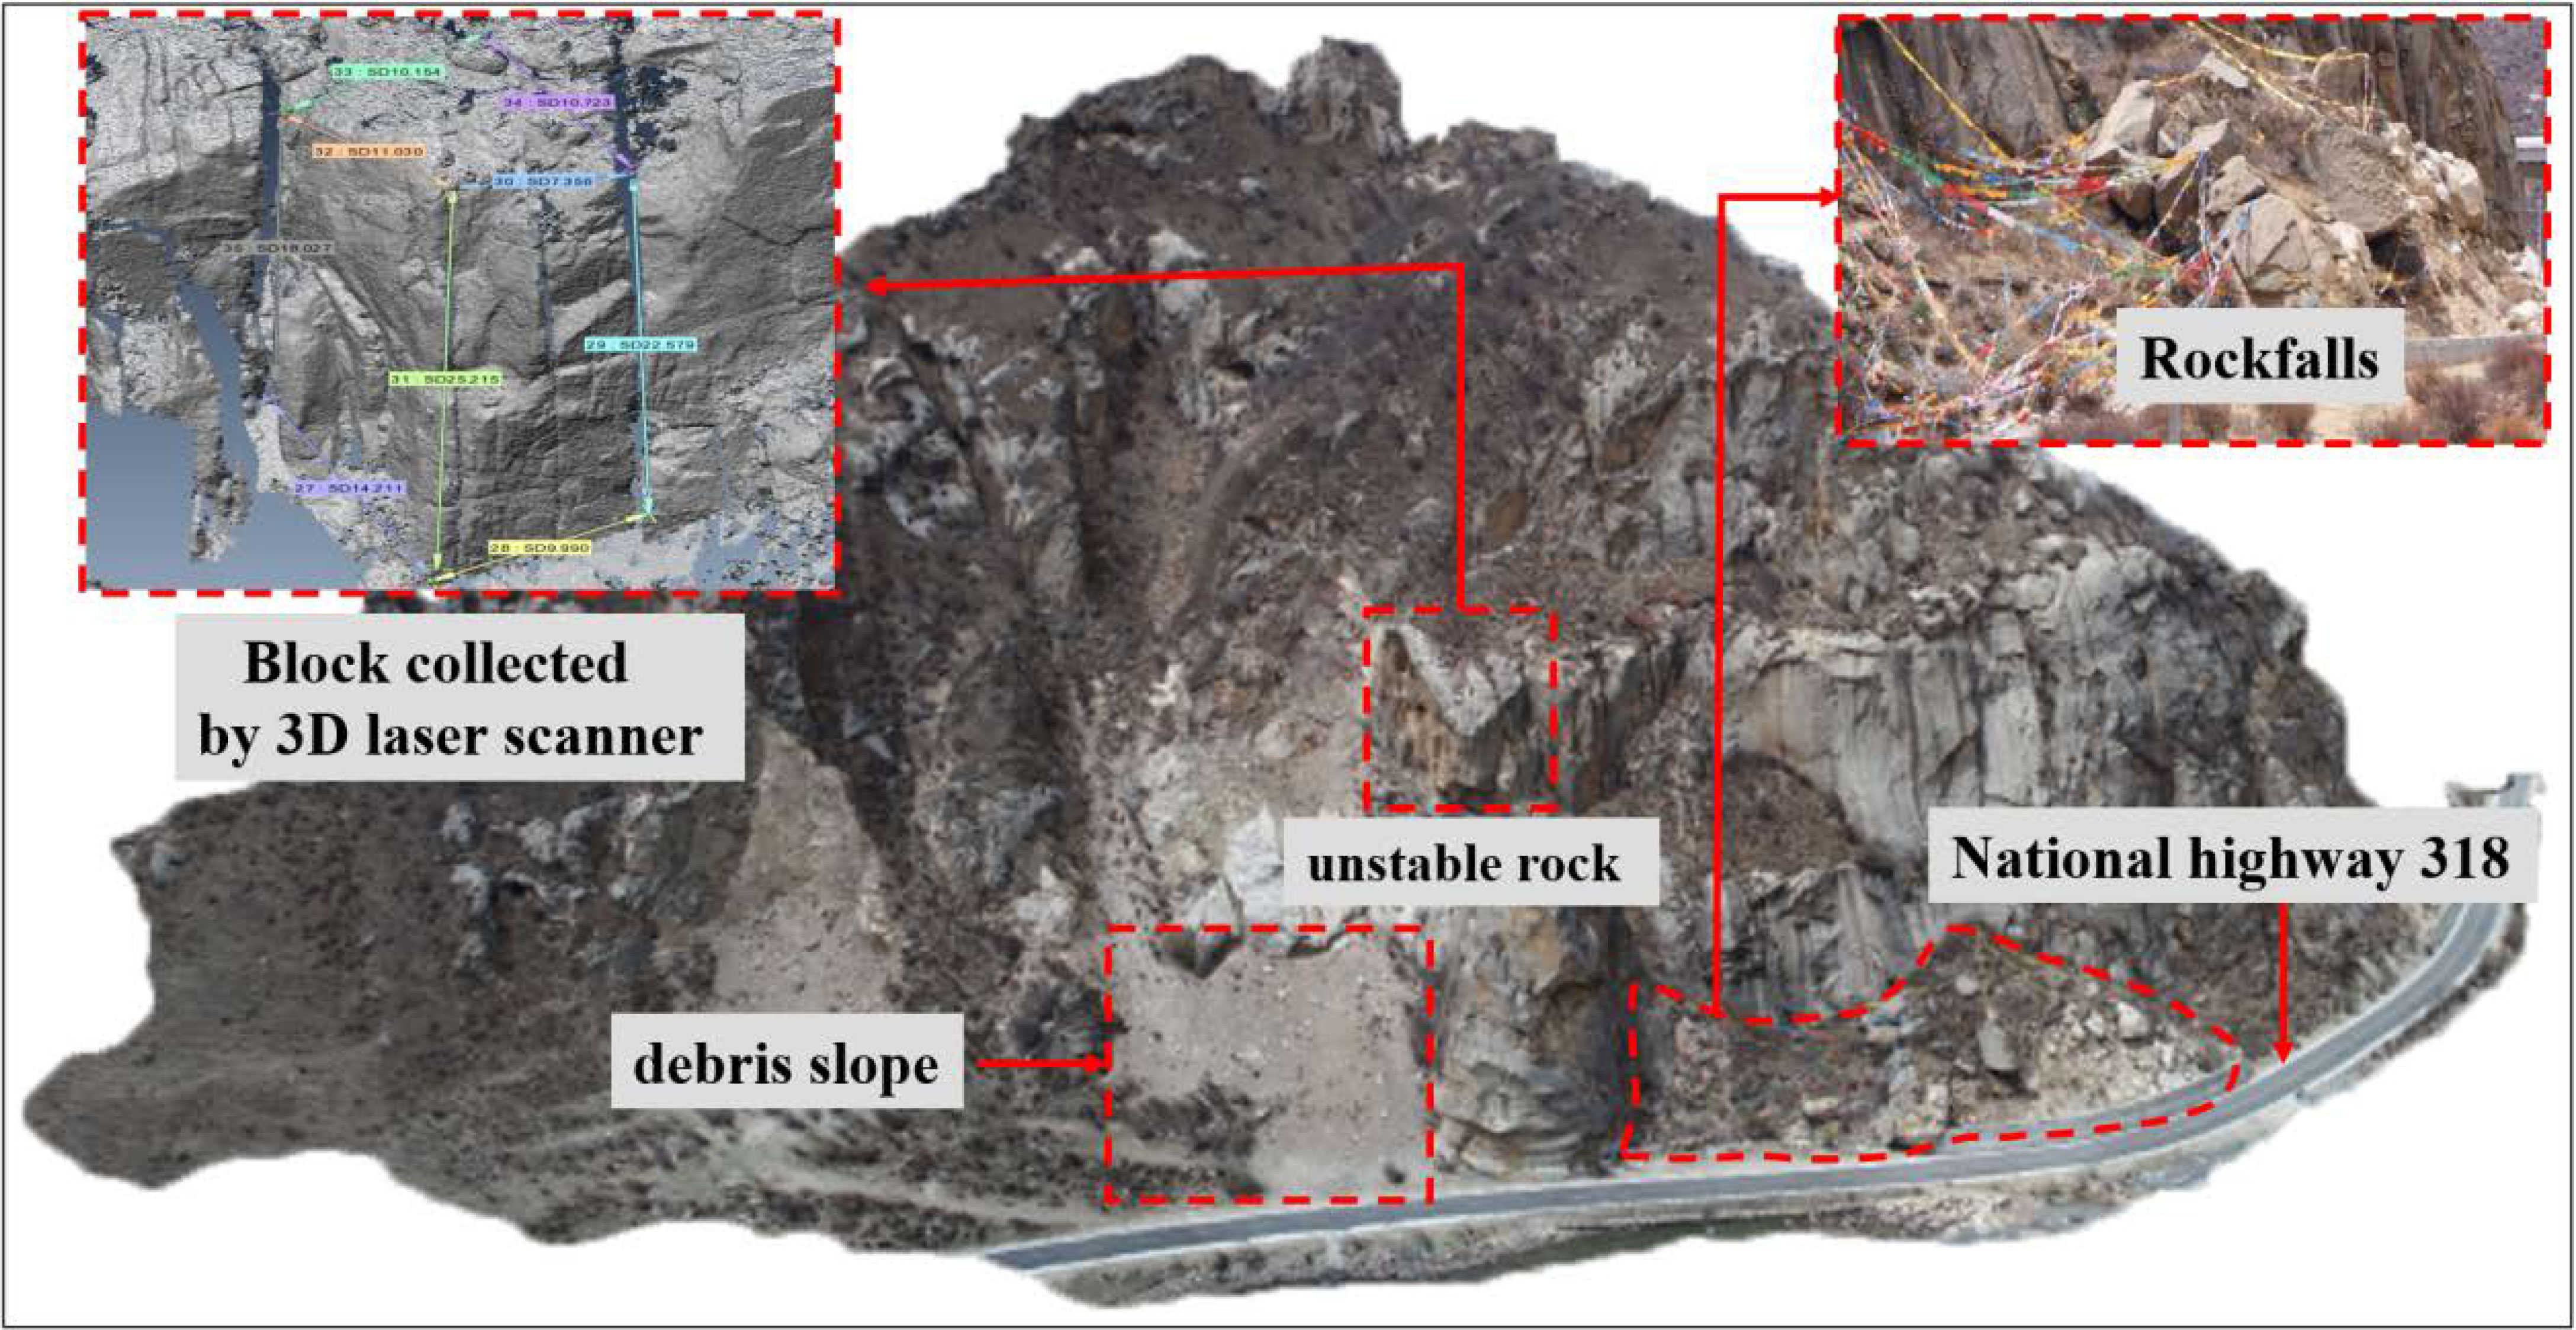
Figure 2 High-precision 3D simulation model.
The interaction between rockfalls and slopes was examined using simulation; this situation may involve multiple collisions, rebounds, rolling, sliding, impact fragmentation, and deforming of the slope (Agliardi and Crosta, 2003; Zhu et al., 2022; Yang et al., 2023). In Unity3D, the kinetic friction, static friction, and bouncing modulus coefficient from the physics engine Phys X were employed to control the interaction between objects. In solving, the displacement and deformation of the rock block is the variable or unknown quantity, and the solving approach of the balanced equation is similar to other numerical approaches. The dynamic behavior of the block can then be computed by writing a script (Cui, 2012).
Assuming that the block is rigid, the movement states are translation and rotation during the block is in the process of displacement, and the block of any shape has homogeneous stress and strain (He et al., 2023). In 3D space. Assume that x, y, and zx, y, and z are the coordinates of any point within block ii ; xc, yc, zcxc, yc, zc are the coordinates of the centroid point; u, v, wu, v, w are the displacements of any point within block ii ; uc, vc, wc uc, vc, wc are the rigid body translation of centroid within block ii ; and rx, ry, rzrx, ry, rz are the rigid body rotation of the centroid within block ii . Moreover, assume that the normal strain and shear strain of block ii are ϵx, ϵy, ϵz ϵx, ϵy, ϵz and γyz , γzx , γxy γyz , γzx , γxy , respectively. Then, the correlation between the displacement of any point and 12 displacement variables can be obtained as follows:
Furthermore, assume that [Ti](x,y,z) is the displacement transformation matrix defined by:
As per Equations (1) and (2), the complete first-order approximation of block displacements has the following form:
For the system formed by contact and displacement constraints between rock blocks, the displacement function can be defined from Equation (1). Combined with the quantity of the potential energy of the rock block, it can be assumed that [M] and [K] are mass matrix and stiffness matrix, respectively, [¨D] and [D] are acceleration and displacement matrix, and [F] is the external force matrix as follows:
According to Equation (4), the total potential energy is equal to the sum of the body loading, point loading, elastic stresses, initial constant stresses, inertia forces, displacement constraints, and contact interactions among the blocks.
Assuming that [Di](i=1,2,…,n) is a 12 × 1 displacement submatrix of any rock block and [Fi](i=1,2,…,n) is a 12 × 1 loading submatrix of any rock block, then 12 displacement variables represent each block, and each block has 12 degrees of freedom. Thus, [Kij](i,j=1,2,…,n) is a 12 × 12 stiffness matrix, where [Kii] is relevant to the material properties of block i and [Kij](i≠j) is defined by the contact between blocks i and j , and Kij=Kji . If the rock block i is not in contact with j , then Kij=0 , otherwise Kij≠0 . For a block system that comprises n blocks, the balanced equation can be expressed in the submatrix form as follows:
In numerical simulation calculation, Equation (5) can solve the movement of multiple rock block systems. Interested readers are encouraged to refer to Shi (2001).
Energy variation is related to the linear and angular velocities of rock blocks when the blocks are moving; the linear, angular velocities of rock blocks depend on the coefficient of restitution and friction (Asteriou et al., 2012; Li et al., 2019). Thus, energy loss is usually treated by employing contact functions of the friction coefficient and restitution coefficient. In the Unity environment, the surface collision is decomposed into two contact points, thus doubling the friction force. The friction angle’s tangent value is known as the coefficient of static friction as follows:
where φ represents the friction angle, and μ represents the coefficient of static friction.
The friction coefficient is then used to simulate the ratio of normal force to rockfalls and slopes; moreover, the ratio is used to compute the friction force when the blocks are in motion. Note that the friction force is opposite to the tangential component of the input velocity vector as follows:
where Ff is the frictional force, and N is the normal force between rockfalls and slopes.
The coefficient of restitution only works in the normal direction, and this coefficient is equal to the ratio of the relative velocity of the block before and after each collision as follows:
where Hv is the coefficient of restitution, vi and vj represent the relative velocities before and after the collision, respectively. Then, the energy variation can be solved using the contact function of friction and coefficient of restitution. For a detailed process, interested readers are encouraged to refer to the basic Unity references (Sala, 2018; Li, 2021).
Unity3D has a PhysX physics engine, a popular software employed in system simulation and virtual reality; multiple block collisions and free fall can easily be simulated authentically using this software (Wang and Wang, 2019). Thus, this approach can simulate the movement mechanism of rockfall. After extracting the inclination, slope material, block size, instability mode, the velocity of different conditions in block shape, acceleration, accumulated displacement, and energy data, respectively, using the C# script, the movement characteristics and disaster process of the block on debris slope can be easily examined.
The physical and mechanical parameters, such as the friction angle and cohesion, are based on the geological survey data of slopes, the field rebound test, and laboratory experiments of rock mechanics after conducting the field sampling (Li et al., 2020; Chen et al., 2021), as illustrated in Table 1.
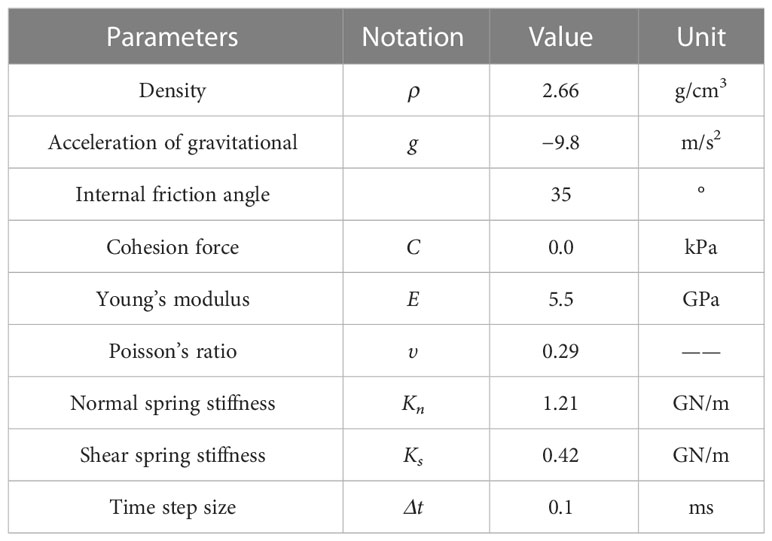
Table 1 Physical and mechanical parameters of numerical simulation.
The inclination not only reflects the steepness of the slope but also affects the energy variation and movement characteristic of rockfall blocks on the slope. Based on the investigation and measurements of field debris slope, the inclination of debris slope is between 30° and 70°. Thus, square blocks were set at 0.2 m, and the instability movement was performed on the slope where the material is gravel debris particles 570 m away from the slope’s bottom. In this manner, the movement characteristics, energy variation, and final deposit position of the slope with an inclination of 30°, 40°, 50°, 60°, and 70° are analyzed.
Figure 3 demonstrates that blocks between 30°and 70° rested at 25, 425, 565, and 570 m, respectively; the larger the inclination, the greater the displacement. When the inclination is >60°, the rockfalls reach the bottom of the slope and deposit at the highway. According to comparing velocity with acceleration, it can be seen that with the development of the inclination, velocity, and acceleration also showed an increasing trend. When the inclination is between 30° and 70°, the maximum speeds are 3.47, 3.56, 18.46, 23.23, and 27.94 m/s, and the maximum acceleration are 1.82, 1.96, 3.29, 3.64, and 6.13 m/s2. Based on the energy variation, the variation law of energy is consistent with velocity and acceleration with the development of inclination; moreover, velocity, acceleration, and cumulative displacement will increase when the inclination increases, and it is more likely to result in a rockfall disaster.
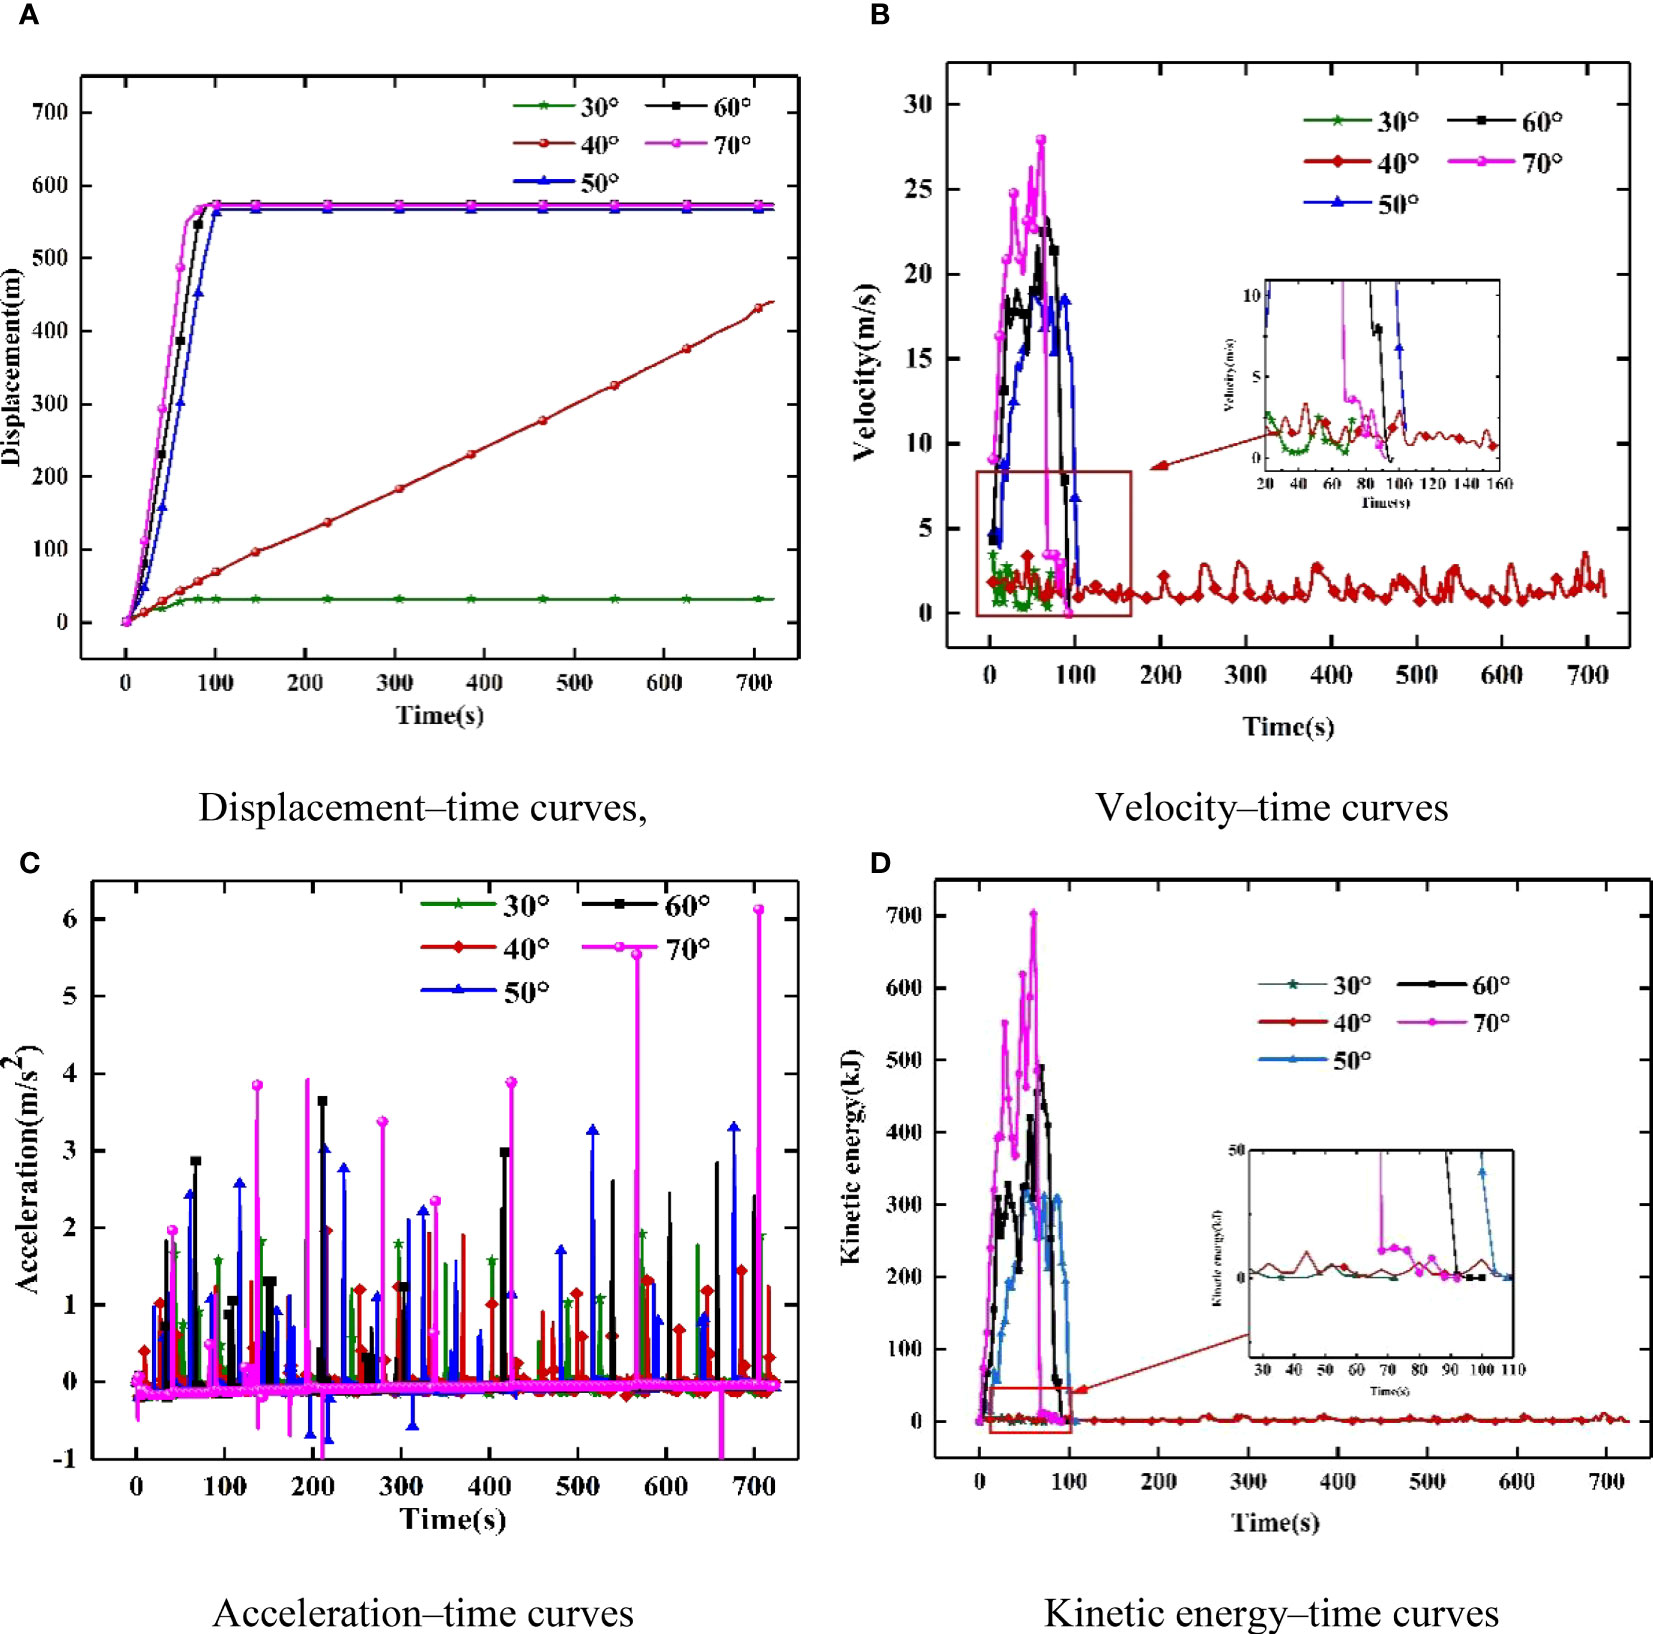
Figure 3 Movement characteristics of different slope angles.
Movement characteristics are influenced by the frictional force produced in the contact process between rockfalls and slope material. Thus, with the change in slope material, the movement characteristics, energy variation, and deposit position of rockfalls will change (Dorren et al., 2006; Li, 2022; Liu et al., 2021; Liu et al., 2022). Based on a field investigation, there were trees and weeds or gravel debris particles or rock slope of bedrock in the debris slope. Therefore, the square blocks with rock diameters of 0.2 m were set, and the instability movement was conducted on the slope. Note that the inclination is 40° and 570 m away from the slope’s bottom, and then the movement characteristics, energy variation, and deposit position of rockfalls on three types of slopes can be examined.
Figure 4 illustrates that the rockfall movement characteristics of different slope materials are quite different, and the displacements of rockfall blocks on a rock slope, debris slope, and weed shrub slope are 450, 390, and 320 m. This shows that the rockfalls on the debris slope and weed shrub slope do not reach the toe of the slope, and secondary rolling is dangerous. According to the curve of velocity and acceleration, both velocity and acceleration of rock slope, debris slope, and weed shrub slope decreased, the maximum speeds were 36.35, 21.59, and 17.37 m/s, whereas the maximum acceleration were 18.35, 7.54, and 7.22 m/s2. According to the curve of energy variation, energy is attenuated at the fastest speed, followed by debris slope, and the attenuation of rock slope is not significant. This conclusion agrees with the actual situation.
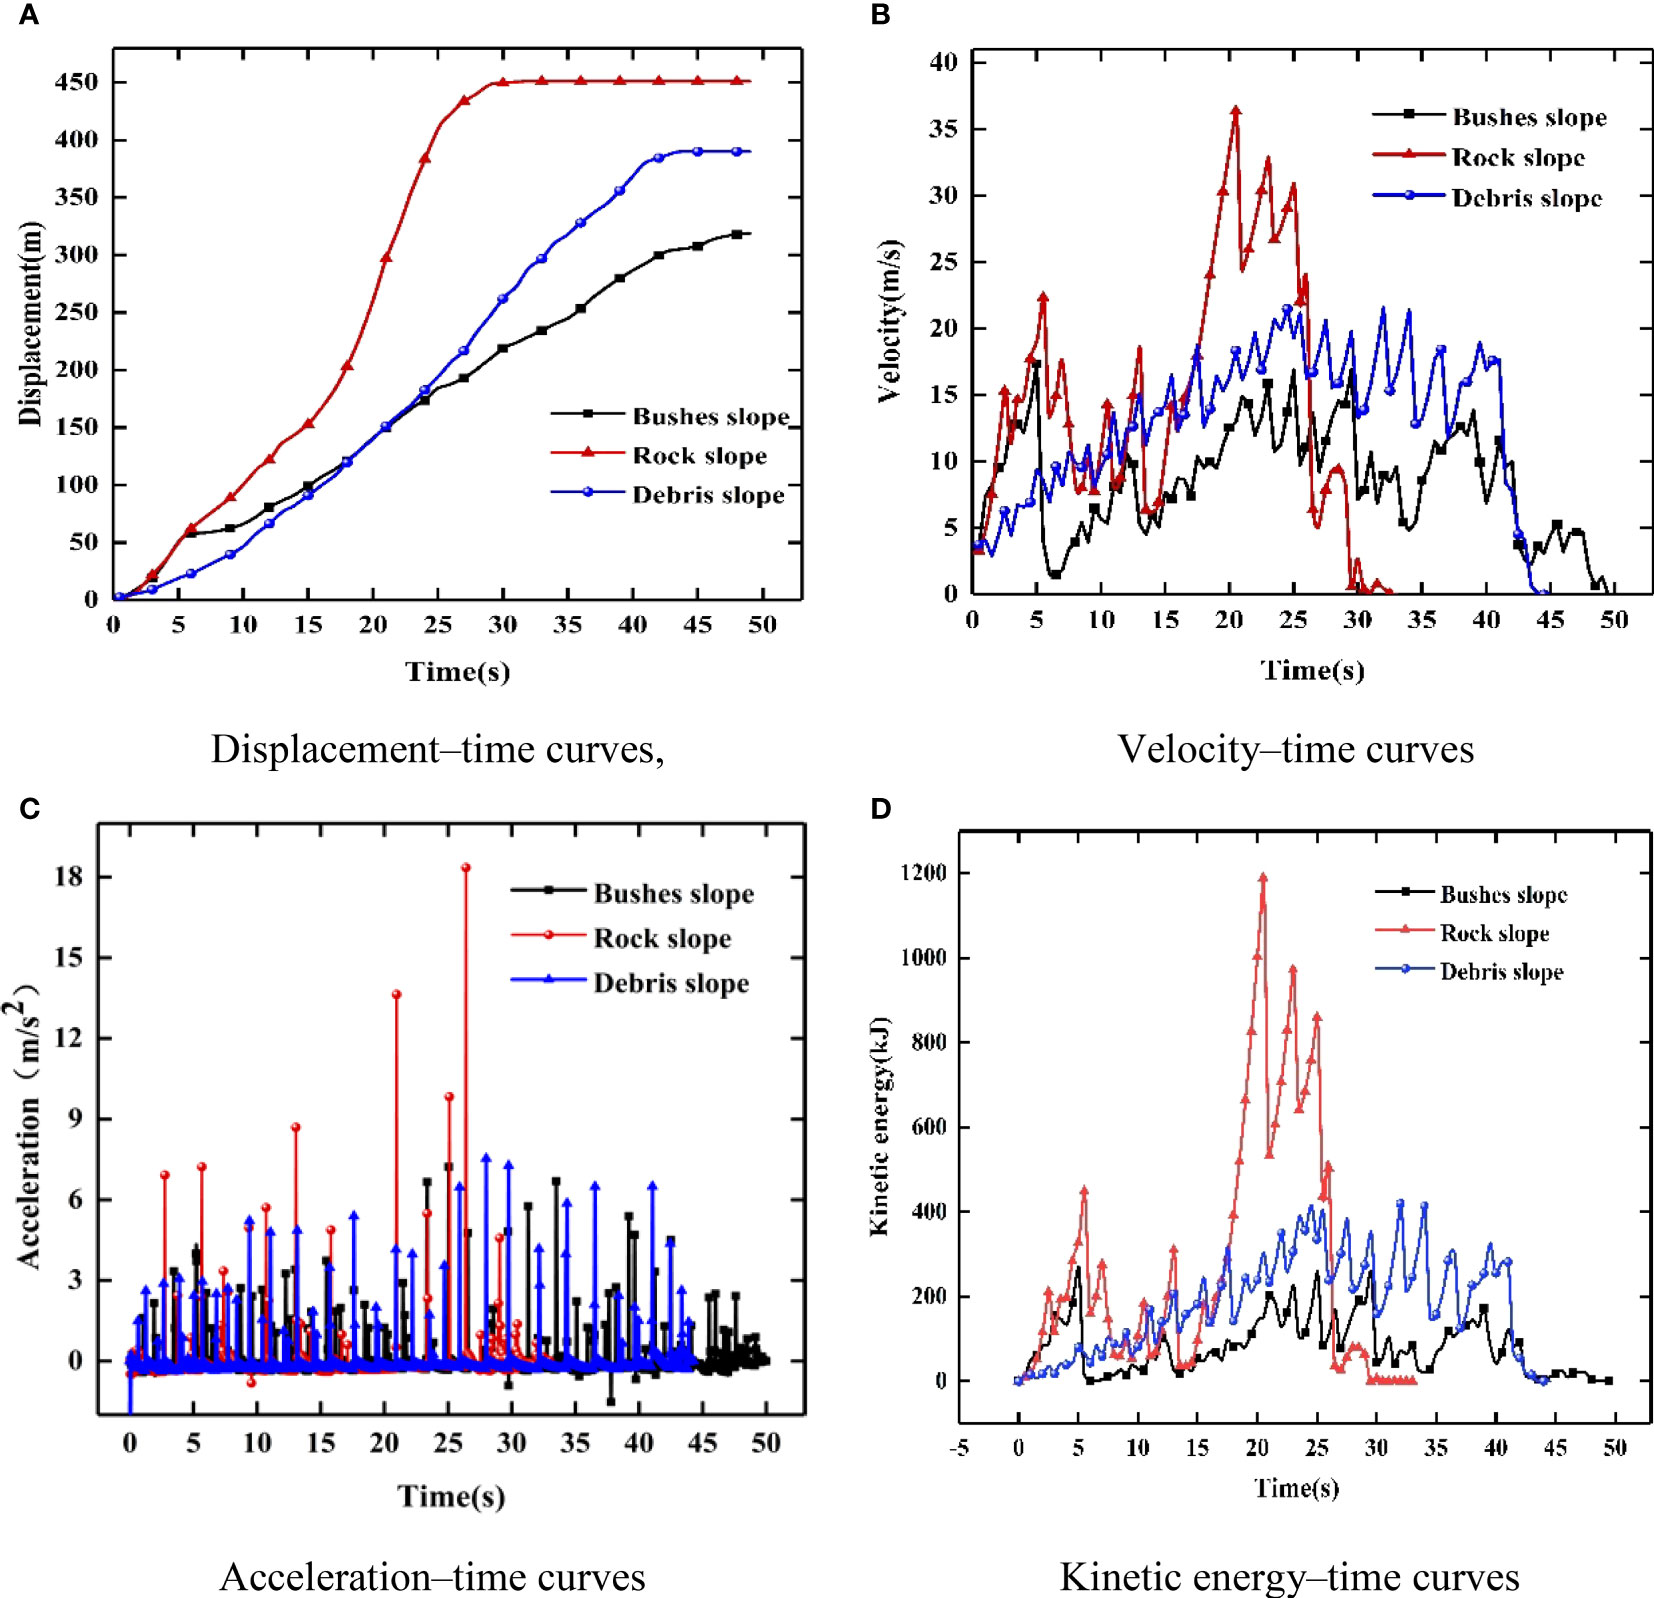
Figure 4 Movement characteristics of different slope materials.
The contact area and energy between the rockfall blocks and slope will be affected by the blocks’ size, thus affecting their movement and accumulation characteristics (Bartingale, 2009). According to the field investigation data, the diameter of the extremely dangerous rockfall blocks on the slope is primarily concentrated between 0.1 and 1.0 m. Thus, the square blocks with rock diameters of 0.2, 0.4, 0.6, 0.8, and 1.0 m were set, and the instability movement is conducted on the slope where the material is gravel debris particles, the inclination is 40°, and the distance is 570 m away from the slope’s bottom. In this manner, the influence of the size of rockfall blocks on the debris slope on the movement characteristics, energy variation, and final accumulation position is examined.
Figure 5 illustrates the displacement of rockfall blocks with diameters of 0.2, 0.4, 0.6, 0.8, and 1.0 m are 430, 530, 540, 540, and 570 m, respectively; it shows that the larger the rockfall blocks, the easier it rolls down to the bottom and is more prone to disasters. From the analysis of velocity and acceleration, the larger the diameter of the rockfall blocks, the greater the velocity and acceleration. The maximum speeds are 8.97, 9.95, 13.19, 14.26, and 17.58 m/s, whereas the maximum accelerations are 5.75, 6.28, 7.74, 10.02, and 15.62 m/s2. From the analysis of energy variation, the larger the diameter of the rockfall blocks, the greater the energy variation, and the more severe the rockfall disaster.
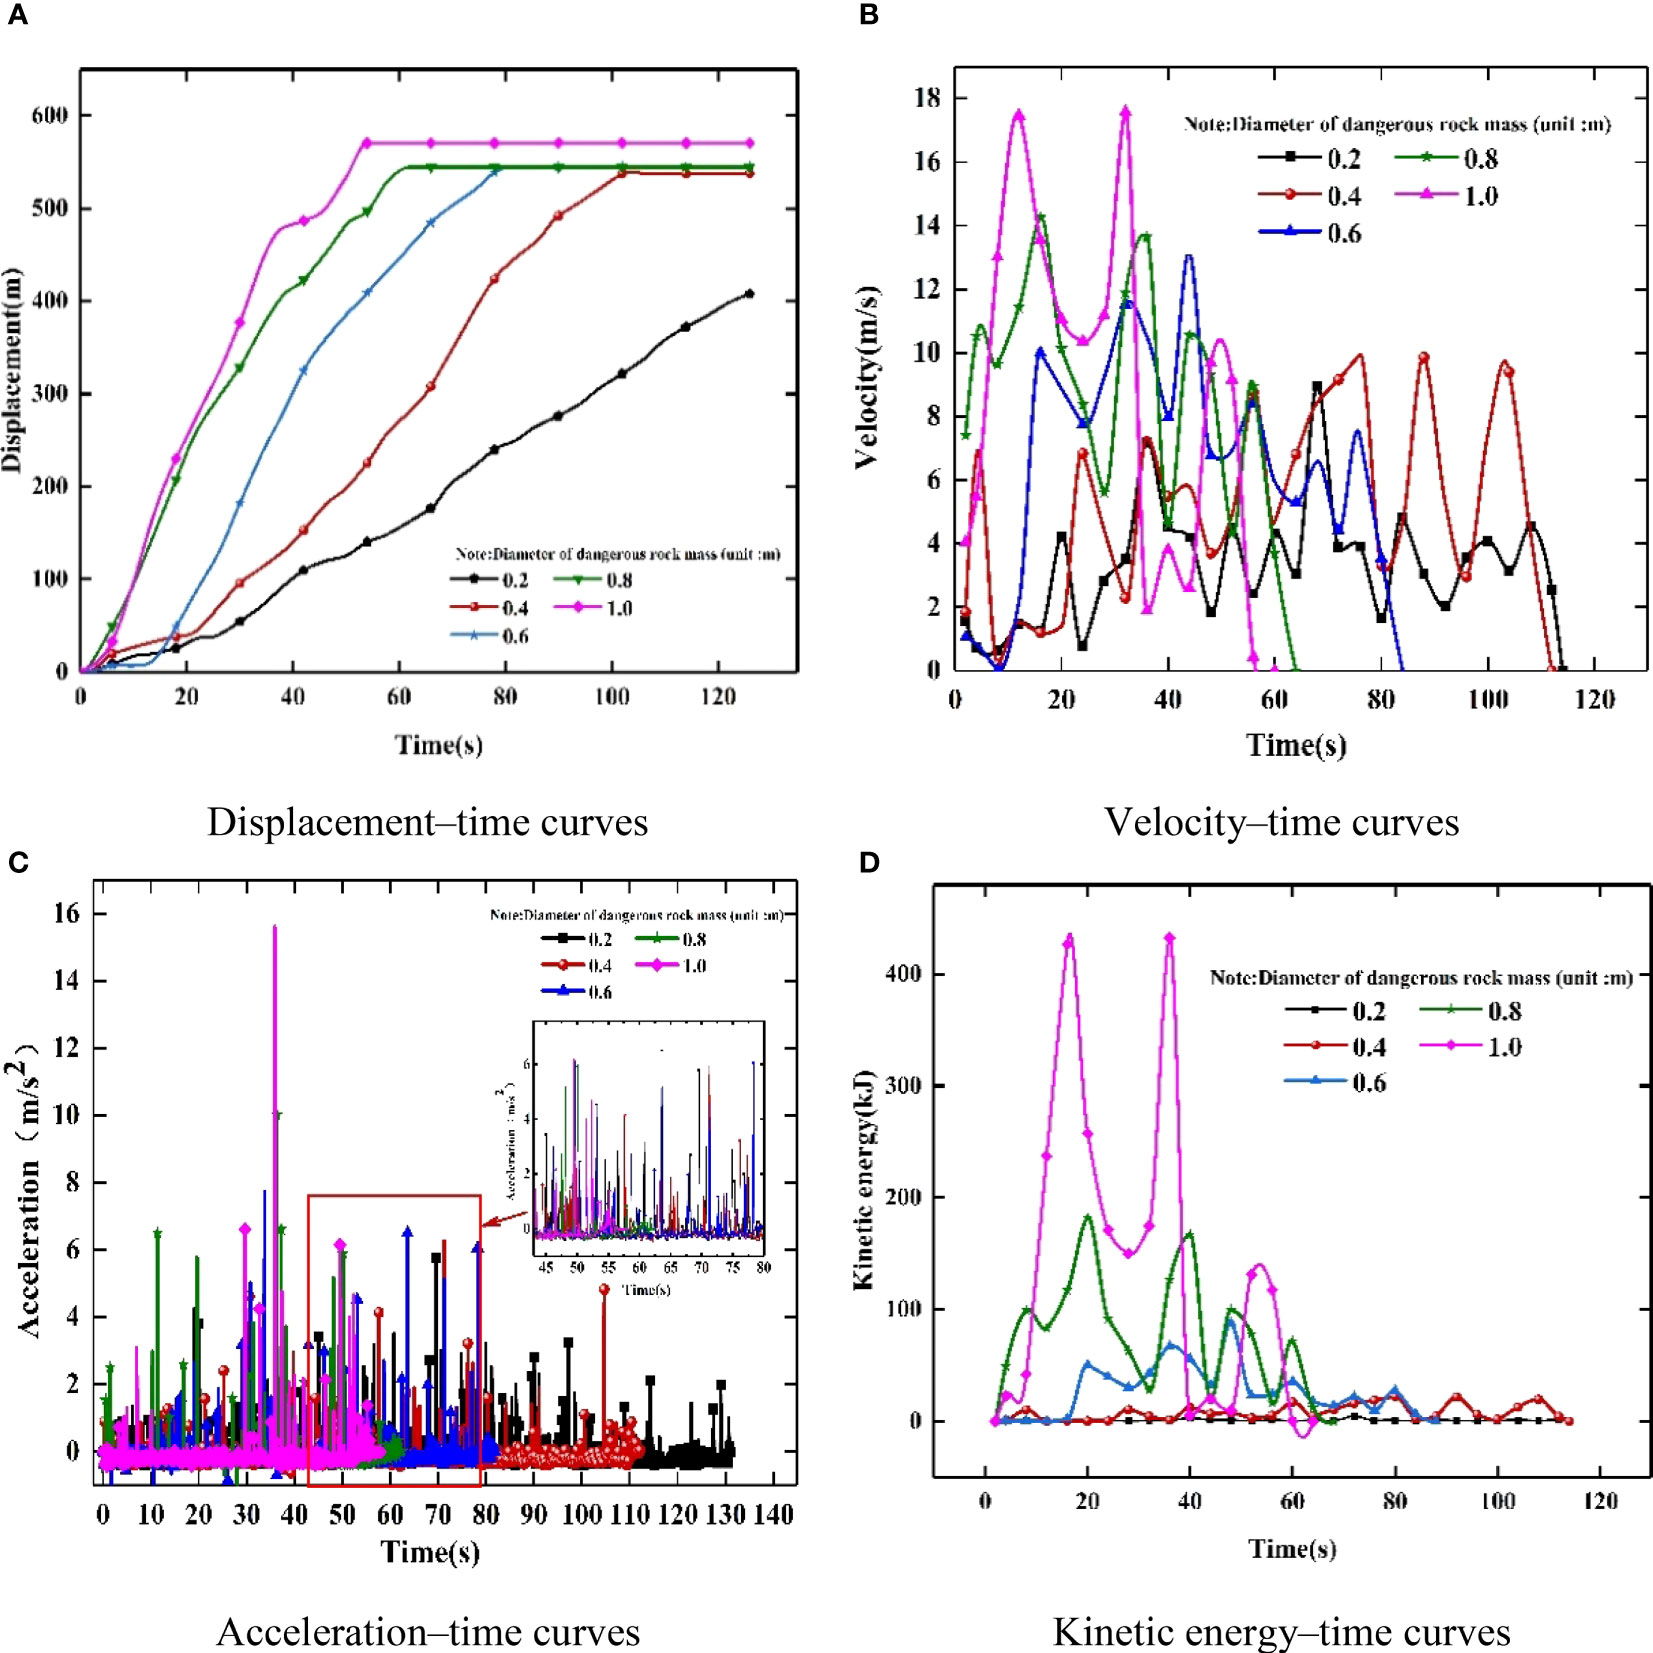
Figure 5 Movement characteristics of rockfall of different sizes.
The instability type of rockfall affects its initial velocity and may affect its motion characteristics, energy variation, and accumulation position. In addition to the falling type, sliding type, and dumping type of rockfall blocks instability on the debris slope, a square block with a rock diameter of 0.2 m was set, and the instability movement was performed on the slope where the material was gravel debris particles, the inclination was 40°, and the distance is 570 m away from the slope’s bottom. In this way, the influence of instability type on the movement characteristics of rockfalls on debris slopes is investigated.
The displacements of the falling, sliding, and dumping types of rockfall blocks on the debris slope are 570, 520, and 495 m, respectively, as illustrated in Figure 6. This shows that the falling type has the largest displacement, followed by the sliding and toppling types. From the analysis of velocity and acceleration, the maximum velocity is: the falling type is the largest, followed by the toppling type and sliding type, which are 15.85, 12.91, and 9.89 m/s, respectively. The maximum acceleration is the largest dumping type, followed by the sliding and falling types, which are 9.01, 7.64, and 6.56 m/s2, respectively. From the analysis of energy variation, the law of variation is similar to that of velocity. Thus, the falling type of rockfall block has the fastest instability velocity and the largest energy and is the most prone to disasters.
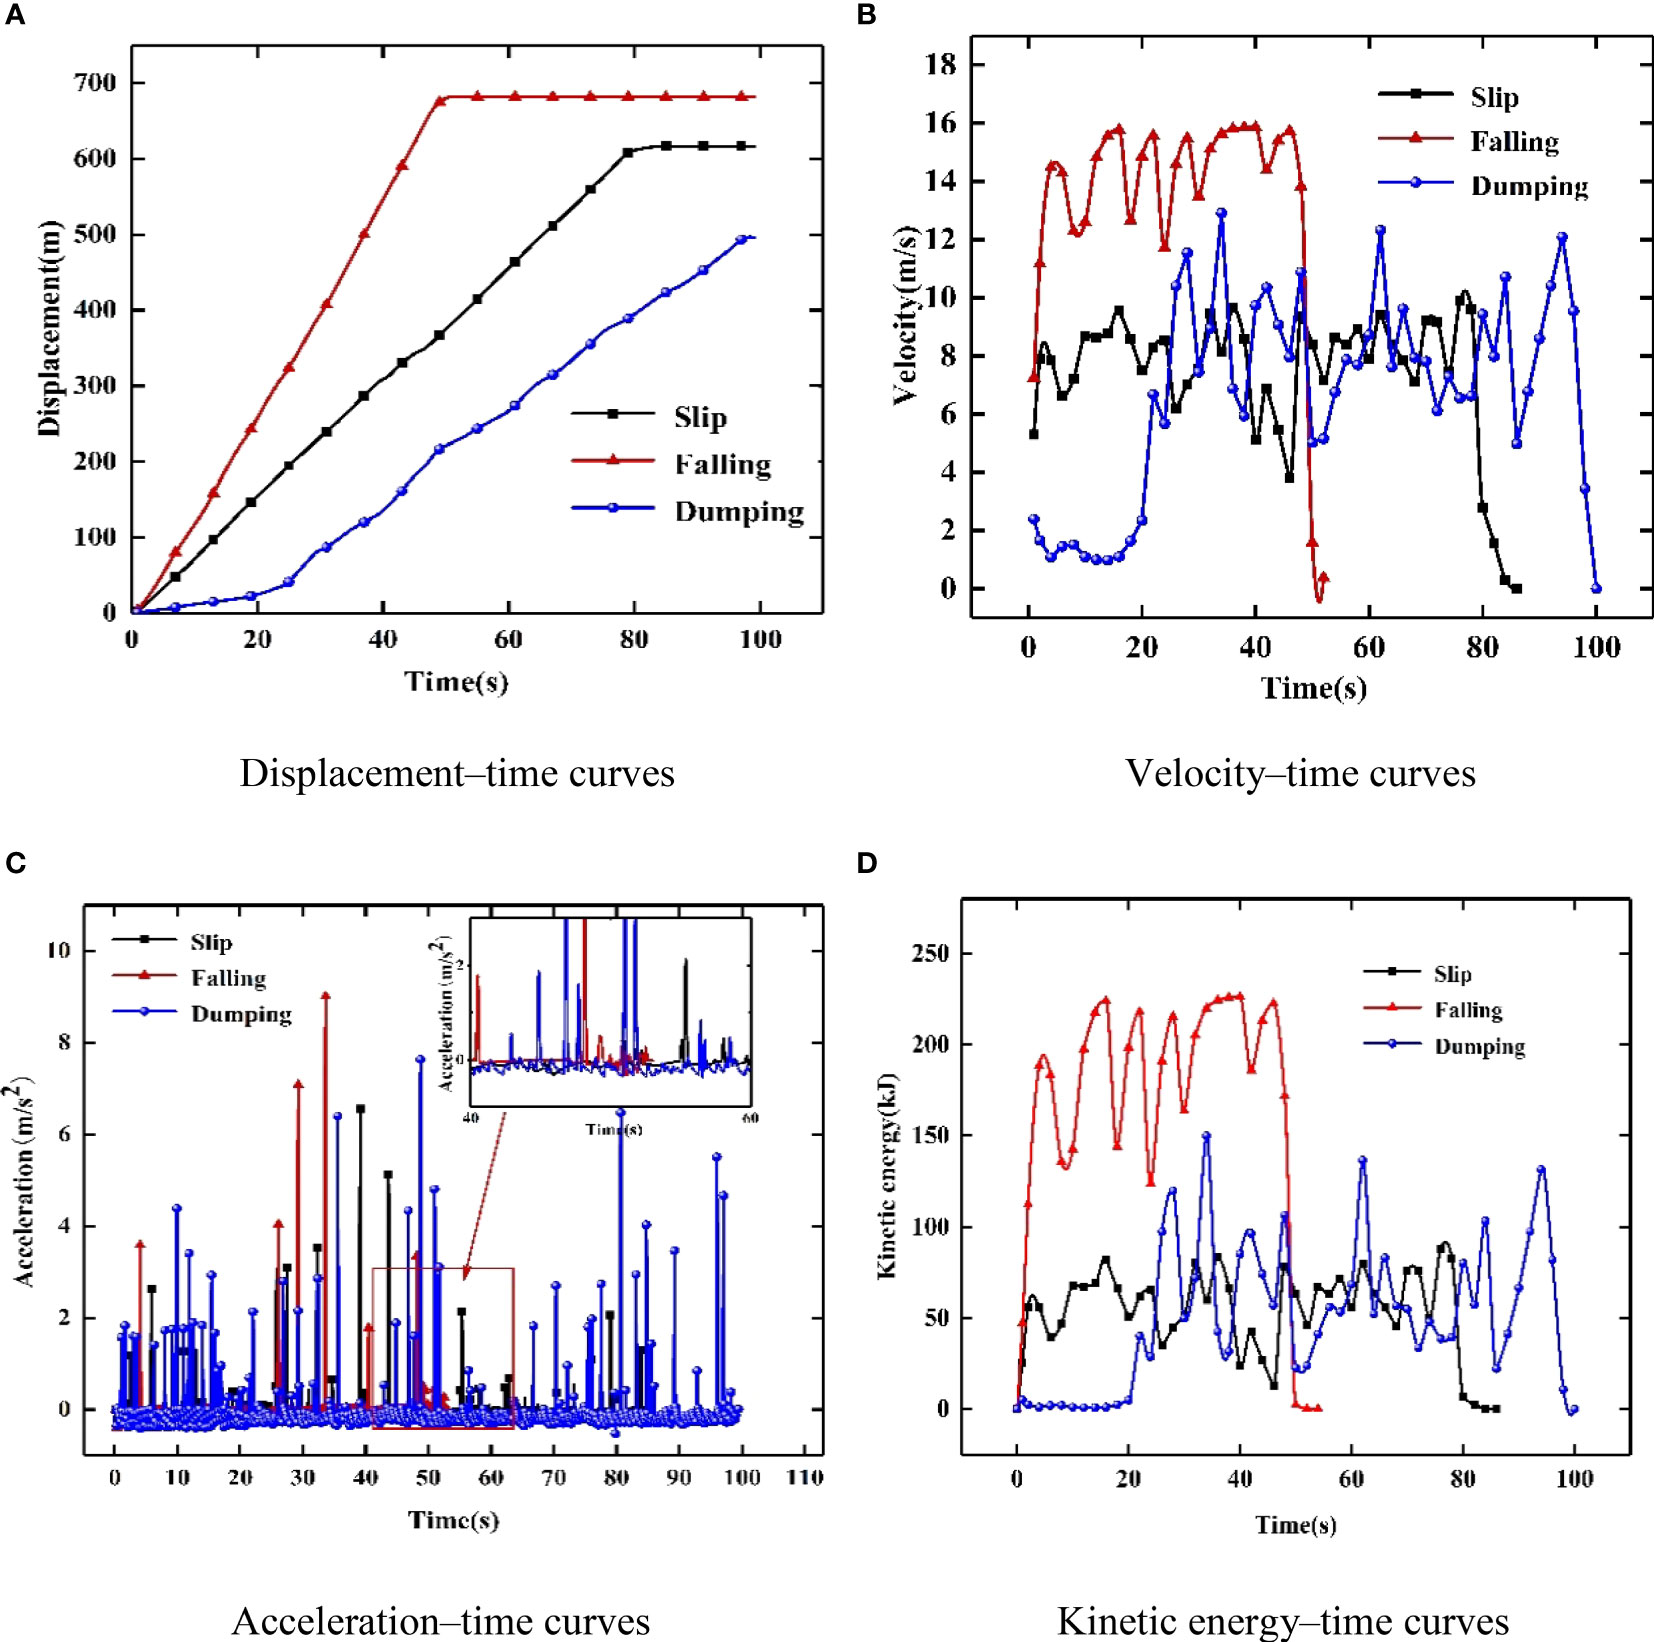
Figure 6 Movement characteristics of different instability types.
The shape of rockfalls affects their contact type and contact area with the slope and may affect their energy variation, movement type, and deposited position when the blocks are moving. Thus, six different forms of rockfall blocks were set, e.g., irregular, short column, long column, plate, spherical, and square. Furthermore, the instability movement was conducted on a slope with an inclination of 40°, a rock diameter of 0.2 m, and a distance of 570 m from the slope’s bottom. In this manner, the movement characteristics, energy variation, and final accumulation position of rockfalls are analyzed.
As illustrated in Figure 7, the displacement of the long column, plate, square, irregular, short column, and spherical rockfall blocks are 210, 410, 520, 590, 590, and 630 m, respectively. This shows that the more approaches the shape of the rockfall blocks is to spherical, the easier it is to roll down to the bottom, the greater the displacement and throw over the road. The maximum velocity and acceleration of the spherical blocks are 16.83 and 0.54 m/s2, respectively, while the maximum velocity and acceleration of the long columnar blocks are 6.26 m/s and 3.59 m/s2, respectively. From the analysis of energy variation, the spherical or near-spherical blocks have the largest energy and greatest danger; the long columnar blocks have the smallest energy and much less danger.
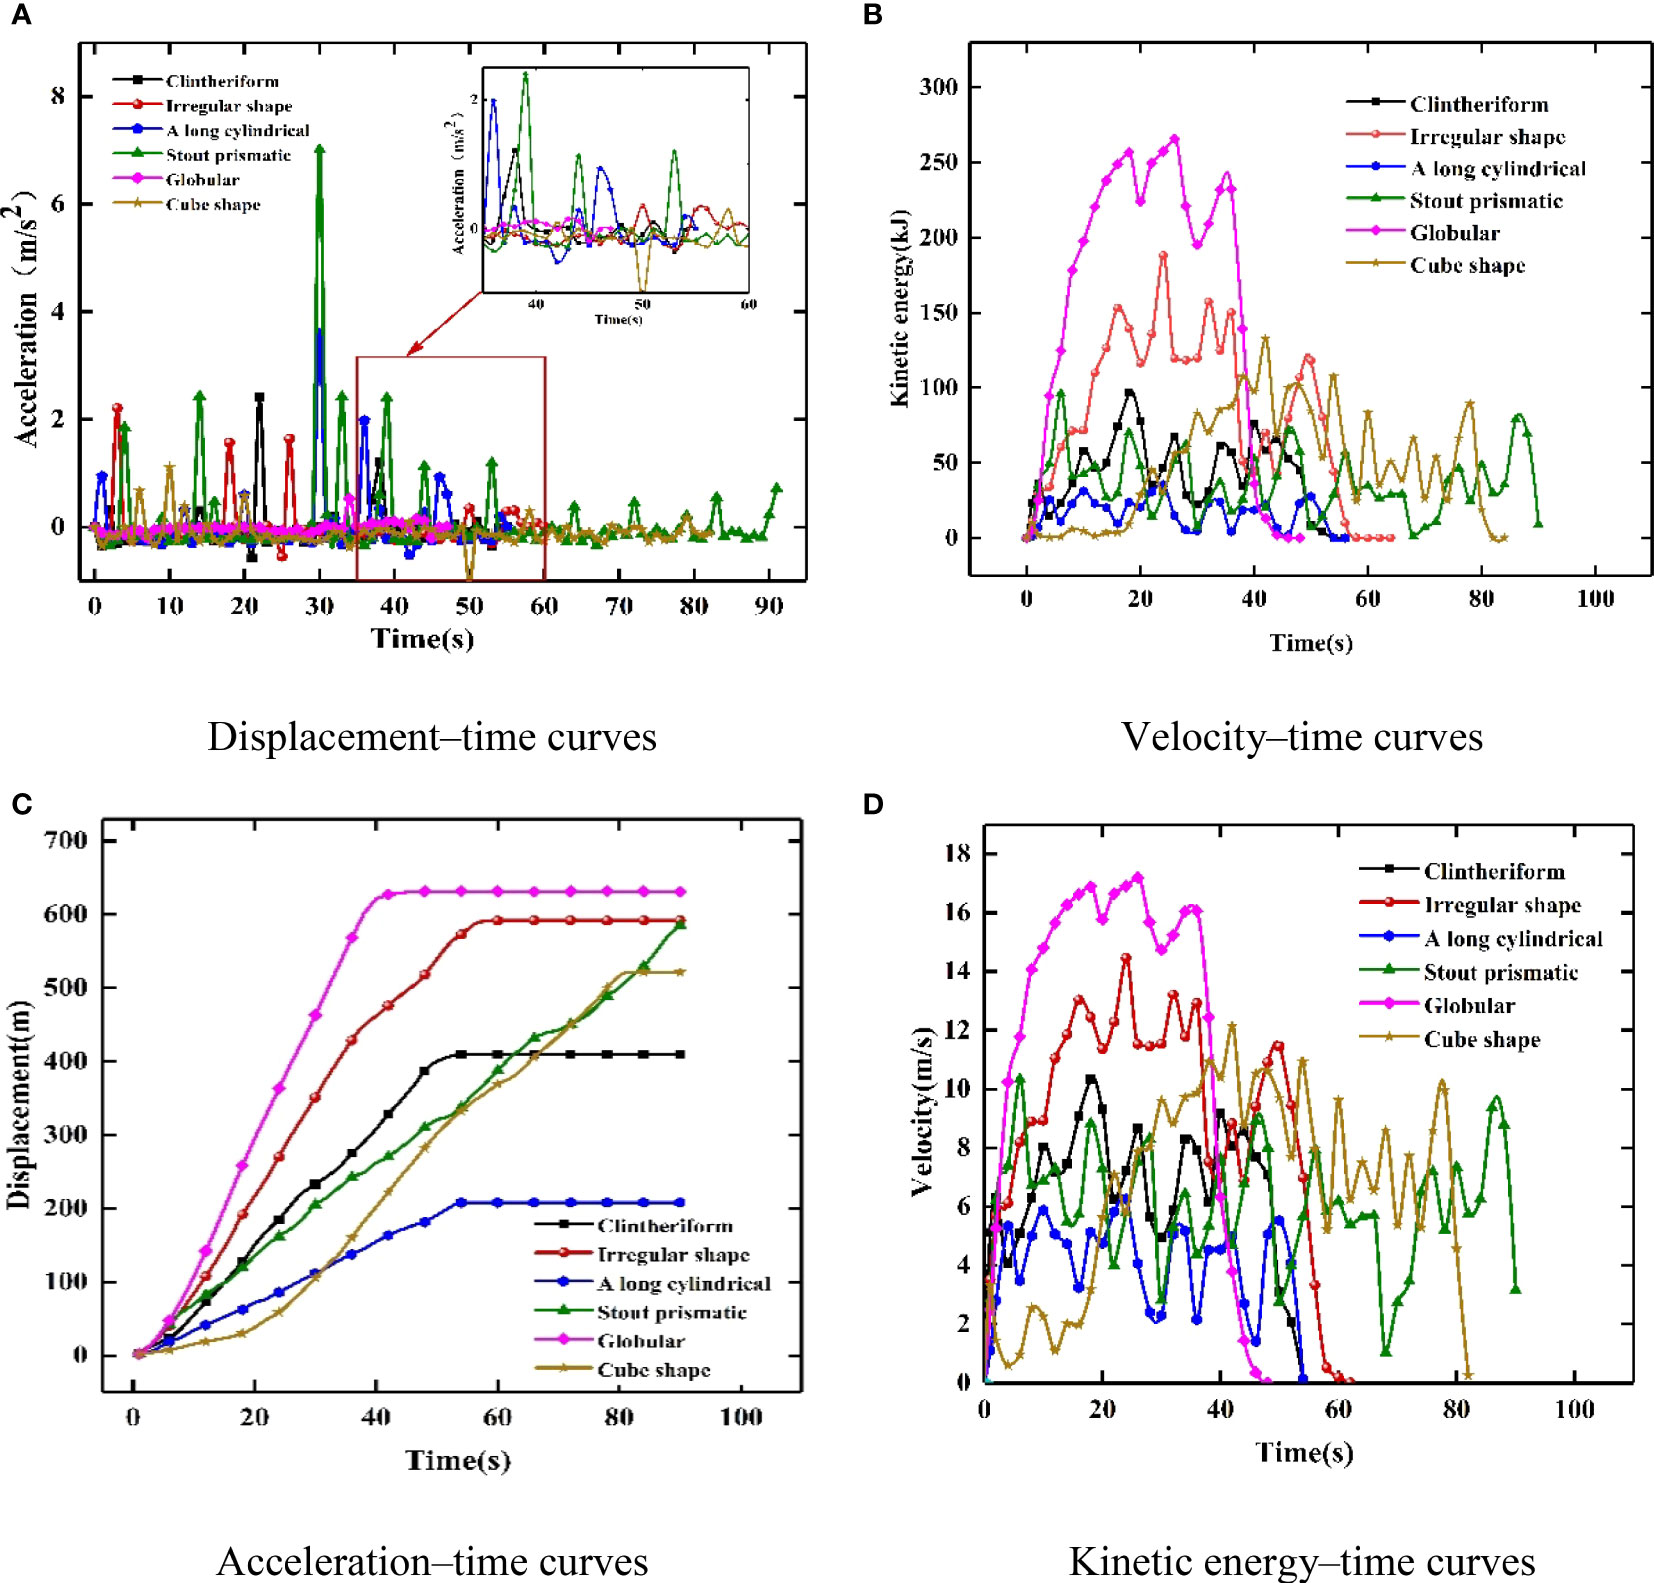
Figure 7 Movement characteristics of different rockfall shapes.
The reliability of the Unity3D software simulation of debris slope rockfall movement characteristics, energy variations, and accumulation locations is now analyzed using a field rockfall experiment, and the errors are compared and analyzed.
The slopes for this rockfall physical model experiment were selected from natural debris slopes in the field. The primary material composition of the slope is medium-coarse sand and gravel, with a content of 92.4%, and contains scattered gravel particles, the inclination is between 32° and 36°, and there is a small amount of weed growing on the slope, as shown in Figure 8. In this experiment, the rock blocks were diorite with a 2.69 g/cm3 rock density and a Poisson’s ratio of 0.28. The stone processing plant produced the rock’s shapes as cubes, rectangles, and square octahedrons. Each shape of the rock block was made in five size levels of 0.2, 0.4, 0.6, 0.8, and 1.0 m, with three rocks of each size class, for 45 rock blocks. To ensure the accuracy of the experiment, the mass and size errors of rock blocks were <1%. Coding markings were applied to each surface of each rock block before the experiment.
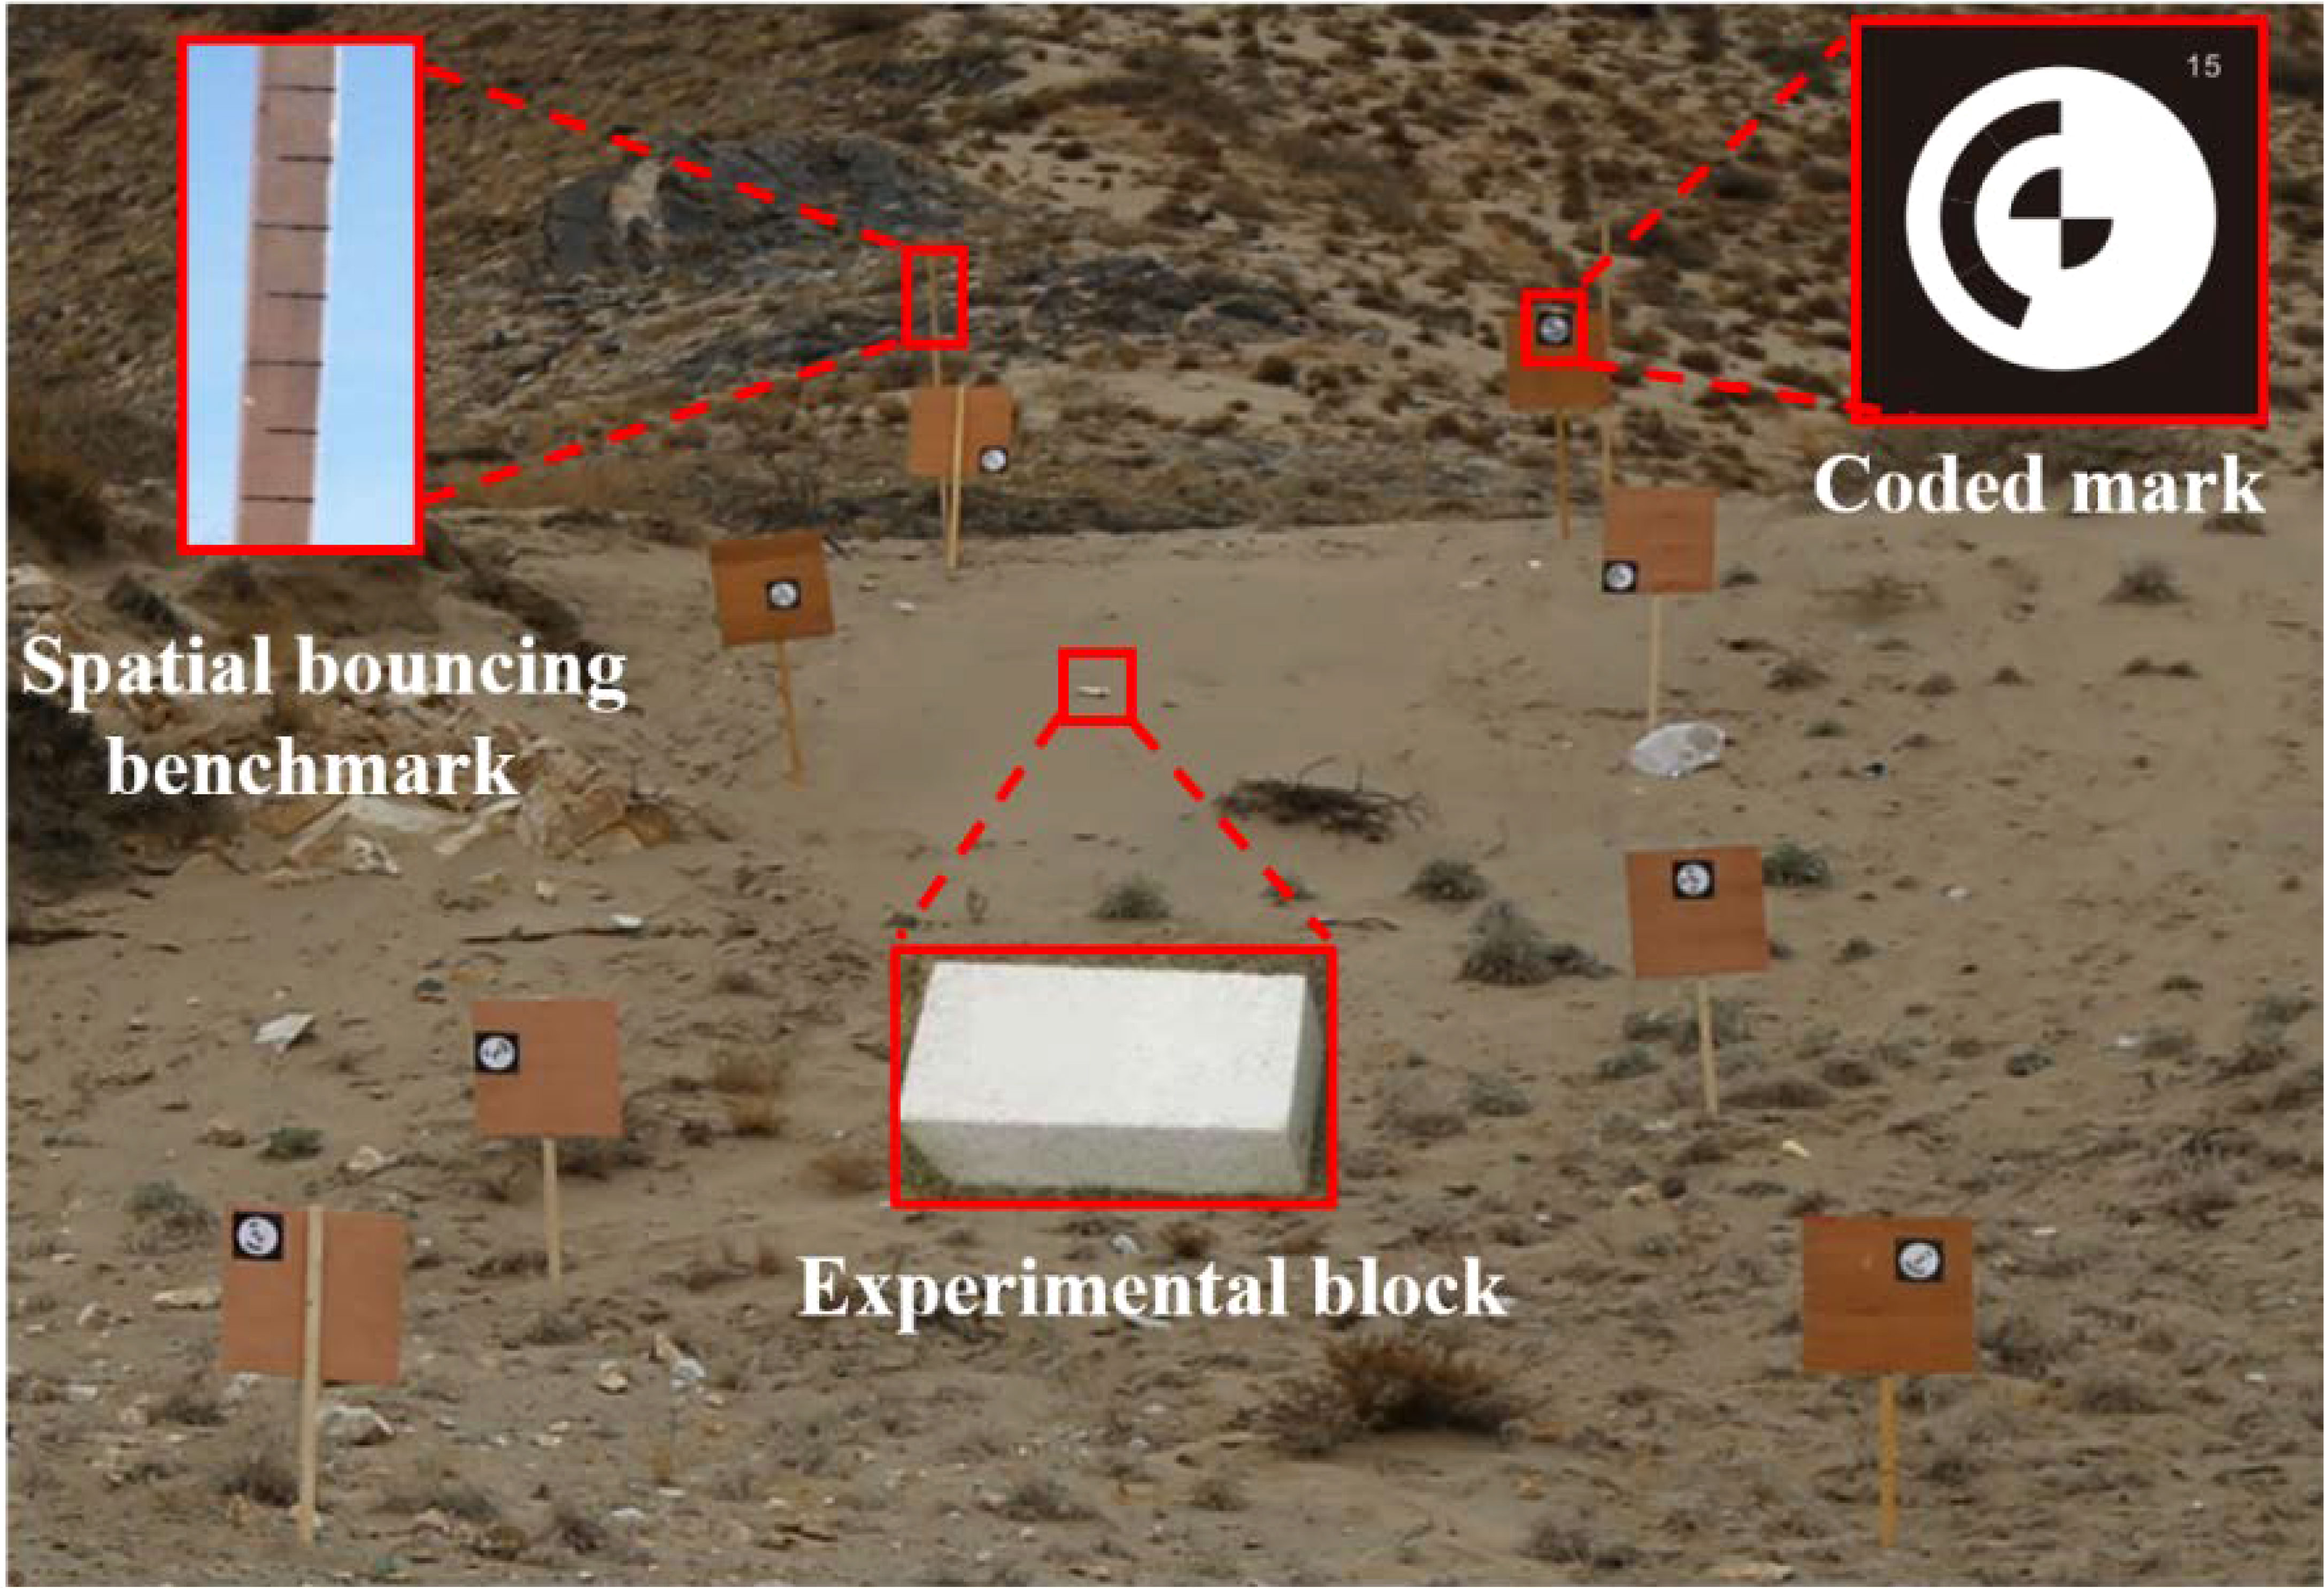
Figure 8 Field experimental slope.
As illustrated in Figure 9, the equipment designed for the test consists of a rockfall initial motion control system and a data acquisition system (Liu and Chen, 2019). The rockfall block’s initial movement control system is self-made and comprises a release height adjustment device and a release control device that can control the height and attitude of the initial movement of the rock blocks. The data acquisition system comprises two HD high-speed camera units (these cameras operated at a resolution of 4080 × 3072 pixels and a rate of 188 frames per second), two computers, an AcuteSync-20K synchronization controller (it was adopted to ensure the accuracy of the camera synchronization time up to one microsecond), a mobile power supply, and a total station and equipment connection cable. Data acquisition systems enable image and data acquisition, storage, and analysis functions using acute image data processing software that can extract images at any point during the movement of a rockfall block to show the clear movement process. A 3D simulation model can be established if the image overlap is controlled by >70%. Moreover, the software can monitor the movement characteristics of rockfall blocks using coded markers on the blocks to read the velocity, acceleration, displacement, trajectory, and deposit position of the rockfall blocks, No sensors need to be installed, and the accuracy is extremely high.
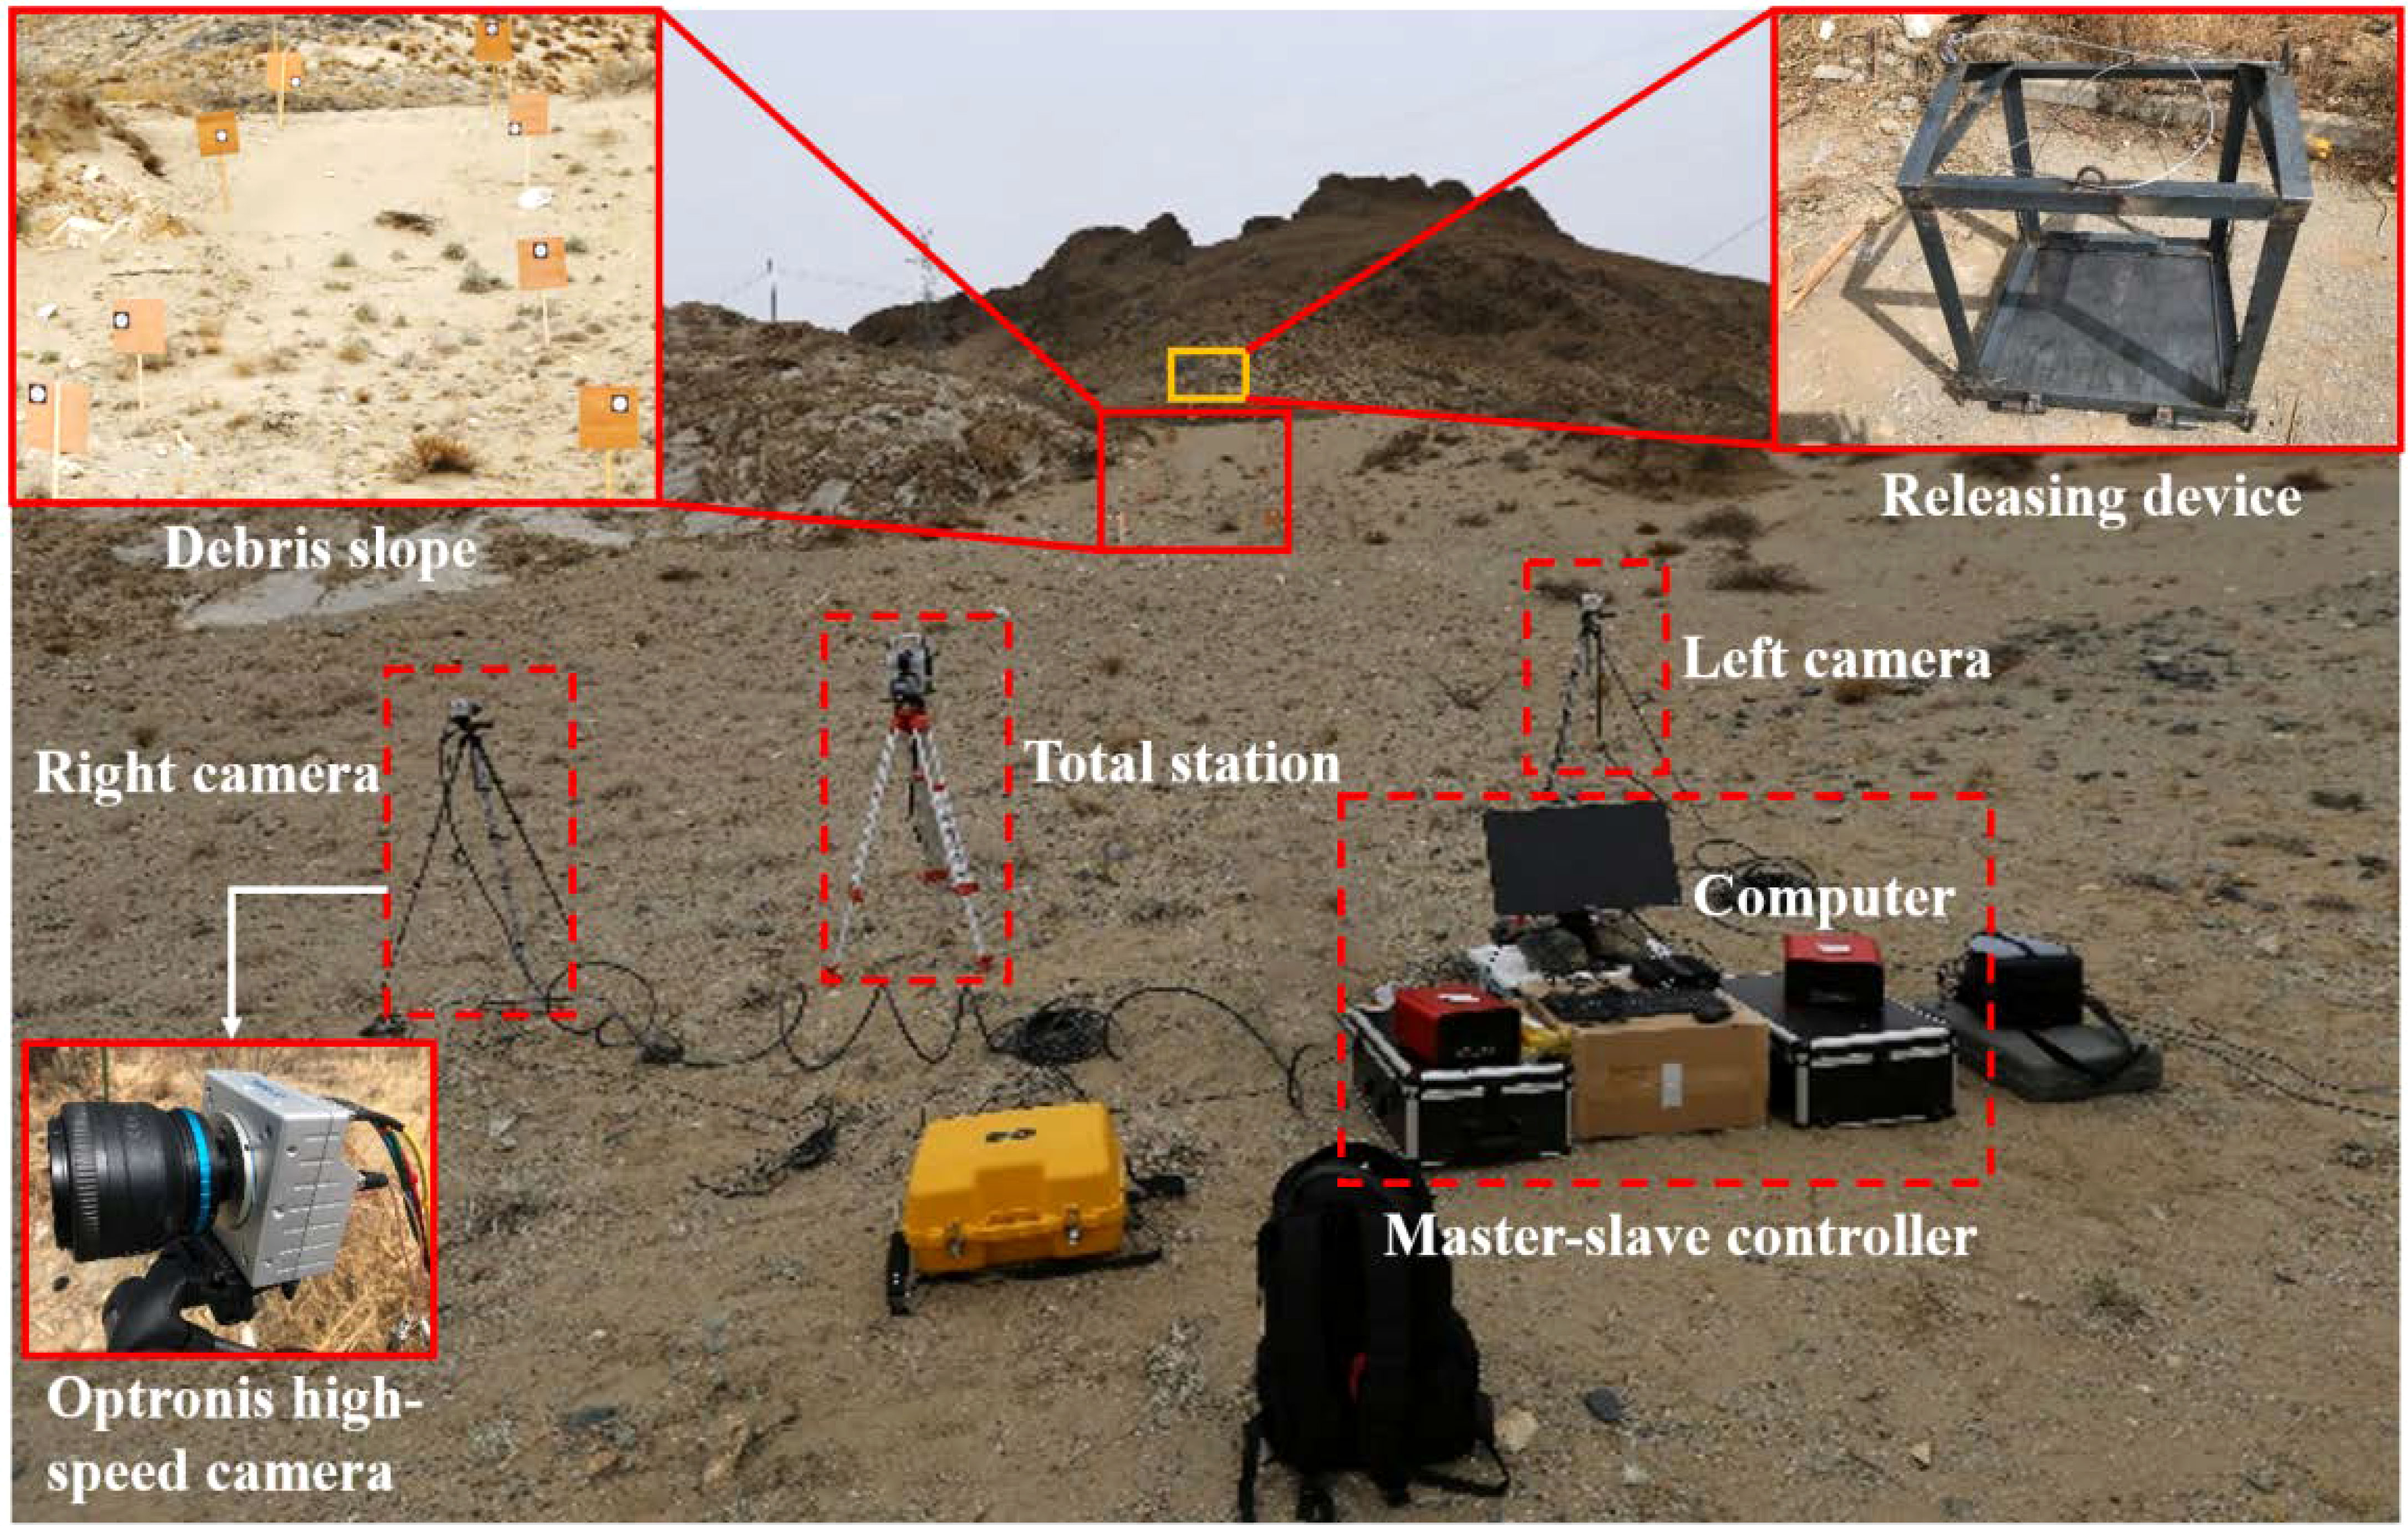
Figure 9 Experimental stereovision system of the binocular camera.
To confirm the simulating effect of Unity3D and provide calculation parameters for numerical simulations, each test was repeated five times during the experiment, and the average values of velocity, acceleration, and displacement were computed. Moreover, the rockfall blocks’ kinetic energy was computed from the velocity. Assume that the block’s mass is m, the number of trials under the same working conditions is n, and the velocity of the i th release is vi, the kinetic energy is defined by the following equation:
In the kinetic energy calculation, n = 5, the mass m is derived from the weighing of the rock blocks, and the velocity is the average of the velocities of the five trials. A 3D simulation model of the rockfall movement was established based on the test, and computations were performed using Unity3D, and the results obtained were examined compared with the experimental results.
To ensure the accuracy of the experiment data acquisition, it is important to determine the debris slope before the rockfall field test and measure the slope inclination, slope material, and vegetation. The coded markers are then uniformly placed on the selected debris slope in quantities of eight or more and are not parallel, co-planar, or obscured from each other, and a total station measures their coordinate data. Simultaneously, set a height benchmark with a height of 5 m and a quantity of 10 or more. The shooting angle between the two cameras should be controlled at ~60° when setting up a binocular high-speed HD camera, and the overlap of the shooting area should be controlled at >70%. The experiment must be conducted in clear weather with wind speeds below level 3. Finally, debug the equipment and calibrate errors using the calibration software to analyze the error. The result of the calibration error is represented by e ; to determine whether the results meet the accuracy requirements, refer to Table 2.
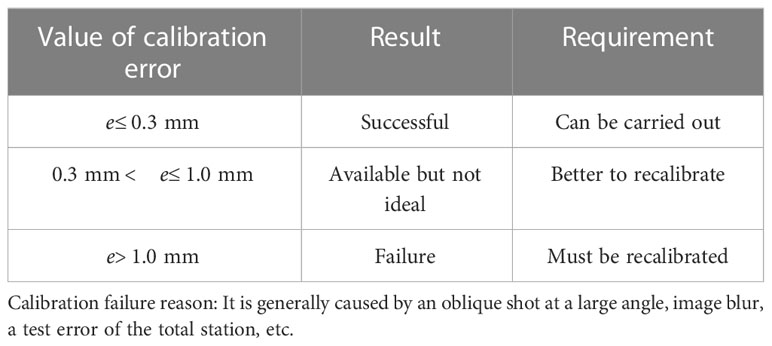
Table 2 Judgment criteria for accuracy requirements.
In the field experiment, combined with the Unity3D simulation numerical analysis, the effect of the size and form of the rockfall blocks on their movement characteristics, energy variation, and deposition position was compared and analyzed. The rockfall blocks’ diameters are 0.2, 0.6, and 1.0 m, respectively, and the block forms are cuboid, cube, and regular octahedron, respectively. The velocity, acceleration, displacement, and energy variation of the rockfall block movement of the debris slope were obtained from the experiment and compared with the numerical analysis results of the Unity3D simulation.
As shown in Figure 10, comparing the numerical simulation results of various sizes of rockfall blocks with the experimental results, the displacement, velocity, acceleration, and energy variation are the same, with minimal differences, and the maximum errors are 2.61%, 3.47%, 3.32%, and 2.58%, respectively, by analyzing the errors of the two data. Comparing the numerical simulation results for various rockfall shapes with the experimental results, the maximum errors for displacement, velocity, acceleration, and energy changes are 2.87%, 4.41%, 3.84%, and 2.37%, respectively, as illustrated in Figure 11. The field test results are consistent with the results of Unity3D simulation numerical analysis, and the errors are <5%, which confirms the accuracy and reliability of Unity3D simulation numerical analysis.
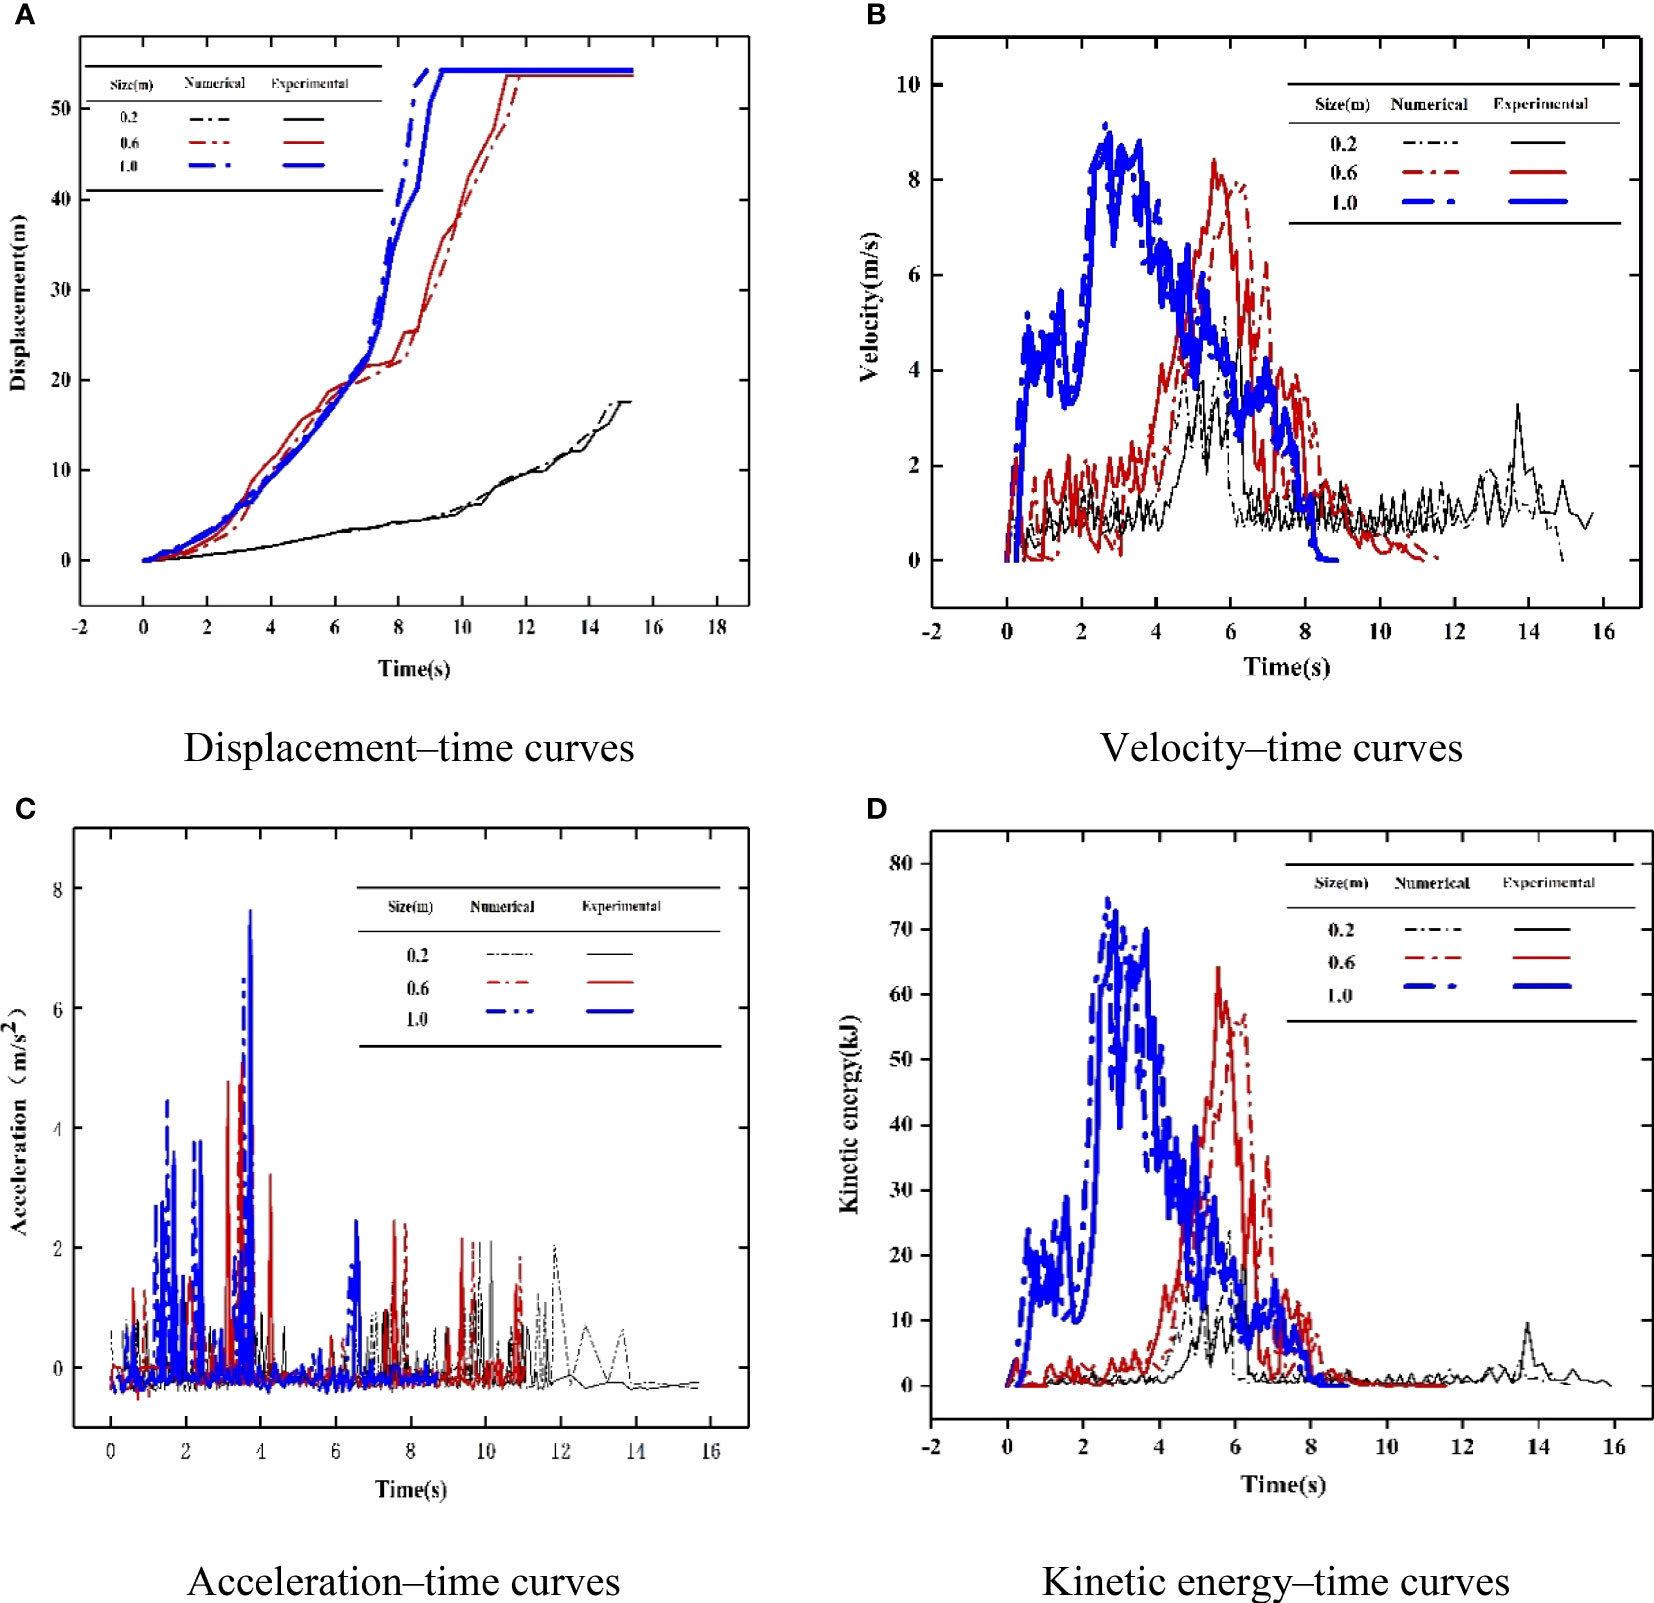
Figure 10 Movement characteristics of the block size.
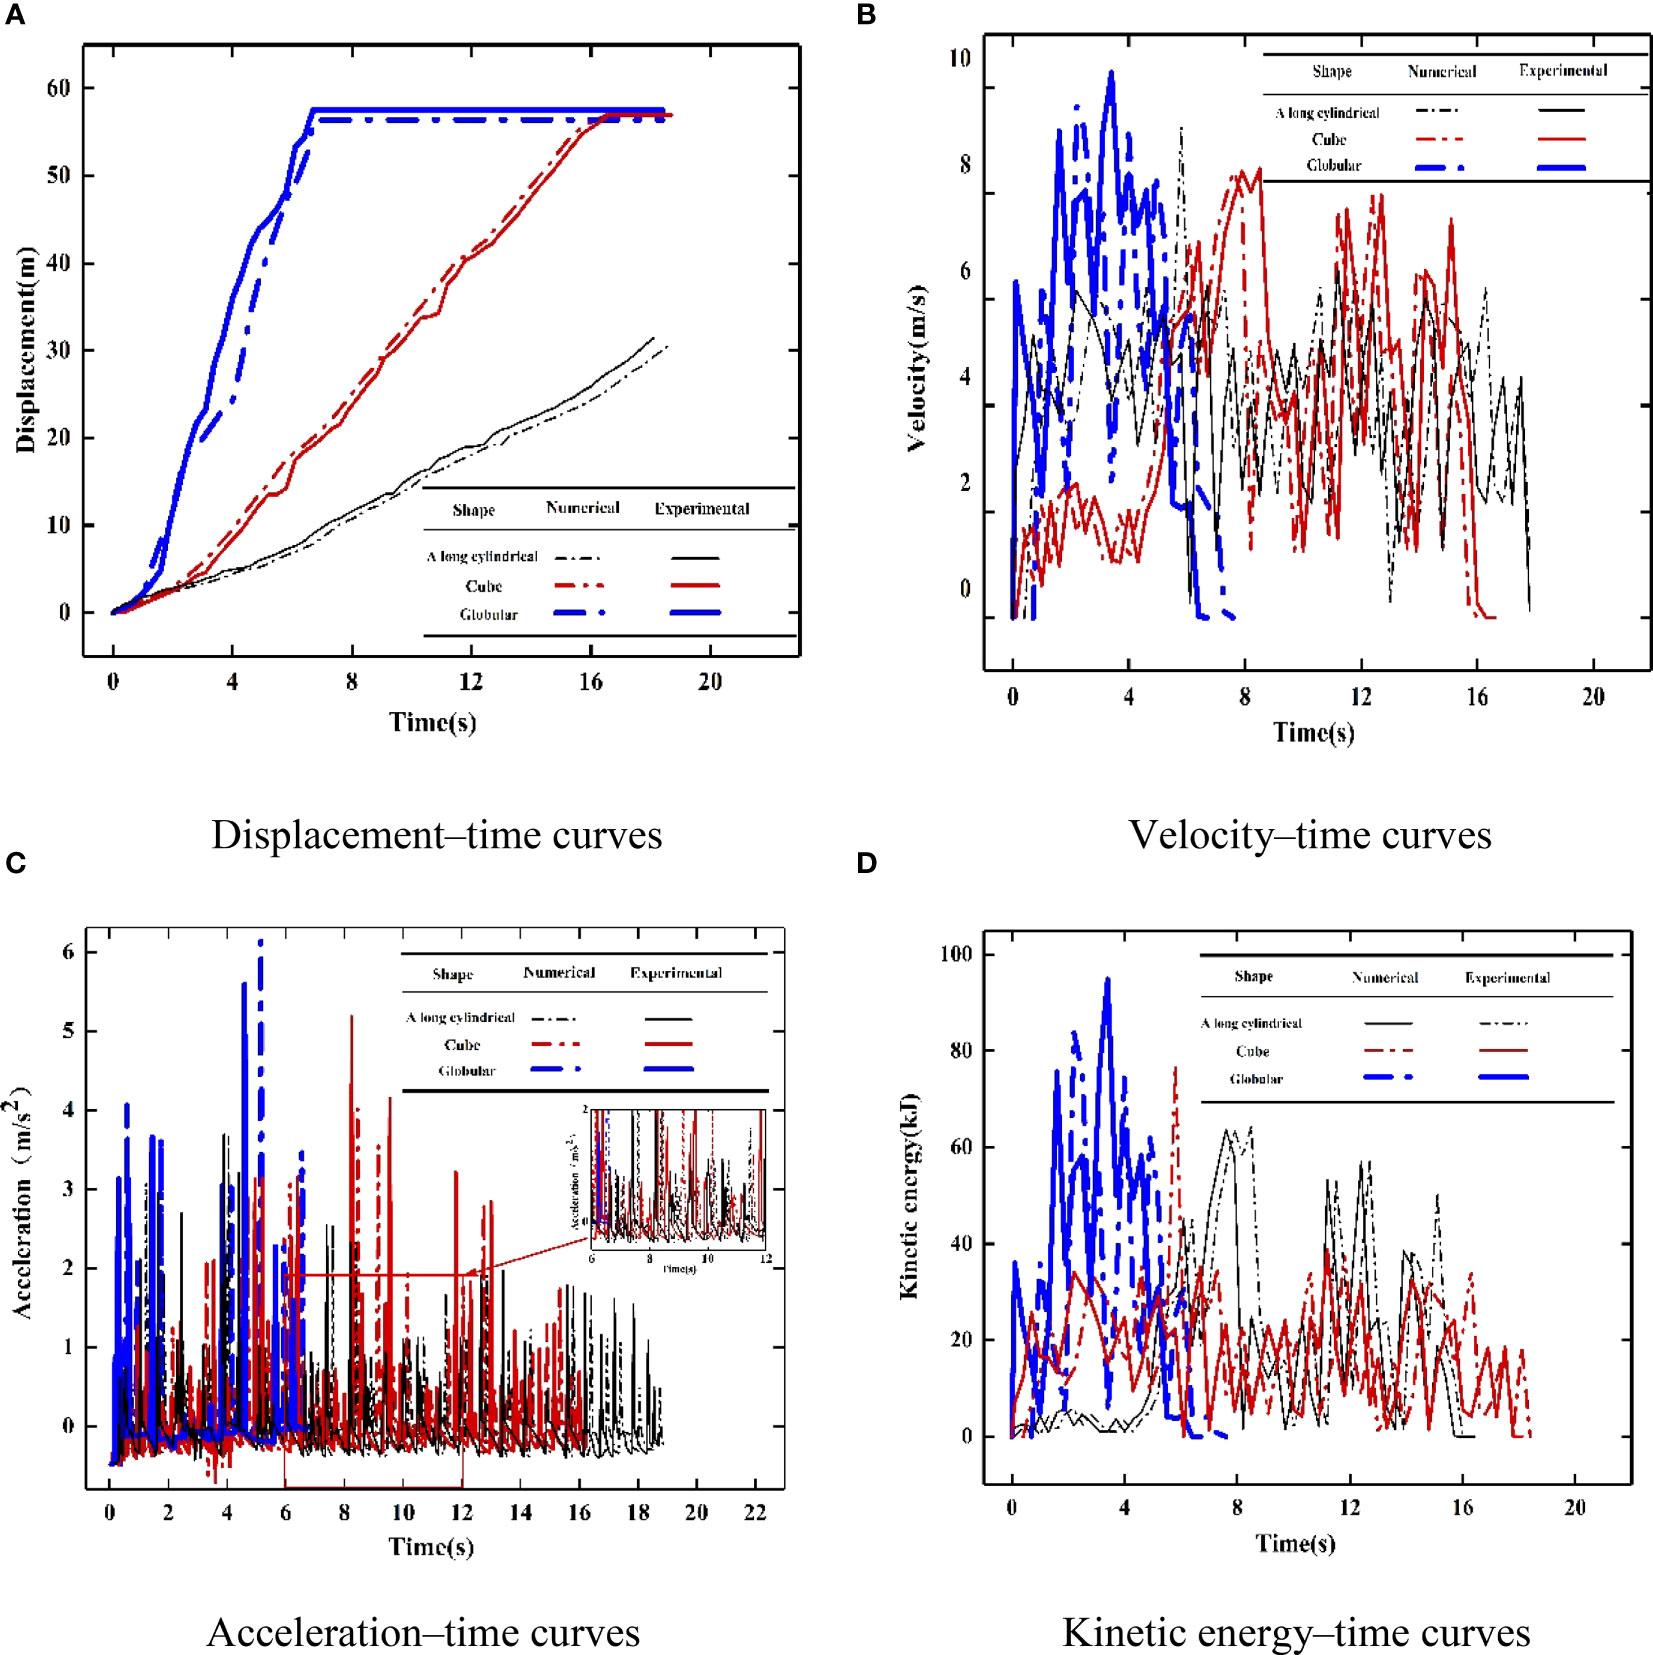
Figure 11 Movement characteristics of rockfall shape.
The debris slope is located at 3929 + 800 of G318 National Trunk Highway near Zongba, Yupu Town, Bome County, Tibet Autonomous Region, China. National Highway G318 passes through the debris slope’s front edge, with an altitude of around 3338 m, a longitude of 96°22′19.1″, and a latitude of 29°36′48.5″. Figure 12A shows the panorama of the slope. Because of the special climate and environment of the Tibetan Plateau, the slope is covered with a thin layer, the bedrock is exposed, and cold weathering is extremely serious. Some weeds and low shrubs grow on the slopes (Ma et al., 2011; Ma et al., 2021). The top of the slope is the formation area, and the rock is monzonitic granite, the bedrock exposed and weathered, the joints developed, and the inclination angle is around 70°, large-scale potential instability rock blocks are thus formed, as illustrated in Figure 12B. The center of the slope is a long and narrow circulation area, which is steep and narrow, and the inclination is around 50°. The slope’s lower part is a debris particle accumulation area, whose main component is gravel of crumbling slope accumulation, scattered debris, and debris particle accumulation, and the natural inclination is around 34°, with weeds and low shrubs growing on the slope, as shown in Figure 12C.
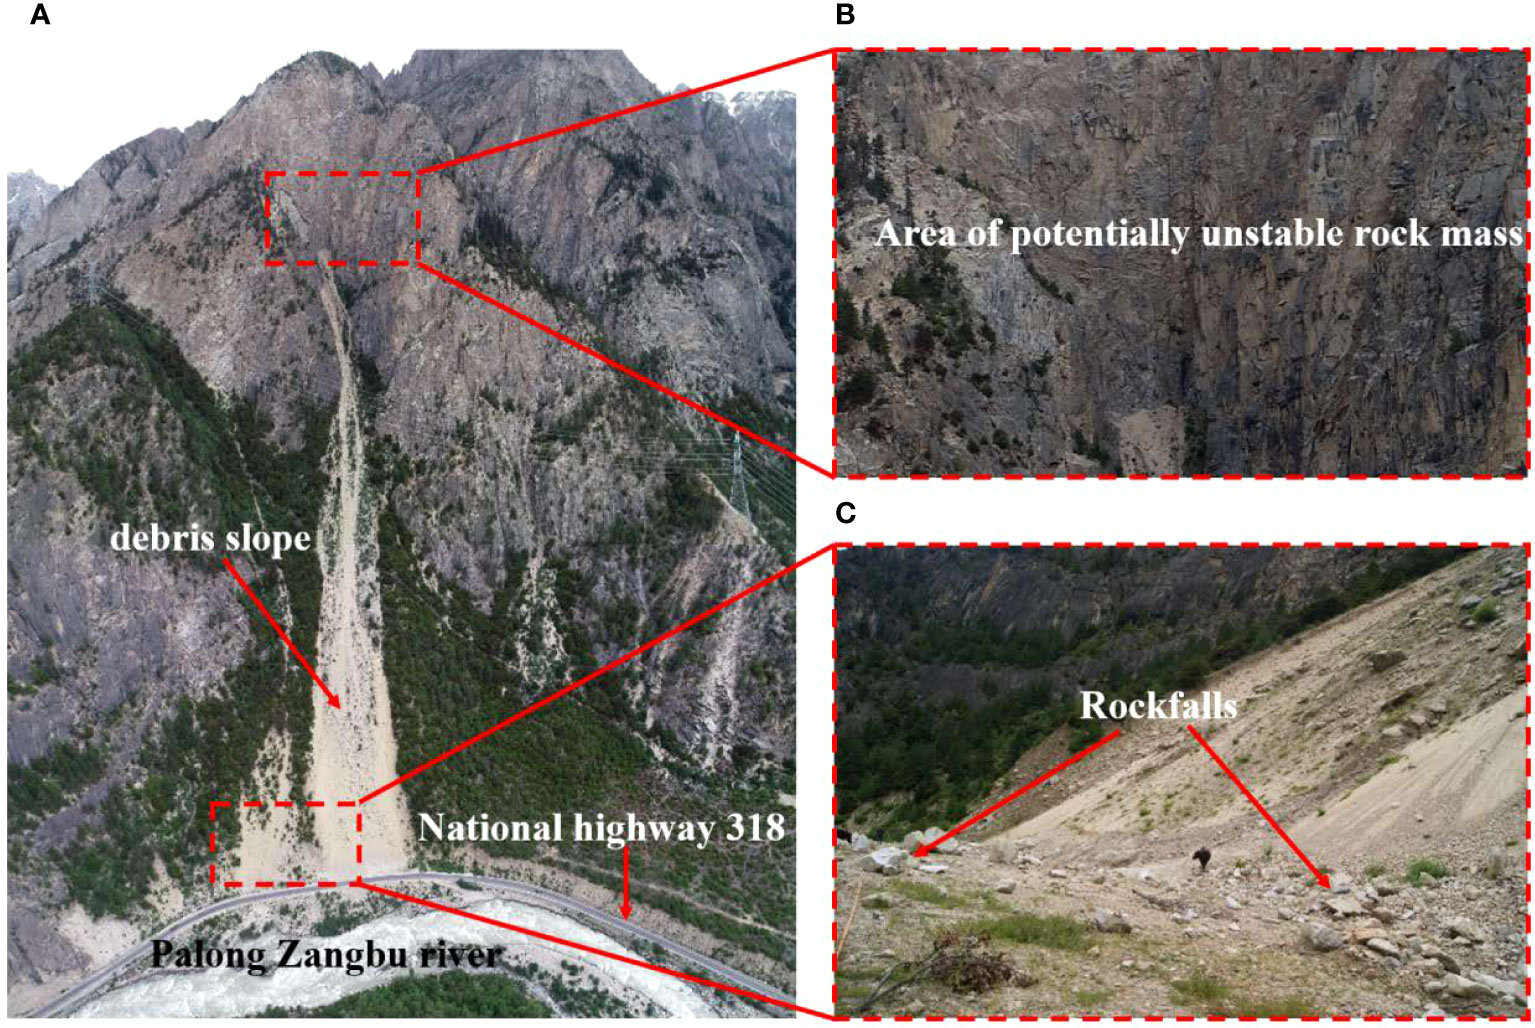
Figure 12 Rockfall slope along National Highway 318 on the Tibetan Plateau. (A) Panorama of the debris slope; (B) potentially unstable rock mass; (C) rockfalls.
In the past few decades, the rockfall blocks occasionally fell from the top of the slope, and some of them might collide with the highway, even threatening the pedestrians and vehicles passing by, which is a major geological hazard in this section of National Highway G318. After the rockfall accumulation at the bottom of the slope was cleared, there was still a large amount of debris or small pieces of rock accumulation on the side of the road. The remnants of the previous rockfall are fresh and visible, indicating that recent rockfalls occurred.
In this study, the UAV collected data from the research area with one vertical direction and four inclined directions. During the process of data collection, the overlap percentage of the sailing directions of the UAV was 80%, the side overlaps were 70%, and the route was 150 m higher than the take-off point. 569 images were obtained, and 539 usable images were obtained after removing blurred images and improving the color. RTK equipment was employed to obtain the coordinates and elevation of significant points on the debris slope, and then Pix4D mapper software was employed for high-precision modeling. Finally, a 3D laser scanner was employed to collect the rockfall blocks on the slope, and its self-bring software extracted the geometric parameters of the rock blocks. The rockfall blocks are endowed with red to facilitate observation and differentiation, as shown in Figure 13. The modeling process includes selecting and adding images, adjusting image attributes, selecting output coordinate attributes, selecting processing options templates, adjusting output parameters, and establishing models.
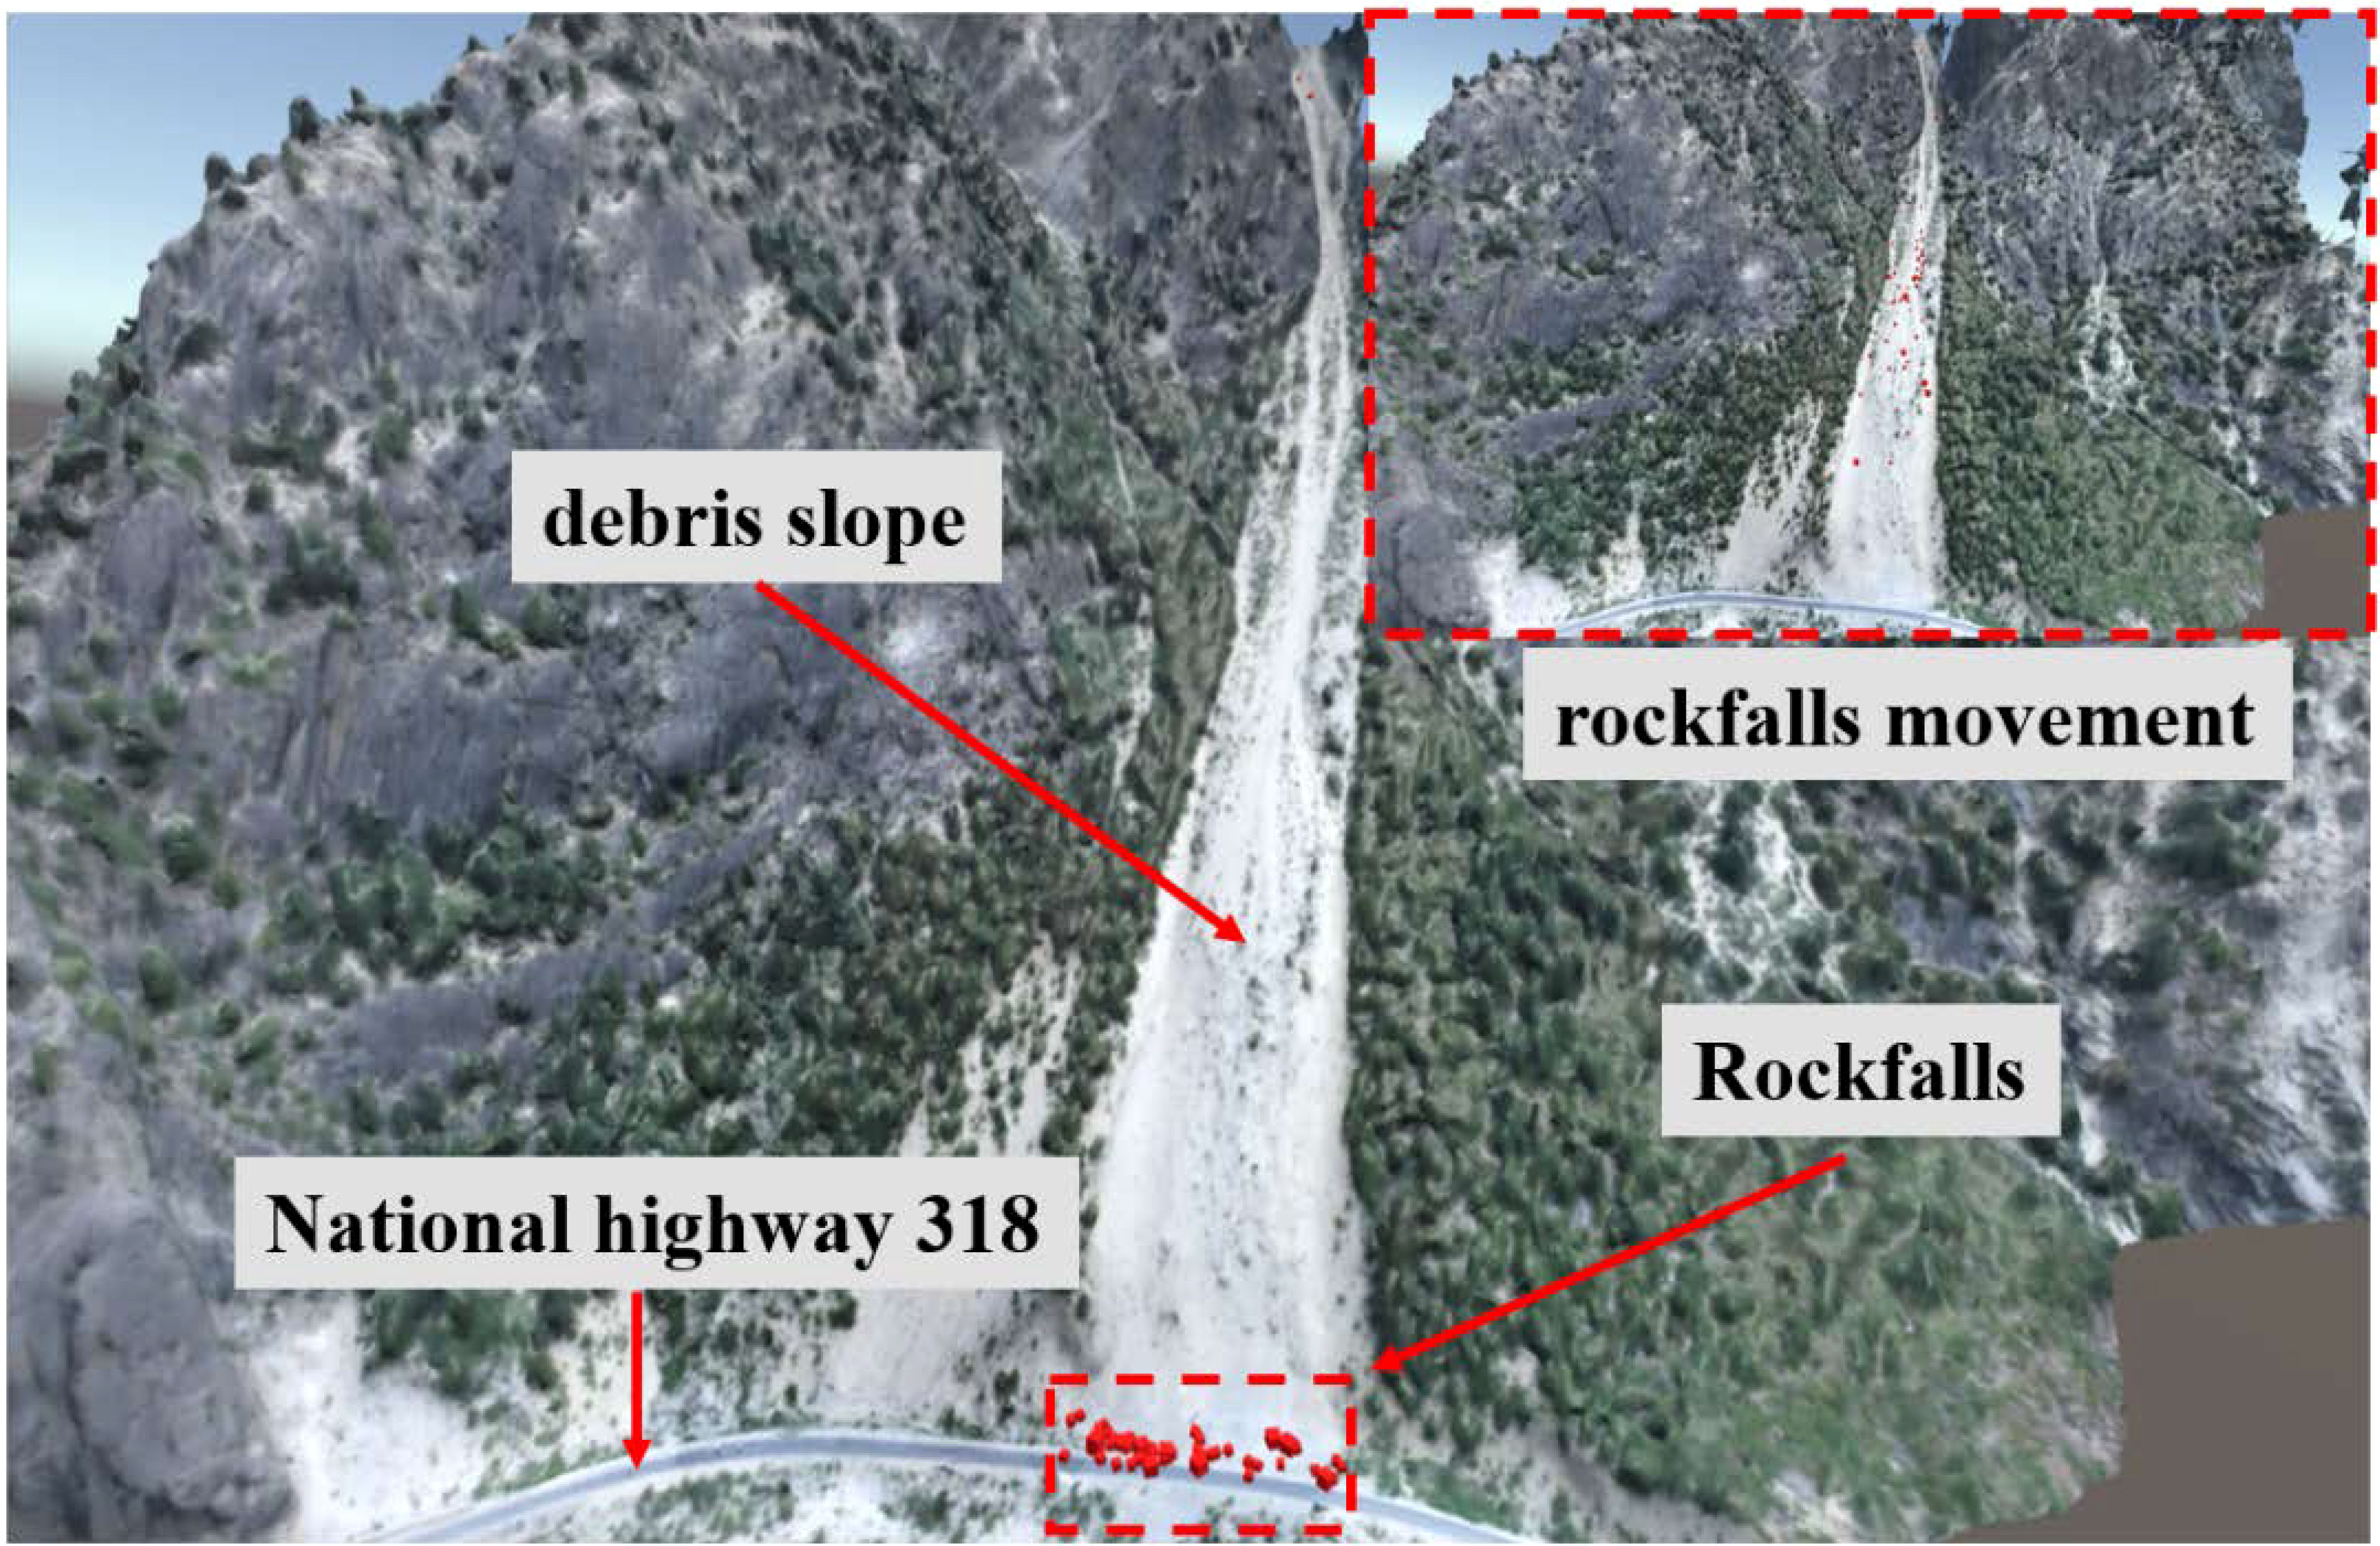
Figure 13 The 3D cloud atlas of debris slope: rockfall movement and accumulation.
The physical and mechanical parameters, such as the friction angle and cohesion, are based on the geological survey data of slopes along National Highway G318 in the Tibetan Autonomous Region, the field rebound test, and laboratory experiments of rock mechanics after conducting the field sampling, as shown in Table 3.
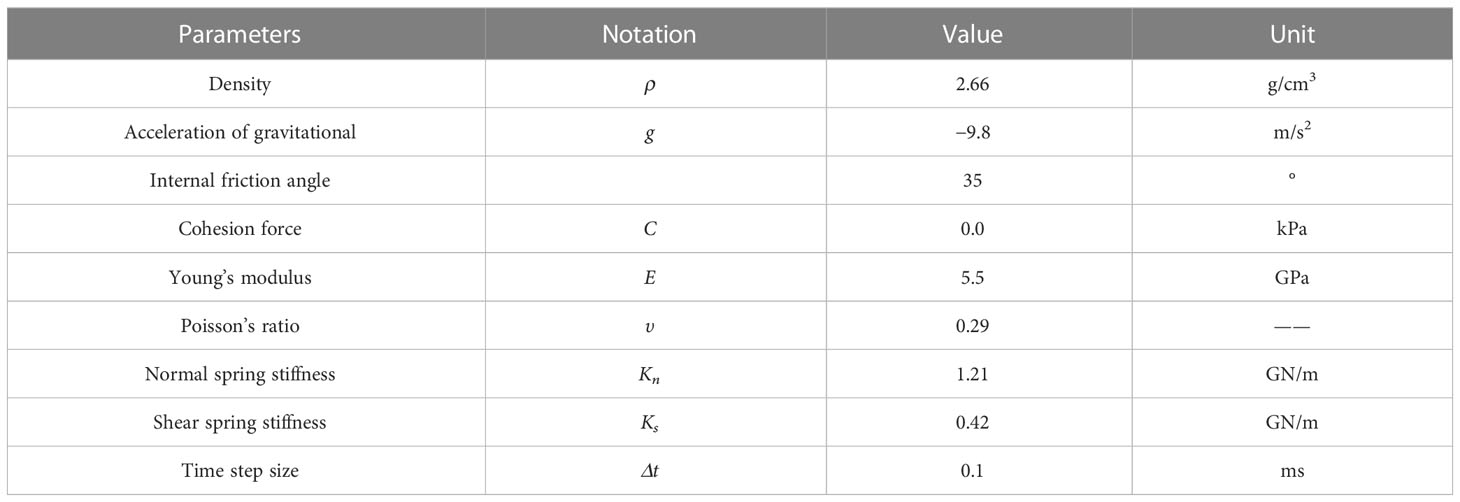
Table 3 Physical and mechanical parameters of numerical simulation.
Figures 13, 14 show that the debris slope rockfall occurs suddenly, and the maximum velocity, acceleration, and energy of movement of rockfall blocks are great. Finally, most rockfall blocks are accumulated on the highway, and only a small part of their deposit is on the slope. This is a major security threat to passing vehicles and pedestrians.
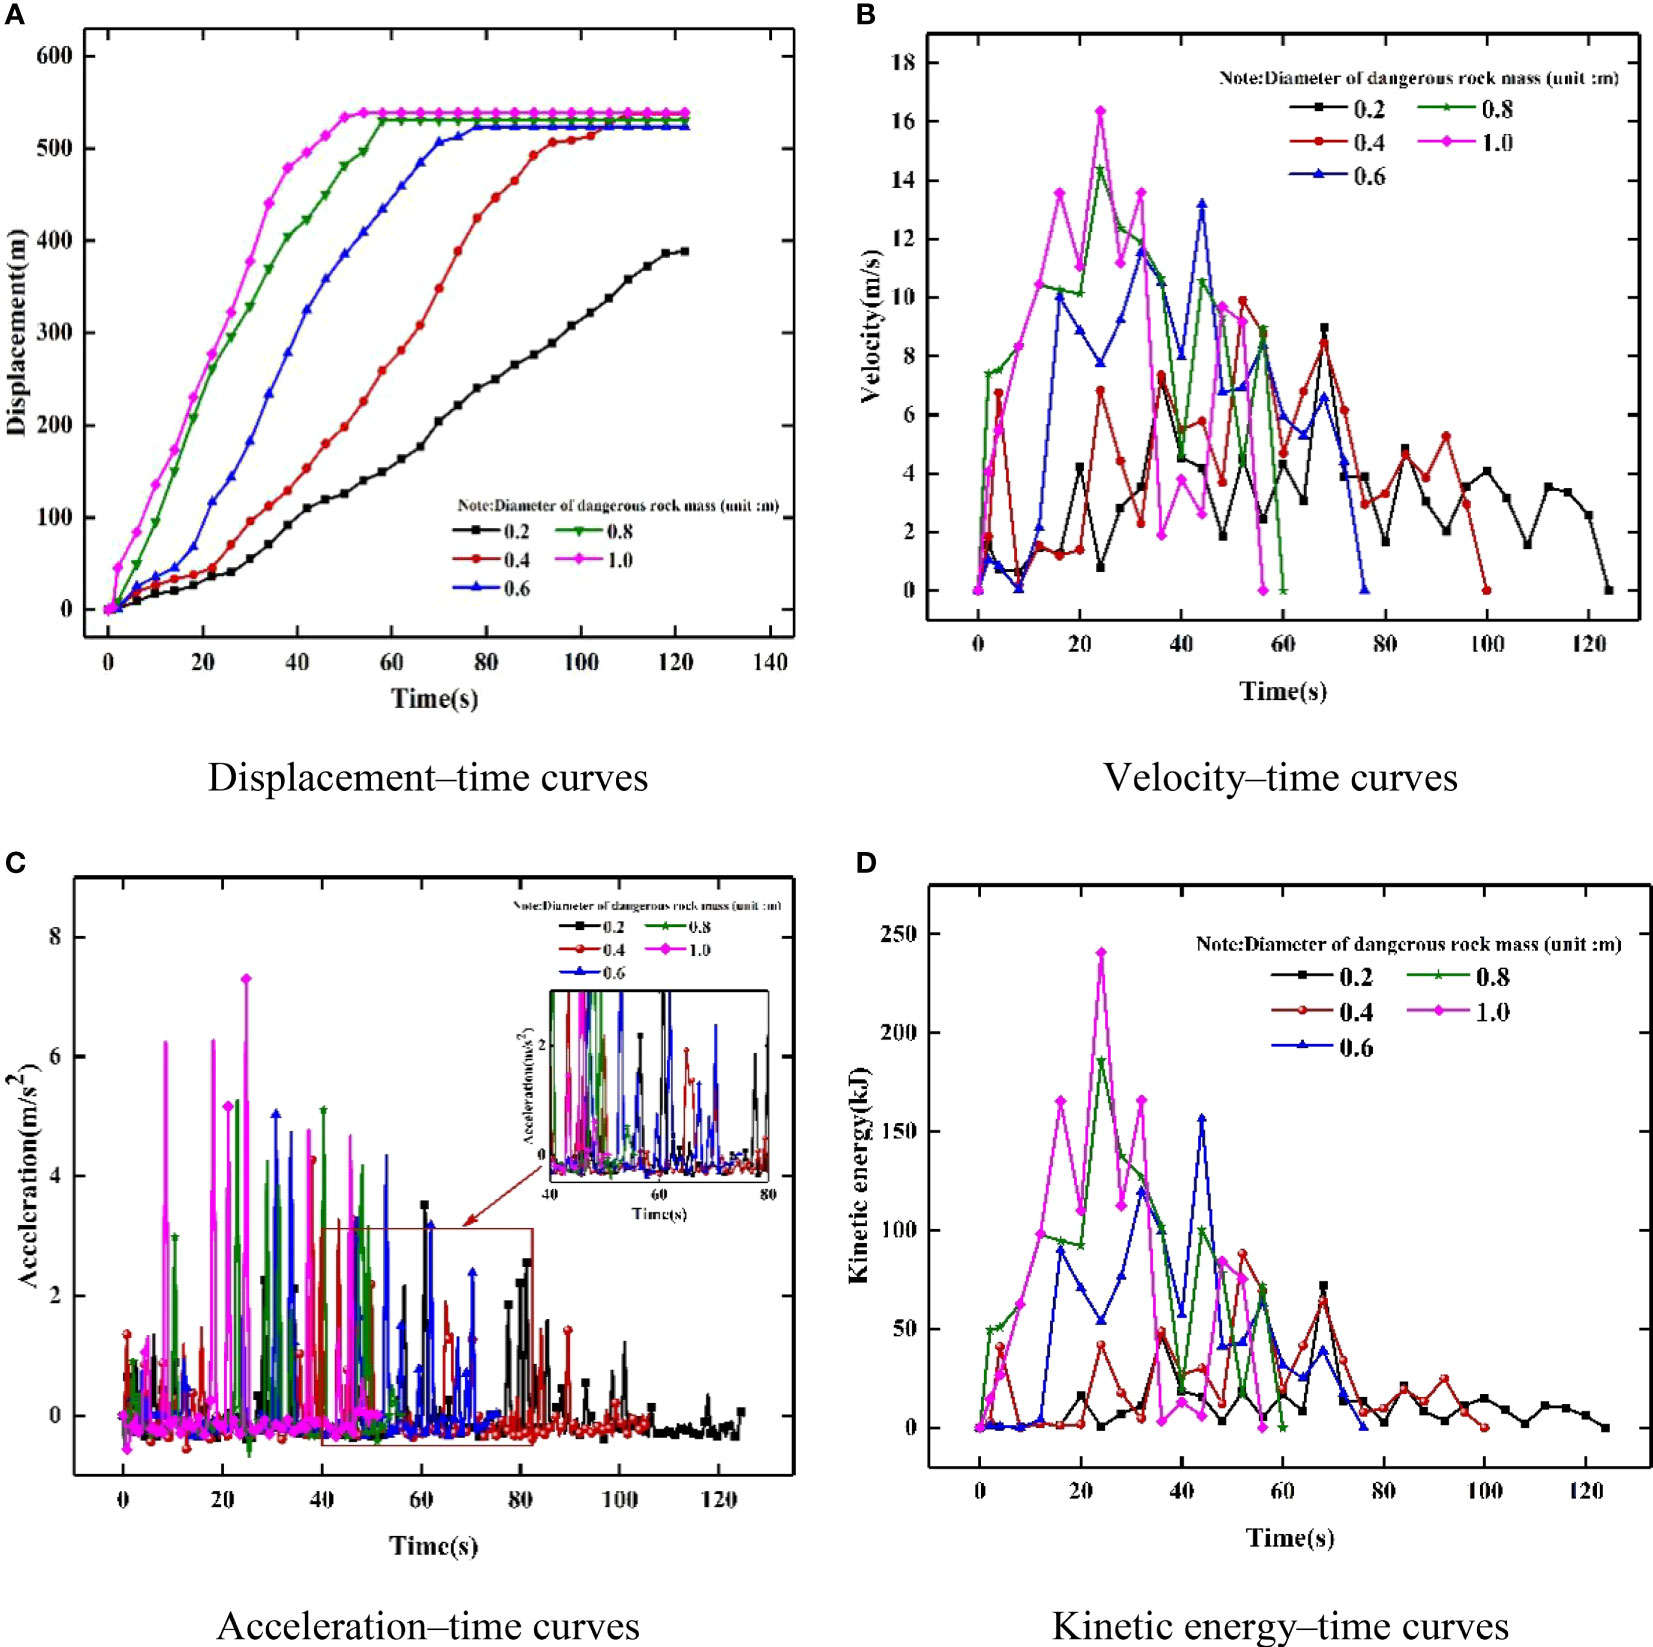
Figure 14 Movement characteristics of rockfalls along debris slope.
To further verify the accuracy of the Unity3D simulation approach for high-precision modeling, combined with the field investigation to obtain the rockfall displacement and accumulation position of the debris slope of National Highway G318 in the Tibetan Autonomous Region, in this study, the Unity3D simulation results of the high-precision model were compared with the numerical simulation results of the ordinary model (Table 4).
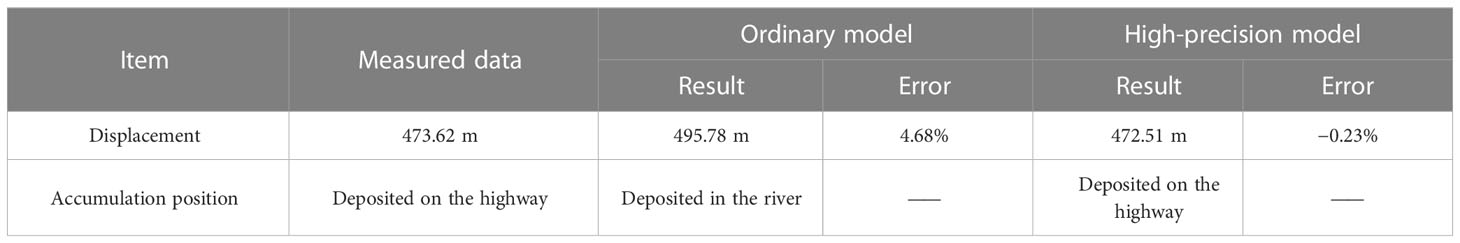
Table 4 Accuracy comparison of numerical simulation results.
As shown in Table 4, the error of numerical simulation of the ordinary model is 4.68%, the rockfall has crossed National Highway G318 and was deposited in the Palong Zangbu River. However, the high-precision model numerical simulation error is −0.23%, and the rockfall deposited on National Highway G318 is 1.11 m, different from the field investigation deposition position. This shows that the numerical simulation results of the high-precision model are more accurate. Through the Unity3D simulation of rockfall movement characteristics, kinetic energy change, and accumulation position of field debris slope, rockfall phenomena and behavior of debris slopes could be fully understood. Thus, this research can realize the prediction of rockfall disasters and the reasonable design of protective countermeasures.
In this research, the movement characteristics, energy variation, and deposit locations of rockfall blocks on debris slopes were investigated using a combination of Unity3D simulations and field experiments. The following conclusions were drawn from a systematic analysis of the experimental indicators of rockfall movement characteristics, e.g., lateral velocity, acceleration, energy variation, and rest position:
(1) The data collected using UAV and 3D laser scanners were employed to develop a high-precision 3D ground simulation model by Pix4D software. Compared with the numerical simulation results of the ordinary model, the displacement error of the high-precision 3D ground simulation model is reduced to 0.23%, and the rockfall blocks’ rest position is consistent with the actual measured position of the field investigation. This shows that the high-precision 3D ground simulation model of the rockfall movement process is more realistic and reasonable, and the computation results are more accurate.
(2) For the movement characteristics of rockfalls of debris slope: 1) When the inclination is greater than 30°, the greater the inclination, the greater the velocity, acceleration, and kinetic energy, and the farther the moving distance; 2) For different slope surface material: The velocity, acceleration and kinetic energy of the rock slope are greater, and the displacement is farther than that of the slope with debris and bushes; 3) The block’s size has a visible influence on the rockfall movement: the velocity and acceleration with diameters of 0.2, 0.4, 0.6, 0.8, and 1.0 m increase with the increase in the block, and the farther the moving distance; 4) The velocity and acceleration of falling unstable block are larger, and the displacement is farther than that of toppling and sliding unstable block; 5) The closer the shape of a rock block is to a sphere, the greater the speed, acceleration, and displacement of its movement.
(3) This study shows that the movement characteristics and deposited position of rockfalls on debris slopes are different from that on an ordinary slope. This is mainly shown in the following aspects: 1) The velocity and acceleration of rockfalls on the debris slope are smaller than that on the ordinary slope; 2) The energy loss in the contact process between rockfalls and debris slope is significantly higher than the ordinary slope; 3) Rockfall is easier to rest at the debris slope, forming secondary instability and downward movement.
Using the Unity3D simulation computation approach to establish a high-precision 3D ground simulation model can help analyze rockfall blocks’ movement characteristics, trajectory, and predicted rest position and propose more reasonable and reliable prevention measures. Based on the research results and the actual situation, an open-cut tunnel, shed tunnel, and other engineering measures should be set at the bottom of the debris slope, which can efficiently eliminate the threat of rockfall disaster on the debris slope.
The original contributions presented in the study are included in the article/supplementary material. Further inquiries can be directed to the corresponding author.
TY, methodology, writing – original draft and funding acquisition. WT, software. HL, writing – review and editing. YZ, investigation. RL, investigation. All authors contributed to the article and approved the submitted version.
This research was supported by the National Natural Science Foundation of China (NSFC) Grants (Nos. 41662020 and 42072313), the Key R & D Projects of the Deyang Science and Technology Plan (No. 2022SZ049).
The authors declare that the research was conducted in the absence of any commercial or financial relationships that could be construed as a potential conflict of interest.
All claims expressed in this article are solely those of the authors and do not necessarily represent those of their affiliated organizations, or those of the publisher, the editors and the reviewers. Any product that may be evaluated in this article, or claim that may be made by its manufacturer, is not guaranteed or endorsed by the publisher.
Agliardi F., Crosta G. B. (2003). High resolution three-dimensional numerical modeling of rockfalls. Int. J. Rock Mech. Min. 40, 455–471. doi: 10.1016/S1365-1609(03)00021-2
Asteriou P., Saroglou H., Tsiambaos G. (2012). Geotechnical and kinematic parameters affecting the coefficients of restitution for rock fall analysis. Int. J. Rock Mech. Min. 54, 103–113. doi: 10.1016/j.ijrmms.2012.05.029
Bartingale R., Higgins J., Andrew R., Rock A., Zhang R. (2009). “Colorado Rockfall simulation program version 5.0,” in Proc 60th highway geology symp, buffalo, 189–200. Buffalo NY, United States: TRB Publications
Bonneau D. A., Hutchinson D. J., McDougall S., DiFrancesco P. M., Evans T. (2022). Debris-flow channel headwater dynamics: examining channel recharge cycles with terrestrial laser scanning. Front. Earth Sci. 10. doi: 10.3389/feart.2022.883259
Caine N. (1980). The rainfall intensity-duration control of shallow landslides and debris flows. Geogr. Ann. 62 (1-2), 23–27. doi: 10.1080/04353676.1980.11879996
Chen G. B., Li T., Yang L., Zhang G. H., Li J. W., Dong H. J. (2021). Mechanical properties and failure mechanism of combined bodies with different coal-rock ratios and combinations. J. Min. Strat. Control Eng. 3 (2), 023522. doi: 10.13532/j.jmsce.cn10-1638/td.20210108.001
Chen G. Q., Zheng L., Zhang Y. B., Wu J. (2013). Numerical simulation in rockfall analysis: a close comparison of 2-d and 3-d DDA. Rock Mech. Rock Eng. 46 (3), 527–541. doi: 10.1007/s00603-012-0360-9
Chiu Y. P., Shiau Y. C., Song S. J. (2015). A study on simulating landslides using unity software. Appl. Mech. Mater. 764, 804–811. doi: 10.4028/www.scientific.net/AMM.764-765.806
Cui W. (2012). Design of metallurgical machinery dynamic demonstration system based on phys X. Comput. Modernization. 1 (201), 113.
Dorren L. K. A., Berger F., Putters U. S. (2006). Real-size experiments and 3-d simulation of rockfall on forested and non-forested slopes. Nat. Hazard Earth Sys. 6 (1), 145–153. doi: 10.5194/nhess-6-145-2006
Evans S. G., Hungr O. (1993). The assessment of rockfall hazard at the base of talus slopes. J. Can. Geotech. 30 (4), 620–636. doi: 10.1139/t93-054
Famiglietti N. A., Cecere G., Grasso C., Memmolo A., Vicari A. (2021). A test on the potential of a low cost unmanned aerial vehicle RTK/PPK solution for precision positioning. Sensors. 21 (11), 3882. doi: 10.3390/s21113882
Feng Y. P., Li W. G., Yang L. B., Gao Y. L., Li W. B. (2013). 3D laser scanner and its application in engineering survey. Advanced Materials Res. Trans. Tech. Publications Ltd. 671, 2111–2114. doi: 10.4028/www.scientific.net/AMR.671-674.2111
Fu X., Ding H., Sheng Q., Chen J., Chen H., Li G., et al. (2021). Reproduction method of rockfall geologic hazards based on oblique photography and three-dimensional discontinuous deformation analysis. Front. Earth Sci. 9. doi: 10.3389/feart.2021.755876
Guzzetti F., Crosta G., Detti R., Agliardi F. (2002). STONE: a computer program for the three-dimensional simulation of rockfalls. Comput. Geosci. 28 (9), 1079–1093. doi: 10.1016/S0098-3004(02)00025-0
Hawke R., McConchie J. (2011). In situ measurement of soil moisture and pore-water pressures in an 'incipient' landslide: lake tutira, new Zealand. J. Environ. Manage. 92 (2), 266–274. doi: 10.1016/j.jenvman.2009.05.035
He N., Fu Q., Zhong W., Yang Z., Cai X., Xu L. (2022). Analysis of the formation mechanism of debris flows after earthquakes - a case study of the legugou debris flow. Front. Ecol. Evol. 10. doi: 10.3389/fevo.2022.1053687
He N., Song Y., Hu G., Yang Z., Fu Q., Gurkalo F. (2023). The distribution law and coupling factors of debris flows in the G318 linzhi–Lhasa section of the sichuan–Tibet traffic corridor. Front. Ecol. Evol. 11. doi: 10.3389/fevo.2023.1166239
Hristov N. I., Nikolaidis D., Hubel T. Y., Allen. L. C. (2019). Estimating overwintering monarch butterfly populations using terrestrial LiDAR scanning. Front. Ecol. Evol. 7. doi: 10.3389/fevo.2019.00266
Hu Q. F., Cui X. M., Liu W. K., Ma T. J., Geng H. R. (2020). Law of overburden and surface movement and deformation due to mining super thick coalseam. J. Min. Strat. Control Eng. 2 (2), 023021. doi: 10.13532/j.jmsce.cn10-1638/td.20191113.001
Li Y. (2021). Mechanics and fracturing techniques of deep shale from the sichuan basin, SW China. Energy Geosci. 2 (1), 1–9. doi: 10.1016/j.engeos.2020.06.002
Li H. (2022). Research progress on evaluation methods and factors influencing shale brittleness: a review. Energy Rep. 8, 4344–4358. doi: 10.1016/j.egyr.2022.03.120
Li J., Li H., Yang C., Ren X. H., Li Y. D. (2023). Geological characteristics of deep shale gas and their effects on shale fracability in the wufeng–longmaxi formations of the southern sichuan basin, China. Lithosphere 2023 (1), 4936993. doi: 10.2113/2023/4936993
Li Y. X., Shi H. M. (2020). Research on data processing of low altitude photogrammetry based on Pix4D. Int. J. Intell. Inf. Tec. 9 (1), 195–197.
Li H., Tang H. M., Qin Q. R., Zhou J. L., Qin Z. J., Fan C. H., et al. (2019). Characteristics, formation periods and genetic mechanisms of tectonic fractures in the tight gas sandstones reservoir: a case study of xujiahe formation in YB area, sichuan basin, China. J. Petrol. Sci. Eng. 178, 723–735. doi: 10.1016/j.petrol.2019.04.007
Li L. F., Zhang X. H., Deng H. L., Han L. P. (2020). Mechanical properties and energy evolution of sandstone subjected to uniaxial compression with different loading rates. J. Min. Strat. Control Eng. 2 (4), 043037. doi: 10.13532/j.jmsce.cn10-1638/td.20200407.001
Lin W., Hanyue Y., Bin L. (2022). Prediction of wastewater treatment system based on deep learning. Front. Ecol. Evol. 10. doi: 10.3389/fevo.2022.1064555
Liu Z., Chen T. (2009). “Distance measurement system based on binocular stereo vision,” in 2009 International Joint Conference on Artificial Intelligence, Hainan. 456–459. doi: 10.1109/JCAI.2009.77
Liu Y., Li J. J., Wang Z. Z. (2021). Experimental verifications and applications of 3D−DDA in movement characteristics and disaster processes of rockfalls. Rock Mech. Rock Eng. 54, 2491–2512. doi: 10.1007/s00603-021-02394-2
Liu C., Liu X., Peng X., Wang E., Wang S. (2019). Application of 3D-DDA integrated with unmanned aerial vehicle–laser scanner (UAV-LS) photogrammetry for stability analysis of a blocky rock mass slope. Landslides. 16 (9), 1645–1661. doi: 10.1007/s10346-019-01196-6
Liu B., Qiao Q., Han F. (2020). Rapid calibration method for 3D laser scanner. Recent Pat. Eng. 14 (2), 234–241. doi: 10.2174/1872212113666191016140122
Liu X., Zhang J., Yan H., Yang H. (2022). Estimation of the surface net radiation under clear-sky conditions in areas with complex terrain: a case study in haihe river basin. Front. Ecol. Evol. 10. doi: 10.3389/fevo.2022.935250
Ma K., Liu G., Xu N., Zhang Z., Feng B. (2021). Motion characteristics of rockfall by combining field experiments and 3D discontinuous deformation analysis. Int. J. Rock Mech. Min. 138, 104591. doi: 10.1016/j.ijrmms.2020.104591
Ma G., Matsuyama H., Nishiyama S., Ohnishi Y. (2011). Practical studies on rockfall simulation by DDA. J. Rock Mech. Geotech. Eng. 3 (1), 57–63. doi: 10.3724/SP.J.1235.2011.00057
Naus K., Angel A. (2017). Application of unmanned aerial vehicle (UAV) to photogrammetric developments. Sci. J. Polish Naval Acad. 211 (4), 113–127. doi: 10.5604/01.3001.0010.6751
Ondercin M. (2016). An exploration of rockfall modelling through game engines (Kingston: Master thesis, Queen’s University). Available at: http://hdl.handle.net/1974/14330.
Ruzgienė B., Berteška T., Gečyte S., Jakubauskienė E., Aksamitauskas V.Č. (2015). The surface modelling based on UAV photogrammetry and qualitative estimation. Measurement. 73, 619–627. doi: 10.1016/j.measurement.2015.04.018
Sala Z. L. J. (2018). Game-engine based rockfall modelling: testing and application of a new rockfall simulation tool (Kingston: Master thesis, Queen's University), 11010676.
Shi G. H. (2001). “Three-dimensional discontinuous deformation analysis,” in Proceedings of the 38th US rock mechanics symposium. Ed. Ellsworth (Washington DC: American Rock Mechanics Association (ARMA)), 1421–1428.
Vu H. H., Labatut P., Pons J. P., Keriven R. (2011). High accuracy and visibility-consistent dense multiview stereo. IEEE T. Pattern Anal. 34 (5), 889–901. doi: 10.1109/TPAMI.2011.172
Wang Y. (2009). Three-dimensional rock-fall analysis with impact fragmentation and fly-rock modeling (Austin: University of Texas at Austin), 3372661.
Wang L., Wang L. Z. (2019). “Design and implementation of three-dimensional virtual tour guide training system based on Unity3D,” in 2019 International Conference on Communications, Information System and Computer Engineering (CISCE). 203–205. doi: 10.1109/CISCE.2019.00054
Wang R. X., Wang R., Fu P., Zhang J. M. (2020). Portable interactive visualization of large-scale simulations in geotechnical engineering using Unity3D. Adv. Eng. Software 148, 102838. doi: 10.1016/j.advengsoft.2020.102838
Wang J., Yu C., Fu G. (2021). Asymmetrical warming between elevations may result in similar plant community composition between elevations in alpine grasslands. Front. Ecol. Evol. 9. doi: 10.3389/fevo.2021.757943
Woltjer M., Rammer W., Brauner M., Seidl R., Mohren G. M. J., Lexer M. J. (2008). Coupling a 3D patch model and a rockfall module to assess rockfall protection in mountain forests. J. Environ. Manage. 87 (3), 373–388. doi: 10.1016/j.jenvman.2007.01.031
Wu Z. H., Tang M. T., Zuo Y. J., Lou Y. L., Wang W. T., Liu H., et al. (2022). Acoustic emission-based numerical simulation of tectonic stress field for tectoclase prediction in shale reservoirs of the northern guizhou area, China. Energy Geosci. 3 (4), 436–443. doi: 10.1016/j.engeos.2021.10.005
Xue F., Liu X. X., Wang T. Z. (2021). Research on anchoring effect of jointed rock mass based on 3D printing and digital speckle technology. J Min. Strat. Control Eng. 3 (2), 023013. doi: 10.13532/j.jmsce.cn10-1638/td.20201020.001
Yang Z., Chen M., Zhang J., Ding P., He N., Yang Y. (2023). Effect of initial water content on soil failure mechanism of loess mudflow disasters. Front. Ecol. Evol. 11. doi: 10.3389/fevo.2023.1141155
Ye T., Xie Q., Wang Y., An Y., Jin J. (2018). Analog modeling of sand slope stability with different precipitation conditions. J. Mod. Transp. 26 (3), 200–208. doi: 10.1007/s40534-018-0163-0
Yu X. Y., Wang Z. S., Yang Y., Mao X. W. (2021). Numerical study on the movement rule of overburden in fully mechanized caving mining with thick depth and high mining height. J. Min. Strat. Control Eng. 3 (1), 013533. doi: 10.13532/j.jmsce.cn10-1638/td.20200715.001
Zhang Y., Huang R., Fu R. (2010). Experimental research on dynamic failure mechanism of large-scale talus slope. Chin. J. Rock Mech. Eng. 29 (1), 65–72.
Zhang J. Y., Ma X. L., Zhang J. L., Sun D. L., Zhou X. Z., Mi C. L., et al. (2023). Insights into geospatial heterogeneity of landslide susceptibility based on the SHAP-XGBoost model. J. Environ. Manage. 332, 117357. doi: 10.1016/j.jenvman.2023.117357
Zhang Y., Xu Q., Chen G., Zhao J. X., Zheng L. (2014). Extension of discontinuous deformation analysis and application in cohesive-frictional slope analysis. Int. J. Rock Mech. Min. 70, 533–545. doi: 10.1016/j.ijrmms.2014.06.005
Zheng L., Wu Y. H., Zhu Z. Y., Ren K. H., Wei Q., Wu W., et al. (2022). Investigating the role of earthquakes on the stability of dangerous rock masses and rockfall dynamics. Front. Earth Sci. 9. doi: 10.3389/feart.2021.824889
Keywords: rockfalls, movement characteristics, movement mechanisms, debris slope, Unity3D, Tibetan Plateau
Citation: Ye T, Tao W, Li H, Zhang Y and Liu R (2023) Simulation analysis of rockfall movement characteristics with debris slope using Unity3D based on UAV remote sensing DSM: a case study of the G318 Highway on the Tibetan Plateau. Front. Ecol. Evol. 11:1221915. doi: 10.3389/fevo.2023.1221915
Received: 13 May 2023; Accepted: 19 June 2023;
Published: 03 July 2023.
Edited by:
Ahmed E. Radwan, Jagiellonian University, PolandReviewed by:
Jingshou Liu, China University of Geosciences (Wuhan), ChinaCopyright © 2023 Ye, Tao, Li, Zhang and Liu. This is an open-access article distributed under the terms of the Creative Commons Attribution License (CC BY). The use, distribution or reproduction in other forums is permitted, provided the original author(s) and the copyright owner(s) are credited and that the original publication in this journal is cited, in accordance with accepted academic practice. No use, distribution or reproduction is permitted which does not comply with these terms.
*Correspondence: Hu Li, lihu860628@126.com
Disclaimer: All claims expressed in this article are solely those of the authors and do not necessarily represent those of their affiliated organizations, or those of the publisher, the editors and the reviewers. Any product that may be evaluated in this article or claim that may be made by its manufacturer is not guaranteed or endorsed by the publisher.
Research integrity at Frontiers
Learn more about the work of our research integrity team to safeguard the quality of each article we publish.