 Erin K. Jensen
 Jeffrey R. Moore
 Paul R. Geimer1,2
95% of researchers rate our articles as excellent or good
Learn more about the work of our research integrity team to safeguard the quality of each article we publish.
Find out more
ORIGINAL RESEARCH article
Front. Earth Sci. , 04 March 2024
Sec. Geohazards and Georisks
Volume 12 - 2024 | https://doi.org/10.3389/feart.2024.1364653
This article is part of the Research Topic Environmental processes driving to slope failures: investigations, monitoring, and modelling through natural field laboratories View all 8 articles
Seismic resonance and surface displacement measurements can be implemented in tandem to improve landslide characterization and progressive failure monitoring. Crack aperture data are frequently used in rock slope stability monitoring and often exhibit recognizable trends prior to failure, such as accelerated crack opening. Alternatively, ambient resonance data offer multiple parameters including modal frequencies, damping, and polarization that can be monitored alongside crack aperture and may respond differently to environmental forcings and complex failure evolution. We analyzed data from continuous ambient vibration monitoring and concomitant crack aperture measurements at the Courthouse Mesa instability, a large toppling sandstone slab in Utah, USA. Three years of data revealed crack aperture increases of 2–4 mm/year with no clearly detectable irreversible changes in modal parameters, including frequency. Annually, frequency and displacement varied by 29% and 19% of the mean, respectively, with average and maximum daily frequency fluctuations of 6.5% and 16%, respectively. These reversible cyclic changes were primarily temperature-driven, but annually, frequency was in-phase with temperature whereas crack aperture lagged temperature changes by ∼37 days. Polarization and damping also varied seasonally but were less strongly correlated with temperature. Conceptual 3D finite element modeling demonstrated consistent frequency decreases associated with crack propagation but variable changes in crack aperture measured at a single point; i.e., crack propagation did not always result in increased crack opening but always generated a resonance frequency decrease. Taken together, our data suggest a possible thermal wedging-ratcheting mechanism at the Courthouse Mesa instability, where annual thermoelastic crack closure is impeded by debris infill but the absence of downward crack propagation during the monitoring period is evidenced by no permanent resonance frequency changes. Our study demonstrates that combined seismic resonance and crack aperture data provide an improved description of rock slope instability behavior, supporting refined characterization and monitoring of changes accompanying progressive failure.
Catastrophic failure of unstable rock slopes is often attributed to breakage of intact rock (rock bridges) between existing discontinuities or heterogeneities in the rock (Terzaghi, 1962; Einstein et al., 1983; Eberhardt et al., 2004; Frayssines and Hantz, 2006; Got et al., 2010; Stock et al., 2011; Hungr et al., 2014; de Vilder et al., 2017; Elmo et al., 2018; 2022). A common precursory signal is the acceleration of fracture opening or ground displacement, which can be monitored in-situ using extensometers or crackmeters (Bakun-Mazor et al., 2013; Collins and Stock, 2016; Weber et al., 2017; Mulas et al., 2020). These instruments are relatively inexpensive and provide displacement time-series data that can be used for time-to-failure predictions (Crosta and Agliardi, 2003; Petley, 2004; Rose and Hungr, 2007; Mufundirwa et al., 2010; Intrieri et al., 2019). However, this approach is limited to detecting changes at a single location and may provide an incomplete picture of instability development without the installation of numerous instruments or when the geometry and extent of the instability are unknown.
In contrast, passive seismic methods have become increasingly used in slope stability monitoring and provide a non-invasive tool to assess internal properties and global instability characteristics (Del Gaudio et al., 2013; Larose et al., 2015; Kleinbrod et al., 2019) as a complement to conventional surface displacement monitoring (Got et al., 2010; Burjánek et al., 2018; Colombero et al., 2018; Häusler et al., 2021b). Passive ambient vibration measurements are routinely used for structural health monitoring of civil structures (Clinton, 2006; Michel et al., 2008) and have become increasingly applied in assessments of geologic features (Moore et al., 2018; Geimer et al., 2020; Colombero et al., 2021a; Häusler et al., 2021a; Finnegan et al., 2022) and unstable rock slopes (see review in Colombero et al., 2021b; and recent studies from Häusler et al., 2021b; Häusler et al., 2021c; Bessette-Kirton et al., 2022).
Rock slopes with open fractures exhibit a characteristic seismic response in which ground motion is locally amplified and polarized at resonance frequencies associated with specific unstable blocks or compartments (Moore et al., 2011a; Bottelin et al., 2013a; Galea et al., 2014; Colombero et al., 2017; Valentin et al., 2017; Burjánek et al., 2018; Iannucci et al., 2018; Häusler et al., 2019; Mercerat et al., 2020). The resonance frequencies of an unstable compartment are described most simply by the equation for vibration of a simple oscillator, implying that frequency is related to the ratio of stiffness to mass (Chopra, 2012). It follows that with instability evolution, changes in the mass of the unstable volume or changes in stiffness resulting from fracture propagation or opening will affect the resonance frequencies. Since resonance properties are rooted in a system’s geometry and mechanical properties, tracking of frequencies and associated modal parameters, including damping and frequency-dependent polarization azimuth, enables stability monitoring over larger spatial scales (e.g., tens of meters in comparison to point-based surface displacement measurements). In addition, such measurements utilize noninvasive, surface-based instruments that can be deployed for short-term (e.g., less than a day) data acquisition.
Select studies have detected irreversible resonance frequency decreases preceding failure of a rock column (Lévy et al., 2010) and during a rock block collapse test (Taruselli et al., 2020); conversely, frequency increases were observed after bolting reinforcement of an unstable rock block (Bottelin et al., 2017). In addition to resonance frequency, modal parameters, including damping and polarization azimuth, are valuable for long-term stability monitoring. Fracture aperture and stiffness affect azimuth and damping, implying that changes to these parameters could reveal differences in the mode shapes of an instability (Burjánek et al., 2019; Häusler et al., 2021b). In the absence of permanent shifts in resonance frequency values, irreversible changes in frequency-dependent polarization azimuth have been recorded at unstable rock slopes (Häusler et al., 2021b; Häusler et al., 2021c). For rock slope instabilities, damping (i.e., energy dissipation) is attributed to material-dependent granular-scale processes, including internal friction, and macro-scale processes involving geometry and the material contrast between the vibrating structure and background medium (Häusler et al., 2021b). The latter processes are mechanisms of radiation damping. Variations in damping measured from modal parameter tracking may therefore indicate material property or geometric changes in a landslide.
Environmental variables including air temperature, thermal radiation, and precipitation affect both crack aperture and rock slope resonance parameters on multiple time scales. Depending on the site geometry, thermal expansion can cause increasing or decreasing crack aperture. For example, positive correlations between crack aperture and temperature have been observed for fractures in exfoliation sheets (Collins and Stock, 2016), whereas negative relationships are typically observed for rock blocks or columns delineated by open fractures (Bakun-Mazor et al., 2013; Weber et al., 2017; Mulas et al., 2020). For hard rock sites, resonance frequencies are often positively correlated with temperature. With increasing temperature, thermal expansion causes stiffening of the rock mass from increased grain-contact and microcrack stresses (so-called stress stiffening; Starr et al., 2015; Colombero et al., 2021b; Geimer et al., 2022). Depending on the site geometry, thermal expansion can also cause closure of fractures or macrocracks, resulting in increased fracture stiffness (Colombero et al., 2018; Colombero et al., 2021b). In most cases, increased fracture stiffness and stress stiffening are hypothesized to overcome the expected negative correlation between elastic modulus and temperature for unconfined materials (Xia et al., 2011). However, the observation of a negative seasonal correlation between frequency and temperature has been attributed to a bulk stiffness decrease in a small rock column, where it was theorized that temperature changes penetrated the total volume (Bottelin et al., 2013b).
In addition to air temperature, exposure to solar radiation and radiative and convective heat fluxes play an important role in frequency changes at unstable rock sites (Guillemot et al., 2022). Convective air circulation in deep open fractures can also be an effective thermomechanical driver allowing rapid propagation of temperature changes to depths below the seasonally active layer (Moore et al., 2011b). Precipitation, meanwhile, is generally observed to cause a decrease in frequency as a result of increased mass and reduced fracture stiffness (Colombero et al., 2021b). The presence of ice in fractures and rock pores causes an increase in stiffness and, therefore frequency, during freezing periods (Bottelin et al., 2013b; Starr et al., 2015; Häusler et al., 2021b; Geimer et al., 2022). Large reversible environmentally driven frequency (e.g., Bottelin et al., 2013b; Burjánek et al., 2018; Colombero et al., 2018; Weber et al., 2018; Colombero et al., 2021a; Häusler et al., 2021b; Häusler et al., 2021c; Dietze et al., 2021; Guillemot et al., 2022) and crack aperture (e.g., Weber et al., 2017; Mulas et al., 2020) fluctuations can mask shifts related to destabilization, necessitating identification and differentiation to clarify detection of permanent changes (Bottelin et al., 2017; Bottelin et al., 2021).
In this study, we analyzed 3 years of continuous ambient vibration and surface displacement data from a natural field laboratory, the Courthouse Mesa toppling rock slab instability near Moab, Utah, United States. Past work at this site used field and numerical modal analysis to characterize the geometry and boundary conditions of the instability during a short-duration experiment (Bessette-Kirton et al., 2022), but did not investigate changes over time, which are important to understand long-term stability. Here, we examined long- (annual and multi-year) and short-term (daily and multi-day) temporal frequency and crack aperture changes and compared these with environmental data to assess irreversible and recoverable environmentally driven signals in both datasets. We consider the physical mechanisms controlling the long-term and seasonal modal parameter and crack opening trends and use 3D finite element modeling to assess changes in resonance frequency and surface displacements resulting from downward crack propagation. Finally, we discuss the implications of multi-parameter frequency and displacement measurements and considerations for real-time monitoring across varying site conditions.
The Courthouse Mesa rock slope instability is located 25 km north of Moab, Utah (Figure 1A), and is characterized by flexural toppling of a continuous slab from the propagation of a single rear fracture with resultant compressional toe failure (Bessette-Kirton et al., 2022). The slab is delineated by a 500-m-long crack that runs approximately north-south across the ∼100-m-high sandstone mesa, ranging in aperture from ∼400 mm at the southernmost end (Figure 1A) to ∼50 mm at the northern end. The crack surface trace is continuous in some areas and disjointed in others, generally ignoring pre-existing joint sets in the thin sandstone caprock of the Curtis Formation (Doelling and Morgan, 2000). Calibration of a 3D finite element model with field-derived modal analysis and depth measurements suggested crack depths between 40 and 70 m that extend into the underlying massive Entrada Sandstone (Doelling and Morgan, 2000), yielding an approximate instability volume of 400,000 m3 (Bessette-Kirton et al., 2022). The unobscured surficial fracture geometry, safety and accessibility of this site provided an ideal field laboratory for long-term monitoring.
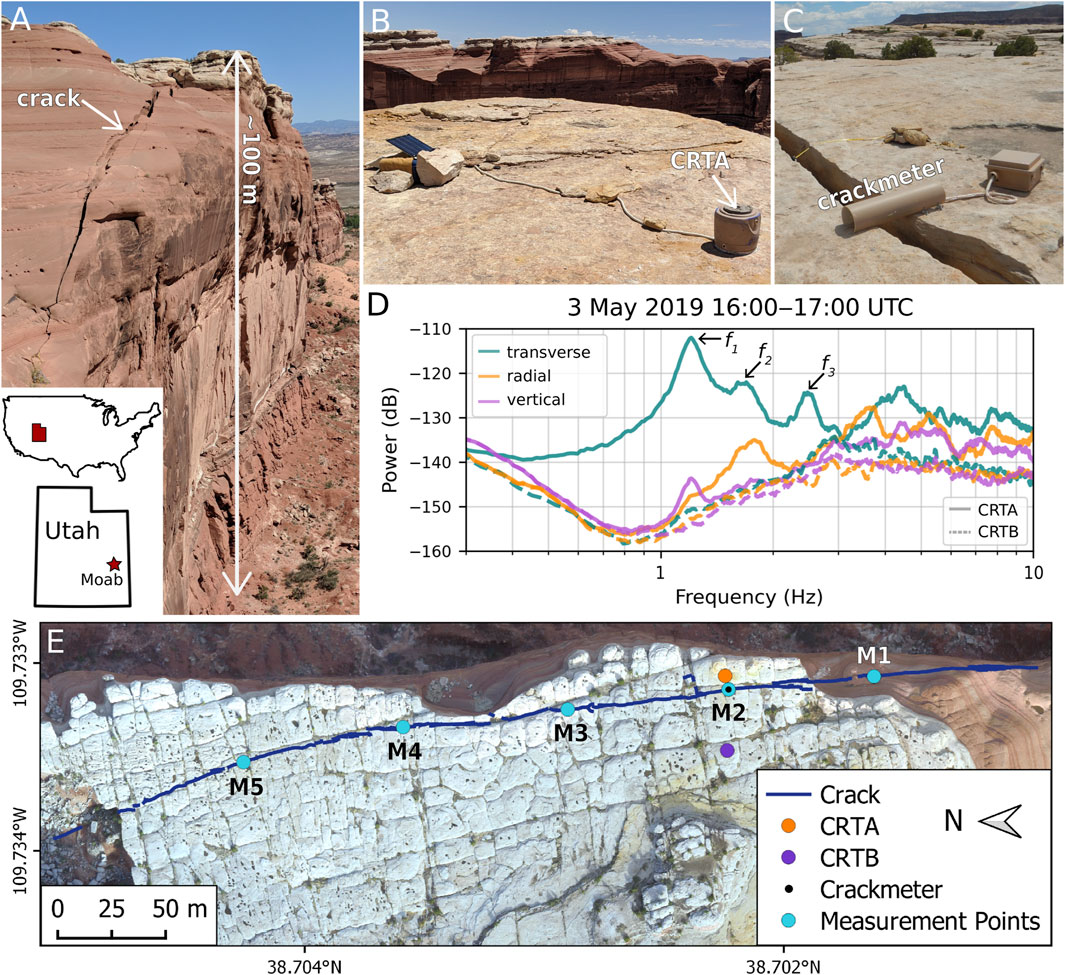
FIGURE 1. Overview of the Courthouse Mesa rock slope instability near Moab, Utah, USA. (A) View of the south end of the instability where the crack is exposed in Entrada Sandstone. Photos showing (B) broadband seismometer station CRTA on the instability, and (C) the vibrating wire extensometer used to measure crack aperture. (D) Power spectral density plots from CRTA and reference station CRTB from 3 May 2019 showing the first three resonance frequencies (f1, f2, and f3) of the instability. Decibel powers are relative to 1 m2 s-4 Hz-1. (E) Drone-based orthophoto showing the mapped crack trace (blue line) and locations of CRTA (orange circle), CRTB (purple circle), crackmeter (small black circle), and measurement points M1–M5 (blue circles). The crackmeter is co-located with M2.
We instrumented the instability at Courthouse Mesa with a three-component Trillium Compact 20 s seismometer (station code CRTA; Figures 1B,E) coupled with a 24-bit Centaur data logger, and a Durham Geo Slope Indicator (DGSI) vibrating wire extensometer (crackmeter; Figures 1C,E). CRTA collected continuous ambient vibration data at a sampling rate of 100 Hz for 3 years between 12 October 2018 and 11 October 2021. Data are available in Moore (2013). Crack aperture data were sampled at 30-min intervals for 4 years between 28 May 2018 and 27 May 2022. Data are available in Jensen et al. (2023). Here, we focus on the 3-year period when both instruments were operational but include the full crackmeter record for completeness. The crackmeter had a measurement range of 100 mm and was set with an initial opening of 15 mm. Initial crack aperture on 28 May 2018 was 250 mm. Both instruments were installed ∼180 m from the south end of the crack in a safe and easily accessible area (Figure 1E). CRTA collected nearly continuous data, with only minor interruptions due to intermittent power losses during winter and damage sustained by a storm in June 2020. The longest period with inconsistent data coverage occurred between 31 December 2019 and 27 January 2020, when prolonged cloudy conditions caused power losses resulting in 286 h of missing data. Otherwise, data gaps were minimal and occurred only briefly on 20 January 2019 (23 h of missing data), 6–7 June 2020 (40 h of missing data), and between 3 and 4 January 2021 (25 h of missing data). Crack aperture data had no gaps during the monitoring period. Between October 2018 and May 2019, we deployed a second three-component Trillium Compact 20 s seismometer (station code CRTB) on the stable, west side of the crack (∼40 m away from CRTA) as a local reference (Figure 1E). CRTB also suffered from intermittent data gaps due to power losses during the winter of 2018–2019. In addition to continuous surface displacement data from the crackmeter (co-located with M2), we conducted 15 repeated crack width measurements over the 4-year monitoring period at five locations along the crack (labeled M1–M5) using a tape measure (±2 mm precision) to assess differences in the magnitude of crack aperture changes across the site (Figure 1E).
We processed ambient vibration data to identify resonance frequencies of the rock slope instability using procedures outlined by Geimer et al. (2020) and Moore et al. (2016). We first removed the mean, linear trend, and instrument response, and rotated horizontal components to transverse (perpendicular) and radial (parallel) directions with respect to the crack trace azimuth of 355° (Bessette-Kirton et al., 2022). We estimated the power spectral density (PSD) of acceleration for each component by calculating fast Fourier transforms of 80-s Hanning-tapered windows with 80% overlap and averaged the PSD to reduce variance (e.g., Koper and Burlacu, 2015). We identified peaks in the resulting spectra corresponding to vibrational modes of the instability. Subsequently, following methods outlined by Geimer et al. (2022), we used the random decrement technique (Cole, 1973; Ibrahim, 1977; Asmussen and Brincker, 1998) to track resonance frequencies and corresponding damping values in 30-min intervals over the monitoring period. We used the transverse component to track the frequency of the first resonance mode (f1) and the radial component to track the frequency of the second resonance mode (f2).
We also used frequency-dependent polarization analysis to identify changes in modal properties during monitoring. We implemented a modified version of the Noise Toolkit (IRIS DMC, 2015; following Koper and Hawley, 2010) to perform polarization analysis using CRTA data down-sampled to 20 Hz. We processed data in 15-min intervals and divided each block into 20 sub-windows with 50% overlap. We tracked polarization azimuth in the horizontal plane (clockwise, degrees from magnetic north), incidence angle (degrees from vertical), and degree of polarization (dimensionless, ranging from 0 to 1) for f1 by following the frequency with the highest horizontal east-west component power between 0.5–2 Hz. Together, azimuth and incidence describe the particle motion vector at a specified frequency, and the degree of polarization describes the extent to which ground motion is organized (Koper and Hawley, 2010).
To evaluate changes in frequency and displacement with respect to meteorological conditions, we used air temperature and weather records from the Canyonlands Field Airport (mesowest.utah.edu; station KCNY), which is located 5 km north of Courthouse Mesa at a similar elevation. Short-term (296 days) surface air temperature measurements conducted near monitoring point M2 between June 2020–April 2021 confirmed that on-site air temperatures were consistent with those recorded at KCNY. We analyzed hourly data from KCNY, which included air temperature measurements, precipitation, wind speed, relative humidity, dew point, and qualitative weather descriptions (e.g., clear, overcast, rain, mist, thunderstorm). Since over 30 weather descriptions were used during our monitoring period, we grouped similar descriptions into four main categories: clear, cloudy, rain, and snow (see Supplementary Text S1 for details). Data from KCNY are nearly complete, with only 222 missing hourly data records (0.6% of the total) for the 4 years between 28 May 2018 and 27 May 2022. For data gaps consisting of a single hour, we linearly interpolated between adjacent air temperature values to fill in the missing data. Data gaps longer than 1 hour were not interpolated. We also measured air temperatures at the surface of the crack (data generated by the crackmeter instrument), as well as inside the crack at depths of 2 m (October 2018 to May 2020 and April 2021 to February 2022) and 40 m (May 2020 to April 2021) to compare with surface air temperatures (Supplementary Figure S1; data available in Jensen et al., 2023).
We assessed annual and daily variations in air temperature and compared these with frequency, damping, polarization azimuth, and crack aperture changes on multiple timescales. We evaluated annual trends using daily average air temperature values and assessed daily relationships using hourly data to calculate temperature regressions for 2-day moving windows with 50% overlap throughout the monitoring period. Subsequently, we removed daily trends and calculated the remaining or residual values to assess relationships between frequency with respect to additional meteorological parameters (precipitation, relative humidity, dew point, wind speed, and weather descriptions). Since annual variations in frequency and crack aperture are large, we calculated residuals as a fraction of the actual value on a given day to remove bias from seasonal magnitude differences.
We performed finite element modeling in COMSOL Multiphysics (comsol.com) to simulate 1) permanent or irreversible crack aperture changes due to crack propagation at depth, and 2) reversible, thermally driven crack aperture variations. For these analyses, we used an existing 3D model of the Courthouse Mesa instability (Bessette-Kirton et al., 2021; see diagram in Figure 6A). Boundary conditions (i.e., spatial variability in crack depth) for this model were previously calibrated by comparing resonance frequencies and mode shapes for the first five modes from numerical and field analyses (Bessette-Kirton et al., 2022). We did not perform further modal analyses in this study. Our model only encompasses the unstable slab and does not include the stable side of the mesa, thus field-derived crack aperture changes are equivalent to the relative crack-perpendicular displacement of the slab at the location of the crackmeter (M2; Figure 6A). Following Bessette-Kirton et al. (2022), we assumed uniform material properties across the instability, applying a density of 2,200 kg/m3, Young’s modulus of 5 GPa, and a Poisson’s ratio of 0.2. To measure resonance frequencies and polarization azimuth of the instability under varying conditions, we performed eigenfrequency analysis with no applied excitation or loads, whereas to record relative displacement (equivalent to crack aperture), we used static analysis including gravitational loading.
For the irreversible crack change model, we built off the instability boundary conditions obtained by Bessette-Kirton et al. (2022) and used simple tests to simulate permanent crack propagation. Starting from boundary conditions with a depth of ∼40–55 m in the middle and southern portions of the crack, we calculated frequency and displacement changes for increases in crack depth of up to 12 m in the middle and southern areas of the instability. The change of 12 m was selected based on the setup of the previous model. The model boundary corresponding to the crack surface is composed of several boundary boxes that can be set as fixed or free to reproduce variations in crack depth. In these simulations, the alteration of boundary areas mimics the breakage of rock bridges and subsequent crack propagation at depth along different portions of the crack. We simulated nine different scenarios with varying crack depth changes. For each scenario, we obtained frequency values for f1 and f2, polarization azimuth values for f1, and crack-perpendicular surface displacement (maximum and at M2).
Subsequently, we used the previously developed 3D model of the Courthouse Mesa instability to conduct simplified conceptual simulations of transient temperature-driven crack opening to compare with field monitoring data. For thermomechanical modeling, we implemented the following parameters for sandstone: coefficient of thermal expansion = 2E-5 K−1, heat capacity = 850 Jkg-1K−1, and thermal conductivity = 2.9 Wm-1K−1 (Costain and Wright, 1973; as applied in Geimer et al., 2022). To simulate the effect of annual temperature changes, we applied an annual sinusoidal temperature change of 30°C with a mean of 15°C to all non-fixed exterior model boundaries (not including the interior of the crack). Because this model was intended to be a conceptual comparison with annual-scale field observations, we only used this simple input, but acknowledge that a more complete model could include representations of radiative and convective heat fluxes (Guillemot et al., 2022) or complex material behavior such as a temperature-dependent elastic modulus (Geimer et al., 2022). After running the model for 1 year to accommodate the new transient thermal boundary condition, we recorded annual surface displacements (corresponding to crack aperture measurements) at 1-week intervals in locations corresponding to monitoring points M1–M5 (Figure 1A; Figure 6A).
Spectral analysis of data from CRTA revealed at least the first three resonance frequencies of the Courthouse Mesa instability, each of which does not appear on spectra from CRTB (Figure 1D). These were described in detail by Bessette-Kirton et al. (2022). Here, we focus only on the first two resonance frequencies (f1 and f2) since consistently tracking higher order modes throughout the 3-year monitoring period proved difficult, likely due to the positioning of CRTA with respect to relative modal displacements. Frequency tracking at Courthouse Mesa showed that the first two resonance frequencies varied annually by 29% of the mean (f1 ∼ 1.2 ± 0.34 Hz and f2 ∼ 1.7 ± 0.5 Hz; Figure 2A; Supplementary Figure S2). When normalizing by the annual average, f1 and f2 vary nearly identically throughout the monitoring period (Supplementary Figure S2). We note that some observable differences in the magnitude of daily frequency changes are likely due to difficulties in tracking the less-prominent peak associated with f2. Because of the uncertainties associated with f2, we did not track damping or polarization for this mode. In addition to large annual changes, we observed daily and multi-day frequency fluctuations. The average daily frequency range for f1 was 6.5% or ∼0.07 Hz, with maximum daily deviations of nearly 16% (∼0.17 Hz). Generally, daily frequency ranges were smallest during the period of decreasing annual frequency in fall and winter, and largest during the spring as frequencies rose (Figure 2A). Intermittent frequency drops caused changes of up to 10% during consecutive days, with decreases as large as 14% over the span of 2–3 days. Despite large annual and inter-annual fluctuations, we did not conclusively observe any long-term, permanent frequency change during the monitoring period (Figure 3A).
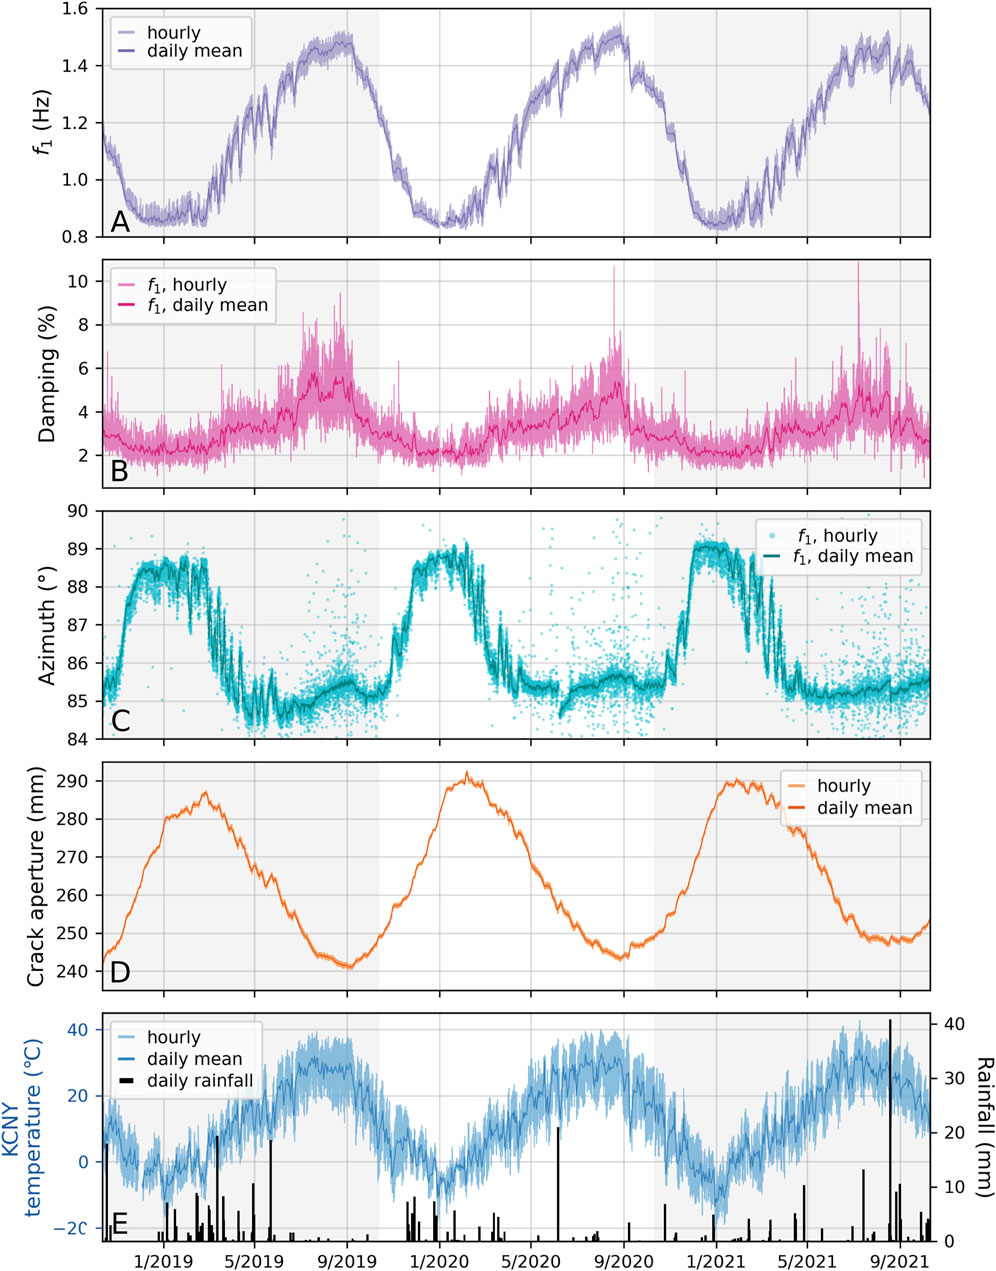
FIGURE 2. Monitoring data from the Courthouse Mesa rock slope instability between October 2018 and October 2021. (A) Time series of the first resonance frequency (f1) showing hourly measurements in light purple and daily mean frequency in dark purple. (B) Hourly (light pink) and daily mean (dark pink) damping values for f1. (C) Polarization azimuth of f1 (relative to magnetic north) showing hourly (light blue) and daily mean (dark blue) measurements. (D) Hourly (light orange) and daily mean (dark orange) crack aperture measured by the crackmeter (Figures 1C,E). (E) Hourly (light blue) and daily mean (dark blue) air temperatures recorded at weather station KCNY (located 5 km north of Courthouse Mesa). Daily precipitation recorded at KCNY is shown with black bars. Gray shading highlights yearly intervals of monitoring.
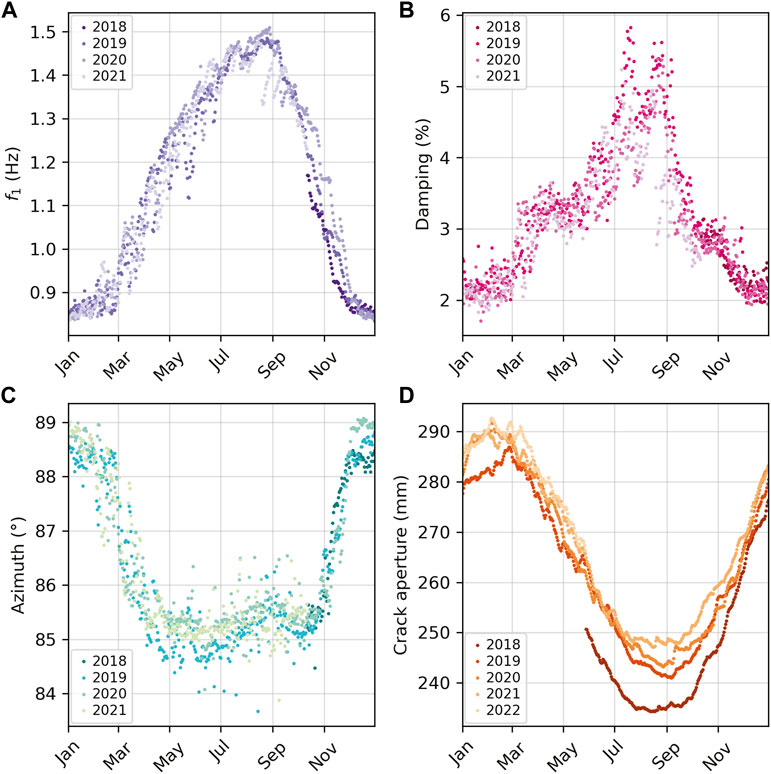
FIGURE 3. Yearly variability of daily mean (A) first resonance frequency (f1), (B) damping for f1, (C) polarization azimuth of f1, and (D) crack aperture. f1, damping, and azimuth data span the 3-year period between October 2018 and October 2021. The full 4 years of crackmeter data (May 2018–May 2022) are shown.
We tracked damping and polarization attributes for f1 throughout the monitoring period. Damping varied between 2% and 8%, with no apparent long-term changes (Figure 2B; Figure 3B). In general, damping was highest during the summer and lowest during the winter. Polarization analysis indicated that modal deflection at f1 is highly polarized (Figure 2C; Figure 3C). The degree of polarization was near unity during winter and spring, with slightly more scatter during summer and fall (0.98–1; Supplementary Figure S3). We observed annual variations in f1 azimuth of about ±2.5° (84°–89° with respect to magnetic north; Figure 2C), with changes in incidence of ±1° (87°–89°; Supplementary Figure S3). Azimuth and incidence showed no conclusive permanent change during monitoring (Figure 3C; Supplementary Figure S3).
Crack aperture data from the crackmeter (at location M2) showed ∼50 mm of seasonal displacement with crack aperture ranging from 234 to 247 mm in summer (crack is most closed) to 287–293 mm in winter (crack is most open; Figure 2D; Figure 3D). Daily crackmeter amplitudes ranged from 0.2 to 2.8 mm. As shown in Figure 3D, minimum crack aperture increased by 2–7 mm/year between consecutive summers, with the largest annual increase in opening of ∼7 mm between 2018 and 2019 (beginning prior to the initiation of resonance frequency monitoring) and smaller changes of 2 and 4 mm in the following years. In contrast, wintertime maximum crack apertures did not follow the same trend, with a ∼5 mm increase between 2019 and 2020 but less noticeable changes during the following years. Periodic measurements at monitoring points M1–M5 revealed differences in the amplitude of crack opening between the south end of the instability where the crack is widest (M1; Figure 1A) and the north end of the instability where the crack is narrowest (M5). These measurements were taken on 15 discrete dates and thus, do not necessarily capture the absolute minimum and maximum crack apertures during the monitoring period. Differences between summer aperture minima and winter aperture maxima (which reflect a minimum possible annual crack aperture amplitude) revealed 58 mm of opening at M1 with only 11 mm at M5 (Supplementary Figure S4). Measurements at M2 showed 43 mm of seasonal opening, which is consistent with, although slightly less than continuous data from the crackmeter due to the constraints of intermittent measurements.
Frequency changes strongly correlate with air temperature (Figure 4A). Although the overall correlation between daily average first resonance frequency and daily average air temperature showed a clear positive correlation (R2 = 0.92), we observed variable temperature-driven frequency behavior seasonally. During spring and fall, frequency tracked closely with temperature, as shown by the consistent positive slope of the temperature-frequency curve. However, the daily and multi-day temperature sensitivities varied. During the spring, frequency closely followed intermittent, multi-day temperature changes (many of which were associated with rainfall), whereas, in the fall, frequency did not consistently follow short-term temperature changes. This pattern is expressed by seasonal differences in scatter from the annual temperature-frequency regression (Figure 4A). During winter, frequency was also notably less-sensitive to temperature, as demonstrated by the flattening of the frequency-temperature curve when temperatures were below ∼0°C. We used a sigmoid curve (Figure 4A) to subtract the predicted temperature-dependent frequency trend from measured values. The resulting residuals (as a fraction of measured frequency) showed a repeating annual pattern but no overall increase (Supplementary Figure S5).
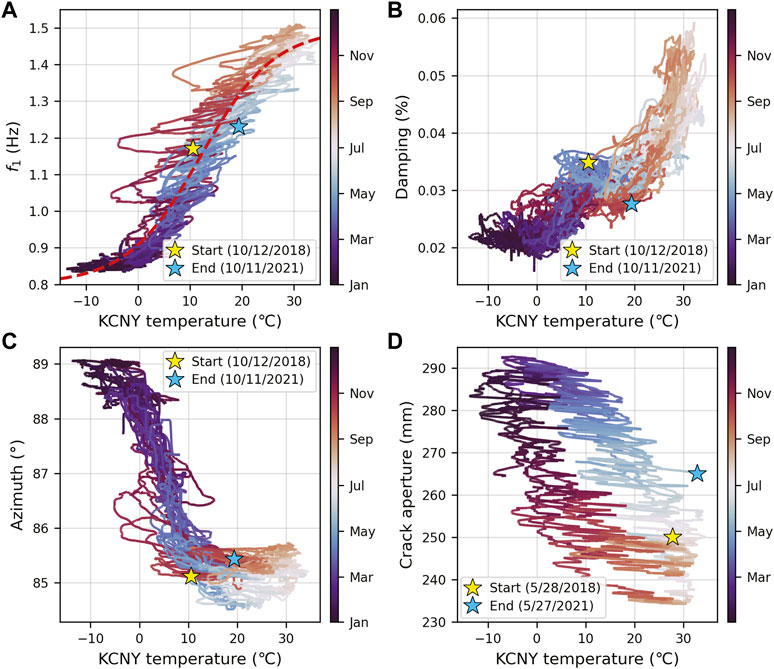
FIGURE 4. Air temperature from weather station KCNY compared with (A) first resonance frequency (f1), (B) damping for f1, (C) polarization azimuth of f1, and (D) crack aperture. The sigmoid curve for f1 as a function of temperature is shown in red (A). The full 4 years of crackmeter data (May 2018–May 2022) are shown.
Examination of hourly data showed that frequency also responds directly to temperature on a daily timescale (e.g., Figure 5A). Calculation of daily temperature-frequency regressions (e.g., Figure 5B) throughout the monitoring period showed strong linear correlations during the spring, summer and fall, with less consistent correlations during winter (Supplementary Figure S6). Overall, the median coefficient of determination (R2) for daily temperature-frequency linear correlations was 0.77. In addition, the slope of daily regressions followed a consistent annual pattern in which frequency sensitivities were highest during winter and spring and lowest during summer and fall (Figure 5C). The low sensitivity of frequency to temperature during fall is consistent with the observation that frequency is also less responsive to multi-day temperature changes during this period. Daily intercept is driven by temperature and mirrors the overall annual temperature-frequency trend. In comparison to residuals from the annual temperature-frequency regression (using daily average data), the residuals from daily linear regressions (using hourly data) were an order of magnitude smaller, with an overall range of −0.05–0.03 (Supplementary Figure S5).
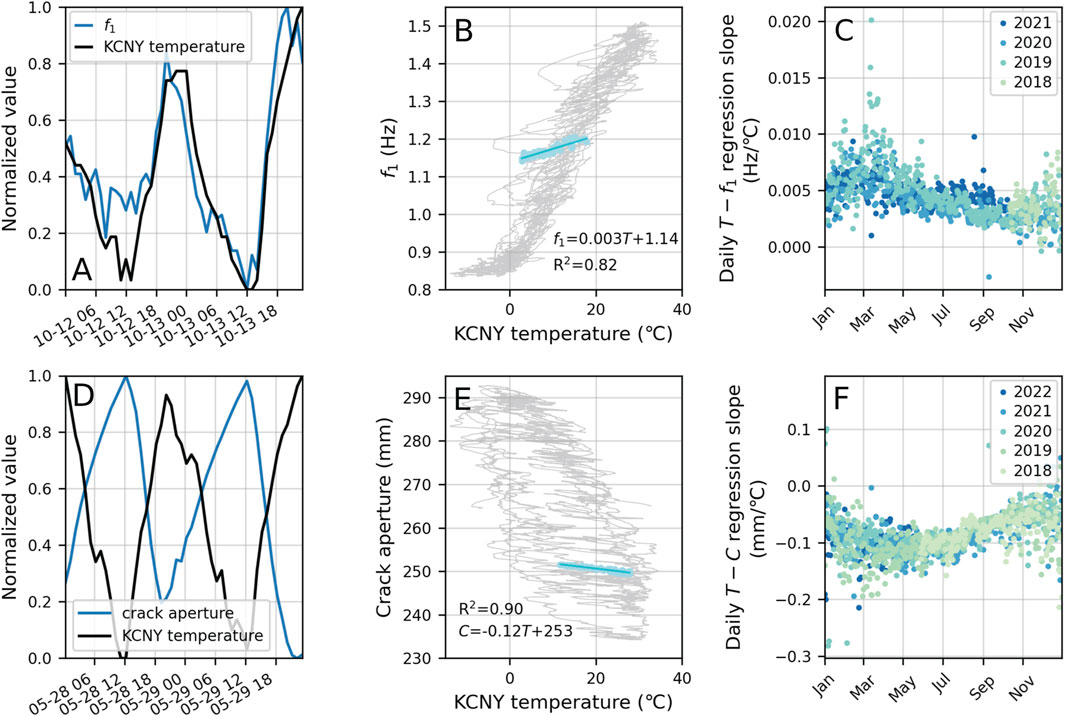
FIGURE 5. (A) Example 2-day time window of normalized hourly frequency (f1; blue) and air temperature (T; black) data used to calculate (B) daily temperature-frequency regressions using 2-day moving windows with 50% overlap (light blue circles and line). (C) Yearly variation in the slope of daily temperature-frequency regressions between October 2018 and October 2021. (D) Example 2-day time window of normalized hourly crack aperture (C; blue) and air temperature (black) used to calculate (E) daily temperature-frequency regressions using 2-day moving windows with 50% overlap (light blue circles and line). (F) Yearly variation in the slope of daily temperature-crack aperture linear regressions between May 2018 and May 2022.
We compared residuals from daily temperature regressions with precipitation, relative humidity, dew point, wind speed, and categorical weather descriptions to examine the effects of precipitation and other meteorological parameters on frequency. We found no substantial correlations between detrended frequency (i.e., residuals) and any meteorological variable (Supplementary Figure S7). However, daily frequency residuals were typically largest (most scattered around zero) during periods with categorical weather descriptions related to rain, snow, or cloudiness (see Supplementary Text S1; Supplementary Figure S7). Examination of the 25 largest storm events with >5 mm of accumulated precipitation showed variable frequency responses. The three largest storms recorded during the monitoring period, with precipitation totals between 19 and 45 mm in 24 h, all showed negative residuals, indicating that frequencies decreased more than predicted by temperature change alone (Supplementary Figure S8). In contrast, we observed no effect on frequency during other similarly sized storms. We also observed that several wintertime precipitation events during near or below-freezing periods resulted in positive frequency residuals (Supplementary Figure S8).
As with frequency, we found that damping was generally positively correlated with air temperature, although the relationship varied seasonally and was flat or slightly inverted at times (Figure 4B). Examination of daily temperature-damping relations showed generally poor correlations (R2 < 0.2) during most of the year, with moderately strong positive linear relationships (maximum R2 values of 0.8) during the months of July through September (Supplementary Figure S6). The relationship between damping and crack aperture shows that damping was highest when crack aperture was smallest (during late summer and fall) and lowest when crack aperture was largest (Supplementary Figure S9).
Annually, azimuth was inversely correlated with temperature (Figure 4C) and daily temperature-azimuth relations showed relatively strong (R2 = 0.6–0.9) inverse correlations during winter and early spring, corresponding to the time of year when azimuth values and the degree of polarization were greatest (Figure 2C; Supplementary Figure S3). Azimuth was also positively correlated with crack opening following a hysteretic loop (Supplementary Figure S9F). We found that azimuth tracked closely with damping during winter and spring, with damping values steadily increasing as azimuth varied from 89° to 86° (Supplementary Figure S9D). During summer, azimuth reached a low of ∼84.5° and damping values ranged from 3% to 6% (Supplementary Figure S9D).
Crack opening was inversely correlated with air temperature, with maximum crack apertures corresponding to minimum temperatures (Figure 4D). In addition, maximum annual crack opening was not directly in-phase with minimum wintertime temperatures. We assessed the phase shift between daily average temperature and displacement by maximizing the correlation for time lags ranging from 15 to 45 days based on initial guesses from the observed time series (Figure 2D). We found that daily average crack aperture is most strongly correlated with temperature values from 37 days prior (Supplementary Figure S10). We used the annual aperture-temperature regression with a 37-day phase shift to remove the effects of thermally driven signals from observed crack opening (Supplementary Figure S5B). This revealed an increase in net opening of 2.7 mm/year over the 3-year monitoring period during which both frequency and crackmeter data were collected (3.1 mm/year over the full 4 years of crackmeter data).
In contrast to the phase-shifted annual trend of crack opening, daily opening (derived from hourly data) was in-phase with temperature and shows a clear inverse correlation (Figures 5D,E). Daily temperature-aperture slope values vary annually, with the lowest (most negative) values during summer and the highest (closest to zero) values during winter (Figure 5F). Daily temperature-crack aperture regressions were most correlated during spring, summer, and fall, with generally low R2 values during the winter (Supplementary Figure S6D). Residuals resulting from the removal of the daily thermal response were generally an order of magnitude smaller than annual residuals and showed an annual pattern with increasing scatter over the monitoring period (Supplementary Figure S5B).
Conceptual finite element modeling of the Courthouse Mesa instability enabled quantification of changes to modal parameters and crack aperture with simulated progressive failure (i.e., increased crack depth). Results of eigenfrequency modeling with variable crack depths (Figure 6A; Supplementary Figure S11) showed that the magnitude of relative frequency change was generally correlated with the amount (i.e., the area of freed boundary boxes) and location of crack propagation. Generally, larger frequency changes were associated with crack propagation in the middle and southern regions of the instability. Scenarios with 12 m of downward crack propagation in any of the middle and southern regions resulted in frequency decreases ranging from 15%–37% and 5%–30% for modes f1 and f2, respectively (Figures 6B,C; Supplementary Table S1). The maximum observed frequency changes for f1 and f2 were ∼0.6 Hz and ∼0.7 Hz, respectively. The overall median frequency decrease for f1 was 28% (∼0.5 Hz), with reductions of 15% or less for scenarios with only crack propagation on the north end of the slab (Figure 6B). In comparison, changes in polarization azimuth for f1 were relatively small, varying by ±3% (less than 3°; Supplementary Table S1). Although these changes were small compared to corresponding frequency changes, we observed increases in azimuth for changes at the south end of the crack and decreases in azimuth for changes toward the north end. Changes in surface crack displacement at M2, expressed as a percentage of corresponding displacement prior to damage, ranged from an increase of 13% to a decrease of 7% (Figure 6D; Supplementary Table S1). For some models, surface displacement at M2 decreased even though maximum displacement increased elsewhere because displacement became more concentrated toward the south end of the crack (Figure 6E). Maximum displacements decreased only for scenarios in which crack depths increased at the northernmost boundaries (Figure 6E).
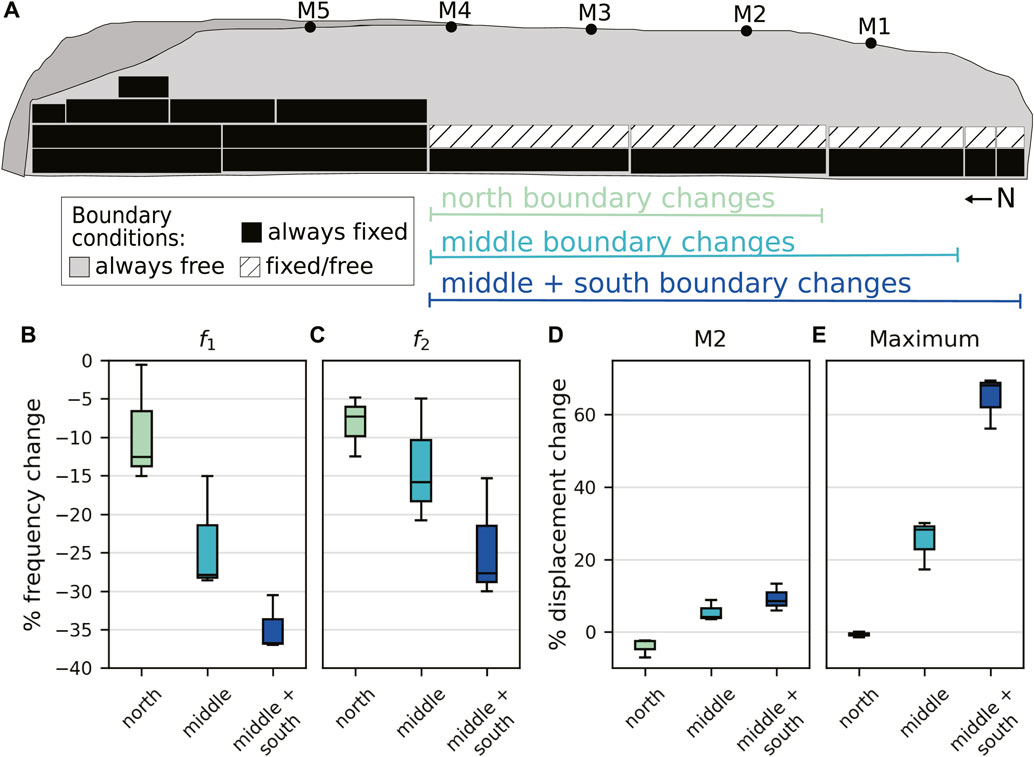
FIGURE 6. Results of crack depth change models in COMSOL. (A) Schematic diagram of the Courthouse Mesa instability 3D finite element model showing the inside of the crack and the boundary boxes that can be set as fixed or free to simulate variations in crack depth. Results from finite element models showing relative (B) first (f1) and (C) second (f2) resonance frequency and (D, E) crack-perpendicular displacement changes for varying boundary condition changes in the north (light green), middle (light blue), and middle + south (dark blue) areas of the slab. M2 displacement is measured at the location of the crackmeter (shown in part A) and corresponds to crack opening. See Supplementary Figure S11 for detailed boundary conditions for each model.
Simplified thermomechanical finite element models showed that reversible crack aperture changes (measured as displacement at the crack surface) along the rear boundary of the Courthouse Mesa instability were inversely correlated with temperature and lag annual temperature changes. At M2, maximum displacements followed minimum temperatures by 5 weeks (∼35 days; Figures 7A,B), demonstrating a close match with our observed time lag of 37 days (Figure 2D; Figure 4D). The relative amplitudes of aperture change at locations corresponding to M1, M2, and M5 were consistent with amplitudes from field data (Figure 7C), whereas modeled amplitudes at M3 and M4 were nearly 1.5 to 2 times larger than those observed in the field. The lack of match at M3 and M4 could be due to inaccuracies in the model geometry or boundary conditions in this area. Furthermore, field measurements represent a minimum possible annual amplitude since they do not necessarily capture absolute minimum and maximum apertures. At M2, model results yielded a peak-to-peak annual amplitude of 37 mm, whereas the crackmeter showed an annual amplitude of 50 mm (Figure 7C). However, the numerical model only accounts for thermal expansion and contraction of the unstable side of the crack (since it does not include the stable side of the mesa), whereas the crackmeter measured total crack aperture. A simplified block test simulating the stable side of the mesa showed that an additional ∼14 mm of annual displacement is possible, yielding a total displacement of 51 mm, very close to our measured value. The thermomechanical model also indicated that stress changes, particularly those at the toe of the cliff face where rock is under compression from slab bending, are directly correlated and in-phase with temperature (Supplementary Figure S12).
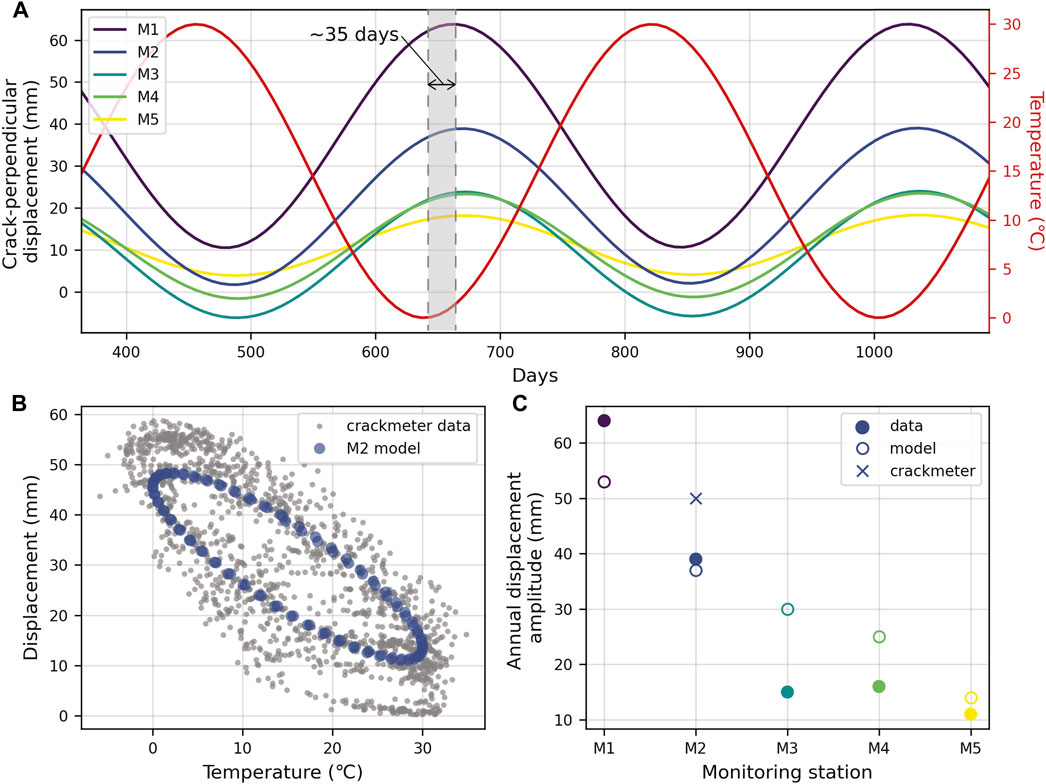
FIGURE 7. Results of thermomechanical COMSOL modeling. (A) Modeled crack-perpendicular displacement at monitoring points M1–M5 (Figure 1E) compared with the applied temperature input (red). Maximum surface displacements lag minimum temperatures by ∼35 days. (B) Scatter plot showing temperature versus modeled surface displacements at M2 compared to crackmeter aperture data (Figure 2D; Figure 4D). Model results are shifted to match the mean displacement of measured data. (C) Amplitude of modeled annual displacements and measured crack apertures (see Supplementary Figure S4) at monitoring points M1–M5 (locations shown in Figure 6A) and the crackmeter.
Three years of continuous monitoring at Courthouse Mesa showed no detectable irreversible changes in modal parameters despite crack aperture data during the same period indicating 2–4 mm/year of opening in summer and more ambiguous changes in winter. Resonance frequencies were positively correlated and in-phase with temperature changes. In contrast, crack aperture was inversely correlated with temperature and annually lagged air temperatures by ∼37 days. Correlations between other modal parameters and air temperature were less obvious, with annual variations in damping positively correlated with temperature, and azimuth generally inversely correlated with temperature. Daily frequency and crack aperture variations were linearly correlated and in-phase with air temperature throughout the year, whereas daily damping and polarization azimuth were only correlated with air temperature during specific times of the year; damping in summer and azimuth in winter. Here we discuss the physical mechanisms contributing to observed modal parameter and displacement behavior and synthesize the results of 3D finite element modeling within the context of field monitoring data. Finally, we discuss the utility of modal parameter tracking as a complement to displacement monitoring and considerations for change-detection monitoring.
Seasonal resonance frequency variations at the Courthouse Mesa slope instability correlate directly with temperature. Past studies have attributed such positive correlations to thermal expansion during heating, which drives increased grain contact stresses, as well as the closure of microcracks and the main fracture, together increasing material and fracture stiffness, and vice versa (Bottelin et al., 2013b; Starr et al., 2015; Burjánek et al., 2018; Colombero et al., 2018; Colombero et al., 2021b; Geimer et al., 2022; Guillemot et al., 2022). Colombero et al. (2021b) invoke these mechanisms to explain the thermally driven frequency response of several previously published case studies and differentiate between “surface” and “fracture” effects. The surface effect involves increased grain contact stresses and the closure of microcracks near the surface. This causes differential dilation and the formation of internal stresses between the surface and the remainder of the bulk rock mass, inducing a confining pressure on the exterior shell of the rock (Colombero et al., 2021b). This effect typically occurs without delay and is thought to be more effective on the daily scale, whereas the fracture effect is more often attributed to seasonal frequency variations. The fracture effect involves thermally driven closure of fractures, causing an increase in fracture contact stiffness. This effect has been invoked to explain both daily and annual frequency changes and is often associated with time delays of ∼30–60 days (Colombero et al., 2018; Colombero et al., 2021b; Häusler et al., 2021b).
At Courthouse Mesa, annual frequency changes occurred without a time delay relative to temperature. This result corresponds with thermomechanical modeling results showing that thermally driven stress changes are correlated and in-phase with temperature (Supplementary Figure S12), supporting the surface effect as a primary control on annual frequency behavior. Daily frequency variations are also linearly correlated with temperature and occur without delay. We attribute these fluctuations to the same physical mechanism invoked for annual changes but infer that they are primarily superficial (e.g., ∼0.5 m; Guillemot et al., 2022). Variability in daily time lags across sites has also been attributed to the timing of different heat sources (radiative versus convective) and the site’s orientation relative to the sun (Guillemot et al., 2022). At Courthouse Mesa, the east-facing wall of the instability receives direct sunlight in the morning, which may contribute to the immediate daily frequency response. The effect of solar radiation may also help explain our observation that the daily frequency response is less well-described by hourly temperature during winter and spring when cloudy periods are more frequent (Supplementary Figure S7). In comparison to other sites, our observed daily frequency variations were about twice as large (29% or ±0.5 Hz), whereas daily variations were of similar magnitude (6.5% or ±0.07 Hz) (Colombero et al., 2021b). The presence of pre-existing compressional stresses at the cliff toe due to the overhanging slab geometry, or large annual temperature swings (∼45°C) and the influence of solar radiation in this high-desert environment, could help explain the magnitude of annual frequency changes at this site.
We observed variable frequency responses to precipitation (Supplementary Figures S7,S8), differing from previous studies that demonstrated a consistent frequency decrease following rainfall (e.g., Geimer et al., 2022). Additionally, we observed a flattening of the temperature-frequency response for T <0°C, in contrast to past observations of increasing frequencies associated with ice formation during freezing periods at unstable rock slopes (Bottelin et al., 2013b; Burjánek et al., 2018; Weber et al., 2018; Häusler et al., 2021b; Geimer et al., 2022). Because the crack at Courthouse Mesa is so deep (up to 70 m), temperatures at the bottom remain well above freezing year-round, preventing accumulation of ice in the main fracture. Whereas ice formation in surficial pores and microcracks may contribute to frequency variations, the overall effect may be minimized compared to other sites. Humidity increases have also been shown to cause decreases in fracture toughness and accordingly crack growth resistance (e.g., Nara et al., 2012) and may also play an important role at this site.
Multiple years of monitoring data revealed a consistent contrast in the thermal sensitivity of frequency during spring and fall, corresponding to observed differences in site-specific temperature datasets. In comparison to KCNY air temperatures, air temperatures recorded at the surface (crackmeter) and at 2 m inside the crack were typically warmer between September and March and cooler during the rest of the year (Supplementary Figure S1). This corresponds with air temperature measurements from a depth of ∼40 m inside the crack, which showed an average air temperature of 11.4°C, with minimum and maximum values of 7.8°C and 13.3°C, respectively (Supplementary Figure S1). In contrast to surface temperatures ranging from −10°C–35°C, deep crack air temperatures only varied by 5.5°C; in turn, the crack holds relatively warm air during winter and relatively cool air during summer. The presence of warm air venting from the crack during winter corresponds with the results of a thermal infrared survey (Bessette-Kirton et al., 2022) showing distinct pockets of warm air rising along the southern half of the instability. We hypothesize that this behavior is less prevalent during periods of similar ambient temperatures during spring due to the prevalence of intermittent storms, compared to typical prolonged dry periods during fall (e.g., Supplementary Figure S7). Fall periods, when interior crack air temperatures were greater than ambient air temperatures, corresponded with times when frequency was less responsive to temperature (Figure 4A; Figure 5C). In addition, the annual pattern of large frequency residuals during fall showed that frequencies are greater than predicted based on daily mean temperature alone (Supplementary Figure S5). We hypothesize that the beginning of warm air venting may buffer the effect of decreasing ambient air temperatures, causing frequencies to remain higher than anticipated.
Although damping and polarization azimuth are also affected by seasonality, examination of seasonal patterns can offer additional insight into mechanical instability behavior (Colombero et al., 2018; Häusler et al., 2021b; Geimer et al., 2022). At Courthouse Mesa, we observed that damping was generally positively correlated with air temperature (Figure 4B). This finding contrasts with damping measurements at other sites, which found damping negatively correlated with temperature (Geimer et al., 2022). Previously, the negative correlation between temperature and damping at a natural rock arch was attributed to material damping accompanying thermal stress-stiffening (Geimer et al., 2022). In addition, patterns of seasonal damping at an unstable rock slope were attributed to moisture-driven changes in radiation damping due to material contrast effects (Häusler et al., 2021b). We attribute the positive correlation between damping and air temperature at Courthouse Mesa to geometry-dependent radiation damping whereby thermal expansion increases the contact area along the crack, in turn increasing the ease of energy dissipation from the instability into the stable mesa. This hypothesis is additionally supported by the negative correlation between damping and crack aperture since damping is highest when crack aperture is lowest and vice versa (Supplementary Figure S9). In addition to surface crack aperture, the correlation between damping and azimuth (Supplementary Figure S9) indicates that the 3D effects of crack closure, as indicated by seasonal variations in azimuth, may also impact crack contact area at depth, further contributing to damping changes.
Our monitoring data revealed a clear inverse correlation between crack opening and temperature. Seasonally, this correlation was out of phase with temperature, with a delay of ∼37 days. Conceptual thermoelastic numerical modeling confirmed the effect of lagged thermal diffusion on seasonal surface displacements (corresponding to crack opening), and results matched well with our observed time delay and the amplitude of opening at several monitoring points (Figure 7). The role of thermally induced stresses on cyclic fracture opening is well recognized (Got et al., 2010; Bakun-Mazor et al., 2013; Weber et al., 2017; Burjánek et al., 2018; Colombero et al., 2018; Mulas et al., 2020; Häusler et al., 2021b), yet the observation of variable timing between the annual cycles of frequency and crack aperture provides evidence for differences in driving mechanisms. Examining crack aperture and frequency data in tandem provides further support for the prevalence of the surface effect (Colombero et al., 2021b) dominating the seasonal frequency response at Courthouse Mesa. Crack aperture data reflect the opening and closing of the crack, providing evidence that if frequency was controlled by the fracture effect, a time delay in annual frequency-temperature behavior would also be present. Previous work attributing seasonal frequency changes to the fracture effect at a different site found an in-phase (although opposite) relationship between frequency and displacement (Colombero et al., 2018). Therefore, as hypothesized above, frequency changes are more likely driven primarily by stress changes resulting from the surface effect and are in-phase with seasonal temperatures. Conversely, annual crack aperture is driven by thermally induced displacements, which are affected by lagged thermal diffusion. In contrast to the variable timing in seasonal behavior, daily crack opening variations occur without delay, indicating that, like daily frequency changes, they are rooted in changes within the shallow outer surface of the rock slab.
During the first year of monitoring, we observed irreversible crack opening of 5–7 mm. In subsequent years, we consistently observed changes in minimum summertime crack aperture (2–4 mm), with less distinct changes in maximum wintertime aperture. We hypothesize that crack closure may be impeded by loose rock and debris falling into the crack, which prevents crack closure, but has a limited effect on the magnitude of crack opening. This mechanism, sometimes called “thermally induced wedging-ratcheting” (Bakun-Mazor et al., 2013; Pasten et al., 2015; Bakun-Mazor et al., 2020), can drive an increase in fracture opening over time. Thermal contraction on both sides of the crack during cooling causes the crack to widen, allowing for downward movement of infilled debris. Upon thermal expansion during warming, crack closure is impeded by debris, which can drive permanent fracture opening in a ratcheting manner. Repeat observations at Courthouse Mesa revealed areas where partially suspended rock blocks are no longer present and have likely fallen into the crack. Therefore, we hypothesize that the observed increase in minimum crack aperture resulted from debris accumulation inside the crack, which impeded crack closure but had no measurable impact on instability resonance during the period of paired monitoring datasets. We speculate that wedging-induced crack propagation would also cause maximum crack apertures to increase and frequency to decrease, and thus did not occur during the monitoring period. Without wedging, the cumulative effects of thermally induced stresses can also cause fracture propagation and corresponding irreversible changes in crack aperture and could play a role in future changes at the Courthouse Mesa site (Gunzburger et al., 2005; do Amaral Vargas et al., 2013; Collins and Stock, 2016).
Resonance frequency and crack aperture monitoring data spanning multiple annual cycles at the Courthouse Mesa instability revealed differences in each behavior. Assessing these attributes together aided our understanding of the physical mechanisms driving seasonal and long-term changes of the instability. Our field data provide evidence for annual frequency changes driven by internal stresses in the exterior shell of the rock (i.e., surface effect), in contrast to many past studies in which fracture stiffness changes are thought to primarily drive seasonal frequency behavior (Colombero et al., 2021b). Although crack aperture data revealed long-term changes in the absence of permanent frequency changes, finite element simulations of crack depth changes anticipated to accompany progressive failure showed larger and more consistent variations in frequency as compared to surface displacements at M2 (co-located with the crackmeter). These results indicate that frequency may be more responsive to fracture propagation at depth than crack opening measured at a single point, and frequency tracking could reveal irreversible changes from crack propagation more readily than aperture data. Our simulations also demonstrated that the location of crack propagation is critical to the frequency response (Figure 6). Although these results suggest advantages of frequency tracking, crack aperture or displacement monitoring is beneficial because data can be leveraged for time-to-failure predictions (Intrieri et al., 2019) using existing methods such as the inverse-velocity approach (Fukuzono, 1985; Rose and Hungr, 2007). Future monitoring at this site could shed light on the sensitivity of frequency to the gradual accumulation of irreversible displacements versus large step changes in crack opening. Changes in additional modal parameters such as damping and azimuth may be small compared to changes in modal frequency values, yet frequency-dependent polarization and damping tracking can help analyze instability changes in 3D, providing further detail on possible site characteristics.
Modal parameter tracking and crack aperture or displacement monitoring are both influenced by environmentally driven changes on multiple time scales, complicating the identification of permanent changes. At this site, observed daily (6.5%) and annual (29%) frequency changes for f1 are within the range of irreversible changes indicated by finite element simulations. Likewise, observed annual crack aperture variations (9% of annual average) are within the range of observed changes from finite element modeling. Azimuth changes observed from finite element modeling were generally smaller than frequency and crack displacement changes, but they similarly fall in the range of observed seasonal variations at the Courthouse Mesa site. Although finite element modeling demonstrated that all three parameters are valuable for future change detection, the identification and differentiation of seasonal variations is critical. Our observations showed that these fluctuations were on the same order of magnitude as potential permanent changes, indicating that the magnitude, duration, and time of year (e.g., during a time of increasing or decreasing frequency) of irreversible changes will likely impact how readily they can be differentiated from environmentally driven signals. Even for a site like Courthouse Mesa, with minimal influences from other environmental parameters, detection of permanent structural changes from frequency monitoring may be limited due to the magnitude of seasonal changes. In practice, as few as 3–4 months of frequency data can adequately describe thermally driven frequency behavior but a complete understanding of seasonal patterns, including the impact of other meteorological factors and site-specific effects, may require years of data.
Select studies of unstable rock slopes have successfully demonstrated the use of statistical modeling and machine learning algorithms in automated detection of irreversible frequency changes during bolting reinforcement (Bottelin et al., 2017; Bottelin et al., 2021), and instability displacement (Weber et al., 2017; Mulas et al., 2020). Physics-based models can also be used to understand and subsequently remove environmental effects from monitoring data, producing empirically derived correlations for change detection (e.g., Cross et al., 2011; Geimer et al., 2022). These examples highlight avenues of future work focused on addressing challenges in change detection monitoring to improve implementation across diverse sites. The successful implementation of predictive frequency or displacement models needs to account for full annual cycles of thermally driven behavior, which has yet to be addressed for the resonance frequency of unstable rock slopes. In practice, the identification of a potentially hazardous instability may prompt new data acquisition, highlighting the need for simple approaches that can be trained on short periods of data (e.g., Bottelin et al., 2021). For this purpose, simple empirical models may be advantageous over more complex models, such as autoregressive or deep learning methods (Moser and Moaveni 2011; Laory et al., 2014), which rely on long datasets (multiple years) to successfully train a seasonal component. Another complication of such detection efforts is the need for steady state training datasets (i.e., without large long-term changes), which may not be available at sites instrumented after recognition of initial instability. Ultimately, site-specific factors may limit the detection of irreversible frequency or displacement changes, and a physical understanding of observed behavior is essential for damage-related change assessment. For example, we found that at Courthouse Mesa, frequency is best described with 2-day linear regressions, resulting in temperature-detrended frequency residuals generally within ±1.6% (95% confidence interval), which could be a target of future modeling efforts. Alongside conventional surface displacement data, resonance frequency monitoring with enhanced change-detection modeling could improve recognition of damage-induced changes at this and other rock slope instabilities.
We collected 3 years of nearly continuous resonance frequency and crack aperture monitoring data at the Courthouse Mesa rock slope instability to provide insight into environmentally driven behavior and stability of the toppling rock slab. Annually, the first resonance frequency ranged from 0.8 to 1.5 Hz, and crack aperture varied by ∼50 mm. We observed no net permanent change in resonance frequency and an average increase in crack aperture of 2.7 mm/year during accompanying frequency monitoring (3.1 mm/year total). Differences in the time-dependence of annual frequency and displacement highlight physical differences in the processes affecting the seasonality of each. In addition, comparison of frequency and displacement datasets supports thermally induced wedging-ratcheting as a mechanism causing the observed long-term changes in minimum crack aperture. Finite element modeling demonstrated that for the Courthouse Mesa instability, crack propagation at depth resulted in a consistent decrease in frequency, with the largest decreases for f1. In contrast, changes in crack aperture were inconsistent at a single point location. The absence of observed irreversible changes in resonance properties, including frequency, damping, and azimuth, therefore supports a lack of structural changes (i.e., crack propagation) at depth during the monitoring period. Our field observations and modeling results support using resonance frequency and displacement monitoring in tandem to aid the physical understanding of site mechanisms and long-term monitoring, and demonstrate the value of multi-parameter monitoring datasets from natural field laboratories.
The datasets presented in this study can be found in online repositories. The names of the repository/repositories and accession number(s) can be found below: https://doi.org/10.7914/SN/5P_2013 https://doi.org/10.7278/S50d-e0es-913n.
EJ: Conceptualization, Data curation, Formal Analysis, Investigation, Methodology, Resources, Visualization, Writing–original draft, Writing–review and editing. JM: Conceptualization, Data curation, Formal Analysis, Funding acquisition, Investigation, Methodology, Resources, Supervision, Visualization, Writing–review and editing. PG: Data curation, Investigation, Methodology, Resources, Visualization, Writing–review and editing. RF: Data curation, Investigation, Methodology, Resources, Writing–review and editing.
The author(s) declare that financial support was received for the research, authorship, and/or publication of this article. This study was funded by the National Science Foundation grants EAR-1831283 and CMMI-2150896 and a Geological Society of America Graduate Student Research Grant.
The authors thank Clayton Russell, Alex Dzubay, Cheng Tarng, Owen Jensen, Kayla Hall, and Oliver Moore for field assistance, and are especially grateful to Alex Sanchez who alerted us to instrument damage during a storm. This study benefited from previous investigators Janos Urai, Jeff Coe, and Rex Baum, who shared site observations and photos. Special thanks to Jeff Coe for introducing us to Courthouse Mesa. The authors thank Brian Collins for additional feedback that improved this work.
The authors declare that the research was conducted in the absence of any commercial or financial relationships that could be construed as a potential conflict of interest.
All claims expressed in this article are solely those of the authors and do not necessarily represent those of their affiliated organizations, or those of the publisher, the editors and the reviewers. Any product that may be evaluated in this article, or claim that may be made by its manufacturer, is not guaranteed or endorsed by the publisher.
The Supplementary Material for this article can be found online at: https://www.frontiersin.org/articles/10.3389/feart.2024.1364653/full#supplementary-material
Asmussen, J. C., and Brincker, R. (1998). Modal analysis based on the random decrement technique: application to civil engineering structures. Denmark: Aalborg.
Bakun-Mazor, D., Hatzor, Y. H., Glaser, S. D., and Carlos Santamarina, J. (2013). Thermally vs seismically induced block displacements in Masada rock slopes. Int. J. Rock Mech. Min. Sci. 61, 196–211. doi:10.1016/j.ijrmms.2013.03.005
Bakun-Mazor, D., Keissar, Y., Feldheim, A., Detournay, C., and Hatzor, Y. H. (2020). Thermally-induced wedging–ratcheting failure mechanism in rock slopes. Rock Mech. Rock Eng. 53, 2521–2538. doi:10.1007/s00603-020-02075-6
Bessette-Kirton, E., Moore, J., Geimer, P., Finnegan, R., Häusler, M., and Dzubay, A. (2021). 3-D Model of the Courthouse Mesa Rock Slope Instability [Dataset]. The Hive: University of Utah Research Data Repository. doi:10.7278/S50D-F88B-N2Y0
Bessette-Kirton, E. K., Moore, J. R., Geimer, P. R., Finnegan, R., Häusler, M., and Dzubay, A. (2022). Structural characterization of a toppling rock slab from array-based ambient vibration measurements and numerical modal analysis. JGR. Earth Surf. 127, e2022JF006679. doi:10.1029/2022JF006679
Bottelin, P., Baillet, L., Carrier, A., Larose, E., Jongmans, D., Brenguier, O., et al. (2021). Toward workable and cost-efficient monitoring of unstable rock compartments with ambient noise. Geosciences 11, 242. doi:10.3390/geosciences11060242
Bottelin, P., Baillet, L., Larose, E., Jongmans, D., Hantz, D., Brenguier, O., et al. (2017). Monitoring rock reinforcement works with ambient vibrations: la Bourne case study (Vercors, France). Eng. Geol. 226, 136–145. doi:10.1016/j.enggeo.2017.06.002
Bottelin, P., Jongmans, D., Baillet, L., Lebourg, T., Hantz, D., Lévy, C., et al. (2013a). Spectral analysis of prone-to-fall rock compartments using ambient vibrations. J. Environ. Eng. Geophys. 18, 205–217. doi:10.2113/JEEG18.4.205
Bottelin, P., Lévy, C., Baillet, L., Jongmans, D., and Guéguen, P. (2013b). Modal and thermal analysis of Les Arches unstable rock column (Vercors massif, French Alps). Geophys. J. Int. 194, 849–858. doi:10.1093/gji/ggt046
Burjánek, J., Gischig, V., Moore, J. R., and Fäh, D. (2018). Ambient vibration characterization and monitoring of a rock slope close to collapse. Geophys. J. Int. 212, 297–310. doi:10.1093/gji/ggx424
Burjánek, J., Kleinbrod, U., and Fäh, D. (2019). Modeling the seismic response of unstable rock mass with deep compliant fractures. J. Geophys. Res. Solid Earth 124, 13039–13059. doi:10.1029/2019JB018607
Clinton, J. F. (2006). The observed wander of the natural frequencies in a structure. Bull. Seismol. Soc. Am. 96, 237–257. doi:10.1785/0120050052
Cole, H. A. (1973). On-line failure detection and damping measurement of aerospace structures by random decrement signatures. NASA Contract. Rep.
Collins, B. D., and Stock, G. M. (2016). Rockfall triggering by cyclic thermal stressing of exfoliation fractures. Nat. Geosci. 9, 395–400. doi:10.1038/ngeo2686
Colombero, C., Baillet, L., Comina, C., Jongmans, D., Larose, E., Valentin, J., et al. (2018). Integration of ambient seismic noise monitoring, displacement and meteorological measurements to infer the temperature-controlled long-term evolution of a complex prone-to-fall cliff. Geophys. J. Int. 213, 1876–1897. doi:10.1093/gji/ggy090
Colombero, C., Baillet, L., Comina, C., Jongmans, D., and Vinciguerra, S. (2017). Characterization of the 3-D fracture setting of an unstable rock mass: from surface and seismic investigations to numerical modeling. J. Geophys. Res. Solid Earth 122, 6346–6366. doi:10.1002/2017JB014111
Colombero, C., Godio, A., and Jongmans, D. (2021a). Ambient seismic noise and microseismicity monitoring of a prone-to-fall quartzite tower (ormea, NW Italy). Remote Sens. 13, 1664. doi:10.3390/rs13091664
Colombero, C., Jongmans, D., Fiolleau, S., Valentin, J., Baillet, L., and Bièvre, G. (2021b). Seismic noise parameters as indicators of reversible modifications in slope stability: a review. Surv. Geophys. 42, 339–375. doi:10.1007/s10712-021-09632-w
Costain, J. K., and Wright, P. M. (1973). Heat flow at spor mountain, Jordan valley, bingham, and La sal, Utah. J. Geophys. Res. 78, 8687–8698. doi:10.1029/JB078i035p08687
Crosta, G. B., and Agliardi, F. (2003). Failure forecast for large rock slides by surface displacement measurements. Can. Geotech. J. 40, 176–191. doi:10.1139/t02-085
Cross, E. J., Worden, K., and Chen, Q. (2011). Cointegration: a novel approach for the removal of environmental trends in structural health monitoring data. Proc. R. Soc. Math. Phys. Eng. Sci. 467, 2712–2732. doi:10.1098/rspa.2011.0023
Del Gaudio, V., Wasowski, J., and Muscillo, S. (2013). New developments in ambient noise analysis to characterise the seismic response of landslide-prone slopes. Nat. Hazards Earth Syst. Sci. 13, 2075–2087. doi:10.5194/nhess-13-2075-2013
de Vilder, S. J., Rosser, N. J., and Brain, M. J. (2017). Forensic analysis of rockfall scars. Geomorphology 295, 202–214. doi:10.1016/j.geomorph.2017.07.005
Dietze, M., Krautblatter, M., Illien, L., and Hovius, N. (2021). Seismic constraints on rock damaging related to a failing mountain peak: the Hochvogel, Allgäu. Earth Surf. Process. Landf. 46 (2), 417–429. doi:10.1002/esp.5034
do Amaral Vargas, E., Quadros Velloso, R., Chávez, L. E., Gusmão, L., and Palmeiro do Amaral, C. (2013). On the effect of thermally induced stresses in failures of some rock slopes in Rio de Janeiro, Brazil. Rock Mech. Rock Eng. 46, 123–134. doi:10.1007/s00603-012-0247-9
Doelling, H. H., and Morgan, C. D. (2000). Geologic map of the merrimac butte quadrangle, grand county, Utah. Utah Geol. Surv. doi:10.34191/M-178
Eberhardt, E., Stead, D., and Coggan, J. S. (2004). Numerical analysis of initiation and progressive failure in natural rock slopes—the 1991 Randa rockslide. Int. J. Rock Mech. Min. Sci. 41, 69–87. doi:10.1016/S1365-1609(03)00076-5
Einstein, H. H., Veneziano, D., Baecher, G. B., and O’Reilly, K. J. (1983). The effect of discontinuity persistence on rock slope stability. Int. J. Rock Mech. Min. Sci. Geomech. Abstr. 20, 227–236. doi:10.1016/0148-9062(83)90003-7
Elmo, D., Donati, D., and Stead, D. (2018). Challenges in the characterisation of intact rock bridges in rock slopes. Eng. Geol. 245, 81–96. doi:10.1016/j.enggeo.2018.06.014
Elmo, D., Stead, D., Yang, B., Marcato, G., and Borgatti, L. (2022). A New Approach to Characterise the Impact of Rock Bridges in Stability Analysis. Rock Mech. Rock Eng. 55, 2551–2569. doi:10.1007/s00603-021-02488-x
Finnegan, R., Moore, J. R., Geimer, P. R., Dzubay, A., Bessette-Kirton, E. K., Bodtker, J., et al. (2022). Ambient Vibration Modal Analysis of Natural Rock Towers and Fins. Seismol. Res. Lett. 93, 1777–1786. doi:10.1785/0220210325
Frayssines, M., and Hantz, D. (2006). Failure mechanisms and triggering factors in calcareous cliffs of the Subalpine Ranges (French Alps). Eng. Geol. 86, 256–270. doi:10.1016/j.enggeo.2006.05.009
Fukuzono, T. (1985). A method to predict the time of slope failure caused by rainfall using the inverse number of velocity of surface displacement. J. Jpn. Landslide Soc. 22 (2), 8–13. doi:10.3313/jls1964.22.2_8
Galea, P., D’Amico, S., and Farrugia, D. (2014). Dynamic characteristics of an active coastal spreading area using ambient noise measurements—Anchor Bay, Malta. Geophys. J. Int. 199, 1166–1175. doi:10.1093/gji/ggu318
Geimer, P. R., Finnegan, R., and Moore, J. R. (2020). Sparse Ambient Resonance Measurements Reveal Dynamic Properties of Freestanding Rock Arches. Geophys. Res. Lett. 47. doi:10.1029/2020GL087239
Geimer, P. R., Finnegan, R., and Moore, J. R. (2022). Meteorological Controls on Reversible Resonance Changes in Natural Rock Arches. J. Geophys. Res. Earth Surf. 127. doi:10.1029/2022JF006734
Got, J.-L., Mourot, P., and Grangeon, J. (2010). Pre-failure behaviour of an unstable limestone cliff from displacement and seismic data. Nat. Hazards Earth Syst. Sci. 10, 819–829. doi:10.5194/nhess-10-819-2010
Guillemot, A., Baillet, L., Larose, E., and Bottelin, P. (2022). Changes in resonance frequency of rock columns due to thermoelastic effects on a daily scale: observations, modelling and insights to improve monitoring systems. Geophys. J. Int. 231, 894–906. doi:10.1093/gji/ggac216
Gunzburger, Y., Merrien-Soukatchoff, V., and Guglielmi, Y. (2005). Influence of daily surface temperature fluctuations on rock slope stability: case study of the Rochers de Valabres slope (France). Int. J. Rock Mech. Min. Sci. 42, 331–349. doi:10.1016/j.ijrmms.2004.11.003
Häusler, M., Geimer, P. R., Finnegan, R., Fäh, D., and Moore, J. R. (2021a). An update on techniques to assess normal-mode behavior of rock arches by ambient vibrations. Earth Surf. Dyn. 9, 1441–1457. doi:10.5194/esurf-9-1441-2021
Häusler, M., Gischig, V., Thöny, R., Glueer, F., and Donat, F. (2021b). Monitoring the changing seismic site response of a fast-moving rockslide (Brienz/Brinzauls, Switzerland). Geophys. J. Int. 229, 299–310. doi:10.1093/gji/ggab473
Häusler, M., Michel, C., Burjánek, J., and Fäh, D. (2019). Fracture Network Imaging on Rock Slope Instabilities Using Resonance Mode Analysis. Geophys. Res. Lett. 46, 6497–6506. doi:10.1029/2019GL083201
Häusler, M., Michel, C., Burjánek, J., and Fäh, D. (2021c). Monitoring the Preonzo Rock Slope Instability Using Resonance Mode Analysis. J. Geophys. Res. Earth Surf. 126. doi:10.1029/2020JF005709
Hungr, O., Leroueil, S., and Picarelli, L. (2014). The Varnes classification of landslide types, an update. Landslides 11, 167–194. doi:10.1007/s10346-013-0436-y
Iannucci, R., Martino, S., Paciello, A., D’Amico, S., and Galea, P. (2018). Engineering geological zonation of a complex landslide system through seismic ambient noise measurements at the Selmun Promontory (Malta). Geophys. J. Int. 213, 1146–1161. doi:10.1093/gji/ggy025
Ibrahim, S. R. (1977). Random Decrement Technique for Modal Identification of Structures. J. Spacecr. Rockets 14, 696–700. doi:10.2514/3.57251
Intrieri, E., Carlà, T., and Gigli, G. (2019). Forecasting the time of failure of landslides at slope-scale: A literature review. Earth-Science Rev. 193, 333–349. doi:10.1016/j.earscirev.2019.03.019
IRIS DMC (2015). Data Services Products: Polarization Attributes bundle. Seismological Facility for the Advancement of Geoscience. doi:10.17611/DP/NTK.4
Jensen, E. K., Moore, J. R., Gemier, P. R., and Finnegan, R. (2023). Map and monitoring data for the Courthouse Mesa rock slope instability, 2018–2022 [Dataset]. The Hive: University of Utah Research Data Repository. doi:10.7278/S50d-e0es-913n
Kleinbrod, U., Burjánek, J., and Fäh, D. (2019). Ambient vibration classification of unstable rock slopes: A systematic approach. Eng. Geol. 249, 198–217. doi:10.1016/j.enggeo.2018.12.012
Koper, K. D., and Burlacu, R. (2015). The fine structure of double-frequency microseisms recorded by seismometers in North America: double Frequency Microseisms. J. Geophys. Res. Solid Earth 120, 1677–1691. doi:10.1002/2014JB011820
Koper, K. D., and Hawley, V. L. (2010). Frequency dependent polarization analysis of ambient seismic noise recorded at a broadband seismometer in the central United States. Earthq. Sci. 23, 439–447. doi:10.1007/s11589-010-0743-5
Larose, E., Carrière, S., Voisin, C., Bottelin, P., Baillet, L., Guéguen, P., et al. (2015). Environmental seismology: what can we learn on earth surface processes with ambient noise? J. Appl. Geophys. 116, 62–74. doi:10.1016/j.jappgeo.2015.02.001
Lévy, C., Baillet, L., Jongmans, D., Mourot, P., and Hantz, D. (2010). Dynamic response of the Chamousset rock column (Western Alps, France). J. Geophys. Res. 115, F04043. doi:10.1029/2009JF001606
Laory, I., Trinh, T. N., Smith, I. F. C., and Brownjohn, J. M. W. (2014). Methodologies for predicting natural frequency variation of a suspension bridge. Eng. Struct. 80, 211–221. doi:10.1016/j.engstruct.2014.09.00
Mercerat, E. D., Payeur, J. B., Bertrand, E., Malascrabes, M., Pernoud, M., and Chamberland, Y. (2020). Deciphering the dynamics of a heterogeneous sea cliff using ambient vibrations: case study of the Sutta-Rocca overhang (southern Corsica, France). Geophys. J. Int. 224, 813–824. doi:10.1093/gji/ggaa465
Michel, C., Guéguen, P., and Bard, P.-Y. (2008). Dynamic parameters of structures extracted from ambient vibration measurements: an aid for the seismic vulnerability assessment of existing buildings in moderate seismic hazard regions. Soil Dyn. Earthq. Eng. 28, 593–604. doi:10.1016/j.soildyn.2007.10.002
Moore, J. R. (2013). Structural health monitoring of rock arches and towers [Data set]. Seattle, WA: International Federation of Digital Seismograph Networks. doi:10.7914/SN/5P_2013
Moore, J. R., Geimer, P. R., Finnegan, R., and Thorne, M. S. (2018). Use of Seismic Resonance Measurements to Determine the Elastic Modulus of Freestanding Rock Masses. Rock Mech. Rock Eng. 51, 3937–3944. doi:10.1007/s00603-018-1554-6
Moore, J. R., Gischig, V., Burjanek, J., Loew, S., and Fah, D. (2011a). Site Effects in Unstable Rock Slopes: dynamic Behavior of the Randa Instability (Switzerland). Bull. Seismol. Soc. Am. 101, 3110–3116. doi:10.1785/0120110127
Moore, J. R., Gischig, V., Katterbach, M., and Loew, S. (2011b). Air circulation in deep fractures and the temperature field of an alpine rock slope: CRACK AIR CONVECTION IN ALPINE ROCK WALLS. Earth Surf. Process. Landf. 36, 1985–1996. doi:10.1002/esp.2217
Moore, J. R., Thorne, M. S., Koper, K. D., Wood, J. R., Goddard, K., Burlacu, R., et al. (2016). Anthropogenic sources stimulate resonance of a natural rock bridge. Geophys. Res. Lett. 43, 9669–9676. doi:10.1002/2016GL070088
Moser, P., and Moaveni, B. (2011). Environmental effects on the identified natural frequencies of the Dowling Hall Footbridge. Mech. Syst. Signal Process. 25, 2336–2357. doi:10.1016/j.ymssp.2011.03.005
Mufundirwa, A., Fujii, Y., and Kodama, J. (2010). A new practical method for prediction of geomechanical failure-time. Int. J. Rock Mech. Min. Sci. 47, 1079–1090. doi:10.1016/j.ijrmms.2010.07.001
Mulas, M., Marnas, M., Ciccarese, G., and Corsini, A. (2020). Sinusoidal wave fit indexing of irreversible displacements for crackmeters monitoring of rockfall areas: test at Pietra di Bismantova (Northern Apennines, Italy). Landslides 17, 231–240. doi:10.1007/s10346-019-01248-x
Nara, Y., Morimoto, K., Hiroyoshi, N., Yoneda, T., Kaneko, K., and Benson, P. M. (2012). Influence of relative humidity on fracture toughness of rock: implications for subcritical crack growth. Int. J. Solids Struct. 49, 2471–2481. doi:10.1016/j.ijsolstr.2012.05.009
Pasten, C., García, M., and Carlos Santamarina, J. (2015). Thermo-mechanical ratcheting in jointed rock masses. Géotechnique Lett. 5, 86–90. doi:10.1680/geolett.14.00118
Petley, D. N. (2004). The evolution of slope failures: mechanisms of rupture propagation. Nat. Hazards Earth Syst. Sci. 4, 147–152. doi:10.5194/nhess-4-147-2004
Rose, N. D., and Hungr, O. (2007). Forecasting potential rock slope failure in open pit mines using the inverse-velocity method. Int. J. Rock Mech. Min. Sci. 44, 308–320. doi:10.1016/j.ijrmms.2006.07.014
Starr, A. M., Moore, J. R., and Thorne, M. S. (2015). Ambient resonance of Mesa Arch, Canyonlands National Park, Utah. Geophys. Res. Lett. 42, 6696–6702. doi:10.1002/2015GL064917
Stock, G. M., Bawden, G. W., Green, J. K., Hanson, E., Downing, G., Collins, B. D., et al. (2011). High-resolution three-dimensional imaging and analysis of rock falls in Yosemite Valley, California. Geosphere 7, 573–581. doi:10.1130/GES00617.1
Taruselli, M., Arosio, D., Longoni, L., Papini, M., and Zanzi, L. (2020). Seismic noise monitoring of a small rock block collapse test. Geophys. J. Int. 224, 207–215. doi:10.1093/gji/ggaa447
Terzaghi, K. (1962). Stability of Steep Slopes on Hard Unweathered Rock. Géotechnique 12, 251–270. doi:10.1680/geot.1962.12.4.251
Valentin, J., Capron, A., Jongmans, D., Baillet, L., Bottelin, P., Donze, F., et al. (2017). The dynamic response of prone-to-fall columns to ambient vibrations: comparison between measurements and numerical modelling. Geophys. J. Int. 208, 1058–1076. doi:10.1093/gji/ggw440
Weber, S., Beutel, J., Faillettaz, J., Hasler, A., Krautblatter, M., and Vieli, A. (2017). Quantifying irreversible movement in steep, fractured bedrock permafrost on Matterhorn (CH). Cryosphere 11, 567–583. doi:10.5194/tc-11-567-2017
Weber, S., Fäh, D., Beutel, J., Faillettaz, J., Gruber, S., and Vieli, A. (2018). Ambient seismic vibrations in steep bedrock permafrost used to infer variations of ice-fill in fractures. Earth Planet. Sci. Lett. 501, 119–127. doi:10.1016/j.epsl.2018.08.042
Keywords: ambient vibration monitoring, displacement monitoring, rock slope stability, ambient noise, geomechanics, finite element modeling, landslides, environmental forcings
Citation: Jensen EK, Moore JR, Geimer PR and Finnegan R (2024) Combined ambient vibration and surface displacement measurements for improved progressive failure monitoring at a toppling rock slab in Utah, USA. Front. Earth Sci. 12:1364653. doi: 10.3389/feart.2024.1364653
Received: 02 January 2024; Accepted: 15 February 2024;
Published: 04 March 2024.
Edited by:
Gian Marco Marmoni, Sapienza University of Rome, ItalyReviewed by:
Pierre Bottelin, SAGE Ingénierie, FranceCopyright © 2024 Jensen, Moore, Geimer and Finnegan. This is an open-access article distributed under the terms of the Creative Commons Attribution License (CC BY). The use, distribution or reproduction in other forums is permitted, provided the original author(s) and the copyright owner(s) are credited and that the original publication in this journal is cited, in accordance with accepted academic practice. No use, distribution or reproduction is permitted which does not comply with these terms.
*Correspondence: Erin K. Jensen, ZXJpbi5rLmplbnNlbkB1dGFoLmVkdQ==
Disclaimer: All claims expressed in this article are solely those of the authors and do not necessarily represent those of their affiliated organizations, or those of the publisher, the editors and the reviewers. Any product that may be evaluated in this article or claim that may be made by its manufacturer is not guaranteed or endorsed by the publisher.
Research integrity at Frontiers
Learn more about the work of our research integrity team to safeguard the quality of each article we publish.