- 1Lhasa Plateau Ecosystem Research Station, Key Laboratory of Ecosystem Network Observation and Modeling, Institute of Geographic Sciences and Natural Resources Research, Chinese Academy of Sciences, Beijing, China
- 2Xi’an University of Finance and Economics, Xi’an, China
Quantifying soil pH at manifold spatio-temporal scales is critical for examining the impacts of global change on soil quality. It is still unclear whether meteorological data and normalized difference vegetation index (NDVI) can be used to quantify soil pH in grasslands. Here, nine methods (i.e., RF: random-forest, GLR: generalized-linear-regression, GBR: generalized-boosted-regression, MLR: multiple-linear-regression, ANN: artificial-neural-network, CIT: conditional-inference-tree, SVM: support-vector-machine, eXGB: eXtreme-gradient-boosting, RRT: recursive-regression-tree) were applied to quantify soil pH. Three independent variables (i.e., AP: annual precipitation, AT: annual temperature, ARad: annual radiation) were used to quantify potential soil pH (pHp), and four independent variables (i.e., AP, AT, ARad and NDVImax: maximum NDVI during growing season) were applied to quantify actual soil pH (pHa). Overall, the developed eXGB models performed the worst (linear regression slope < 0.60; R2 = 0.99; relative deviation ≤ –43.54%; RMSE ≥ 3.14), but developed RF models performed the best (linear regression slope: 0.99–1.01; R2 = 1.00; relative deviation: from –1.26% to 0.65%; RMSE ≤ 0.28). The linear regression slope, R2, absolute value of relative deviation and RMSE between modelled and measured soil pH were 0.96–1.03, 0.99–1.00, ≤ 3.87% and ≤ 0.88 for the other seven methods, respectively. Accordingly, except the developed eXGB approach, the developed other eight methods can have relative greater accuracies in quantifying soil pH. However, the developed RF had the uppermost quantification accuracy for soil pH. Whether or not meteorological data and normalized difference vegetation index can be used to quantify soil pH was dependent on the chosen models. The RF developed by this study can be used to quantify soil pH from measured meteorological data and NDVImax, and may be conducive to scientific studies related to soil quality and degradation (e.g., soil acidification and salinization) at manifold spatial-temporal under future globe change.
1 Introduction
Soil pH, as one of the important indices of soil quality, is generally the acidity and alkalinity of soil systems and ranges from 0 to 14 (Ji et al., 2014). Acidic, neutral and alkaline soils generally refer to soils with pH < 7, = 7 and > 7, respectively. Soil pH can regulate the mineralization of soil organic carbon (Dlamini et al., 2016), soil microbial community structure (e.g. α-diversity, community composition) (Zhang et al., 2020; Zhang and Fu, 2021), plant community structure (e.g. β-diversity) (Sun et al., 2021; Wang et al., 2021b), plant growth (Veresoglou et al., 2011; Wang et al., 2021a; Zhang et al., 2021), herbage nutritional quality and storage (Fu et al., 2021; Zha et al., 2022). Soil pH is also closely correlated with base cations (K, Ca and Mg) (Baumann et al., 2009), soil nitrogen and phosphorus availability (Paul et al., 2001; Fu and Shen, 2017). Thus, estimating soil pH variation at manifold spatio-temporal scales is critical for examining the impacts of globe change on soil quality and other related scientific studies in terrestrial ecosystems (Odhiambo et al., 2020). Under such background, a great deal of scientific studies explored the influence and feedback of environmental factors on soil pH (Fernandez-Calvino et al., 2011; Sikora et al., 2011; Hong et al., 2018; Puissant et al., 2019; Huang et al., 2022). These earlier studies can be benefit for improving soil quality and facilitating soil high-quality management. However, most of these earlier studies are mainly performed at fine spatial scales (i.e., single points or transect scale), because well documented data on observed soil pH are relatively sparse due to the high time and financial cost of observed soil pH (Wuest, 2015; Chen et al., 2019). In order to obtain soil pH with larger spatial scales and longer time series, spatiotemporal interpolation or model development of soil pH is a good solution. Current soil pH models can be divided into two types depending on whether or not they depend on other variables (Mao et al., 2014; Odhiambo et al., 2020). The soil pH models independent of other variables (e.g., Kriging and inverse distance weighted spatial interpolation) can obtain the soil pH during the sampling period of the whole region, but cannot obtain the soil pH during the non-sampling period. In other words, this method can only be used for spatial interpolation of soil pH, but not for temporal interpolation of soil pH. This limits the scope of application of this method (e.g., the temporal change of soil pH cannot be studied). In contrast, the soil pH models dependent of other variables can be used for spatio-temporal interpolation of soil pH. The current soil pH models use different independent variables, and the model accuracies of soil pH do not increase with increasing the number of independent variables, but even decrease (Chen et al., 2019; Jia et al., 2021; Wang et al., 2022). Moreover, the widespread popularization and application of such soil pH models are limited due to the availability or relatively low accuracy of some independent variables (Odhiambo et al., 2020). The development of machine learning techniques (e.g., RF: random-forest) can provide new ideas on the studies related to soil pH at manifold spatio-temporal scales (Chen et al., 2019; Jia et al., 2021; Wang et al., 2022). However, it is not clear on which one of machine learning techniques are better in estimating soil pH than the other machine learning technologies. Consequently, further studies are needed to better serve for the management of soil pH and quality at manifold spatio-temporal scales under impacts of humankind activities and climate change.
Various grassland systems are the main land cover in the Tibet, and they are the important foundation of high-quality development of livestock in Tibet Autonomous Region (Fu et al., 2022; Zha et al., 2022). Soil pH is closely correlated with grassland production and in turn high-quality development of livestock in the Tibet (Zhang et al., 2021). For example, soil pH was positively correlated with aboveground net primary production along an elevation gradient in alpine grassland of Nyenchen Tanglha (Wang et al., 2021a). However, soil pH was negatively correlated with the content of crude protein and water-soluble carbohydrate (Fu et al., 2022). Under such background, many studies have investigated the impacts of soil pH on ecosystem structure and function, and the driving factors of soil pH in grassland regions (Ji et al., 2014; Yu et al., 2019; Sun et al., 2021). However, these previous studies are not performed over the whole grassland areas of the Tibet due to the lack of large-scale soil pH datasets (Chen et al., 2019). In order to resolve such issue, it is necessary to develop an optimal model of soil pH in grassland areas of the Tibet.
Soil pH was estimated from measured meteorological data and normalized difference vegetation index (NDVI) on the basis of the RF, generalized-linear-regression (GLR), generalized-boosted-regression (GBR), multiple-linear-regression (MLR), artificial-neural-network (ANN), conditional-inference-tree (CIT), support-vector-machine (SVM), eXtreme-gradient-boosting (eXGB), and recursive-regression-tree (RRT) in grassland areas of Tibet. Three previous studies have explained the reasons why some of the nine methods (e.g., RF and SVM) were adopted to model plant species α-diversity (Tian and Fu, 2022), herbage nutritional quality and production (Han et al., 2022), soil moisture (Wang and Fu, 2023) in grassland areas of Tibet. Besides the causes mentioned above, it is still not clear on which one of the nine methods is best in quantifying soil pH of grassland area in Tibet. Thus, the nine methods were used to estimate soil pH. This study focused on comparing the accuracies of the nine methods in estimating soil pH. Several studies have confirmed that the performance of the RF approach was better than other approaches in predicting some important plant variables in grassland systems of Tibet (Han et al., 2022; Tian and Fu, 2022). Therefore, we assumed that the RF approach had the best performance in estimating soil pH amongst the nine approaches in grassland areas of the Tibet.
2 Materials and methods
2.1 Data
Figure S1 illustrated soil sampling sites under fencing and grazing conditions in grasslands of the Tibet. For each one of all the sampling sites (1 km × 1 km), 3–5 quadrats (0.50 m × 0.50 m) were randomly identified. We collected soil samples at 0–10, 10–20 and 20–30 cm using soil auger under fencing and grazing conditions in 2011 and 2013–2020. There were 290, 201 and 173 soil samples at 0–10, 10–20 and 20–30 cm under fencing conditions, and 315, 258 and 149 soil samples at 0–10, 10–20 and 20–30 cm under grazing conditions, respectively. Fresh soil samples were stored in refrigerators at –20 °C before the measures of soil pH. A soil pH meter was used to measure soil pH (soil-water ratio is 1:2.5) (Sun et al., 2021). The observed soil pH was 5.49–9.46, 5.87–9.45 and 6.17–9.32 under fencing conditions, and 5.55–9.82, 5.78–9.73 and 5.86–9.35 under grazing conditions at 0–10, 10–20 and 20–30 cm, respectively.
We estimated soil pH under two scenes, including soil pH under the scene affecting by simultaneously both climate change and humankind activities (i.e., soil pH under grazing conditions; pHa), and soil pH under the scene affecting by pure climate change (i.e., soil pH under fencing conditions; pHp). Some studies indicated that both temperature and precipitation can be closely correlated with soil pH (Ji et al., 2014; Fu and Shen, 2017; Palpurina et al., 2017; Hong et al., 2019; Zhao et al., 2022). Radiation is generally correlated with both temperature and precipitation (Fu et al., 2022; Han et al., 2022; Tian and Fu, 2022). Thus, the pHp were estimated by annual precipitation (AP), annual temperature (AT) and annual radiation (ARad), which were obtained by interpolating monthly temperature, monthly precipitation and monthly radiation, respectively (Tian and Fu, 2022). The NDVI can be also closely correlated with soil pH (Chen et al., 2019; Zhang et al., 2021), and can be used to reflect the combined effects of climate change and anthropogenic activities (Han et al., 2022; Tian and Fu, 2022; Sun et al., 2023; Wang and Fu, 2023). Thus, the pHa were estimated by the AP, AT, ARad and NDVImax. The RF, GLR, GBR, MLR, ANN, CIT, SVM, eXGB and RRT were used as the estimated tools of soil pH (Tables 1, 2).

Table 1 The parameters for random-forest (RF), generalized-boosted (GBR), support-vector-machine (SVM) and recursive-regression-tree (RRT) of soil pH.

Table 2 The parameters for multiple-linear (MLR), generalized-linear (GLR), artificial-neural-network (ANN), conditional-inference-tree (CIT), eXtreme-gradient-boosting (eXGB) of soil pH.
2.2 Statistic analyses
Dependent on prior studies (Fu et al., 2011; Han et al., 2022; Tian and Fu, 2022), 30 dataset of soil pH, AT, AP, ARad and NDVImax were randomly selected from all the measured dataset, and selected dataset were used to test estimation accuracy of soil pH. The R2 (determination coefficient), linear slope, RMSE (root-mean-square error) and relative deviation values were applied to be indices of precision evaluation. The closer R2 and slope between modelled and measured data are to 1, the higher model accuracies are (Han et al., 2022; Tian and Fu, 2022). The lower RMSE and absolute value of relative deviation between modelled and measured data are, the higher model accuracies are (Han et al., 2022; Tian and Fu, 2022). The randomForest, stats, rpart, e1071 and gbm packages were used to develop the RF, MLR, RRT, SVM and GBR models, respectively (Freund and Schapire, 1997; Breiman, 2001; Cortez, 2010). The rminer package of the R.4.1.2 software was used to develop the ANN, GLR, CIT and eXGB models (Han et al., 2022; Tian and Fu, 2022). The R.4.1.2 software was the only statistical software.
3 Results
3.1 Model development of soil pHp and pHa
The RF, MLR and RRT provided R2 (Tables 1, 2). Climate data and NDVImax on the basis of RF explained the greatest soil pH, while climate data and NDVImax on the basis of MLR explained the least soil pH (Tables 1, 2). The tree numbers of developed GBR were the greatest, but the support vector numbers of developed SVM were the least (Table 1). The GLR, ANN, CIT and eXGB provided error parameters that can be compared, and the error values of eXGB were the greatest amongst the four methods (Table 2).
3.2 Model accuracies of soil pHp and pHa
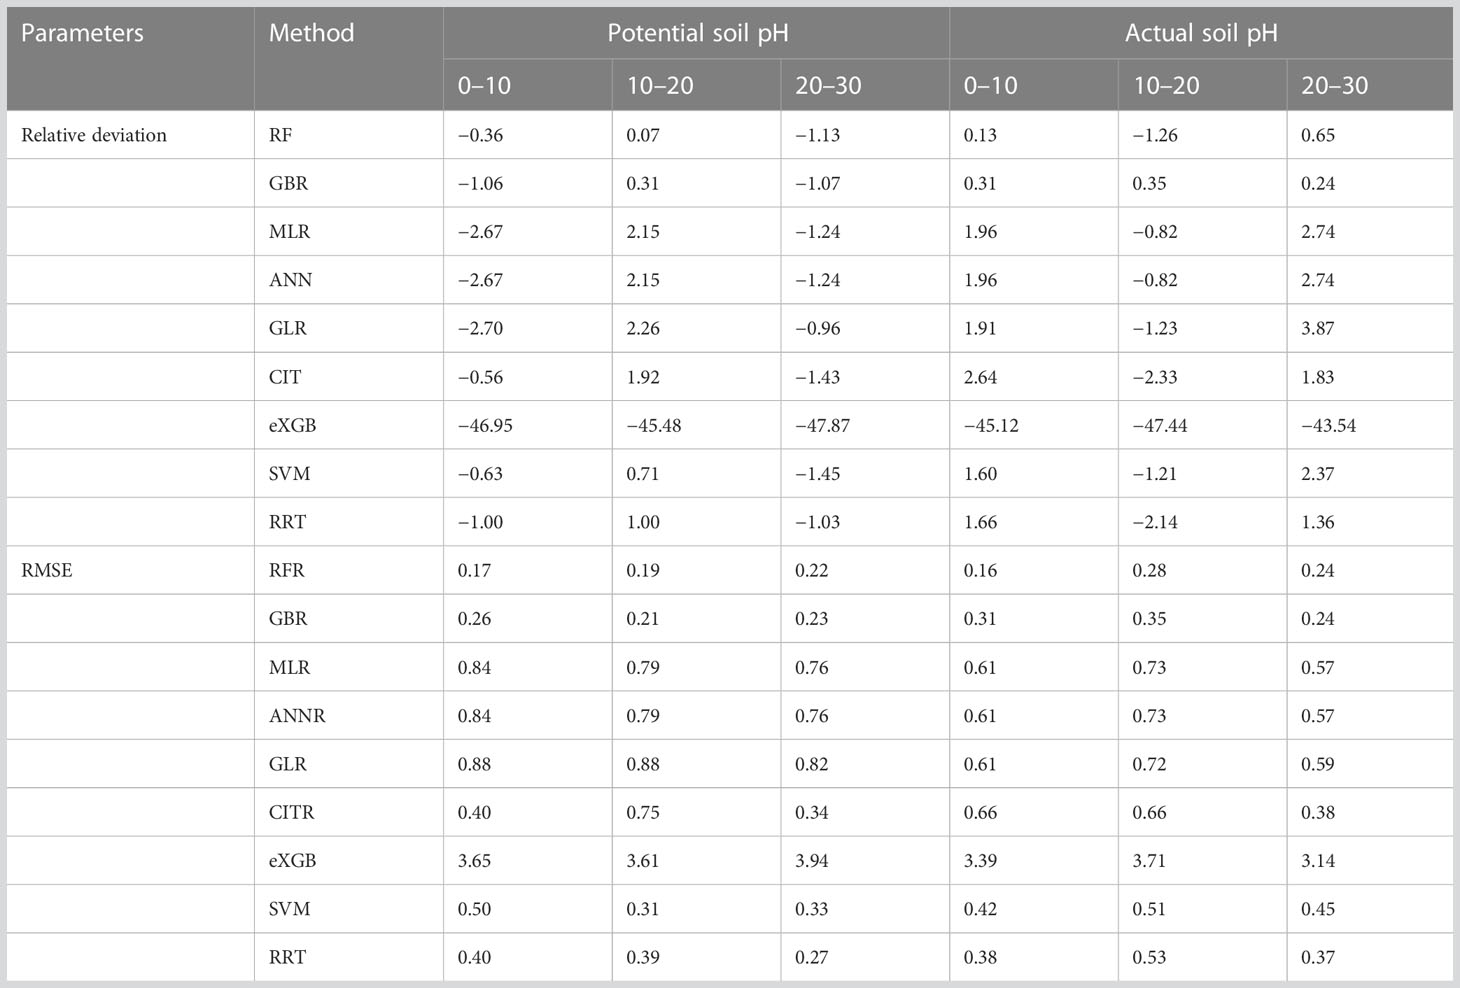
The model accuracies differed amongst the nine approaches (Table 3, Figures 1–6). The slopes between modelled soil pH on the basis of the eXGB approach and measured soil pH were the lowest amongst the nine approaches (Figures 1–6). Modelled soil pH on the basis of the RF, GBR, SVM and RRT approaches explained nearly 100% variation of measured soil pH, but that on the basis of the MLR, ANN, GLR and eXGB approaches explained about 99% variation of measured soil pH (Figures 1–6). Modelled soil pH on the basis of the CIT approach explained about 99–100% variation of measured soil pH (Figures 1–6). The absolute values of relative deviation between modelled soil pH on the basis of the eXGB approach and measured soil pH were the highest amongst the nine approaches (Table 3). The absolute values of relative deviation between modelled soil pHp at 0–10 and 10–20 cm, and soil pHa at 0–10 cm on the basis of the RF approach and measured soil pHp at 0–10 and 10–20 cm, and soil pHa at 0–10 cm were the lowest amongst the nine approaches, respectively (Table 3). The absolute values of relative deviation between modelled soil pHa at 10–20 and 20–30 cm on the basis of the GBR approach and measured soil pHa at 10–20 and 20–30 cm were the lowest amongst the nine approaches, respectively (Table 3). The absolute values of relative deviation between modelled soil pHp at 20–30 cm on the basis of the GLR approach and measured soil pHp at 20–30 cm was the lowest amongst the nine approaches (Table 3). The RMSE values between modelled soil pH on the basis of the RF approach and measured soil pH were the lowest amongst the nine approaches, but the RMSE values between modelled soil pH on the basis of the eXGB approach and measured soil pH were the highest amongst the nine approaches (Table 3).
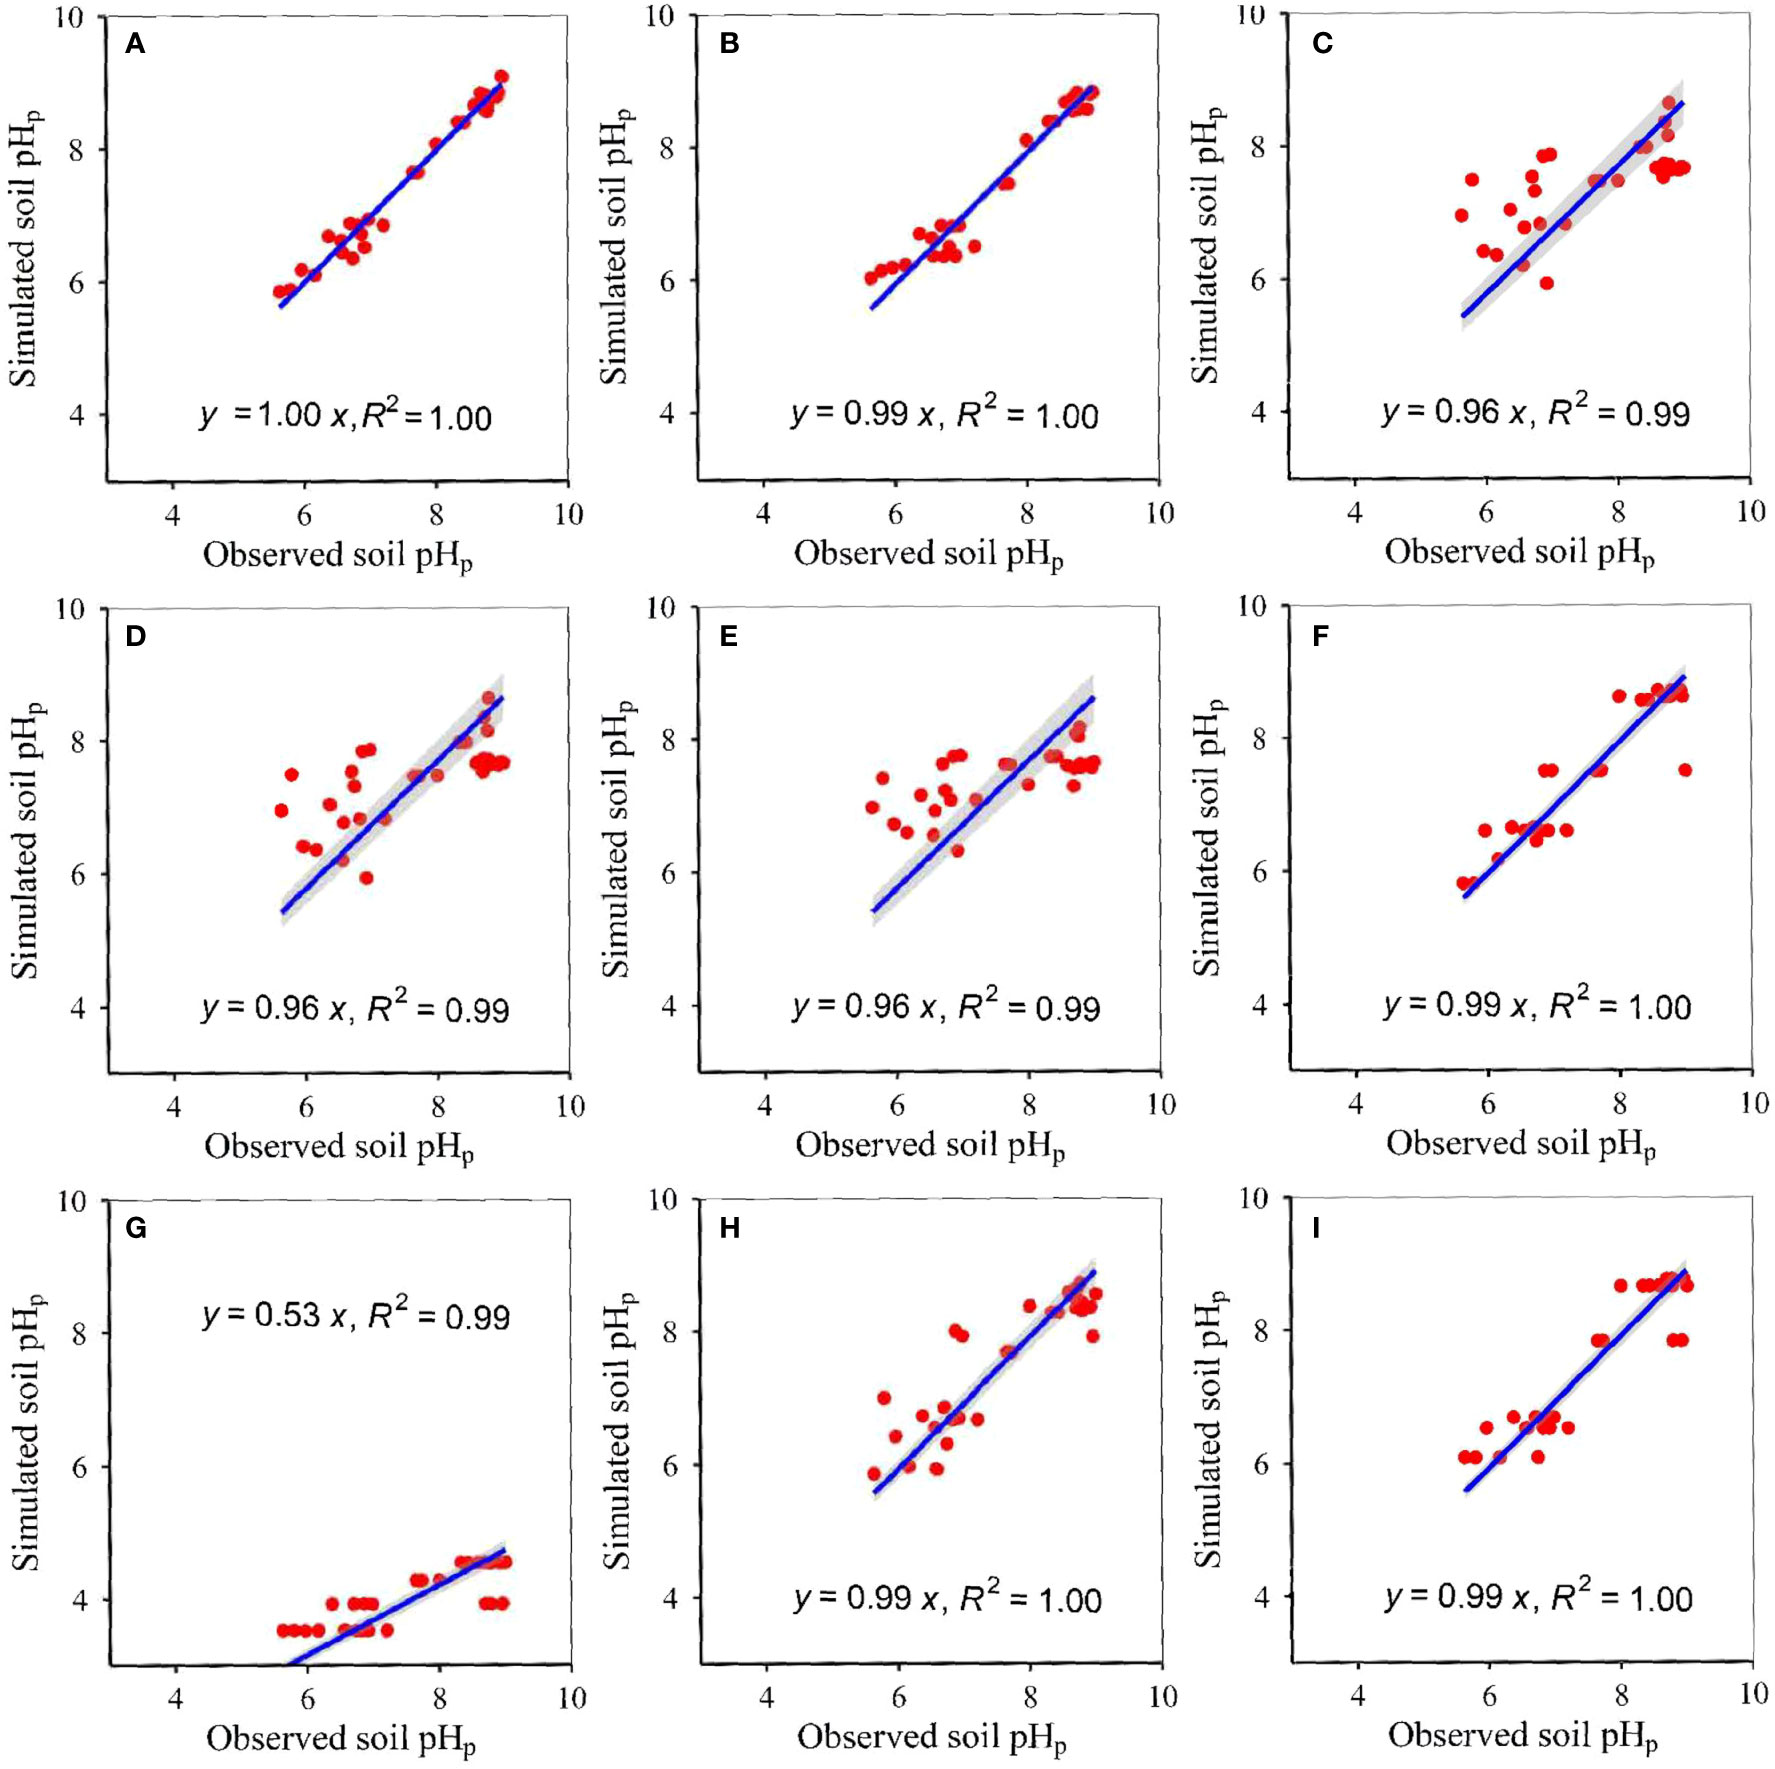
Figure 1 Relationships between modelled and measured potential soil pH at 0–10 cm (p<0.05) for (A) RF, (B) GBR, (C) MLR, (D) ANN, (E) GLR, (F) CIT, (G) eXGB, (H) SVM, and (I) RRT, respectively. The solid lines represent the linear fitting lines between modelled and measured soil pH. RF, random-forest; GBR, generalized-boosted; MLR, multiple-linear; ANN, artificial-neural-network; GLR, generalized-linear; CIT, conditional-inference-tree; eXGB, eXtreme-gradient-boosting; SVM, support-vector-machine; RRT, recursive-tree.
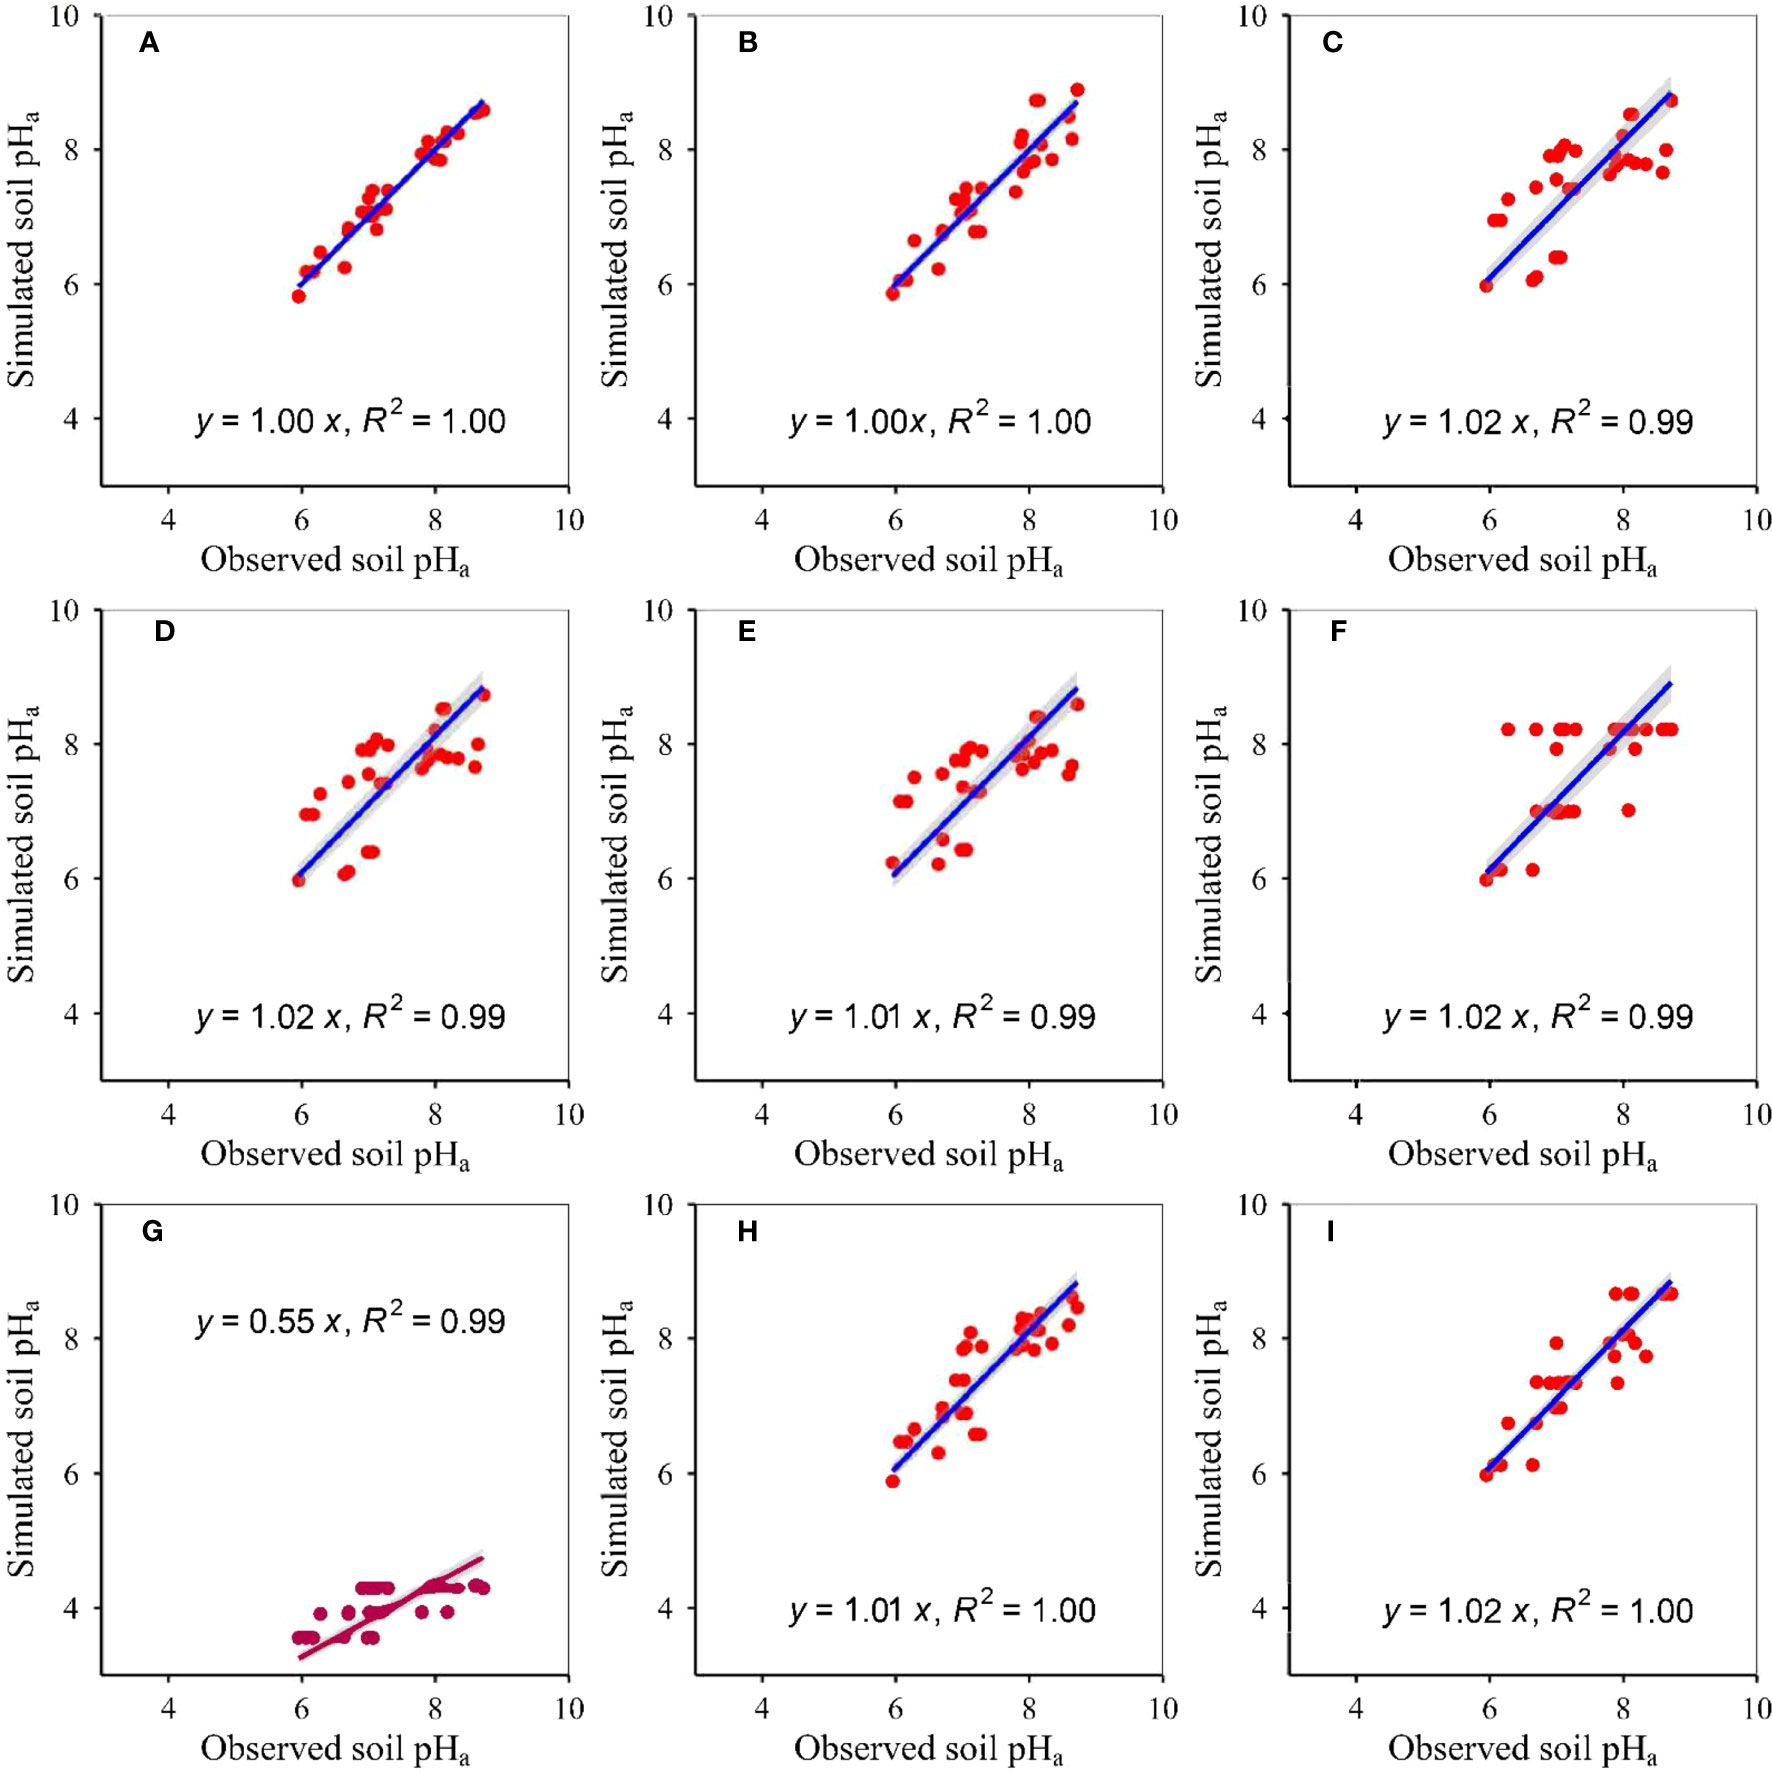
Figure 2 Relationships between modelled and measured actual soil pH at 0–10 cm (p<0.05) for (A) RF, (B) GBR, (C) MLR, (D) ANN, (E) GLR, (F) CIT, (G) eXGB, (H) SVM, and (I) RRT, respectively. The solid lines represent the linear fitting lines between modelled and measured soil pH. RF, random-forest; GBR, generalized-boosted; MLR, multiple-linear; ANN, artificial-neural-network; GLR, generalized-linear; CIT, conditional-inference-tree; eXGB, eXtreme-gradient-boosting; SVM, support-vector-machine; RRT, recursive-tree.
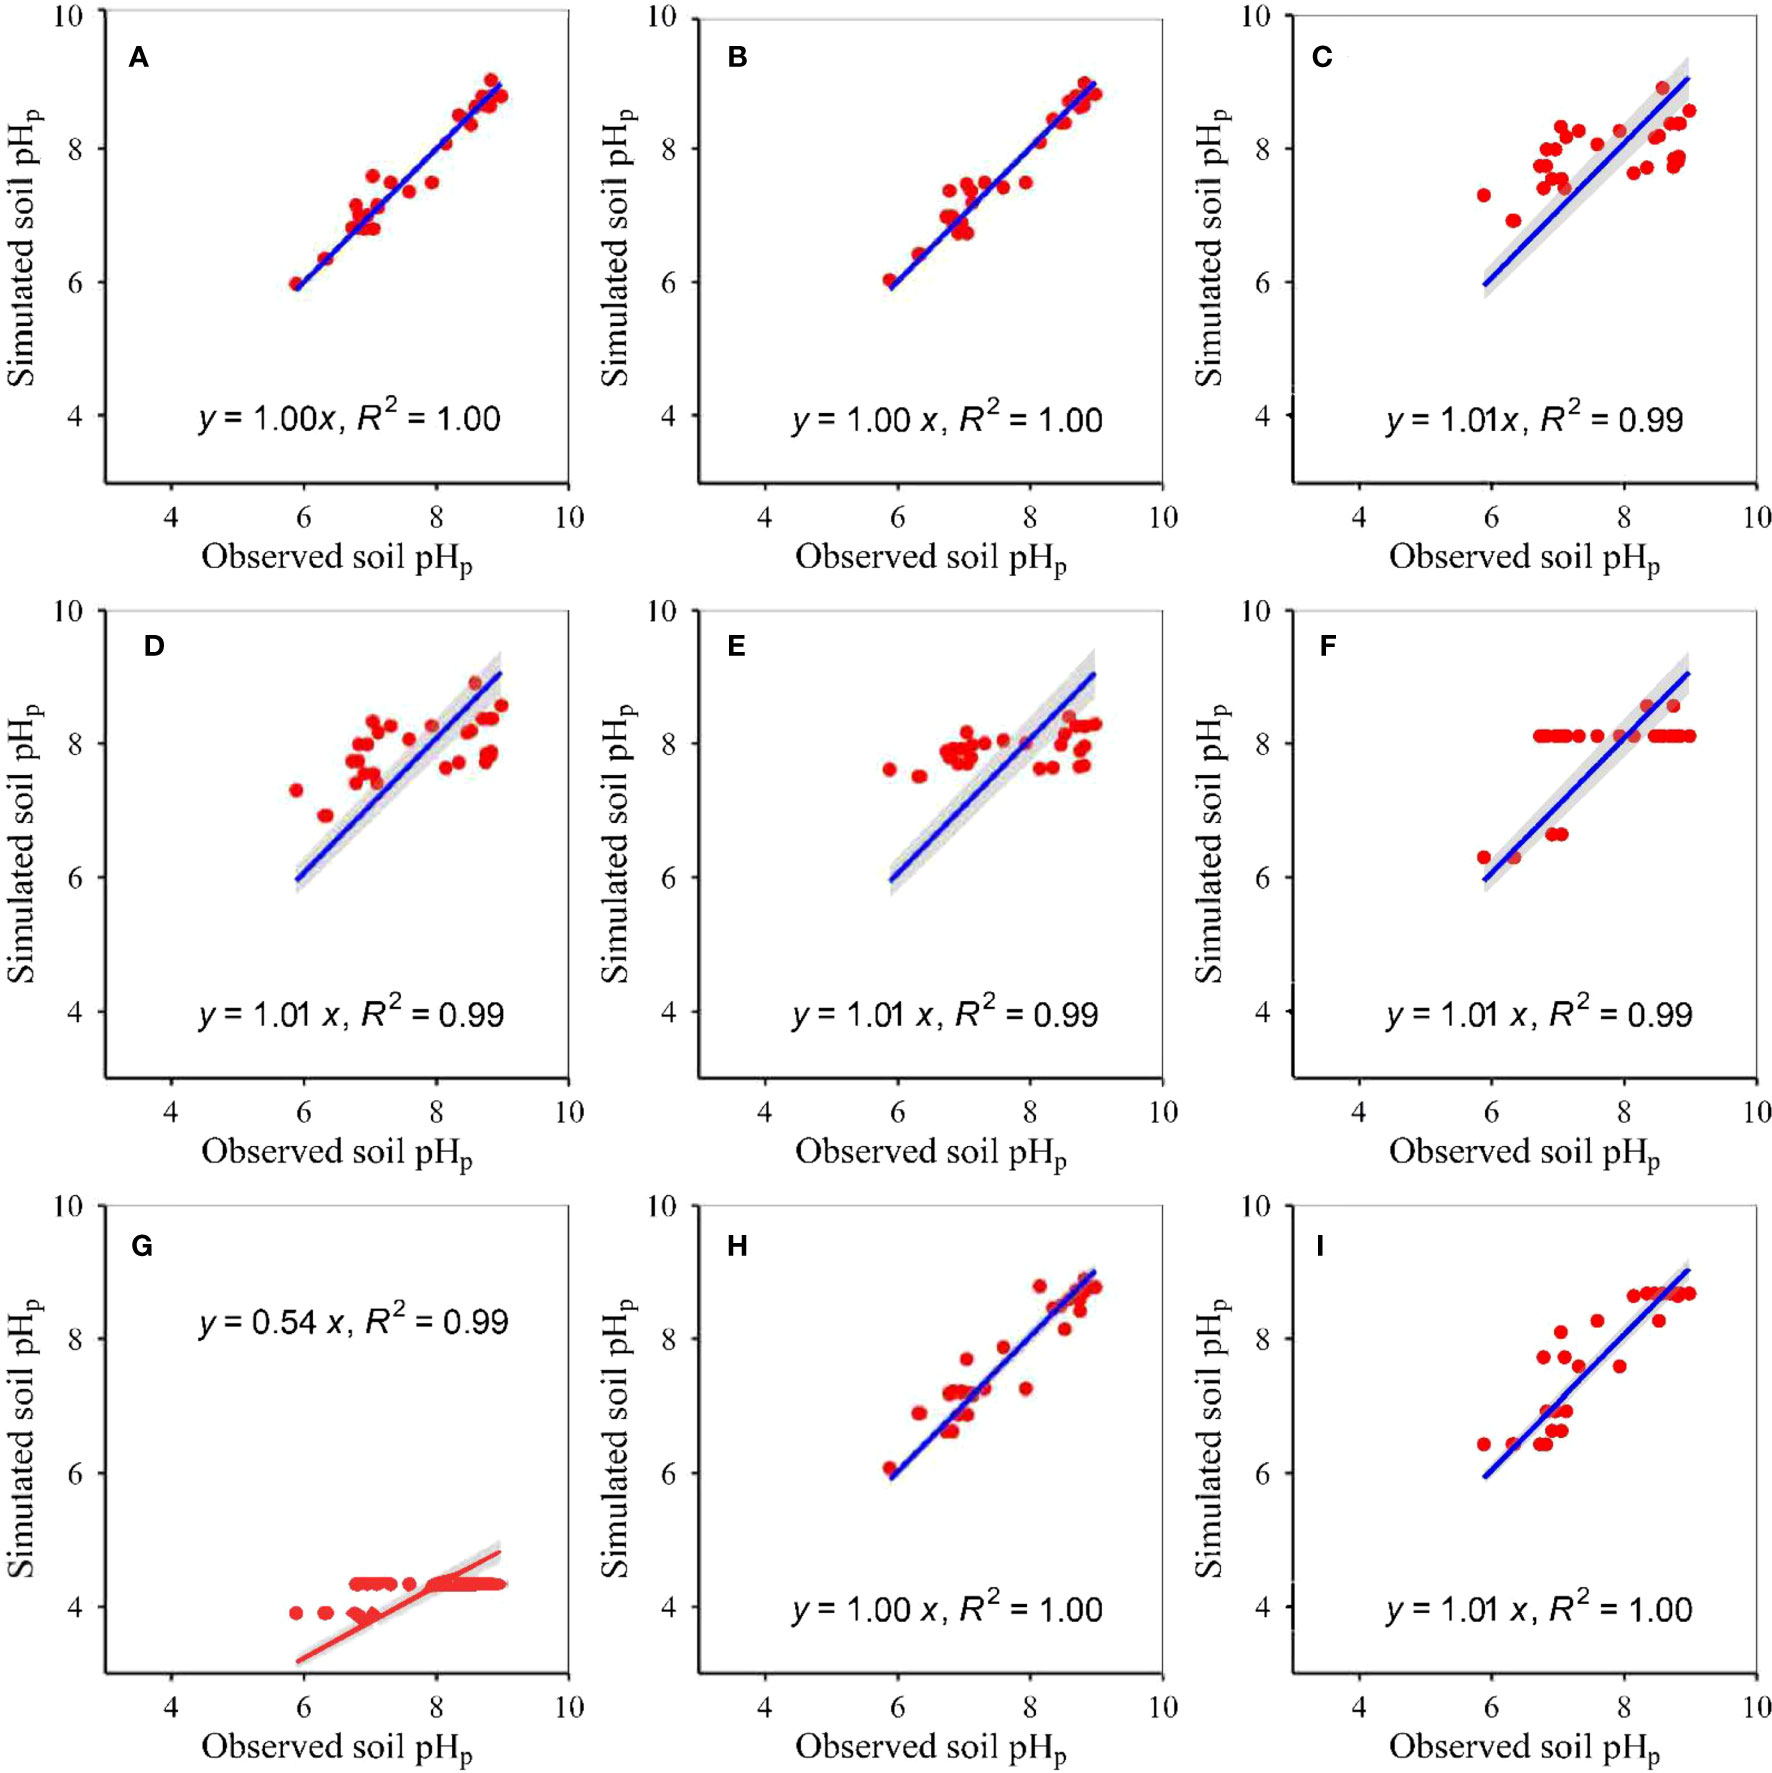
Figure 3 Relationships between modelled and measured potential soil pH at 10–20 cm (p<0.05) for (A) RF, (B) GBR, (C) MLR, (D) ANN, (E) GLR, (F) CIT, (G) eXGB, (H) SVM, and (I) RRT, respectively. The solid lines represent the linear fitting lines between modelled and measured soil pH. RF, random-forest; GBR, generalized-boosted; MLR, multiple-linear; ANN, artificial-neural-network; GLR, generalized-linear; CIT, conditional-inference-tree; eXGB, eXtreme-gradient-boosting; SVM, support-vector-machine; RRT, recursive-tree.
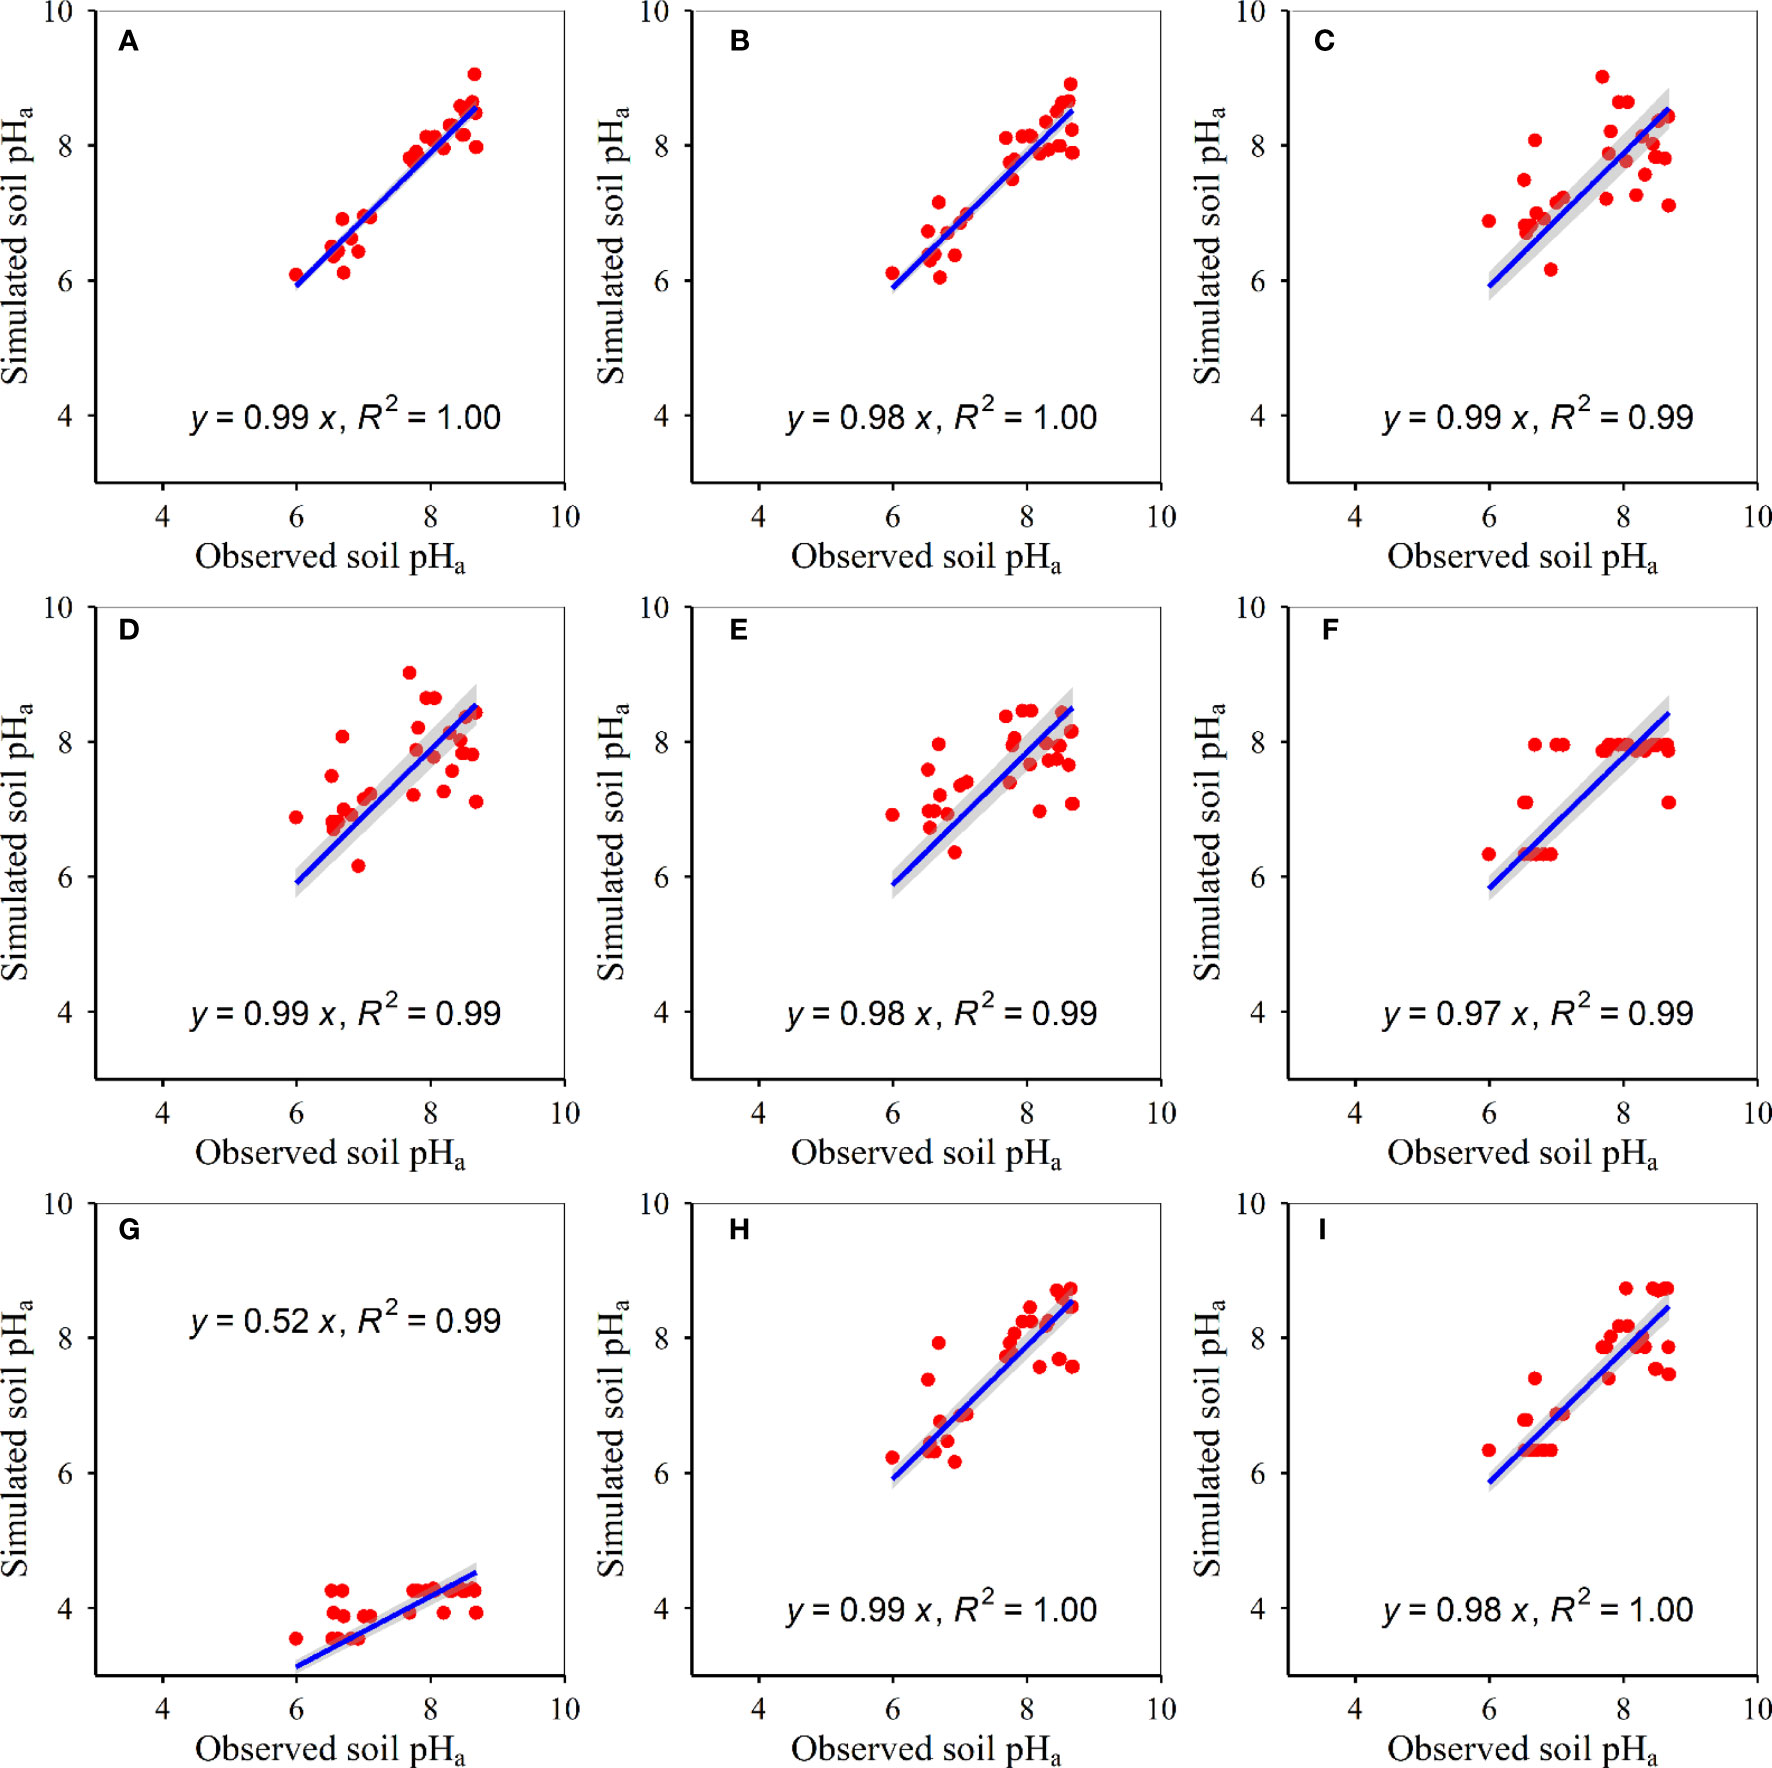
Figure 4 Relationships between modelled and measured actual soil pH at 10–20 cm (p<0.05) for (A) RF, (B) GBR, (C) MLR, (D) ANN, (E) GLR, (F) CIT, (G) eXGB, (H) SVM, and (I) RRT, respectively. The solid lines represent the linear fitting lines between modelled and measured soil pH. RF, random-forest; GBR, generalized-boosted; MLR, multiple-linear; ANN, artificial-neural-network; GLR, generalized-linear; CIT, conditional-inference-tree; eXGB, eXtreme-gradient-boosting; SVM, support-vector-machine; RRT, recursive-tree.
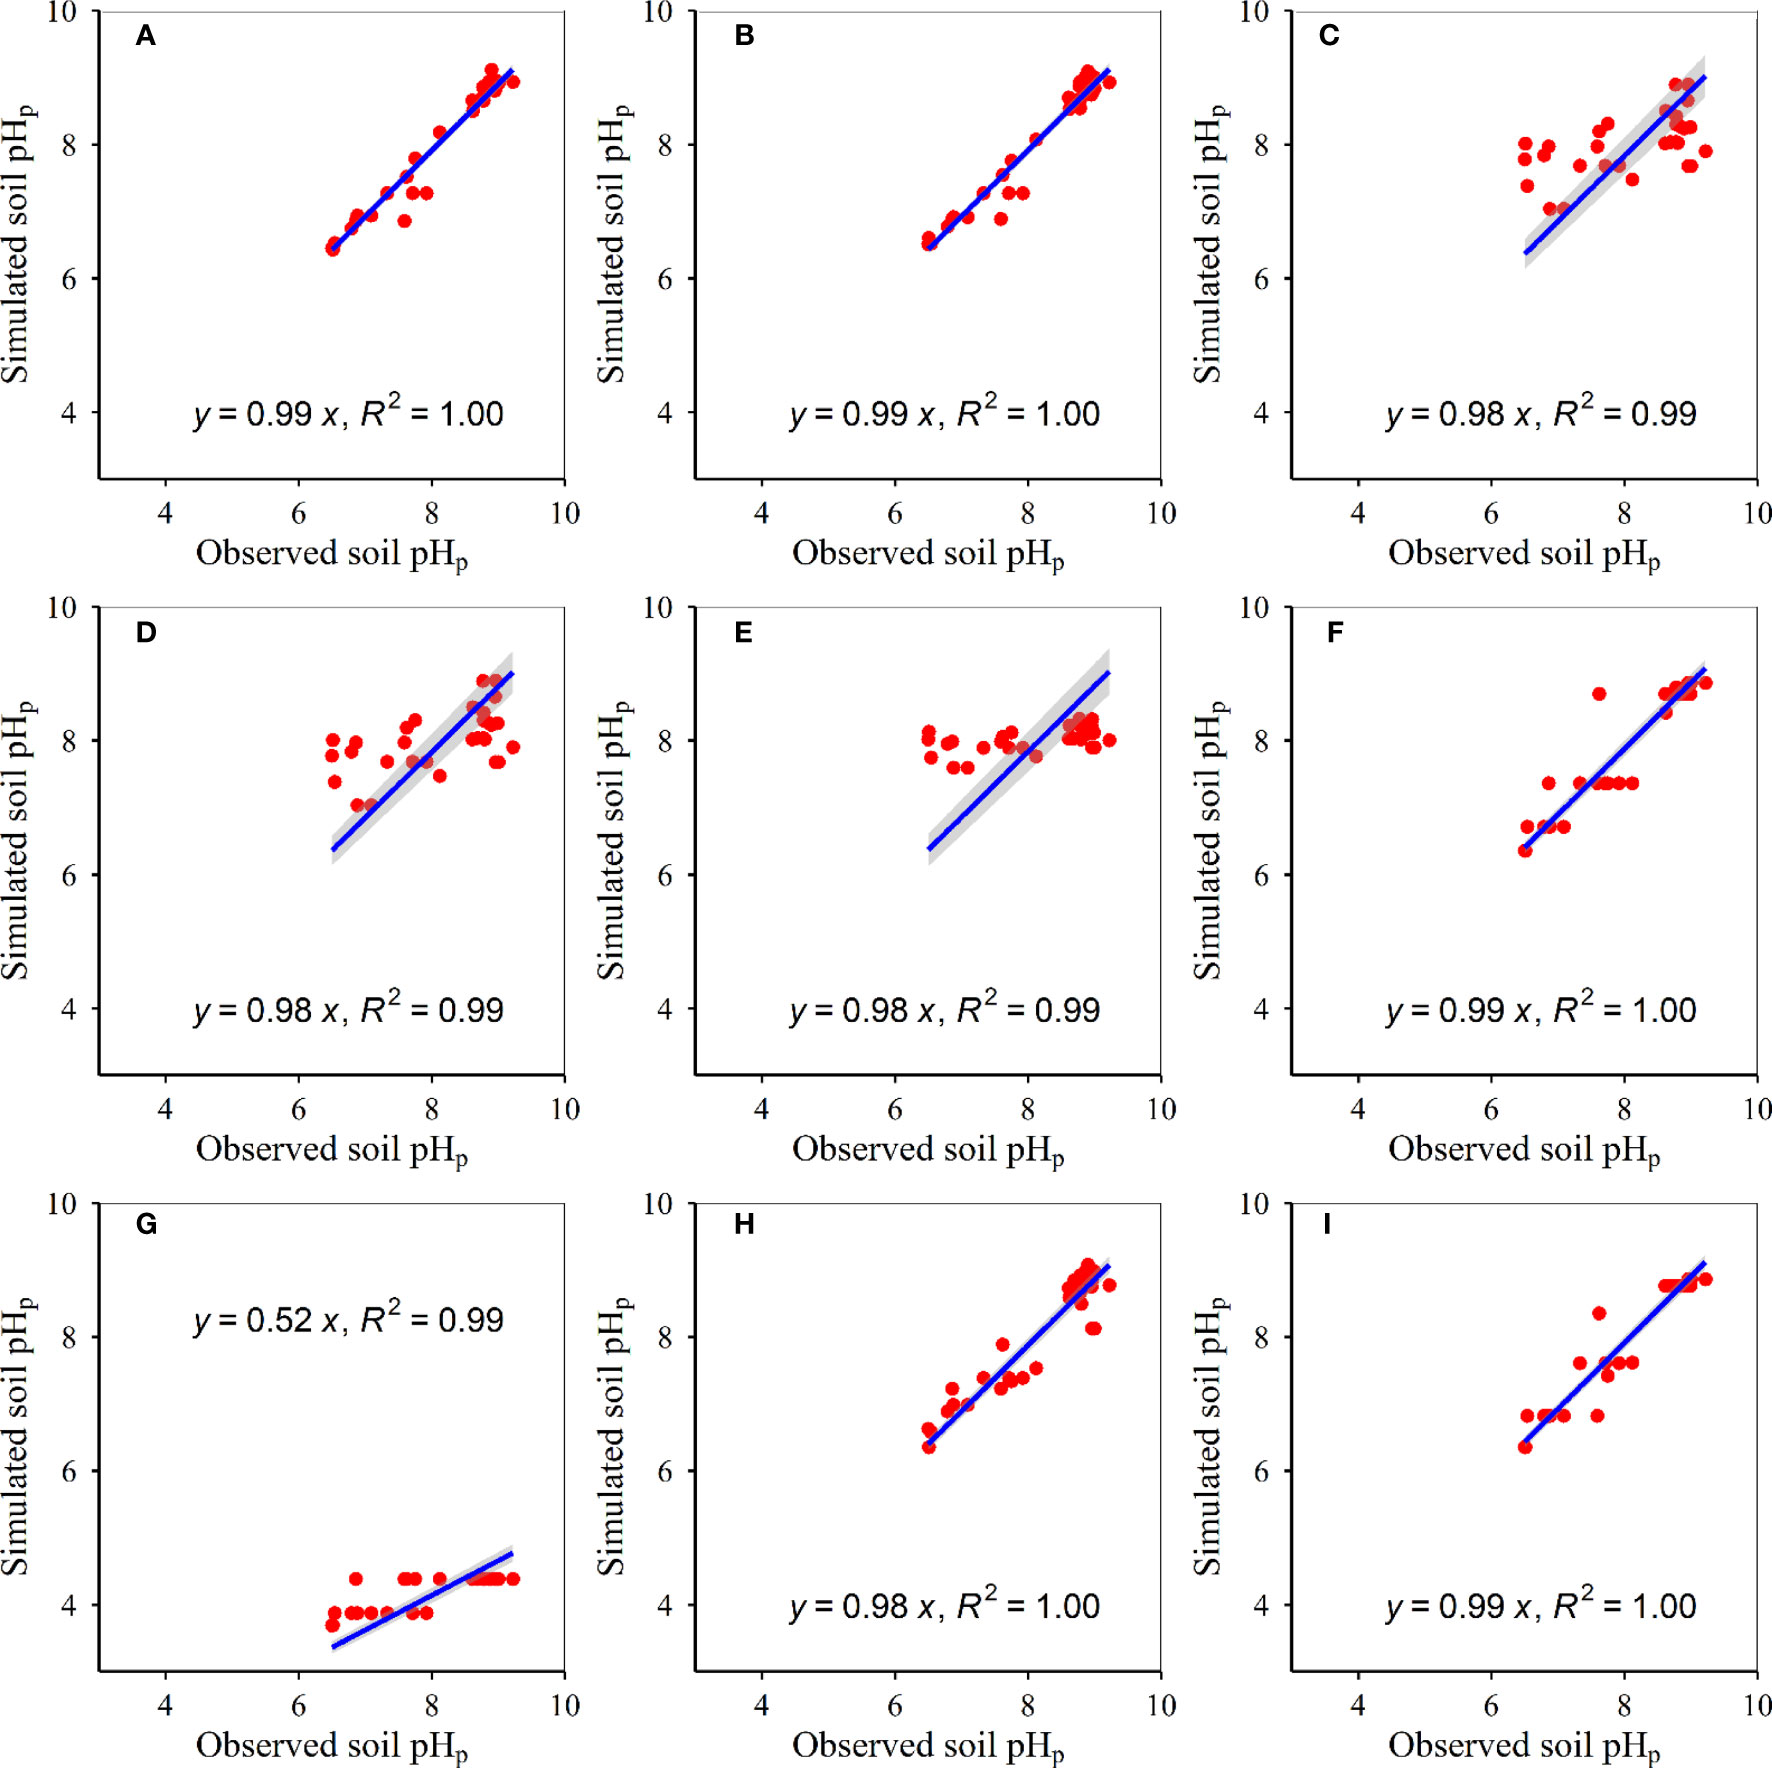
Figure 5 Relationships between modelled and measured potential soil pH at 20–30 cm (p<0.05) for (A) RF, (B) GBR, (C) MLR, (D) ANN, (E) GLR, (F) CIT, (G) eXGB, (H) SVM, and (I) RRT, respectively. The solid lines represent the linear fitting lines between modelled and measured soil pH. RF, random-forest; GBR, generalized-boosted; MLR, multiple-linear; ANN, artificial-neural-network; GLR, generalized-linear; CIT, conditional-inference-tree; eXGB, eXtreme-gradient-boosting; SVM, support-vector-machine; RRT, recursive-tree.
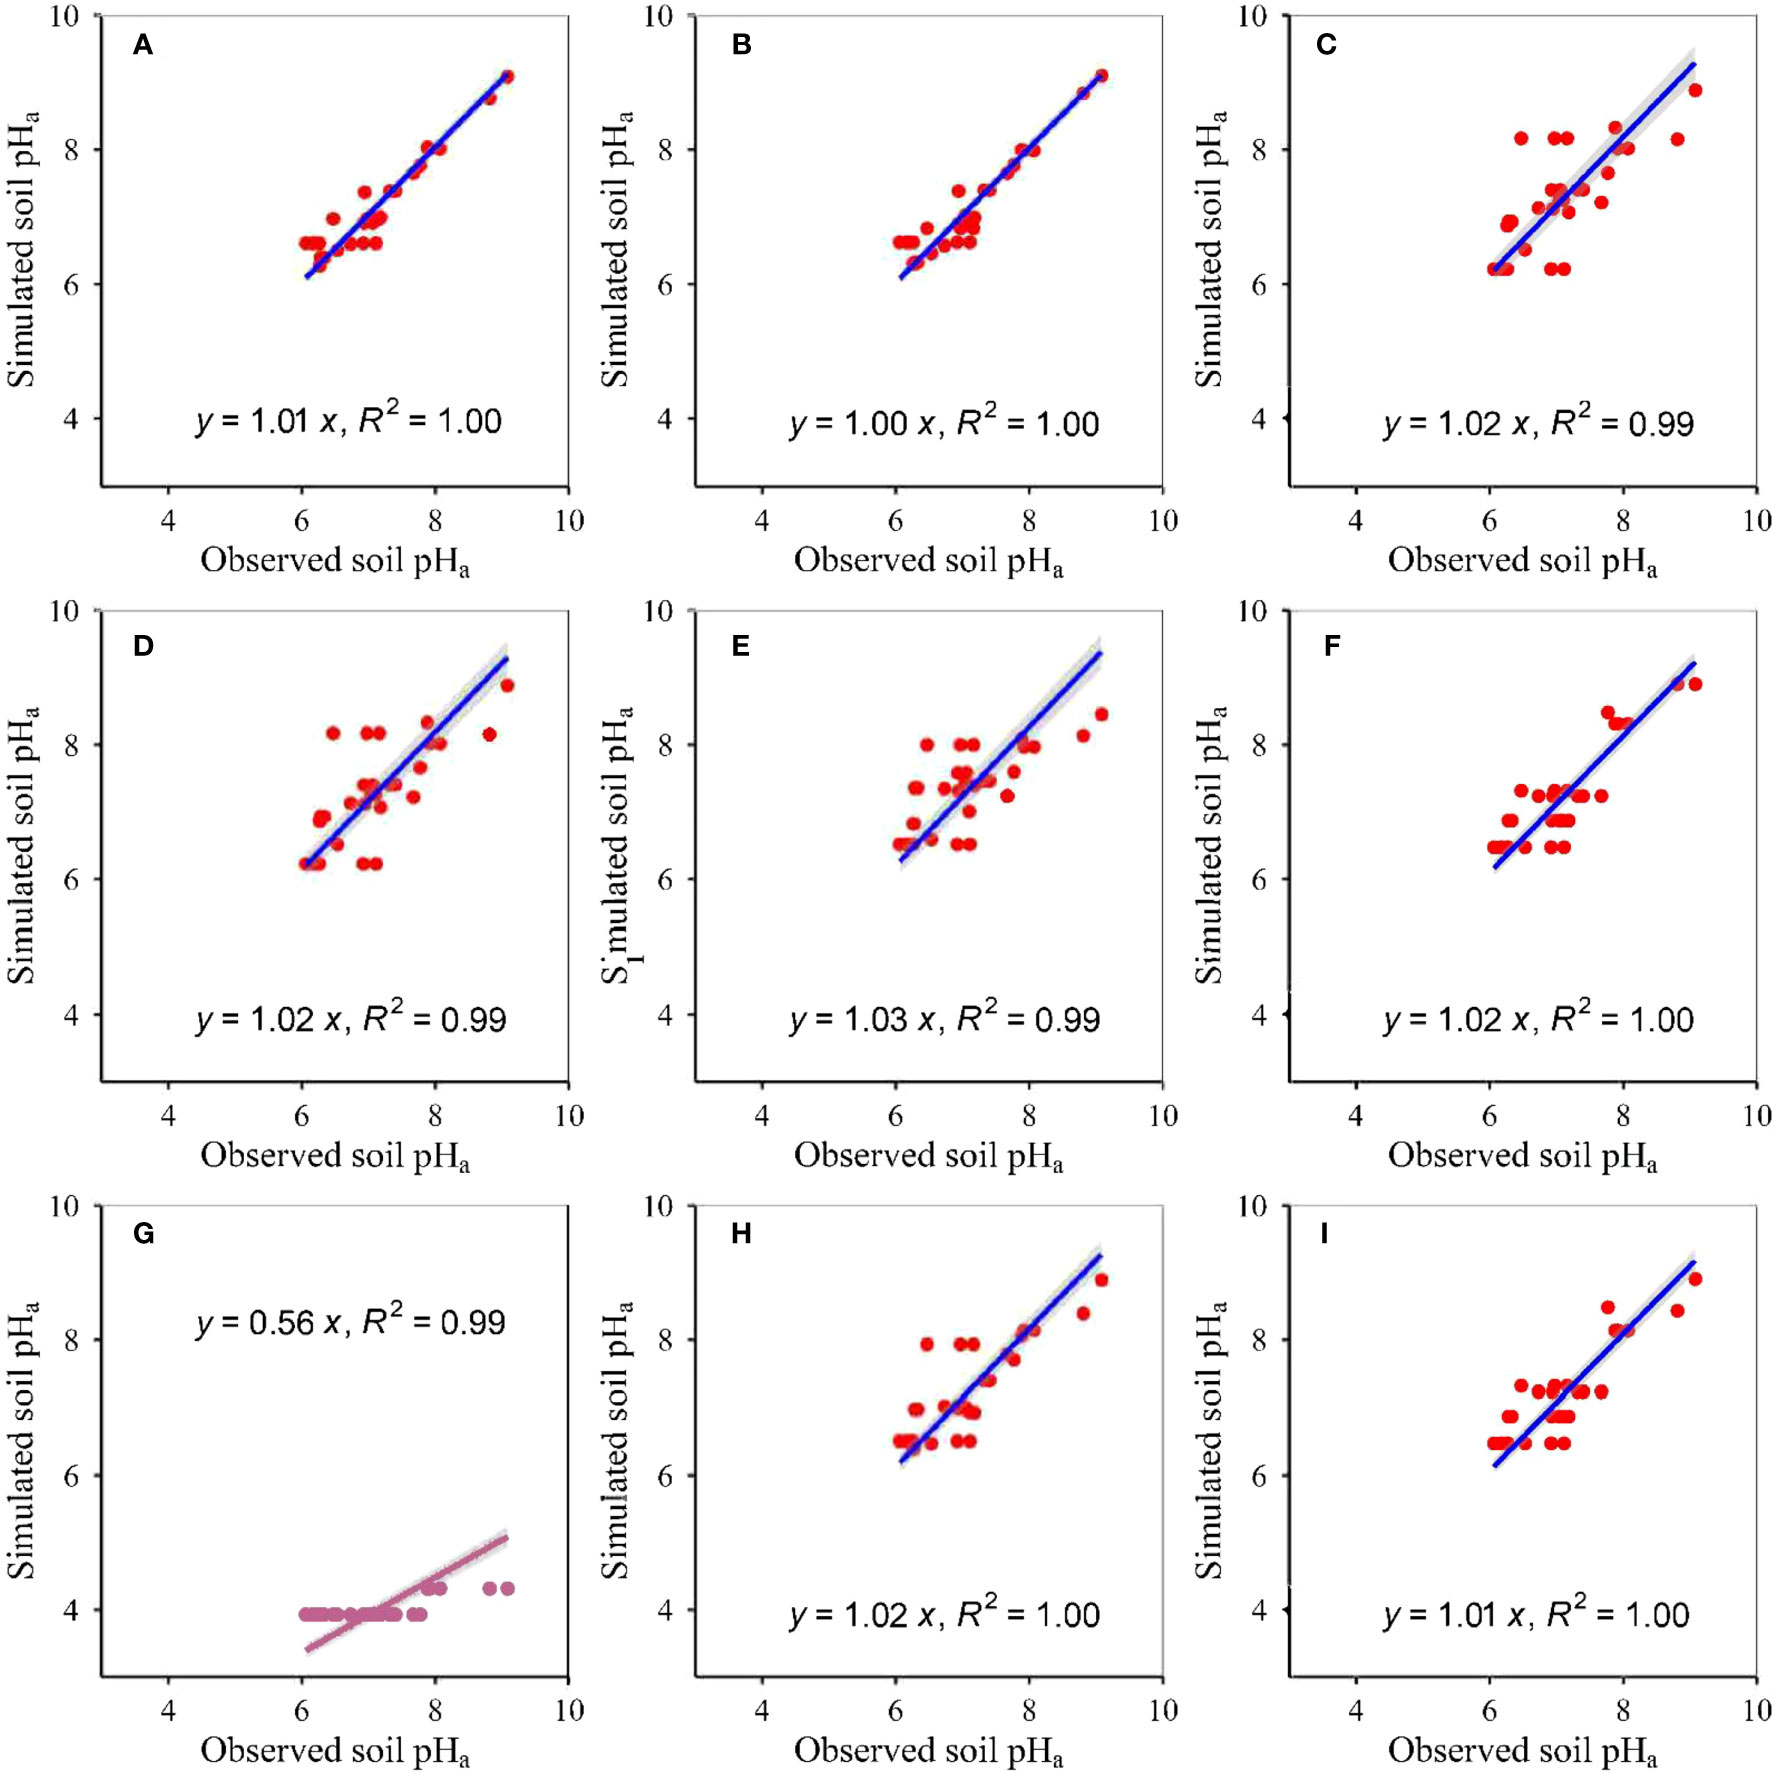
Figure 6 Relationships between modelled and measured actual soil pH at 20–30 cm (p<0.05) for (A) RF, (B) GBR, (C) MLR, (D) ANN, (E) GLR, (F) CIT, (G) eXGB, (H) SVM, and (I) RRT, respectively. The solid lines represent the linear fitting lines between modelled and measured soil pH. RF, random-forest; GBR, generalized-boosted; MLR, multiple-linear; ANN, artificial-neural-network; GLR, generalized-linear; CIT, conditional-inference-tree; eXGB, eXtreme-gradient-boosting; SVM, support-vector-machine; RRT, recursive-tree.
4 Discussion
Compared to the MLR and RRT methods, meteorological data and NDVImax on the basis of the RF method had greater explanation abilities of soil pH. This phenomenon was similar to some previous studies conducted in grassland areas of Tibet (Han et al., 2022; Tian and Fu, 2022; Wang and Fu, 2023). Moreover, the developed RF and RRT models had the greater explanation abilities of soil pH than previous studies, but the developed MLR models had nearly equal explanatory abilities of soil pH than previous studies (Ji et al., 2014). Therefore, compared with the MLR and RRT methods, the RF method can have greater explanation abilities of environmental variables (at least for soil pH and moisture, plant α-diversity, herbage nutritional quality and production) in grassland areas of the Tibet (Han et al., 2022; Tian and Fu, 2022; Wang and Fu, 2023).
The support vector numbers of the developed SVM models were lower than the tree numbers of the developed RF models (Table 1). This finding was in consistent with two earlier studies (Han et al., 2022; Wang and Fu, 2023), but quite contrast with another one previous study (Tian and Fu, 2022). The tree numbers of the developed GBR models were higher than those of the developed RF models (Table 1), which was in line with two earlier studies (Tian and Fu, 2022; Wang and Fu, 2023). Moreover, the tree numbers of the developed RF and GBR models were not equal to the default value (i.e., 500 of the randomForest package and 100 of the gbm package in 4.2.1, respectively). This phenomenon was similar to earlier studies (Han et al., 2022; Tian and Fu, 2022; Wang and Fu, 2023). Therefore, default values of tree numbers were not the best choice, at least for soil pH and moisture, plant α-diversity, herbage nutritional quality and production in grassland areas of the Tibet (Han et al., 2022; Tian and Fu, 2022; Wang and Fu, 2023). The computational speed and model complexity varied with environmental variables and methods (Tian and Fu, 2022).
The developed RF models of soil pH had the highest accuracy, but the developed eXGB models of soil pH had the lowest accuracy amongst the nine methods (Table 3, Figures 1–6). The phenomenon was similar to earlier studies which revealed that the developed RF models of plant α-diversity, herbage nutritional quality and production and soil moisture had the better performance than the other approaches in grassland areas of Tibet (Han et al., 2022; Tian and Fu, 2022; Wang and Fu, 2023). This finding was supported by the following facts/causes. First, similar to earlier research (Han et al., 2022; Tian and Fu, 2022; Wang and Fu, 2023), slopes between the modelled soil pH on the basis of the RF models and measured soil pH were the nearest to 1 amongst the nine methods (Figures 1–6). Second, similar to earlier studies (Han et al., 2022; Tian and Fu, 2022), RMSE values and absolute values of relative deviation between modelled soil pH on the basis of RF models and measured soil pH were generally the lowest for most cases (Table 3). Third, similar to earlier research (Han et al., 2022; Tian and Fu, 2022), the situation where one model value correspond to multiple measurements was relative lower for the developed RF models of soil pH (Figures 1–6). Fourth, similar to earlier research (Han et al., 2022; Tian and Fu, 2022), the scatter was relatively and closely around the 1:1 line for the developed RF models of soil pH (Figures 1–6). Fifth, the RF models did not assume that the relationships between soil pH and independent variables (AT, AP, ARad, NDVImax) were linear. The relative optimum mixture of parameters ntree and mtry, and randomness character of the RF method may further ensure the relatively higher accuracies of the developed RF models in estimating soil pH. Therefore, the developed RF models can be used to estimate soil pH from AT, AP, ARad and/or NDVImax, at least for grassland areas of the Tibet.
The predicted accuracies of soil pH based on the developed RF models in this study were greater than those reported by earlier studies (Shi et al., 2009; Holmberg et al., 2018; Hong et al., 2019; Odhiambo et al., 2020; Carrillo et al., 2022). For example, the simulated soil pH based on random forest or XGBoost can only explain about 70–72% variation with RMSE of 0.71–0.73 in observed soil pH in China (Chen et al., 2019). The simulated soil pH based on artificial neural network can only explain about 92% variation in observed soil pH in Chinese vegetable fields (Wang et al., 2022). The simulated soil pH based on artificial neural network, support vector machine, ridge regression and geographic weighted regression explained about 12.04–97.33% variation in observed soil pH in the Yinbei area of Ningxia, China (Jia et al., 2021). Compared to this study, the numbers of model parameters in some previous studies are much larger (Chen et al., 2019; Wang et al., 2022). Moreover, the model accuracies of soil pH simulated from three parameters were not always lower than those simulated from four parameters. Therefore, more model parameters do not always lead to higher accuracy of soil pH. It is better to elevate simulation accuracy of soil pH by screening methods than to increase the simulation accuracy of soil pH by introducing more variables.
5 Conclusions
In general, this study was the first study which estimated soil pHp and pHa at three soil depths (i.e., 0–10, 10–20, and 20–30 cm) on the basis of nine methods in grasslands of the Tibet. Three independent variables (i.e., AT, AP, ARad) were used to estimate the pHp. Four independent variables (i.e., AT, AP, ARad and NDVImax) were used to estimate the pHa. The nine methods had different performances in estimating soil pH, and the developed RF models had the better performance than the other eight methods. Measured soil pH can be nearly 100% explained by modelled soil pH on the basis of the RF, GBR, SVM and RRT models, and about 99% explained by modelled soil pH on the basis of the MLR, ANN, GLR and eXGB models. Modelled soil pH on the basis of the CIT models explained about 99–100% variation of measured soil pH. The slopes between modelled and measured soil pH were 0.96–1.03 for all the nine methods. The slopes (i.e., 0.99–1.01) between modelled soil pH on the basis of the RF models and measured soil pH were the nearest to 1 amongst the nine methods. The RMSE values (i.e., ≤ 0.28) between modelled soil pH on the basis of the RF models and measured soil pH were the lowest. In contrast, the RMSE values (i.e., ≤ 3.94) between modelled soil pH on the basis of the eXGB models and measured soil pH were the highest. The absolute values of relative deviation between measured soil pH and modelled soil pH on the basis of eXGB, GLR, RF and GBR models were ≤ 47.87%, ≤ 3.87%, ≤ 1.26% and ≤ 1.72%, respectively, and those on the basis of the other methods were ≤ 2.74%. Accordingly, climate data and NDVI cannot always quantify the variation of observed pH, which were relied on the algorithm chosen. The suggested RF models of soil pH can be used to obtain soil pH of the whole Qinghai-Tibet Plateau grassland in the past decades or even the next hundred years, which can be benefit for soil pH management. For example, soil acidification and salinization under global change can be helped by the suggested RF models of soil pH. The suggested RF models of potential and actual soil pH can be also used to quantify the relative influences of climatic change and humankind activities on soil pH.
Data availability statement
The original contributions presented in the study are included in the article/Supplementary Material. Further inquiries can be directed to the corresponding author.
Author contributions
Conceptualization, GF and ED. Methodology, GF. Software, ED. Validation, GF. Formal analysis, GF and ED. Investigation, GZ. Resources, ED. Data curation, GF. Writing—original draft preparation, GF and ED. Writing—review and editing, GF and ED. Visualization, ED. Supervision, ED. Project administration, ED. Funding acquisition, ED. All authors contributed to the article and approved the submitted version.
Funding
The study was funded by the Youth Innovation Promotion Association of Chinese Academy of Sciences [2020054], Tibet Autonomous Region Science and Technology Project [XZ202301YD0012C; XZ202202YD0009C; XZ202201ZY0003N; XZ202101ZD0007G; XZ202101ZD0003N] and Construction of Zhongba County Fixed Observation and Experiment Station of first Support System for Agriculture Green Development.
Conflict of interest
The authors declare that the research was conducted in the absence of any commercial or financial relationships that could be construed as a potential conflict of interest.
Publisher’s note
All claims expressed in this article are solely those of the authors and do not necessarily represent those of their affiliated organizations, or those of the publisher, the editors and the reviewers. Any product that may be evaluated in this article, or claim that may be made by its manufacturer, is not guaranteed or endorsed by the publisher.
Supplementary material
The Supplementary Material for this article can be found online at: https://www.frontiersin.org/articles/10.3389/fevo.2023.1206581/full#supplementary-material
References
Baumann F., He J. S., Schmidt K., Kuhn P., Scholten T. (2009). Pedogenesis, permafrost, and soil moisture as controlling factors for soil nitrogen and carbon contents across the Tibetan Plateau. Global Change Biol. 15, 3001–3017. doi: 10.1111/j.1365-2486.2009.01953.x
Carrillo V. C., Heenkenda M. K., Nelson R., Sahota T. S., Serrano L. S. (2022). Deep learning in land-use classification and geostatistics in soil pH mapping: a case study at Lakehead University Agricultural Research Station, Thunder Bay, Ontario, Canada. J. Appl. Remote. Sens 16. doi: 10.1117/1.JRS.16.034519
Chen S. C., Liang Z. Z., Webster R., Zhang G. L., Zhou Y., Teng H. F., et al. (2019). A high-resolution map of soil pH in China made by hybrid modelling of sparse soil data and environmental covariates and its implications for pollution. Sci. Total Environ. 655, 273–283. doi: 10.1016/j.scitotenv.2018.11.230
Cortez P. (2010). “Data mining with neural networks and support vector machines using the r/rminer tool,” in 10th Industrial Conference on Data Mining, Berlin, GERMANY. 572–583.
Dlamini P., Chivenge P., Chaplot V. (2016). Overgrazing decreases soil organic carbon stocks the most under dry climates and low soil pH: a meta-analysis shows. Agr. Ecosyst. Environ. 221, 258–269. doi: 10.1016/j.agee.2016.01.026
Fernandez-Calvino D., Rousk J., Brookes P. C., Baath E. (2011). Bacterial pH-optima for growth track soil pH, but are higher than expected at low pH. Soil Biol. Biochem. 43, 1569–1575. doi: 10.1016/j.soilbio.2011.04.007
Freund Y., Schapire R. E. (1997). A decision-theoretic generalization of on-line learning and an application to boosting. J. Comput. System Sci. 55, 119–139. doi: 10.1006/jcss.1997.1504
Fu G., Shen Z. X. (2017). Response of alpine soils to nitrogen addition on the Tibetan Plateau: a meta-analysis. Appl. Soil Ecol. 114, 99–104. doi: 10.1016/j.apsoil.2017.03.008
Fu G., Shen Z. X., Zhang X. Z., Shi P. L., Zhang Y. J., Wu J. S. (2011). Estimating air temperature of an alpine meadow on the Northern Tibetan Plateau using MODIS land surface temperature. Acta Ecol. Sin. 31, 8–13. doi: 10.1016/j.chnaes.2010.11.002
Fu G., Wang J., Li S. (2022). Response of forage nutritional quality to climate change and human activities in alpine grasslands. Sci. Total Environ. 845. doi: 10.1016/j.scitotenv.2022.157552
Fu G., Wang J., Li S., He P. (2021). Responses of forage nutrient quality to grazing in the alpine grassland of Northern Tibet. Acta Prataculturae Sin. 30, 38–50.
Han F., Fu G., Yu C., Wang S. (2022). Modeling nutrition quality and storage of forage using climate data and normalized-difference vegetation index in alpine grasslands. Remote Sens 14. doi: 10.3390/rs14143410
Holmberg M., Aherne J., Austnes K., Beloica J., De Marco A., Dirnbock T., et al. (2018). Modelling study of soil C, N and pH response to air pollution and climate change using European LTER site observations. Sci. Total Environ. 640, 387–399. doi: 10.1016/j.scitotenv.2018.05.299
Hong S. B., Gan P., Chen A. P. (2019). Environmental controls on soil pH in planted forest and its response to nitrogen deposition. Environ. Res. 172, 159–165. doi: 10.1016/j.envres.2019.02.020
Hong S. B., Piao S. L., Chen A. P., Liu Y. W., Liu L. L., Peng S. S., et al. (2018). Afforestation neutralizes soil pH. Nat. Commu 9. doi: 10.1038/s41467-018-02970-1
Huang X. Z., Cui C., Hou E. Q., Li F. B., Liu W. J., Jiang L. F., et al. (2022). Acidification of soil due to forestation at the global scale. For. Ecol. Manage. 505. doi: 10.1016/j.foreco.2021.119951
Ji C. J., Yang Y. H., Han W. X., He Y. F., Smith J., Smith P. (2014). Climatic and edaphic controls on soil pH in alpine grasslands on the Tibetan Plateau, China: a quantitative analysis. Pedosphere 24, 39–44. doi: 10.1016/S1002-0160(13)60078-8
Jia P. P., Shang T. H., Zhang J. H., Sun Y. (2021). Inversion of soil pH during the dry and wet seasons in the Yinbei region of Ningxia, China, based on multi-source remote sensing data. Geoderma Regional 25. doi: 10.1016/j.geodrs.2021.e00399
Mao Y. M., Sang S. X., Liu S. Q., Jia J. L. (2014). Spatial distribution of pH and organic matter in urban soils and its implications on site-specific land uses in Xuzhou, China. Comptes Rendus Biologies 337, 332–337. doi: 10.1016/j.crvi.2014.02.008
Odhiambo B. O., Kenduiywo B. K., Were K. (2020). Spatial prediction and mapping of soil pH across a tropical afro-montane landscape. Appl. Geogr. 114. doi: 10.1016/j.apgeog.2019.102129
Palpurina S., Wagner V., von Wehrden H., Hajek M., Horsak M., Brinkert A., et al. (2017). The relationship between plant species richness and soil pH vanishes with increasing aridity across Eurasian dry grasslands. Global Ecol. Biogeogr. 26, 425–434. doi: 10.1111/geb.12549
Paul K., Black S., Conyers M. (2001). Development of nitrogen mineralisation gradients through surface soil depth and their influence on surface soil pH. Plant Soil 234, 239–246. doi: 10.1023/A:1017904613797
Puissant J., Jones B., Goodall T., Mang D. N., Blaud A., Gweon H. S., et al. (2019). The pH optimum of soil exoenzymes adapt to long term changes in soil pH. Soil Biol. Biochem. 138. doi: 10.1016/j.soilbio.2019.107601
Shi W. J., Liu J. Y., Du Z. P., Song Y. J., Chen C. F., Yue T. X. (2009). Surface modelling of soil pH. Geoderma 150, 113–119. doi: 10.1016/j.geoderma.2009.01.020
Sikora F. J., Howe P., Reid D., Morgan D., Zimmer E. (2011). Adopting a robotic pH instrument for soil and soil-buffer pH measurements in a soil test laboratory. Commun. Soil Sci. Plant Anal. 42, 617–632. doi: 10.1080/00103624.2011.550371
Sun W., Li S., Wang J., Fu G. (2021). Effects of grazing on plant species and phylogenetic diversity in alpine grasslands, Northern Tibet. Ecol. Eng. 170. doi: 10.1016/j.ecoleng.2021.106331
Sun W., Li S., Zhang G., Fu G., Qi H., Li T. (2023). Effects of climate change and anthropogenic activities on soil pH in grassland regions on the Tibetan Plateau. Global Ecol. Conserv. 45. doi: 10.1016/j.gecco.2023.e02532
Tian Y., Fu G. (2022). Quantifying plant species α-diversity using normalized difference vegetation index and climate data in alpine grasslands. Remote Sens 14. doi: 10.3390/rs14195007
Veresoglou S. D., Voulgari O. K., Sen R., Mamolos A. P., Veresoglou D. S. (2011). Effects of nitrogen and phosphorus fertilization on soil pH-plant productivity relationships in upland grasslands of Northern Greece. Pedosphere 21, 750–752. doi: 10.1016/S1002-0160(11)60178-1
Wang S., Fu G. (2023). Modelling soil moisture using climate data and normalized difference vegetation index based on nine algorithms in alpine grasslands. Front. Environ. Sci. 11. doi: 10.3389/fenvs.2023.1130448
Wang S. B., Hu K. L., Feng P. Y., Qin W., Leghari S. J. (2022). Determining the effects of organic manure substitution on soil pH in Chinese vegetable fields: a meta-analysis. J. Soil Sediment. doi: 10.1007/s11368-022-03330-9
Wang J., Yu C., Fu G. (2021a). Warming reconstructs the elevation distributions of aboveground net primary production, plant species and phylogenetic diversity in alpine grasslands. Ecol. Indic 133. doi: 10.1016/j.ecolind.2021.108355
Wang J. W., Yu C. Q., Fu G. (2021b). Asymmetrical warming between elevations may result in similar plant community composition between elevations in alpine grasslands. Front. Ecol. Evol. doi: 10.3389/fevo.2021.757943
Wuest S. B. (2015). Seasonal variation in soil bulk density, organic nitrogen, available phosphorus, and pH. Soil Sci. Soc Am. J. 79, 1188–1197. doi: 10.2136/sssaj2015.02.0066
Yu C. Q., Han F. S., Fu G. (2019). Effects of 7 years experimental warming on soil bacterial and fungal community structure in the Northern Tibet alpine meadow at three elevations. Sci. Total Environ. 655, 814–822. doi: 10.1016/j.scitotenv.2018.11.309
Zha X. J., Tian Y., Ouzhu, Fu G. (2022). Response of forage nutrient storages to grazing in alpine grasslands. Front. Plant Sci. doi: 10.3389/fpls.2022.991287
Zhang H., Fu G. (2021). Responses of plant, soil bacterial and fungal communities to grazing vary with pasture seasons and grassland types, Northern Tibet. Land Degrad. Dev. 32, 1821–1832. doi: 10.1002/ldr.3835
Zhang H., Li S., Zhang G., Fu G. (2020). Response of soil microbial communities to warming and clipping in alpine meadows in Northern Tibet. Sustainability 12. doi: 10.3390/su12145617
Zhang G., Shen Z., Fu G. (2021). Function diversity of soil fungal community has little exclusive effects on the response of aboveground plant production to experimental warming in alpine grasslands. Appl. Soil Ecol. 168. doi: 10.1016/j.apsoil.2021.104153
Keywords: soil quality, soil degradation, random-forest, global change, alpine region
Citation: Dai E, Zhang G, Fu G and Zha X (2023) Can meteorological data and normalized difference vegetation index be used to quantify soil pH in grasslands? Front. Ecol. Evol. 11:1206581. doi: 10.3389/fevo.2023.1206581
Received: 16 April 2023; Accepted: 29 June 2023;
Published: 12 July 2023.
Edited by:
Quan-Xing Liu, Shanghai Jiao Tong University, ChinaReviewed by:
Huakun Zhou, Chinese Academy of Sciences (CAS), ChinaYu Liu, Northwest A&F University, China
Copyright © 2023 Dai, Zhang, Fu and Zha. This is an open-access article distributed under the terms of the Creative Commons Attribution License (CC BY). The use, distribution or reproduction in other forums is permitted, provided the original author(s) and the copyright owner(s) are credited and that the original publication in this journal is cited, in accordance with accepted academic practice. No use, distribution or reproduction is permitted which does not comply with these terms.
*Correspondence: Gang Fu, ZnVnYW5nQGlnc25yci5hYy5jbg==
 Erfu Dai
 Guangyu Zhang1
 Gang Fu
 Xinjie Zha