 Tianyou Zhang1
 Zhi Chen2,3,4
 Cuicui Jiao5
 Weikang Zhang2Lang Han6
 Zheng Fu7Zhongyi Sun8
 Zhaogang Liu2,3
 Zhongming Wen1Guirui Yu2,3,4*
- 1College of Grassland Agriculture, Northwest A&F University, Xianyang, Shaanxi, China
- 2Key Laboratory of Ecosystem Network Observation and Modeling, Institute of Geographic Sciences and Natural Resources Research, Chinese Academy of Sciences, Beijing, China
- 3College of Resources and Environment, University of Chinese Academy of Sciences, Beijing, China
- 4Yanshan Earth Critical Zone and Surface Fluxes Research Station, University of Chinese Academy of Sciences, Beijing, China
- 5College of Economics, Sichuan University of Science and Engineering, Yibin, China
- 6Institute of Surface-Earth System Science, School of Earth System Science, Tianjin University, Tianjin, China
- 7Laboratoire des Sciences du Climat et de l’Environnement, LSCE/IPSL, CEA-CNRS-UVSQ, Université Paris-Saclay, Gif-sur-Yvette, France
- 8College of Ecology and Environment, Hainan University, Haikou, China
In the face of accelerated global dryland expansion and grassland degradation, signaling grassland ecosystem state transitions is an ongoing challenge in ecology. However, there is still a lack of effective indicators and understanding of the mechanisms of grassland ecosystem state transitions at the continental scale. Here, we propose a framework that links ecosystem function-based indicators and critical slowing down (CSD) theory to reveal grassland state transitions. Across precipitation gradients, we quantified the statistical characteristics and spatial patterns in ANPP and PUE dynamics (variability, asymmetry, and sensitivity to precipitation and temperature) in Eurasian grasslands. We show that the CVANPP, CVPUE, AANPP, APUE, SPUE-P, and SANPP-P of temperate steppes were significantly higher than those of alpine steppes, while the SPUE-T and SANPP-T were the inverse. In temperate grasslands, AANPP, APUE, and SANPP-P indicated the transition of typical steppes, and CVANPP, APUE, and SPUE-T indicated the transition from meadow to typical steppes. In alpine grasslands, APUE indicated the transition between alpine deserts and alpine steppes, and AANPP and SANPP-P indicated the transition between alpine steppes and meadow steppes. The interannual variability of precipitation strongly affected xerophyte proportion and demographic processes, which control state transitions in low-resilience grasslands. Community structures and limiting factors (nutrient, light, and/or temperature) regulate state transitions in high-resilience grasslands. Our results demonstrate that function-based indicators are predictive of impending state transitions of temperate and alpine grasslands, highlighting the complementation of ANPP and PUE dynamics that have the potential for predicting grassland ecosystem regime shifts and their underlying mechanisms.
1 Introduction
With the impacts of global warming and human activities, planetary boundaries have already been overstepped (Lenton et al., 2019; Lade et al., 2020). Climate factors are undergoing abrupt change at different spatiotemporal scales (Wang et al., 2020; Duffy et al., 2021). With global warming-accelerated drying, dryland ecosystems risk regime shifts without warning in structural and functional states and recovery from perturbations requires more time (Arani et al., 2021; Rietkerk et al., 2021). As one of the main types of terrestrial ecosystem, grassland ecosystems maintain the habitat for various wildlife and contribute to human well-being (Berdugo et al., 2020; Bardgett et al., 2021). However, grassland ecosystems are sensitive to climate change and face increasing risk of state transitions, which could have catastrophic impacts on ecosystem services (Berdugo et al., 2020; Maurer et al., 2020; Dietz et al., 2021). Therefore, indicators to predict state transitions and explore the underlying ecological mechanisms are necessary to cope with the regime shifts of grassland ecosystems caused by global climate change.
State transitions occur in a system when it is forced outside the basin of attraction of the original state, allowing a perturbation to trigger self-propelled change toward a contrasting state (Liu et al., 2019; Rietkerk et al., 2021). This phenomenon has been extensively applicated in ecological research, such as the sudden collapse of coral ecosystems (Hughes et al., 2018), the rapid degradation of arid ecosystems (Berdugo et al., 2020), and lake eutrophication (Liu et al., 2017; Su et al., 2021). The critical slowing down (CSD) theory of dynamical systems has provided a theoretical foundation for understanding ecosystem state transitions (Scheffer et al., 2009). The theory suggests that ecosystems subject to low resilience, with high variability, asymmetry, and sensitivity to external environment perturbations, and those systems in a state near the critical threshold (tipping point) are most likely to undergo a state transition (Scheffer et al., 2009; Clements and Ozgul, 2018). Experimental perturbations and natural time series have demonstrated that CSD-based indicators (e.g., variability, asymmetry, and temporal autocorrelation) are useful metrics to serve as potential metrics of systems undergoing a state transition (Carpenter and Brock, 2006; Dakos et al., 2012; Hu et al., 2018). Consistent with the theory, eigenvalue, skewness, variability, sensitivity, and autocorrelation estimated from a state variable increase abruptly before a regime shift occurs (Ratajczak et al., 2018; Cheng et al., 2021; Liang et al., 2021). However, these metrics are directly derived from general theoretical expectations and, as such, lack a link to specific ecological mechanisms (Dakos et al., 2015; Hu et al., 2022). Exploring useful indicators and ecological mechanisms in practice remains a big challenge for those concerned about implementing effective coping measures.
Aboveground net primary productivity (ANPP), as a principal ecosystem function, determines energy flow and facilitates carbon-water cycles within ecosystems (Haberl et al., 2014). ANPP dynamics (e.g., inter-annual variability and asymmetric and climatic sensitivity) have been used as indicators, identifying state transitions caused by demographic and limiting factors at the regional scale (Scheffer et al., 2009; Hu et al., 2018). Recent research has provided empirical support for the usefulness of ANPP dynamics as metrics of state transitions in grassland and forest ecosystems (Hu et al., 2018; Liu et al., 2019). Precipitation-use efficiency (PUE), as an aspect of ecosystem function–environment (Hu et al., 2022), represents the adaptive strategies of xerophyte proportion changes to cope with precipitation resource changes, especially in grassland ecosystems (Hu et al., 2010; Gherardi and Sala, 2019; Zhang et al., 2021). Therefore, PUE may be useful for identifying grassland state transitions. We suppose that the complementation of ANPP and PUE dynamics probably has more potential to detect state transitions and understand the underlying ecological mechanisms of grassland ecosystems. However, we still lack the combination of ANPP and PUE dynamics to detect grassland state transitions and reveal the underlying ecological mechanisms at the continental scale.
Eurasian grasslands have a large and continuous spatial distribution, a wide range of environment gradients, and various types of grassland, which will serve as an indispensable and ideal natural laboratory for understanding the indicators of state transitions and shifting ecological mechanisms at the continental scale. Here, we present a framework connecting ANPP and PUE dynamics to detect the state transitions of grassland ecosystems (Figure 1). Our framework focuses on the spatial variation in ANPP and PUE dynamics for variability, asymmetry, and climatic sensitivity along with precipitation. In our study, we hypothesize that intensified precipitation restrictions will lead to ecosystem states approaching the critical threshold (i.e., tipping point) and trending toward the alternative state. If there is a peak point in the spatial pattern of the ANPP and PUE dynamics along the mean annual precipitation (MAP) and corresponding to the shift of grassland type, the dynamic indicators can serve as metrics for state transitions.
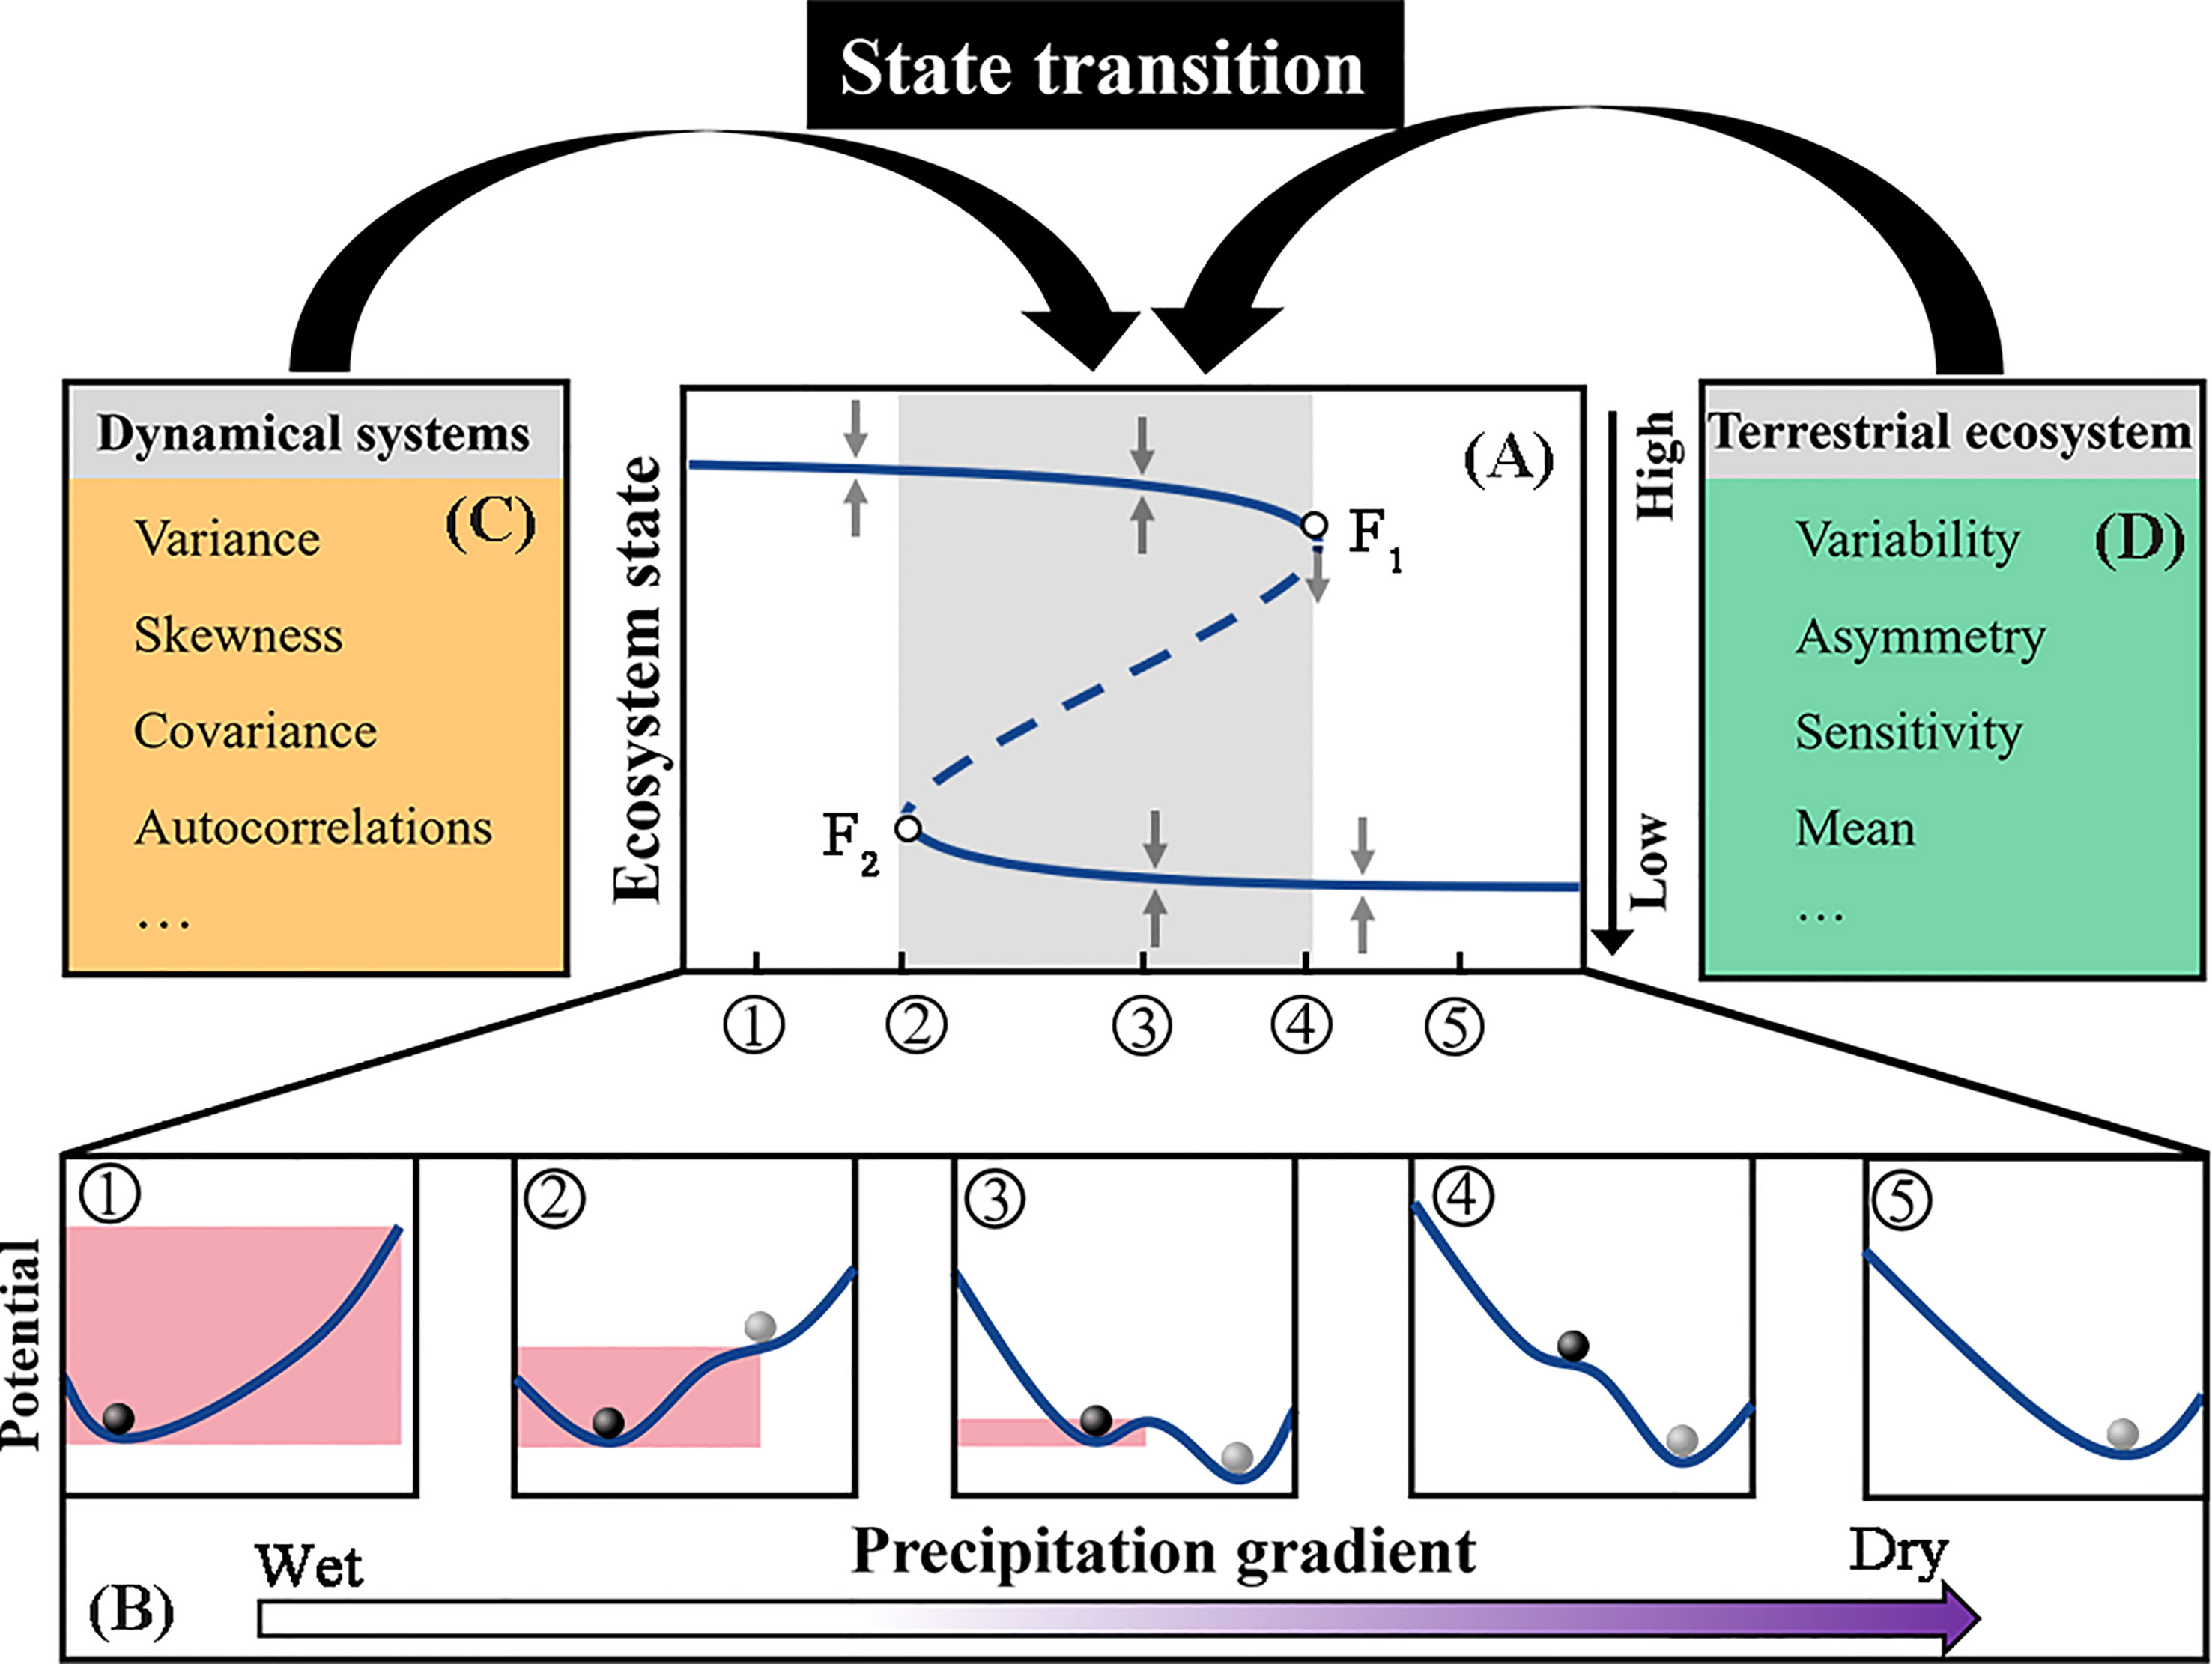
Figure 1 Schematic illustration of alternative stable states by means of ball-and-cup diagrams representing the stability properties at different external conditions. In (A), the upper branch represents one stable ecosystem state, and the lower branch represents another stable state. Ecosystems are in one state of the upper branch under external disturbances (φ). Ecosystems are in two transitional states under external disturbances (κ-μ), where, in ecosystem states near the tipping point (for example point F1 or point F2), minor disturbances may cause a significant shift. Ecosystems are in one state of a lower branch under external disturbances (⑤). (B) shows the corresponding ball-and-cup explanations of alternative stable states at the different external conditions from ① to ⑤. In (C), the temporal variance, skewness, covariance, and autocorrelation in state and functional variables serve as CSD state-based indicators of dynamical systems. In (D), we assume that these CSD function-based indicators (variability, asymmetry, and climatic sensitivity) can also potentially serve as metrics of state transitions in terrestrial ecosystems.
We integrated field surveys of ANPP, the long-term Normalized Difference Vegetation Index (NDVI), and annual precipitation to produce long-term ANPP and PUE datasets from 1982 to 2021, then calculated the ANPP and PUE dynamics (variability, asymmetry, and sensitivity to precipitation and temperature) at each pixel in Eurasian grasslands. The main objectives of this study were to identify: (1) the spatial pattern and statistical characteristics of ANPP and PUE dynamics for variability, asymmetry, and climatic sensitivity in Eurasian grasslands; (2) the spatial pattern of ANPP and PUE dynamics along the MAP in temperate and alpine grasslands; and (3) effective indicators of ANPP and PUE dynamics to detect state transitions of grassland ecosystems in Eurasia. Moreover, we aimed to understand the shifting ecological mechanisms underlying ANPP and PUE dynamics related to abiotic and biotic factors that could help optimize regional grassland management strategies for achieving sustainable development.
2 Materials and methods
2.1 Study area
The Eurasian grasslands are located in the middle latitude region of the Northern Hemisphere (30°N ~ 55°N, 30°E ~ 125°E) (Figure 2A). The precipitation and temperature gradients are from 70 mm to 1030 mm and −9 to 15°C, respectively (Zhang et al., 2020). We used the International Geosphere-Biosphere Program (IGBP) terrestrial ecoregions map (Olson et al., 2001), Moderate Resolution Imaging Spectroradiometer (MODIS) production (https://lpdaac.usgs.gov/), and vegetation classification map of China (http://www.geodata.cn/) to obtain the geographical extent and grassland types. Previous research showed that the response of ANPP and PUE to precipitation is distinct in water-limited temperate steppes and temperature-limited alpine grasslands (Guo et al., 2015; Zhang et al., 2020). We hypothesize that ANPP and PUE dynamics have contrasting spatial patterns with MAP in temperate and alpine grasslands, respectively. According to the geographical environment and plant compositions of Eurasian grasslands, they could be divided into two categories: temperate grasslands (i.e., temperate desert steppes (TDS), typical steppes (TTS), and meadow steppes (TMS)) and alpine grasslands (i.e., alpine desert steppes (ADS), alpine steppes (AS), and alpine meadow steppes (AMS)) (Figure 2A). Desert steppes are characterized by short shrubs, semi-shrubs, and low diversity (Zhang et al., 2016). Typical steppes are dominated by relatively meso-xerophytic species. Meadows are located in the sub-humid district and have the highest coverage and biodiversity, which is dominated by mesophyte species (Artemisia frigida, Agropyron cristatum and Stipa baicalensis, etc.) (Hu et al., 2018). Alpine desert steppes are characterized by xerophyte species (Ceratoides compacta and Stipa purpurea etc.) with low productivity. Alpine steppes and meadows are mainly composed of drought-resistant and hardy species (Alpine forbs, Carex moorcroftii, Stipa purpurea, etc.) (Yang et al., 2010). The grassland types have clear divides and represent different ecosystem states along the MAP (Figures 2B, C), allowing us to diagnose if there are signals in the ANPP and PUE dynamics that correspond to state transitions.
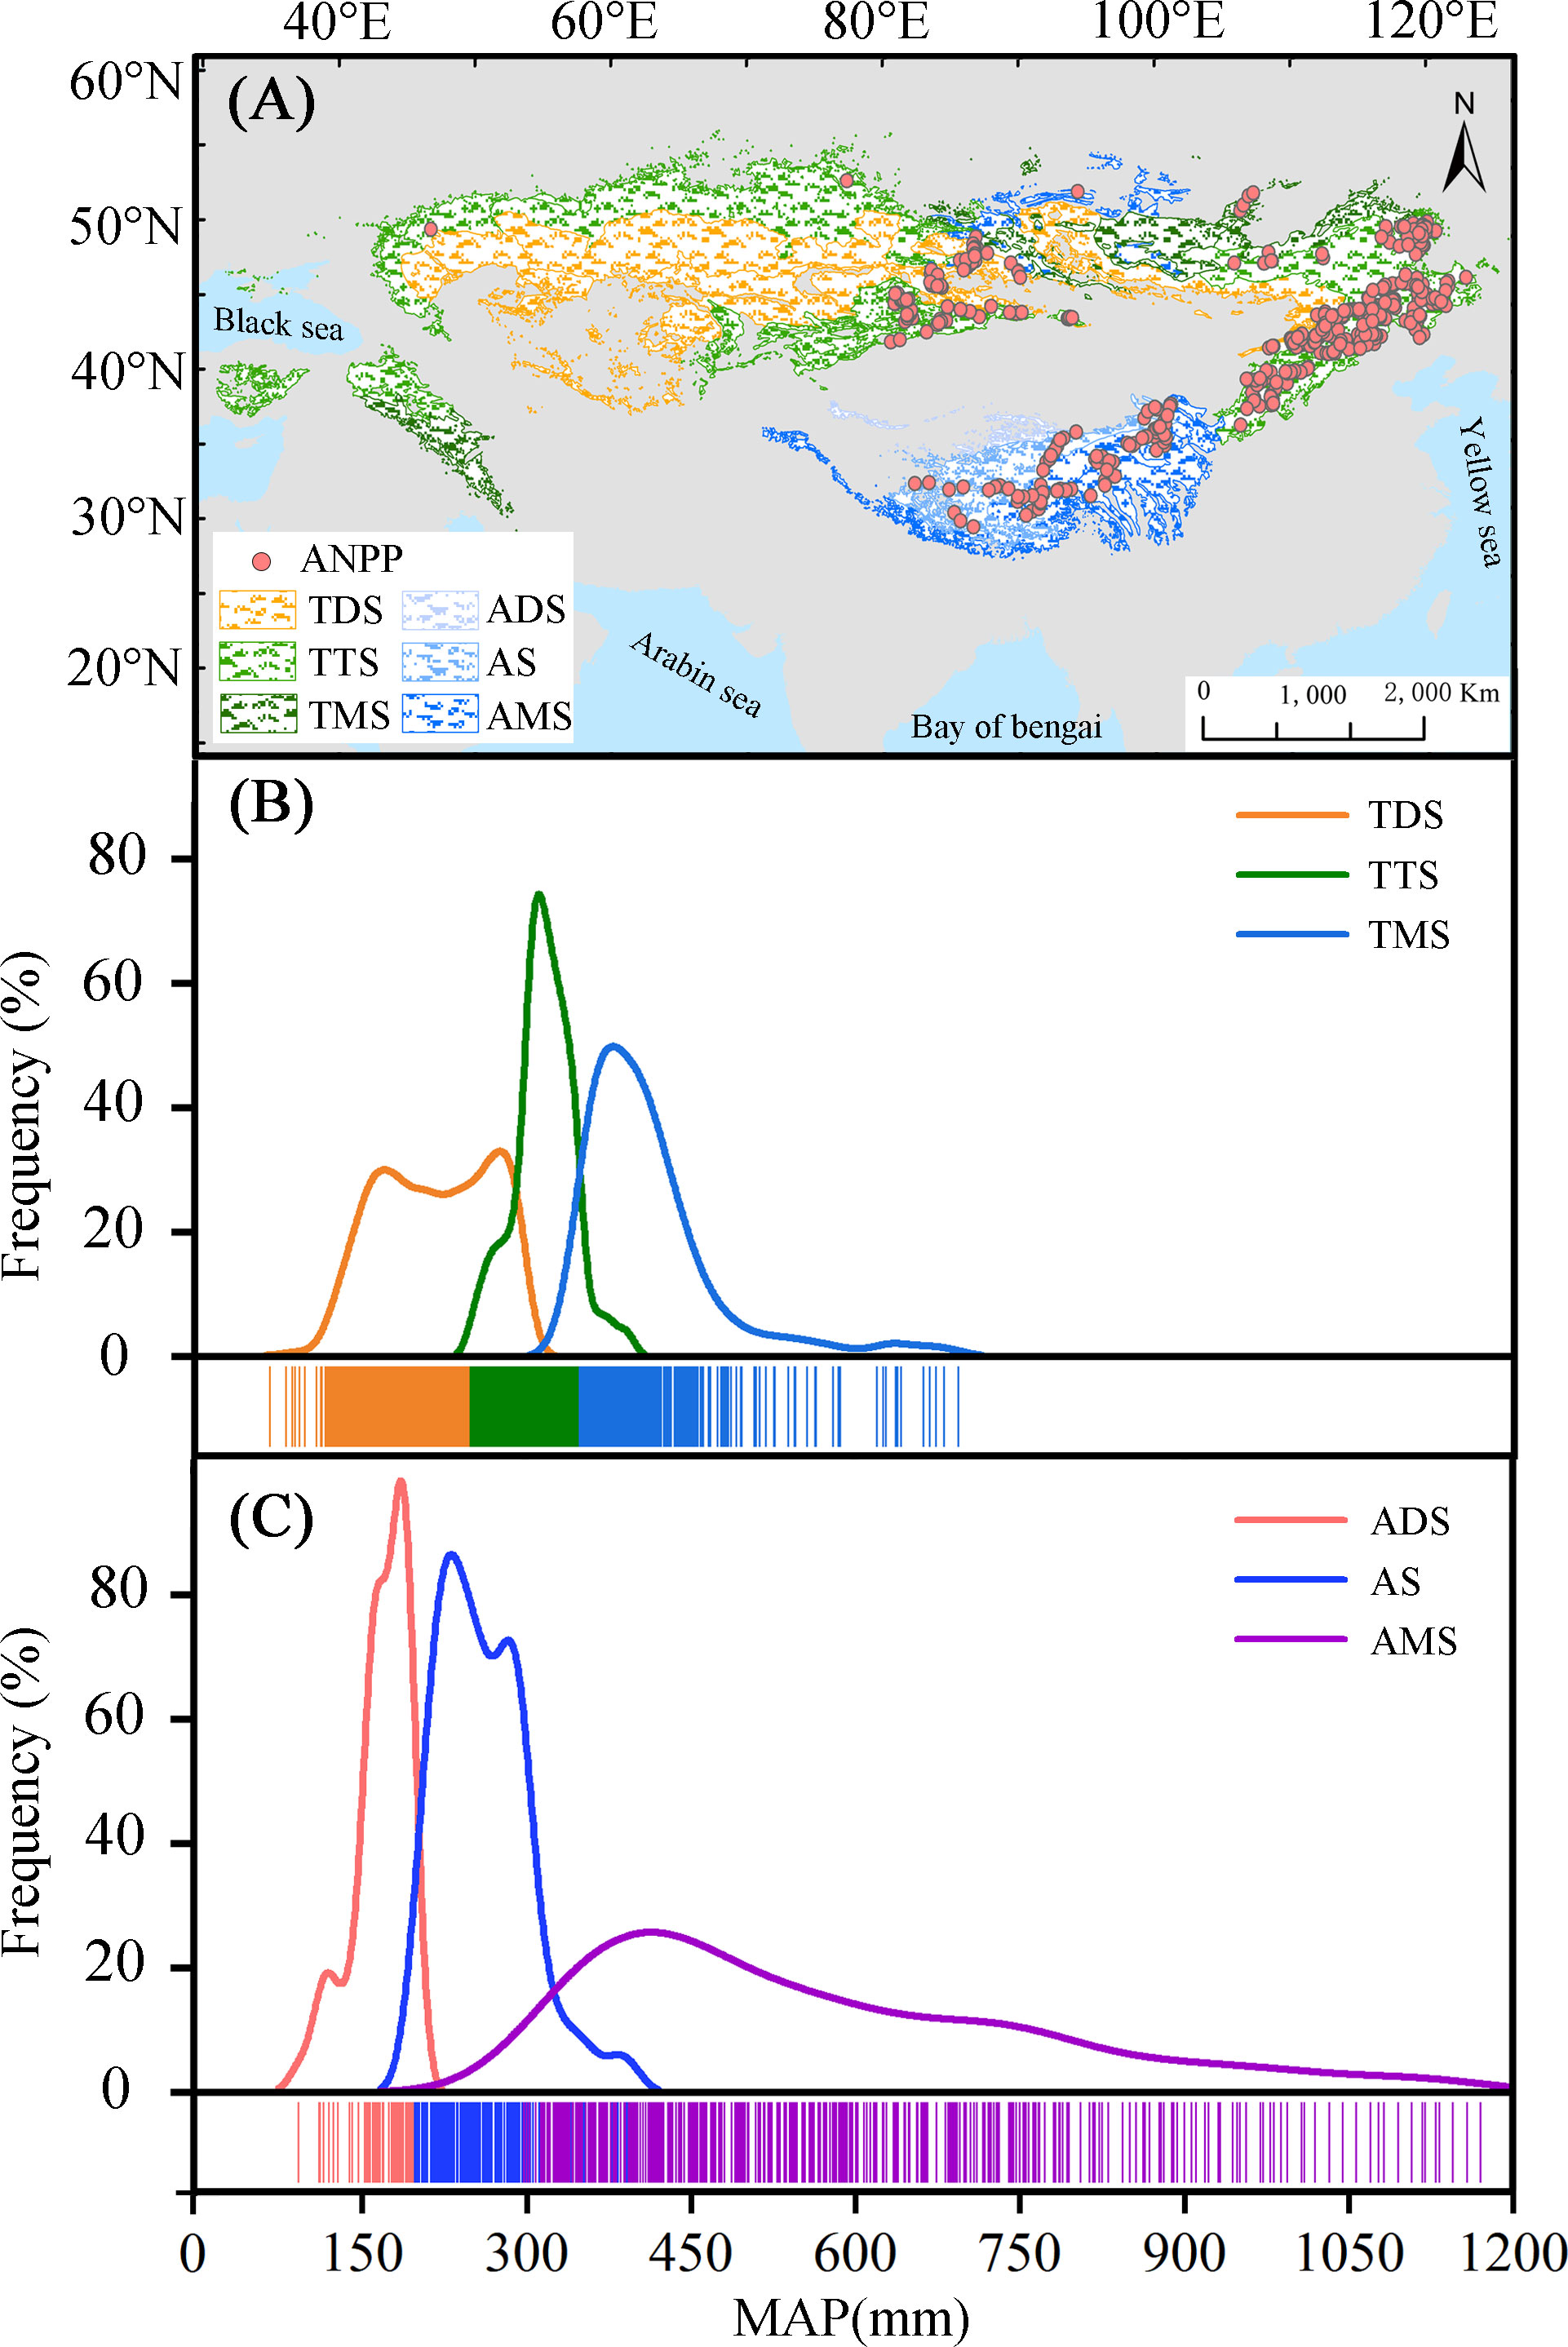
Figure 2 Spatial distributions of grassland types and measured aboveground net primary productivity (ANPP) (A); the frequency distributions of mean annual precipitation (MAP) in temperate grasslands (B) and alpine grasslands (C). TDS, TTS, TMS, ADS, AS, and AMS represent the six grassland types, i.e., temperate desert steppes, temperate typical steppes, temperate meadow steppes, alpine desert steppes, alpine steppes, and alpine meadow steppes, respectively.
2.2 In situ measured ANPP data
In this study, we collected three datasets of ANPP observations. This field sampling data approximates the ANPP of grassland ecosystems. The first ANPP dataset was extracted from published literature, in which the AGB was measured at 267 sites on the Eurasian grasslands during July and August of 2002–2004 (Yang et al., 2010). The second ANPP dataset was supported by the Ministry of Agriculture of China (Hu et al., 2010). A background survey was organized in the peak growing seasons of 1983–1995 to study the forage yield of the region, in which the ANPP was measured at 503 sites on the Eurasian grasslands. The third dataset was extracted from the Oak Ridge National Laboratory (ORNL) (seven sites) and obtained directly from field surveys (81 sites) (Jiao et al., 2017). A total of 858 sites were selected from three sources (Figure 2A), which were used to estimate the long-term ANPP remote sensing products in Eurasian grasslands.
2.3 ANPP and PUE estimations from remote sensing products
The Global Inventory Modeling and Mapping Studies Normalized Difference Vegetation Index (GIMMS NDVI) and Moderate Resolution Imaging Spectroradiometer NDVI (MODIS13A2) data were used to construct the empirical mode between ANPP measurements and their corresponding NDVI at the sites. Specifically, we used the biweekly NDVI with a spatial resolution of 8 km from the GIMMS group as derived from the Advanced Very High Resolution Radiometer (AVHRR) from 1982 to 2015 (http://ecocast.arc.nasa.gov/data/pub/gimms/3g.v1/). The preprocessing of GIMMS NDVI remote sensing images consisted of 15-day maximum-value compositions (MVC), corrected to reduce the effects of residual clouds, the solar zenith angle, viewing geometry, and atmospheric perturbations (Jiao et al., 2017; Chen et al., 2019).
The MODIS NDVI product (MOD13A2) comes from the National Aeronautics and Space Administration (NASA, https://lpdaacsvc.cr.usgs.gov), with a temporal resolution of 16 days and a spatial resolution of 1 km. The MODIS NDVI data were corrected for cloud cover, atmosphere, and solar elevation angle (Liu et al., 2022). The bilinear interpolation method was used to resample the data to the spatial resolution of the GIMMS NDVI (Parker et al., 1983). Previous studies showed that seasonally integrated NDVI are more direct measures of vegetation activity, and therefore, frequently estimate ANPP (Verma et al., 2014; Maurer et al., 2020). We compared and found that the GIMMS and MODIS NDVIint had some linearity errors in the years between 2004 and 2013 (Figure 3A). We established an empirical relationship between the GIMMS and MODIS NDVIint (R2 = 0.93) (Figure 3B). Then, we recalibrated the MODIS NDVIint and obtained the long-term NDVIint from 1982 to 2021 in the study area.

Figure 3 Comparisons NDVI between the GIMMS_NDVIint and MODIS_NDVIint from 1982 to 2021 in the entire Eurasian grasslands. (A) The time series of ANPP of the GIMMS_NDVIint and MODIS_NDVIint. (B) The linear relationships between ANPP of the GIMMS_NDVIint and MODIS_NDVIint from 2003 to 2013.
The NDVI is highly correlated to biomass across spatial scales and commonly used to estimate the quantities of vegetation ANPP in grasslands (Hu et al., 2018; Maurer et al., 2020). For these reasons, we established the relationship between ground-based measurements of ANPP and integrated NDVI during the growing season. A significant exponential relationship between measured ANPP and the corresponding integrated NDVI for the growing season was derived as (Figure 4):

Figure 4 Regression function between the NDVIint and measured ANPP.
With this relationship, ANPP was estimated for the entire study region based on long-term NDVI data from 1982 to 2021. The PUE was produced by the ratio of ANPP to the corresponding annual precipitation at each pixel during 1982 to 2021 in Eurasian grasslands (Zhang et al., 2021).
2.4 Precipitation and temperature data
The monthly precipitation and temperature data (0.5° × 0.5°) from 1982 to 2021 were obtained from the Climate Research Unit 4.06 dataset (CRU) (https://crudata.uea.ac.uk/cru/data/hrg/cru_ts_4.06/) (Harris et al., 2020). We calculated the annual precipitation and temperature from the monthly datasets. MAP was calculated as a multi-year averaged value from 1982 to 2021. The nearest neighbor interpolation method was used to resample the data to the spatial resolution of ANPP (8 km at the equator) for subsequent analysis (Parker et al., 1983).
2.5 ANPP and PUE dynamics for variability, asymmetry, and sensitivity
The ANPP and PUE dynamics for variability, asymmetry, and precipitation and temperature sensitivity were calculated based on the inter-annual ANPP and PUE data of the remote sensing products. The interannual variability in ANPP and PUE was calculated as the coefficient of variation in ANPP (CVANPP) and PUE (CVPUE), namely, the ratio of standard deviation of the mean with long-term ANPP and PUE at each pixel from 1982 to 2021 (Knapp and Smith, 2001; Hu et al., 2018), according to
where CV is the coefficient of variation, X is ANPP, PUE, t is the year from 1982 to 2021, and is mean value of variables.
Asymmetry (A) as an indicator is broadly analogous with skewness in system dynamics. With the disturbance of environmental factors, resilience decreases with increasing A (Wu et al., 2018; Al-Yaari et al., 2020). We estimated A as
where AX is the asymmetry of ANPP (AANPP) and PUE (APUE), Xmax is the maximum and Xmin is the minimum of ANPP and PUE during 1982–2021. An A value > 1 implies that ANPP gains in wet/warm years are larger than reduced in dry/cold years, and vice versa. The A value equal to 1 means the ecosystem is in a stable equilibrium state. The greater the degree of the ecosystem state deviating from the equilibrium is characterized by the deviation degree of A to 1, which indicates the ecosystem state is closer to the tipping point.
An ecosystem state closer to the tipping point responds more sensitively (S) to external perturbations (Hu et al., 2022; Zeng et al., 2022). To evaluate the sensitivity of ecosystems to climate variability, we estimated the response of ANPP and PUE to precipitation (SANPP-P, SPUE-P) and temperature (SANPP-T, SPUE-T) for each pixel during 1982–2021 using a multiple regression method (He et al., 2019):
where y’ is the detrended anomaly of the ensemble mean of ANPP and PUE. AP’ and AT’ are the detrended anomalies of annual precipitation and temperature, respectively. δint and γ int represent the sensitivity of ANPP and PUE to climate factors, respectively, and ε is the residual error.
In addition to the variability and asymmetry of ANPP and PUE, we also calculated the annual precipitation variability (CVP) and asymmetry (AP) to evaluate the effect that precipitation dynamics plays in determining the ecosystem state.
The spatial pattern of ANPP and PUE dynamics were mapped using ArcGIS 10.7 software. The multiple regression analysis was achieved using Sigmaplot 14.0 software.
2.6 Data processing and methodology
We calculated the arithmetic average and standard error value of ANPP and PUE dynamics (CVANPP, CVPUE, AANPP, APUE, SANPP-P, SANPP-T, SPUE-P, SPUE-T) at 20 mm intervals in the MAP. The simple line regression analysis was applied to explore the spatial pattern of ANPP and PUE dynamics with MAP, according to Equation (4):
where y is ANPP or PUE dynamics, MAP is mean annual precipitation, α is the constant term, β is the regression coefficient for MAP, and ξ is the residual error.
We also used a piecewise linear regression model to diagnosis the critical threshold of ANPP and PUE dynamics (CVANPP, CVPUE, AANPP, APUE, SANPP-P, SANPP-T, SPUE-P, SPUE-T) in response to MAP (Hu et al., 2018), determined by the least square error. According to Equation (5):
where y is the ANPP and PUE dynamics, and MAP is the mean annual precipitation. α is the value of the turning point. β0 is the constant term. β1 and β2 are the regression coefficients for MAP. A t-test was applied to test the null hypothesis “β2 is not different from zero”.
3 Results
3.1 Spatial pattern and statistical characteristics of ANPP and PUE dynamics in Eurasian grasslands
Our results showed that the range of CVANPP, AANPP, SANPP-P, and SANPP-T in Eurasian grasslands were 0.02–0.56, 0.3–3.1, −0.05–0.32, and −12–21, respectively (Figures 5A–D). A high CVANPP and SANPP-P were found in the northern typical and meadow steppes. In contrast, a low CVANPP and SANPP-P were found in the southern desert grasslands and alpine grasslands (Figures 5A, C). The CVPUE, APUE, SPUE-P, and SPUE-T varied from 0.02 to 0.45, 0.4 to 3.2, −0.006 to 0, and −0.05 to 0.28, respectively (Figures 5E–H). A high SPUE-P and SPUE-T occurred in the eastern temperate grasslands. A low SPUE-P and SPUE-T appeared in the desert steppes and southwestern alpine steppes (Figures 5G, H). However, the spatial distribution of AANPP, SANPP-T, CVPUE, and APUE showed no clear rule of territorial differentiation.
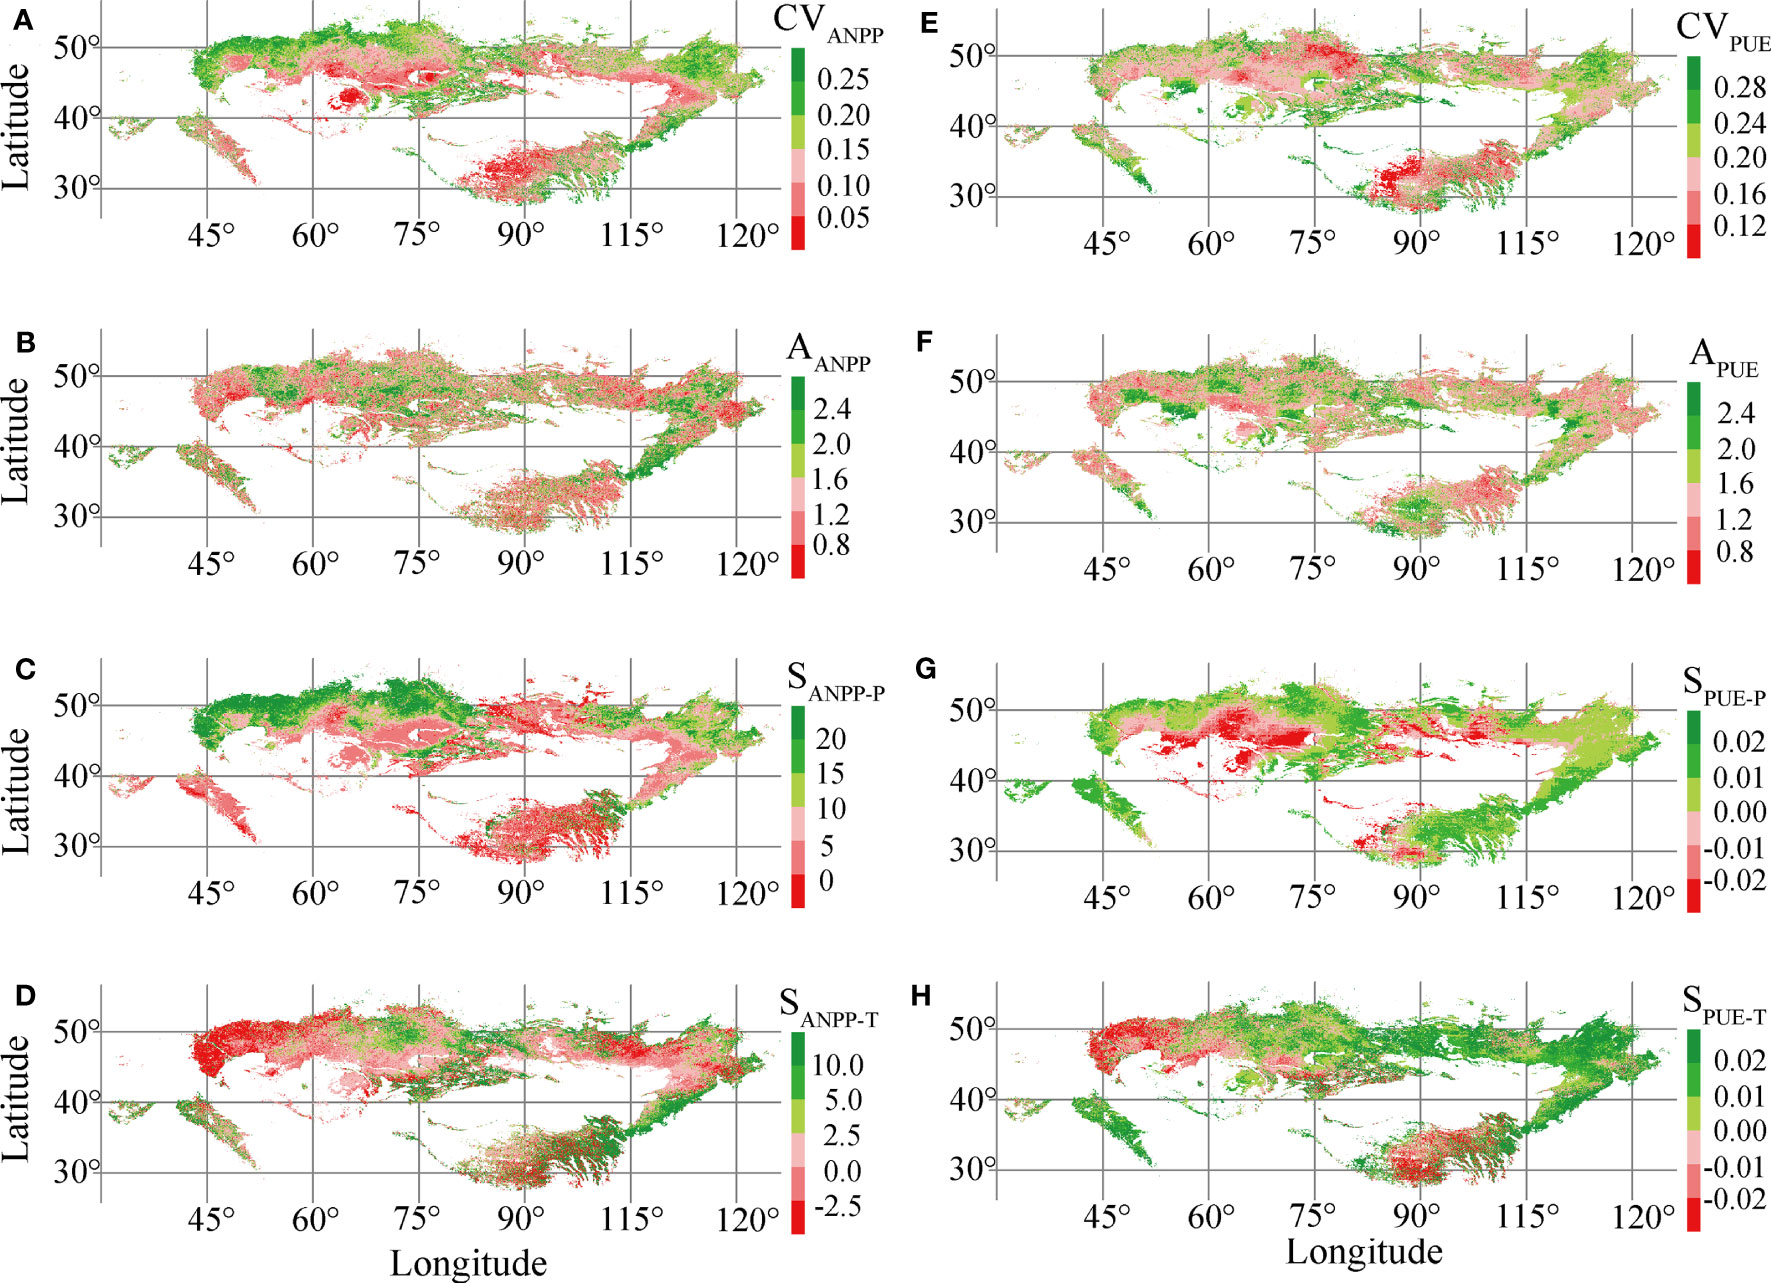
Figure 5 Spatial distribution of interannual variability of aboveground net primary production (CVANPP) (A) and precipitation use efficiency (CVPUE) (E), ANPP asymmetry (AANPP) (B) and PUE asymmetry (APUE) (F), ANPP precipitation sensitivity (SANPP-P) (C) and PUE precipitation sensitivity (SPUE-P) (G), and ANPP temperature sensitivity (SANPP-T) (D) and PUE temperature sensitivity (SPUE-T) (H) in Eurasian grasslands.
The magnitude of ANPP and PUE dynamics of temperate grasslands were generally larger than those of alpine grasslands (Supplementary Figure S1). In temperate grasslands, the magnitude of CVANPP, SANPP-T, CVPUE, SPUE-P, and SPUE-T in desert steppes were generally lower than in meadow steppes, while the magnitude of AANPP and APUE was the converse (Figure 6). We also found that the magnitude of SANPP-P in typical steppes was larger than in desert and meadow steppes (Figure 6C). In alpine grasslands, the magnitude of CVANPP, SANPP-T, CVPUE, and SPUE-P in alpine desert steppes were significantly lower than alpine meadows (Figures 6A, D, E, G), while the magnitude of AANPP was the converse (Figure 6B). It is worth noting that the SANPP-P and SPUE-T in alpine steppes were lower than in alpine desert and meadow steppes (Figures 6C, H). We also found that the ANPP and PUE sensitivity to precipitation were positive and negative values, respectively. In addition, the ANPP and PUE sensitivities to temperature had positive and negative values, respectively. These results indicated that ANPP and PUE dynamics have different meanings in grassland state transitions.

Figure 6 Statistical characteristics of interannual variability of aboveground net primary production (CVANPP) (A) and precipitation use efficiency (CVPUE) (E), ANPP asymmetry (AANPP) (B) and PUE asymmetry (APUE) (F), ANPP precipitation sensitivity (SANPP-P) (C) and PUE precipitation sensitivity (SPUE-P) (G), and ANPP temperature sensitivity (SANPP-T) (D) and PUE temperature sensitivity (SPUE-T) (H) in temperate and alpine grasslands. TDS, TTS, TMS, ADS, AS, and AMS represent the six grassland types, i.e., temperate desert steppes, temperate typical steppes, temperate meadow steppes, alpine desert steppes, alpine steppes, and alpine meadow steppes, respectively.
3.2 Spatial patterns of ANPP and PUE dynamics with MAP in temperate and alpine grasslands
In temperate grasslands, the spatial patterns of CVANPP, AANPP, SANPP-P, APUE, and SPUE-T appeared as peaks along the MAP, which were consistent with the transition of grassland types (Figures 7A–C, F, H). AANPP, SANPP-P, and APUE peaked at the regime shift of typical steppes (Figures 7B, C, F), indicating it was an available CSD-based indicator for state transitions between the desert and typical steppes. In addition, the spatial patterns of CVANPP, AANPP, and SPUE-T appeared as peaks at the transition zone between the typical and meadow steppes (Figures 7A, B, H). On the contrary, SANPP-T, CVPUE, and SPUE-P showed no peaks corresponding to regime shifts between grassland types along the MAP (Figures 7D, E, G), indicating it failed to capture state transitions in temperate grasslands. These results showed that CVANPP, AANPP, SANPP-P, APUE, and SPUE-T were effective indicators for state transitions of temperate grasslands.
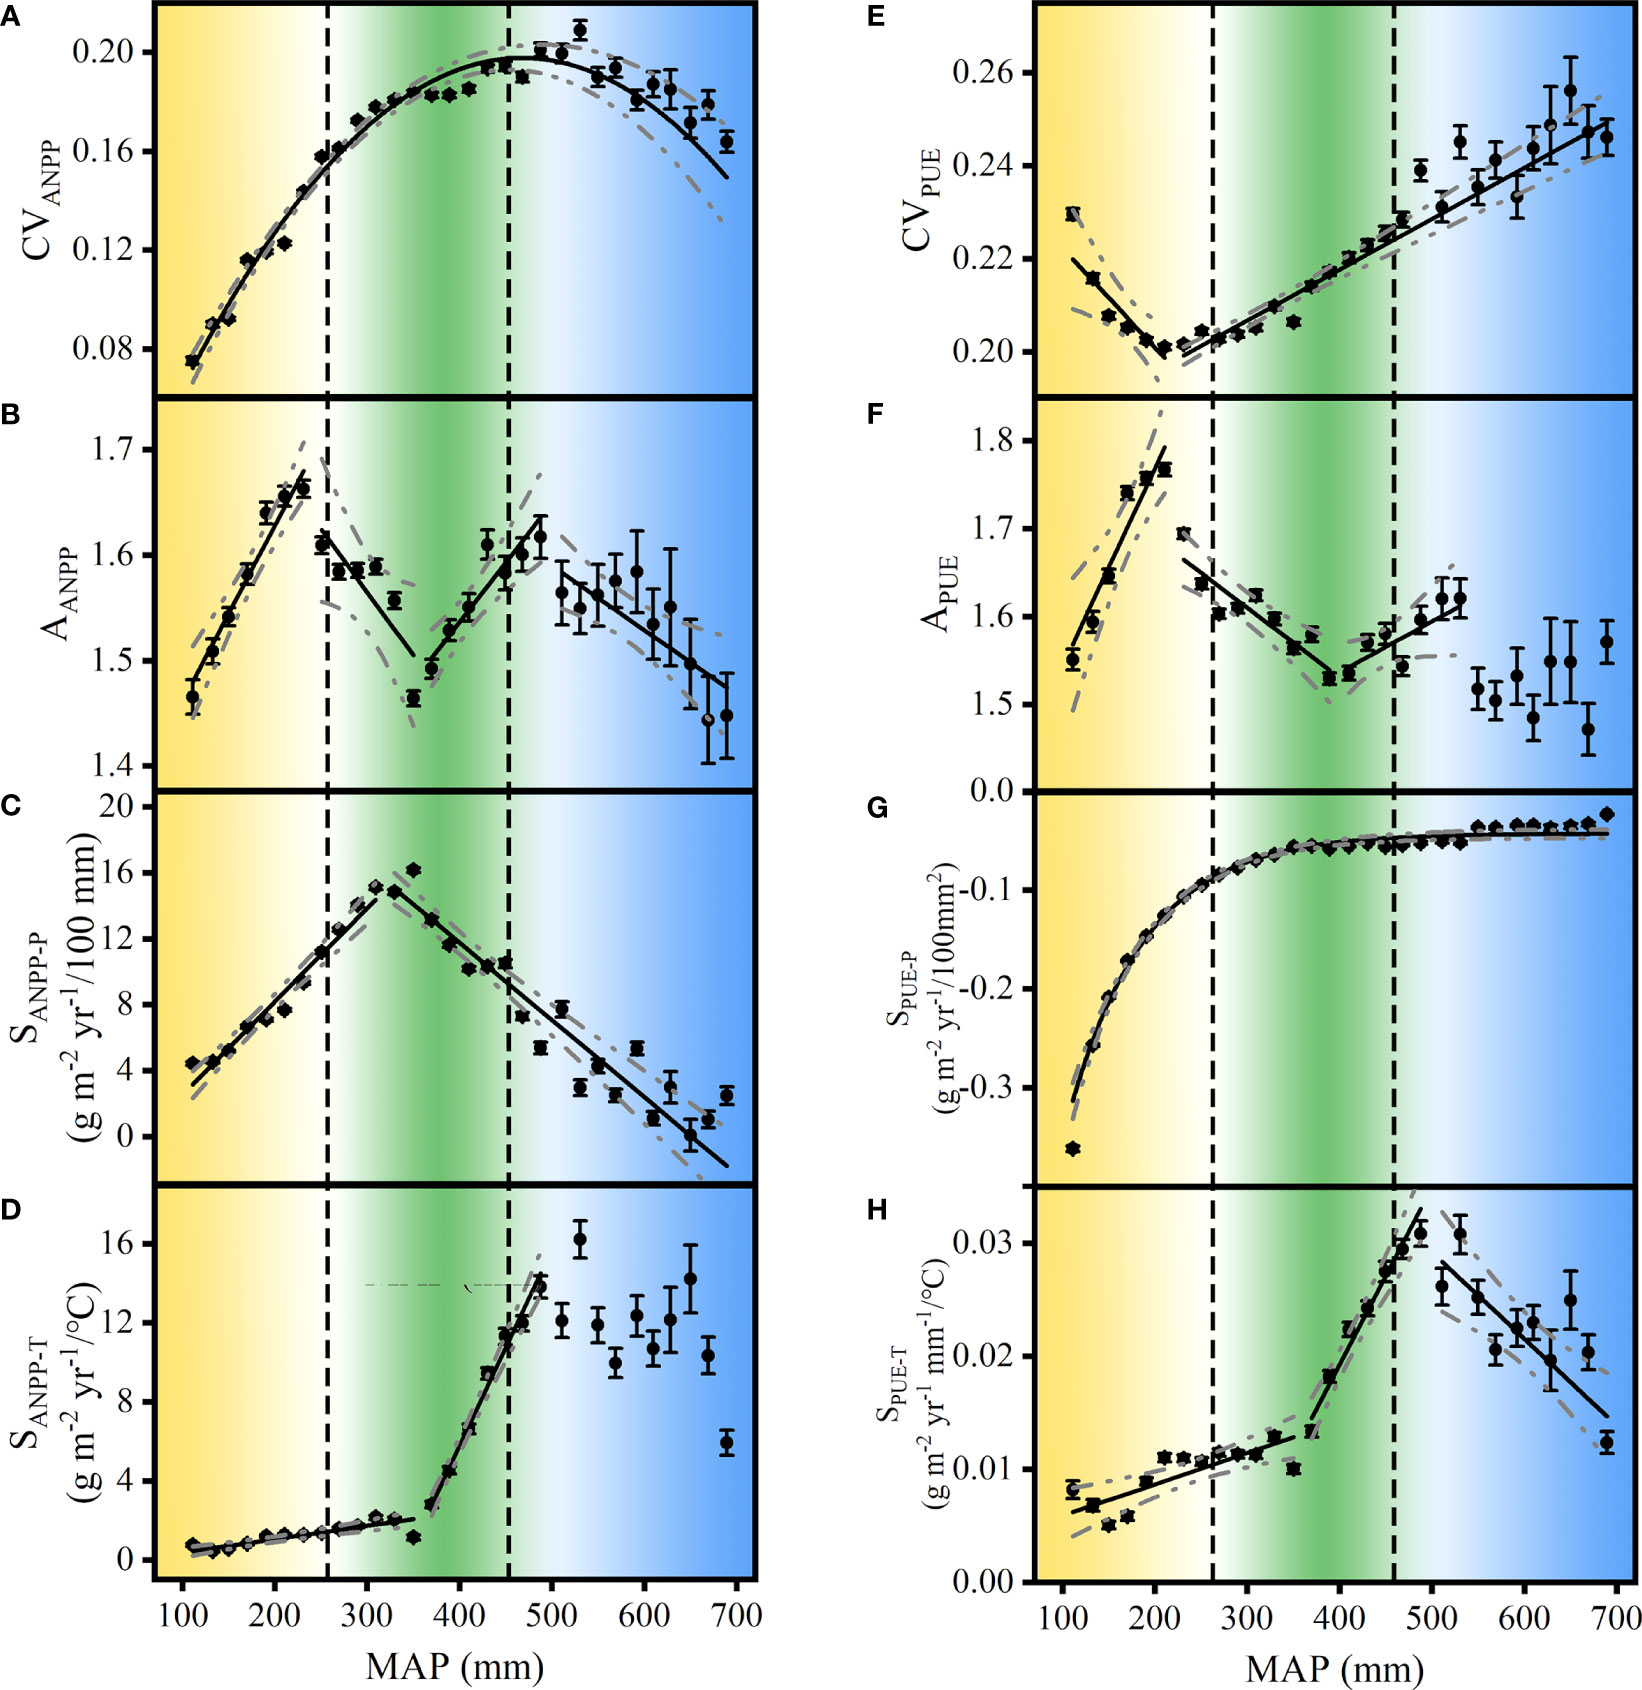
Figure 7 Spatial pattern of interannual variability of aboveground net primary production (CVANPP) (A) and precipitation use efficiency (CVPUE) (E), ANPP asymmetry (AANPP) (B) and PUE asymmetry (APUE) (F), ANPP precipitation sensitivity (SANPP-P) (C) and PUE precipitation sensitivity (SPUE-P) (G), and ANPP temperature sensitivity (SANPP-T) (D) and PUE temperature sensitivity (SPUE-T) (H) along the mean annual precipitation (MAP) in Eurasian temperate grasslands. The broken lines with ANPP and PUE dynamics denote 95% confidence intervals for the regressions. The vertical dashed lines denote the edge of the desert and typical steppes at 280 mm and 450 mm, respectively (based on Figure 2B). The data exemplified were bin-average at 20 mm MAP intervals. Yellow, green, and blue represent the three grassland types, i.e., temperate desert steppes, typical steppes, and meadow steppes, respectively.
We found that the spatial pattern of ANPP and PUE dynamics with the MAP differed in alpine and temperate grasslands (Figures 7, 8). In alpine grasslands, APUE peaked at the dry edge of alpine steppes (Figure 8F), indicating APUE was an available CSD-based indicator for the state transition between alpine desert and alpine steppes. In addition, AANPP and SANPP-P peaked at the wet edge of alpine steppes and near the critical zone between alpine steppes and alpine meadows (Figures 8B, C). The CVANPP, CVPUE, and SPUE-P showed an increasing trend with MAP and did not peak corresponding to the transition interval of grassland types (Figures 8A, E, G). Although the spatial pattern of SANPP-T and SPUE-T appeared as peaks along the MAP (Figures 8D, H), it was inconsistent with ecotone, and thus also could not indicate state transitions in temperate grasslands. These results showed that SANPP-P, APUE, and AANPP were available indicators for state transitions of alpine grasslands.
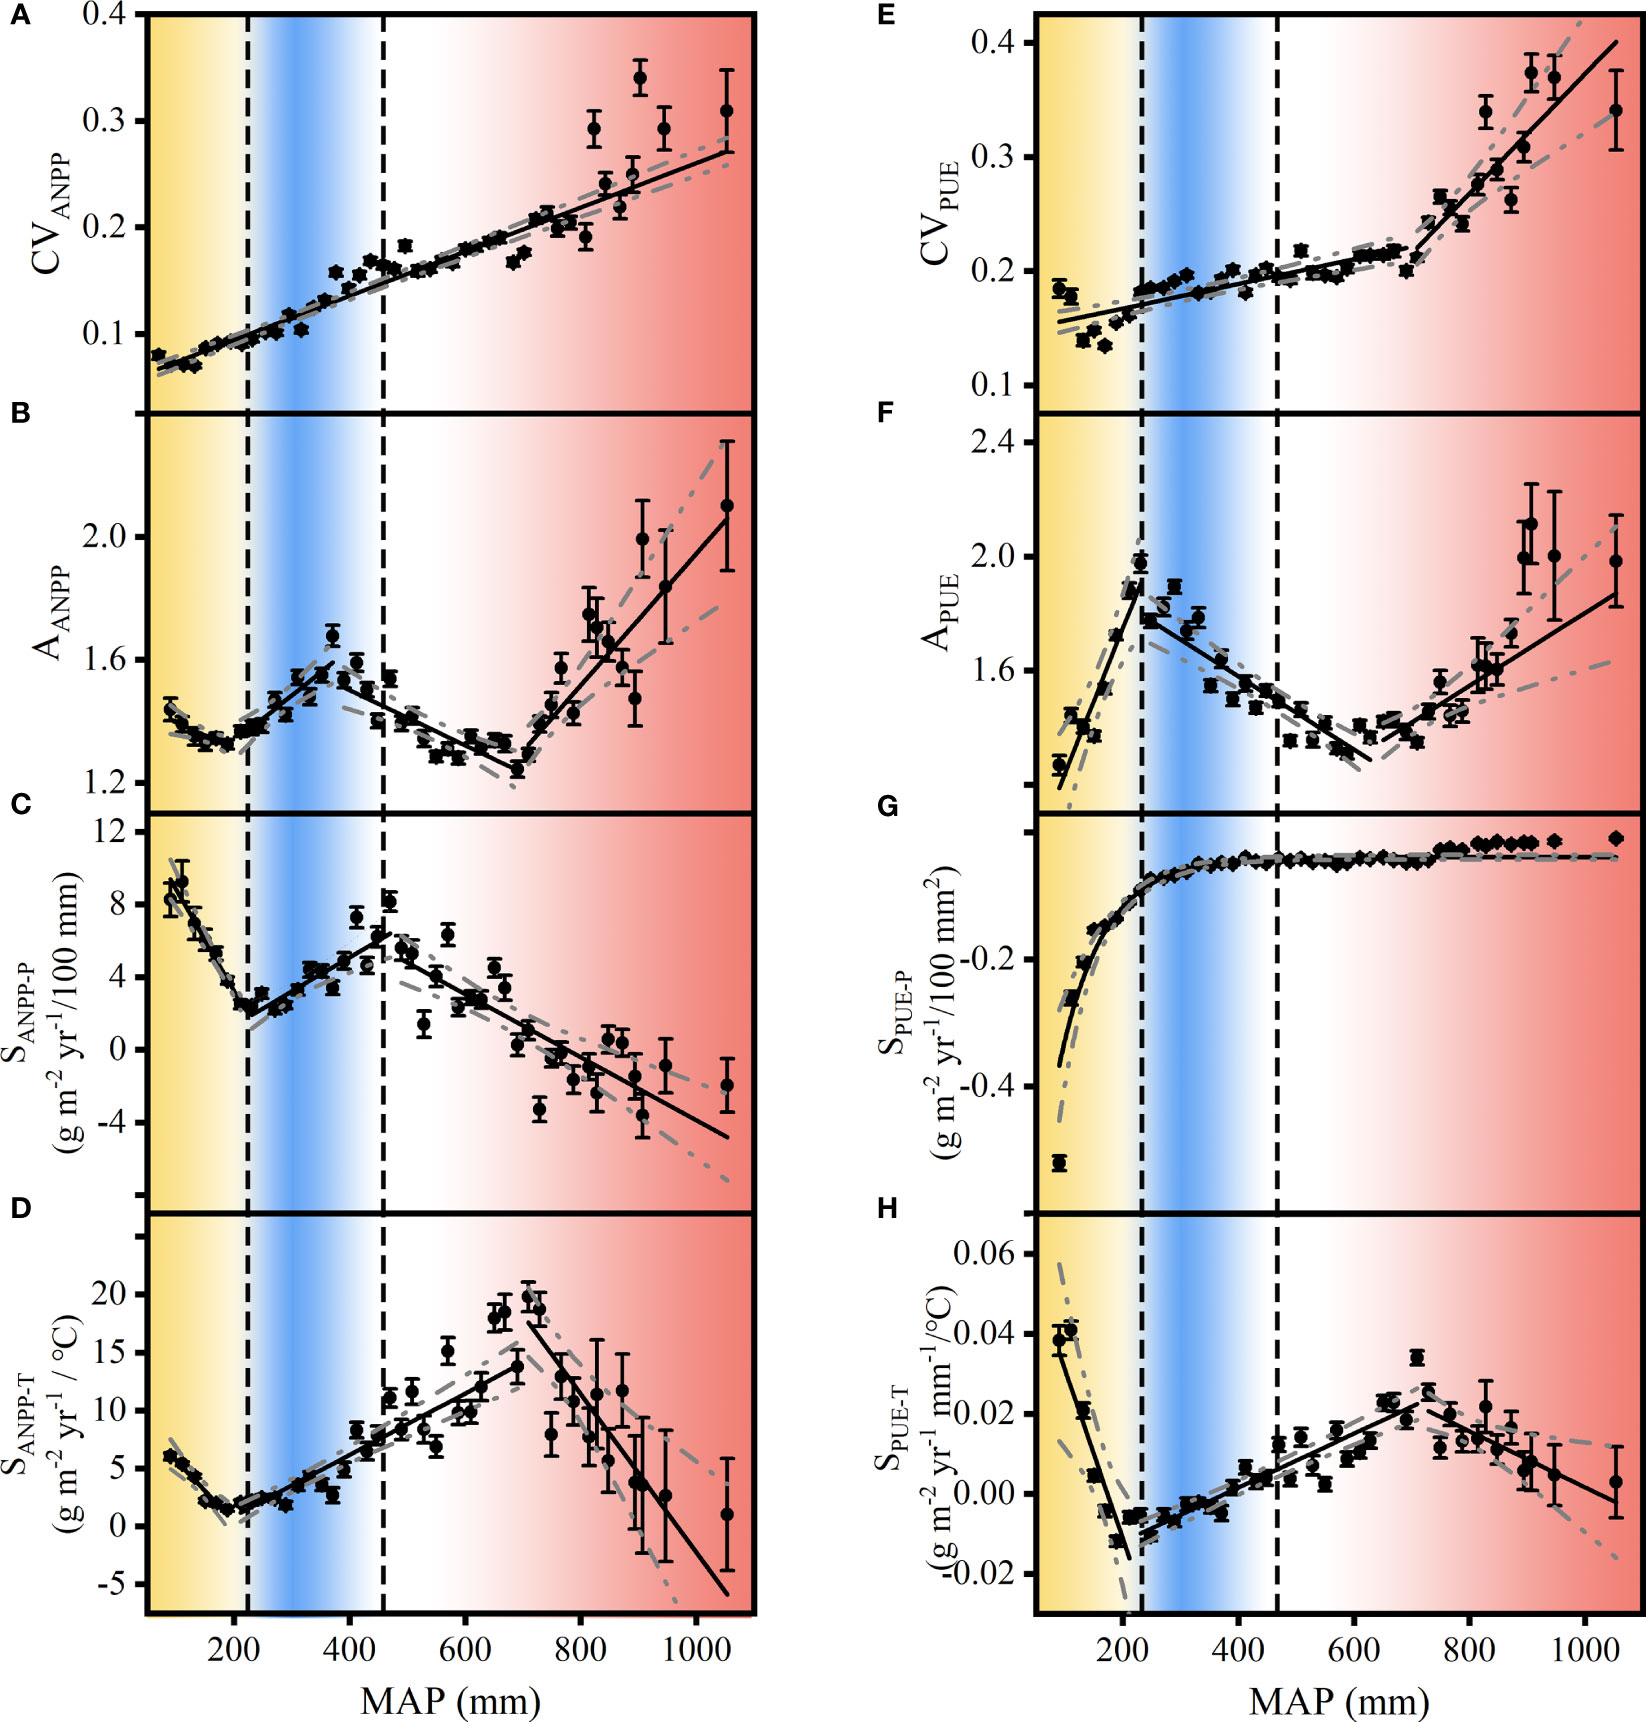
Figure 8 Spatial pattern of interannual variability of aboveground net primary production (CVANPP) (A) and precipitation use efficiency (CVPUE) (E), ANPP asymmetry (AANPP) (B) and PUE asymmetry (APUE) (F), ANPP precipitation sensitivity (SANPP-P) (C) and PUE precipitation sensitivity (SPUE-P) (G), and ANPP temperature sensitivity (SANPP-T) (D) and PUE temperature sensitivity (SPUE-T) (H) along the mean annual precipitation (MAP) in Eurasian alpine grasslands. The broken lines with ANPP and PUE dynamics denote 95% confidence intervals for the regressions. The vertical dashed lines indicate the edge of alpine desert steppes and alpine steppes at 200 mm and 400 mm, respectively (based on Figure 2C). The data illustrated were bin-average at 20 mm MAP intervals. Yellow, blue, and red represent the three grassland types, i.e., alpine desert steppes, alpine steppes, and alpine meadow steppes, respectively.
4 Discussion
4.1 Ecological significance of variability, asymmetry, and sensitivity of ANPP and PUE
Overall, we found that the ANPP and PUE dynamics (e.g., CVANPP, SANPP-T, CVPUE, SPUE-P, and SPUE-T) in desert steppes were generally lower than in meadow steppes in temperate and alpine grasslands, respectively (Figure 6). It is likely because the short xerophytic species and low diversity in deserts are adapted the low precipitation and poor nutrient availability, causing low ANPP and PUE dynamics (Davidowitz, 2002; Huang et al., 2015; Hu et al., 2022). On the contrary, meadow steppes are characterized by the highest coverage and abundant biodiversity, likely causing the high variability and sensitivity of ANPP and PUE to climate change (Bai et al., 2004; Wang et al., 2005; Guo et al., 2015). These results were consistent with previous analyses based on long-term observations of ANPP dynamics in temperate grasslands (Zhou et al., 2006).
We have also found that the magnitude of AANPP and APUE in desert steppes were larger than typical and meadow steppes in temperate grasslands (Figure 6). The AANPP and APUE were positive values, which suggested a more significant decrease of ANPP and PUE in dry years than increases in wet years (Knapp and Smith, 2001; Zhou et al., 2006; Wu et al., 2018). Previous research showed that the hysteresis effects of soil moisture of earlier years alleviate the substantial declines of ANPP and PUE, meaning that AANPP and APUE in the dry region were larger than in the wet region (Sala et al., 2012; Petrie et al., 2018). In dry regions, the hysteresis effects of soil moisture from previous years was limited. In contrast, in a wet region, other resources such as soil nutrient availability, light, or temperature limitations associated with wet periods countervailed the effect of increased precipitation on ANPP and PUE (Wu et al., 2018).
In addition, we found that CVP in desert steppes was generally larger than in meadow steppes (Supplementary Figure S2). Collectively, we demonstrated that ANPP and PUE dynamics were available to indicate the stability and resilience of grassland ecosystems. Abiotic and biotic factors are essential factors influencing the variability, asymmetry, and climatic sensitivity of ANPP and PUE in grassland ecosystems (Hector et al., 2010; Willis et al., 2018).
4.2 Underlying ecological mechanisms shape the spatial patterns of ANPP and PUE dynamics
We found that the CVANPP exhibited an initial ascending and then declining spatial pattern with MAP in temperate grasslands (Figure 7A), while it increased with MAP in alpine grasslands (Figure 8A). These results were consistent with previous analyses based on long-term observations of ANPP dynamics in temperate grasslands (Knapp and Smith, 2001; Hu et al., 2018). In our study, we once again illustrated the relationship between CVANPP and precipitation and enhanced robustness by using long-term remote sensing products and climate data sets of grassland ecosystems on a large spatial scale. In addition, CVPUE and CVANPP had reverse spatial patterns along the MAP in temperate grasslands, and were consistent in alpine grasslands (Figures 8A, E). It is worth noting that the CVANPP, CVPUE, and CVAP were inconsistent with MAP in temperate and alpine grasslands (Supplementary Figure S3). This result showed that CVANPP was not completely controlled by spatial patterns in CVP.
The AANPP exhibited a piecewise mode with MAP and peaked at the wet edge of temperate desert, typical, and alpine steppes in Eurasian grasslands. In this region, precipitation strongly shaped xerophyte proportion and demographic processes, which could cause the transition between shrub and steppe (Huxman et al., 2004; Liu et al., 2012; Zhang et al., 2020). These results were consistent with the spatial pattern of AANPP in desert and typical steppes of temperate grasslands (Hu et al., 2018). In addition, the APUE showed a similar piecewise pattern with MAP in temperate and alpine grasslands and peaked at the moist edge of temperate and alpine desert steppes. We suggested that the ANPP gains in rainy years were larger than reduced in lower rainfall years and intensified with the MAP in desert steppes. Conversely, ANPP gains in wet years and reductions in dry years could be offset, causing AANPP to decrease with the MAP in meadow steppes (Wilcox et al., 2017; Wu et al., 2018). In addition, the spatial pattern of AANPP and APUE was inconsistent with AP in temperate and alpine grasslands, respectively (Figure S3). Consequently, we inferred that the proportion of opportunistic species, demographic, and ecosystem traits regulated the asymmetry of ANPP and PUE in temporal (Huxman et al., 2004; Luo et al., 2017).
The SANPP-P peaked at the moist edge of temperate desert and alpine steppes (Figures 7C; 8C), where the importance of ecosystem traits and xerophyte proportion on ecosystem temporal dynamics of ANPP and PUE were higher. We also found that SPUE-T peaked at the wet edge of alpine steppes (Figure 8H), where light, temperature, ecosystem traits, and soil nutrient limitations on ANPP and PUE dynamics were higher (Guo et al., 2015; Ganjurjav et al., 2016). In addition, low temperature and soil nutrients limited the ability of plants to use soil moisture and caused the decline of SANPP-P and SANPP-T in temperate and alpine meadow steppes (Kou et al., 2020).
4.3 Indicators of grasslands ecosystem state transitions at the continental scale
Our study confirmed that ANPP and PUE dynamics are useful indicators in detecting state transitions at the continental scale. ANPP as a principal ecosystem function has been demonstrated, but PUE is rarely mentioned (Hu et al., 2018; Berdugo et al., 2020). The adaptive strategies of communities to precipitation are important for understanding state transitions, especially in grassland ecosystems (Knapp et al., 2017; Wu et al., 2018; Wang et al., 2022). We based our study on the magnitude of ANPP and PUE dynamics magnitude and divided temperate and alpine grasslands into low and high resilience states, respectively (Figure 9). Spatial patterns of ANPP and PUE dynamics with MAP were used to analyze state transitions of low and high resilience in Eurasian grasslands. Notably, we found that the complementation of ANPP and PUE dynamics was helpful in identifying state transitions and understanding its underlying ecological mechanisms in Eurasian grasslands.
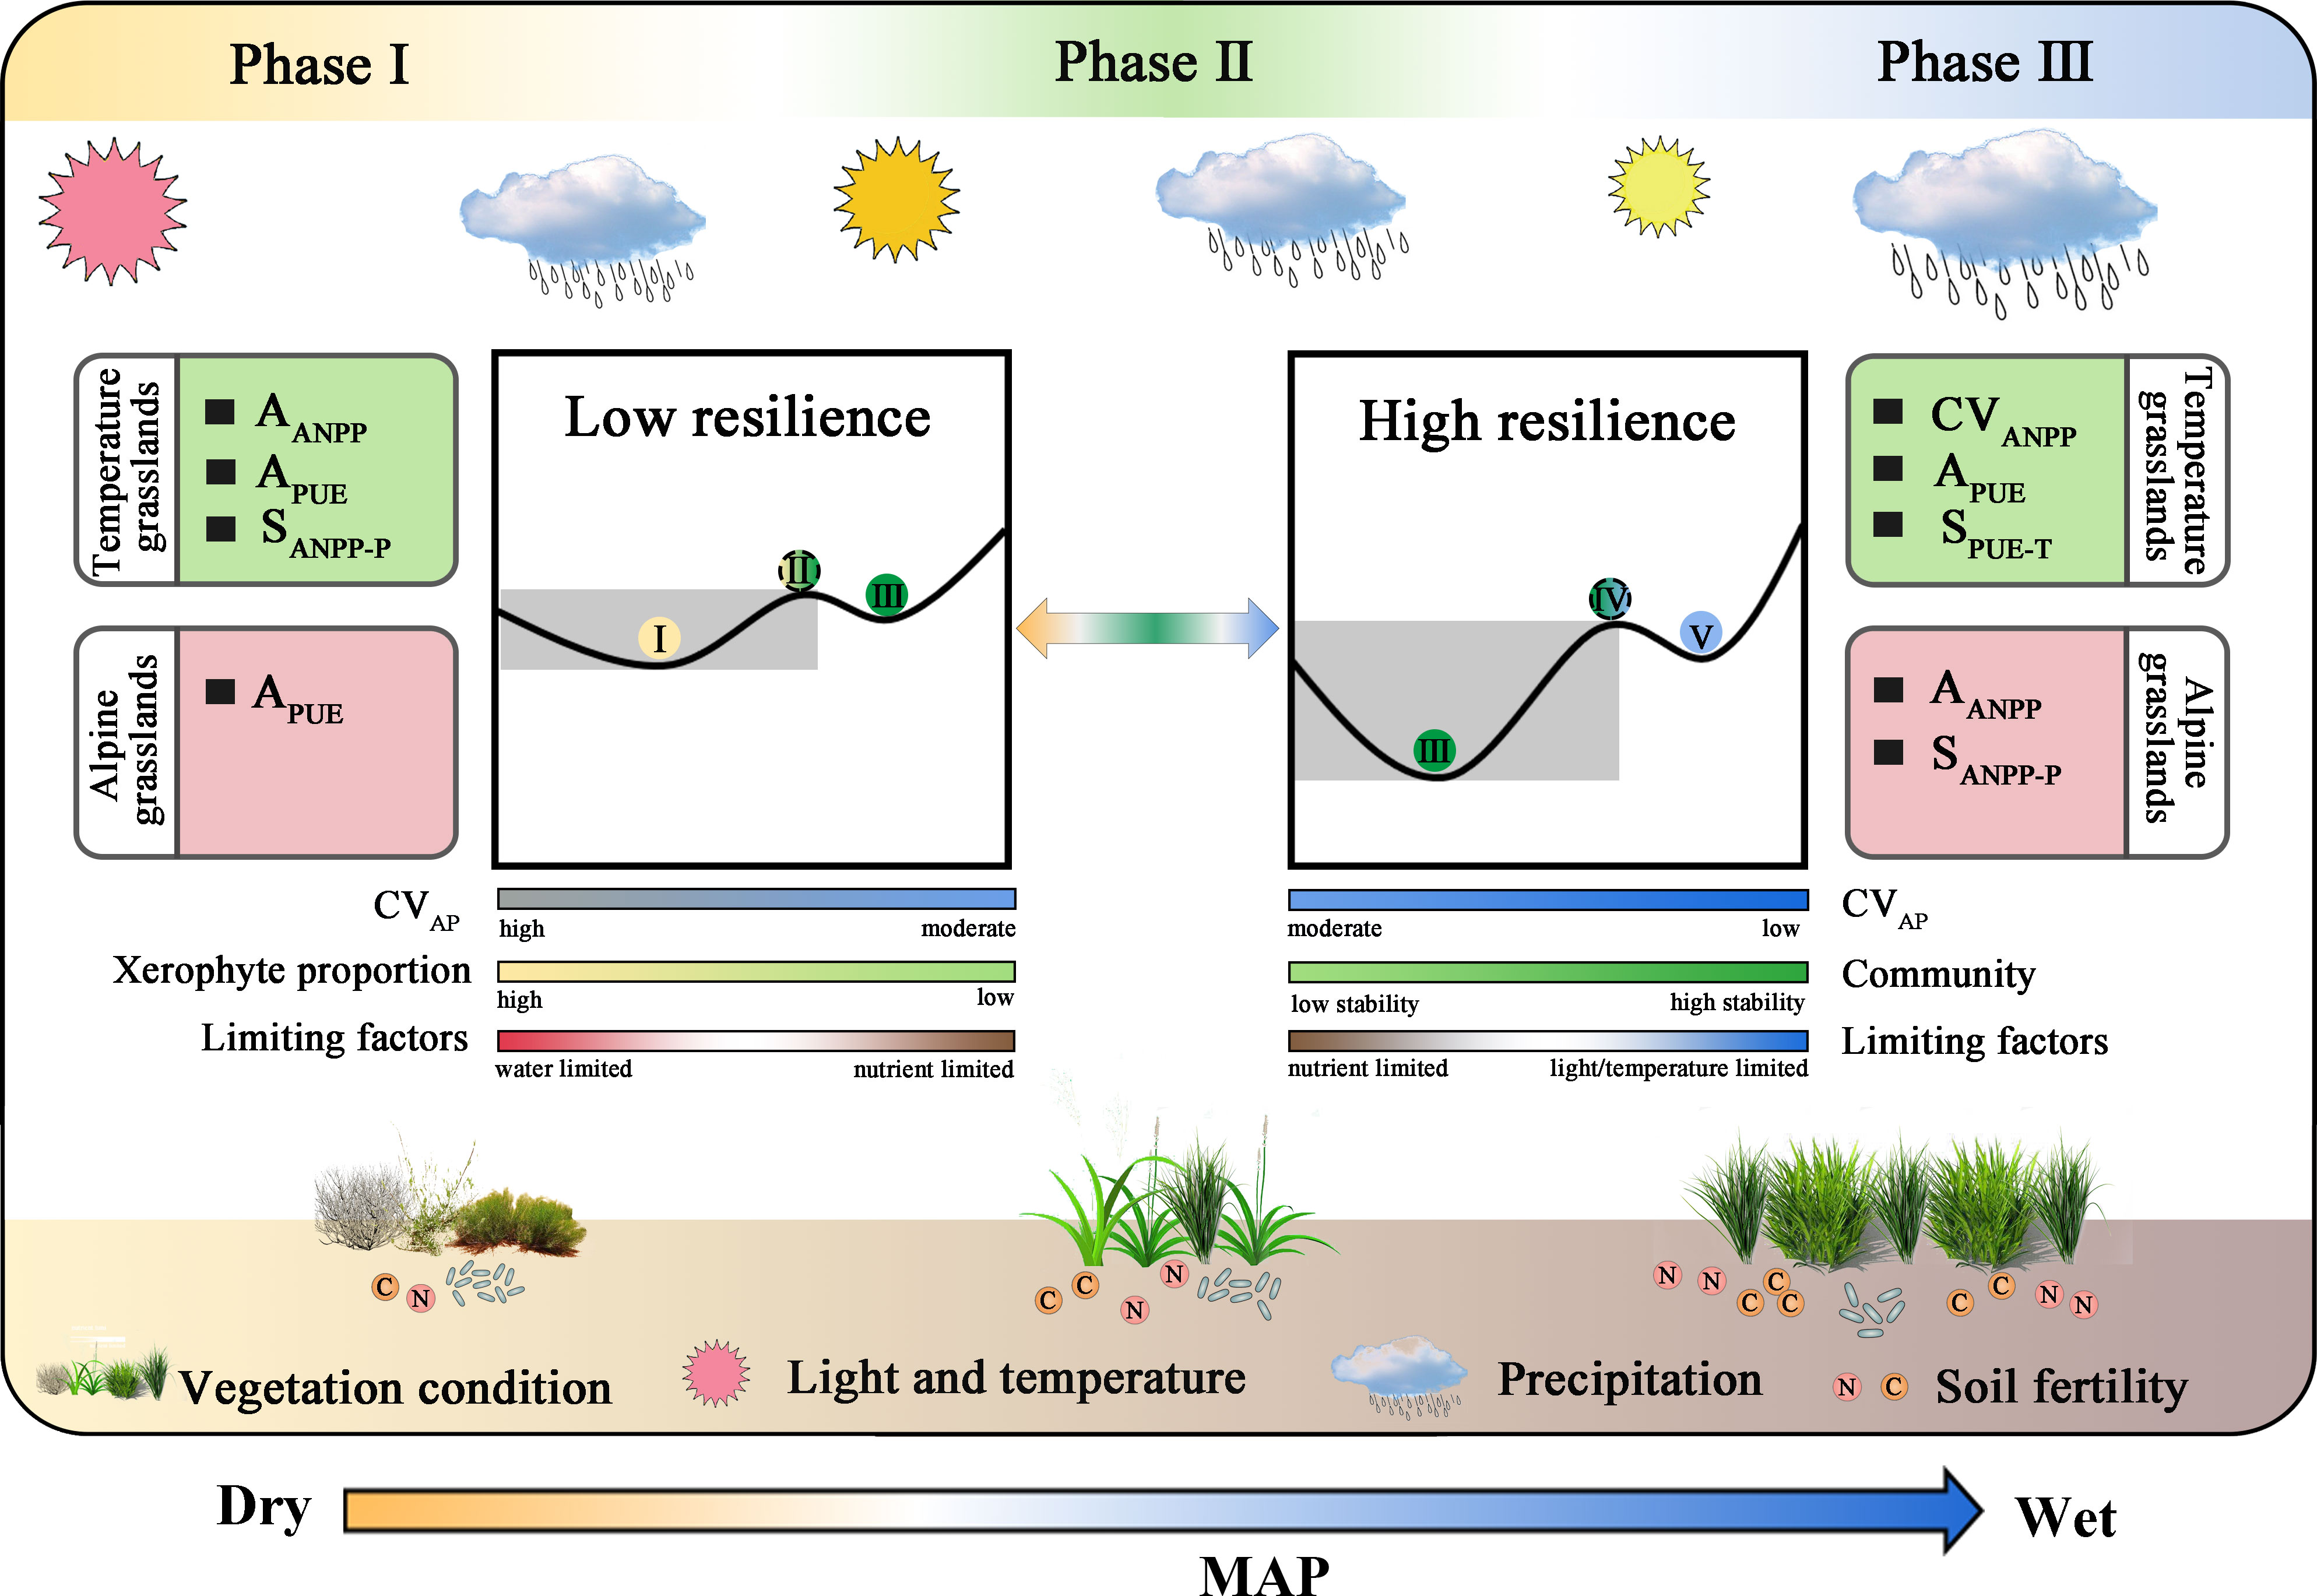
Figure 9 Schematic illustration of early warning signals and ecological mechanisms of state transitions in the processes underlying their distribution along MAP. Precipitation, light/temperature, and species composition regulated high and low resilience state transitions in Eurasian grasslands. In the inner rectangular list, peak ANPP asymmetry (AANPP), PUE asymmetry (APUE), and ANPP precipitation sensitivity (SANPP-P) signal transitions at the edge of desert steppes of low resilience temperate grasslands. Interannual variability of ANPP (CVANPP), APUE, and PUE temperature sensitivity (SPUE-T) peak at the transition of high resilience temperate grasslands. APUE signals transitions of the low resilience alpine grasslands. AANPP and SANPP-P signal transitions of the high resilience alpine grasslands. Precipitation and xerophyte proportion controlled state transitions in low resilience grasslands. Community structure and limiting factors (nutrient, light, and/or temperature) regulated state transitions in high resilience grasslands. Low and high resilience represent the desert and meadow steppes in temperate and alpine grasslands, respectively. Phase I, II, and III correspond to desert steppes, typical steppes, and meadow steppes in temperate grasslands, respectively, or alpine desert steppes, alpine steppes, and alpine meadow steppes in alpine grasslands, respectively.
In our study, AANPP, APUE, and SANPP-P peaked at the wet edge of desert steppes (Figure 7C), and CVANPP, AANPP, and SPUE-T peaked at the moist edge of typical steppes (Figures 7B, E, H). Thus, these grassland types lie functionally approach a state transition in temperate grasslands. APUE peaked at the edge of alpine desert steppes (Figures 8C, G), and AANPP and SANPP-P peaked at the wet edge of alpine steppes (Figure 8D), all of which peaked at the transition region in alpine grasslands. A previous study showed that CVANPP and AANPP could indicate state transitions between desert and typical steppes, and SANPP-P was available to detect typical and meadow steppe regime shifts in temperate grasslands (Hu et al., 2018). We suggest that CVP and xerophyte proportion explained the relative state transitions in low resilience grassland ecosystems (Gherardi and Sala, 2019; Deng et al., 2021; Hu et al., 2022). Community (species traits, composition, and competition) and limiting factors (light, temperature, and nutrients) regulate the relative abrupt transition of high resilience grassland ecosystems (Kou et al., 2020; Sun et al., 2021) (Figure 9). Note that, although MAP itself has a clear threshold between grassland types (Figures 2B, C), ecosystems may be undergoing a state transition without detectable signals in precipitation changes (Scheffer et al., 2009; Lenton, 2011; Hou et al., 2021). In addition, we also found that the ANPP and PUE dynamics closely linked to precipitation are a promising complementary method for understanding the underlying mechanisms.
Overall, ANPP and PUE dynamics were predictive of critical state transitions of grassland ecosystems, and this was our motivation for connecting function-based indicators and CSD to identify state transitions. However, not all indicators could serve as metrics of state transition. For instance, CVPUE, SPUE-P, and SANPP-T did not peak corresponding to the transitions between grassland types. Note that the theory predicts positive feedback for the cascading effects of multiple elements (species, soil water, plant biomass, root system, and water uptake, etc.) as a critical fundamental mechanism for state transition (Grace et al., 2007; Estiarte et al., 2016; De Boeck et al., 2018). Unfortunately, we lacked the data to assess the connection between the dynamics and feedback. Furthermore, the quality and quantity of data, as well as the temporal and spatial scales, all affected the robustness of the indicators (Dakos et al., 2015; Rietkerk et al., 2021). In future research, we would further consider the feedback processes of ecosystems, and use long-term in situ observation data to explore the indicators for state changes in terrestrial ecosystems at the continental scale.
5 Conclusion
With long-term ANPP and PUE remote sensing products, our study proposed a theoretical basis for ecosystem function-based indicators to detect state transitions in Eurasian grasslands. We greatly extended the analysis of ANPP and PUE dynamics across the conterminous Eurasia grasslands, thereby firmly establishing functional ecosystem indicators to signal state transitions at the continental scale. Of greater significance, we have comprehensively confirmed valuable indicators for state transitions, and revealed its underlying ecological mechanisms in low and high resilience in Eurasian grasslands. CVANPP, AANPP, APUE, SANPP-P, and SPUE-T displayed distinct spatial patterns, with peaks signaling state transitions of grassland ecosystems. We highlight the essential roles of hydrothermal conditions, community structures, and limiting factors in regulating ecosystem state transitions. We suggest that grassland management strategies and climate change research focus on areas that are highly vulnerable to climate variability and are changing rapidly due to multiple factors in the grassland transition zone.
Author contributions
TZ and GY conceived the article. TZ, WZ, CJ, LH, and ZL performed the statistical analyses. ZF, ZS, ZW, ZC, and GY drafted the manuscript. All authors contributed to the article and approved the submitted version.
Funding
This study was supported by the National Natural Science Foundation of China (32201344, 41991234, 42141005, 31988102), National Key Research and Development Program of China (2017YFA0604803), Young Talents Project of Institute of Geographic Sciences and Natural Resources Research (2021RC004), Science and Technology Basic Investigation Program of China (2019FY101302), and Startup Research Program of Northwest A&F University (2452021105).
Conflict of interest
The authors declare that the research was conducted in the absence of any commercial or financial relationships that could be construed as a potential conflict of interest.
Publisher’s note
All claims expressed in this article are solely those of the authors and do not necessarily represent those of their affiliated organizations, or those of the publisher, the editors and the reviewers. Any product that may be evaluated in this article, or claim that may be made by its manufacturer, is not guaranteed or endorsed by the publisher.
Supplementary material
The Supplementary Material for this article can be found online at: https://www.frontiersin.org/articles/10.3389/fevo.2023.1189059/full#supplementary-material
References
Al-Yaari A., Wigneron J.-P., Ciais P., Reichstein M., Ballantyne A., Ogee J., et al. (2020). Asymmetric responses of ecosystem productivity to rainfall anomalies vary inversely with mean annual rainfall over the conterminous united states. Global Change Biol. 26 (12), 6959–6973. doi: 10.1111/gcb.15345
Arani B. M. S., Carpenter S. R., Lahti L., van Nes E. H., Scheffer M. (2021). Exit time as a measure of ecological resilience. Science 372 (6547), 1168–116+. doi: 10.1126/science.aay4895
Bai Y. F., Han X. G., Wu J. G., Chen Z. Z., Li L. H. (2004). Ecosystem stability and compensatory effects in the inner Mongolia grassland. Nature 431 (7005), 181–184. doi: 10.1038/nature02850
Bardgett R. D., Bullock J. M., Lavorel S., Manning P., Schaffner U., Ostle N., et al. (2021). Combatting global grassland degradation. Nat. Rev. Earth Environ. 2 (10), 720–735. doi: 10.1038/s43017-021-00207-2
Berdugo M., Delgado-Baquerizo M., Soliveres S., Hernandez-Clemente R., Zhao Y., Gaitan J. J., et al. (2020). Global ecosystem thresholds driven by aridity. Science 367 (6479), 787–78+. doi: 10.1126/science.aay5958
Carpenter S. R., Brock W. A. (2006). Rising variance: a leading indicator of ecological transition. Ecol. Lett. 9 (3), 308–315. doi: 10.1111/j.1461-0248.2005.00877.x
Chen J. M., Ju W., Ciais P., Viovy N., Liu R., Liu Y., et al. (2019). Vegetation structural change since 1981 significantly enhanced the terrestrial carbon sink. Nat. Commun. 10. doi: 10.1038/s41467-019-12257-8
Cheng L., Lu N., Wang M., Fu B., Xu Z. (2021). Alternative biome states of African terrestrial vegetation and the potential drivers: a continental-scale study. Sci. Tot. Environ. 800. doi: 10.1016/j.scitotenv.2021.149489
Clements C. F., Ozgul A. (2018). Indicators of transitions in biological systems. Ecol. Lett. 21 (6), 905–919. doi: 10.1111/ele.12948
Dakos V., Carpenter S. R., Brock W. A., Ellison A. M., Guttal V., Ives A. R., et al. (2012). Methods for detecting early warnings of critical transitions in time series illustrated using simulated ecological data. PloS One 7 (7), e41010. doi: 10.1371/journal.pone.0041010
Dakos V., Carpenter S. R., van Nes E. H., Scheffer M. (2015). Resilience indicators: prospects and limitations for early warnings of regime shifts. Philos. Trans. R. Soc. B-Biol. Sci. 370 (1659), 20130263. doi: 10.1098/rstb.2013.0263
Davidowitz G. (2002). Does precipitation variability increase from mesic to xeric biomes? Global Ecol. Biogeog. 11 (2), 143–154. doi: 10.1046/j.1466-822X.2002.00271.x
De Boeck H. J., Bloor J. M. G., Kreyling J., Ransijn J. C. G., Nijs I., Jentsch A., et al. (2018). Patterns and drivers of biodiversity-stability relationships under climate extremes. J. Ecol. 106 (3), 890–902. doi: 10.1111/1365-2745.12897
Deng Y., Li X., Shi F., Hu X. (2021). Woody plant encroachment enhanced global vegetation greening and ecosystem water-use efficiency. Global Ecol. Biogeog. 30 (12), 2337–2353. doi: 10.1111/geb.13386
Dietz S., Rising J., Stoerk T., Wagner G. (2021). Economic impacts of tipping points in the climate system. Proc. Natl. Acad. Sci. United States America 118 (34), e2103081118. doi: 10.1073/pnas.2103081118
Duffy K. A., Schwalm C. R., Arcus V. L., Koch G. W., Liang L. L., Schipper L. A. (2021). How close are we to the temperature tipping point of the terrestrial biosphere? Sci. Adv. 7 (3), eaay1052. doi: 10.1126/sciadv.aay1052
Estiarte M., Vicca S., Penuelas J., Bahn M., Beier C., Emmett B. A., et al. (2016). Few multiyear precipitation-reduction experiments find ashift in the productivity-precipitation relationship. Global Change Biol. 22 (7), 2570–2581. doi: 10.1111/gcb.13269
Ganjurjav H., Gao Q., Gornish E. S., Schwartz M. W., Liang Y., Cao X., et al. (2016). Differential response of alpine steppe and alpine meadow to climate warming in the central qinghai-Tibetan plateau. Agric. For. Meteorol. 223, 233–240. doi: 10.1016/j.agrformet.2016.03.017
Gherardi L. A., Sala O. E. (2019). Effect of interannual precipitation variability on dryland productivity: a global synthesis. Global Change Biol. 25 (1), 269–276. doi: 10.1111/gcb.14480
Grace J. B., Anderson T. M., Smith M. D., Seabloom E., Andelman S. J., Meche G., et al. (2007). Does species diversity limit productivity in natural grassland communities? Ecol. Lett. 10 (8), 680–689. doi: 10.1111/j.1461-0248.2007.01058.x
Guo Q., Hu Z., Li S., Yu G., Sun X., Zhang L., et al. (2015). Contrasting responses of gross primary productivity to precipitation events in a water-limited and a temperature-limited grassland ecosystem. Agric. For. Meteorol. 214, 169–177. doi: 10.1016/j.agrformet.2015.08.251
Haberl H., Erb K.-H., Krausmann F. (2014). Human appropriation of net primary production: patterns, trends, and planetary boundaries. Annu. Rev. Environ. Resour. 39, 363–391.
Harris I., Osborn T. J., Jones P., Lister D. (2020). Version 4 of the CRU TS monthly high-resolution gridded multivariate climate dataset. Sci. Data 7 (1), 1-18. doi: 10.1038/s41597-020-0453-3
He H., Wang S., Zhang L., Wang J., Ren X., Zhou L., et al. (2019). Altered trends in carbon uptake in china's terrestrial ecosystems under the enhanced summer monsoon and warming hiatus. Natl. Sci. Rev. 6 (3), 505–514. doi: 10.1093/nsr/nwz021
Hector A., Hautier Y., Saner P., Wacker L., Bagchi R., Joshi J., et al. (2010). General stabilizing effects of plant diversity on grassland productivity through population asynchrony and overyielding. Ecology 91 (8), 2213–2220. doi: 10.1890/09-1162.1
Hou E., Litvak M. E., Rudgers J. A., Jiang L., Collins S. L., Pockman W. T., et al. (2021). Divergent responses of primary production to increasing precipitation variability in global drylands. Global Change Biol. 27 (20), 5225–5237. doi: 10.1111/gcb.15801
Hu Z., Dakos V., Rietkerk M. (2022). Using functional indicators to detect state changes in terrestrial ecosystems. Trends Ecol. Evol. 37(12), 1036–1045 doi: 10.1016/j.tree.2022.07.011
Hu Z., Guo Q., Li S., Piao S., Knapp A. K., Ciais P., et al. (2018). Shifts in the dynamics of productivity signal ecosystem state transitions at the biome-scale. Ecol. Lett. 21 (10), 1457–1466. doi: 10.1111/ele.13126
Hu Z., Yu G., Fan J., Zhong H., Wang S., Li S. (2010). Precipitation-use efficiency along a 4500-km grassland transect. Global Ecol. Biogeog. 19 (6), 842–851. doi: 10.1111/j.1466-8238.2010.00564.x
Huang G., Li Y., Padilla F. M. (2015). Ephemeral plants mediate responses of ecosystem carbon exchange to increased precipitation in a temperate desert. Agric. For. Meteorol. 201, 141–152. doi: 10.1016/j.agrformet.2014.11.011
Hughes T. P., Anderson K. D., Connolly S. R., Heron S. F., Kerry J. T., Lough J. M., et al. (2018). Spatial and temporal patterns of mass bleaching of corals in the anthropocene. Science 359 (6371), 80–8+. doi: 10.1126/science.aan8048
Huxman T. E., Smith M. D., Fay P. A., Knapp A. K., Shaw M. R., Loik M. E., et al. (2004). Convergence across biomes to a common rain-use efficiency. Nature 429 (6992), 651–654. doi: 10.1038/nature02561
Jiao C., Yu G., Ge J., Chen X., Zhang C., He N., et al. (2017). Analysis of spatial and temporal patterns of aboveground net primary productivity in the Eurasian steppe region from 1982 to 2013. Ecol. Evol. 7 (14), 5149–5162. doi: 10.1002/ece3.3027
Knapp A. K., Ciais P., Smith M. D. (2017). Reconciling inconsistencies in precipitation-productivity relationships: implications for climate change. New Phytol. 214 (1), 41–47. doi: 10.1111/nph.14381
Knapp A. K., Smith M. D. (2001). Variation among biomes in temporal dynamics of aboveground primary production. Science 291 (5503), 481–484. doi: 10.1126/science.291.5503.481
Kou D., Yang G., Li F., Feng X., Zhang D., Mao C., et al. (2020). Progressive nitrogen limitation across the Tibetan alpine permafrost region. Nat. Commun. 11 (1), 3331. doi: 10.1038/s41467-020-17169-6
Lade S. J., Steffen W., De Vries W., Carpenter S. R., Donges J. F., Gerten D., et al. (2020). Human impacts on planetary boundaries amplified by earth system interactions. Nat. Sustain. 3 (2), 119–128. doi: 10.1038/s41893-019-0454-4
Lenton T. M. (2011). Early warning of climate tipping points. Nat. Climate Change 1 (4), 201–209. doi: 10.1038/nclimate1143
Lenton T. M., Rockstroem J., Gaffney O., Rahmstorf S., Richardson K., Steffen W., et al. (2019). Climate tipping points - too risky to bet against. Nature 575 (7784), 592–595. doi: 10.1038/d41586-019-03595-0
Liang M., Cao R., Di K., Han D., Hu Z. (2021). Vegetation resistance and resilience to a decade-long dry period in the temperate grasslands in China. Ecol. Evol. 11 (15), 10582–10589. doi: 10.1002/ece3.7866
Liu Y., Kumar M., Katul G. G., Porporato A. (2019). Reduced resilience as an early warning signal of forest mortality. Nat. Climate Change 9 (11), 880–88+. doi: 10.1038/s41558-019-0583-9
Liu Y., Li Z., Chen Y., Li Y., Li H., Xia Q., et al. (2022). Evaluation of consistency among three NDVI products applied to high mountain Asia in 2000–2015. Remote Sens. Environ. 269, 112821. doi: 10.1016/j.rse.2021.112821
Liu R., Pan L.-P., Jenerette G. D., Wang Q.-X., Cieraad E., Li Y. (2012). High efficiency in water use and carbon gain in a wet year for a desert halophyte community. Agric. For. Meteorol. 162, 127–135. doi: 10.1016/j.agrformet.2012.04.015
Liu J., Rhland K. M., Chen J., Xu Y., Chen S., Chen Q., et al. (2017). Aerosol-weakened summer monsoons decrease lake fertilization on the Chinese loess plateau. Nat. Climate Change 7 (3), 190–19+. doi: 10.1038/nclimate3220
Luo Y., Jiang L., Niu S., Zhou X. (2017). Nonlinear responses of land ecosystems to variation in precipitation. New Phytol. 214 (1), 5–7. doi: 10.1111/nph.14476
Maurer G. E., Hallmark A. J., Brown R. F., Sala O. E., Collins S. L. (2020). Sensitivity of primary production to precipitation across the united states. Ecol. Lett. 23 (3), 527–536. doi: 10.1111/ele.13455
Olson D. M., Dinerstein E., Wikramanayake E. D., Burgess N. D., Powell G. V. N., Underwood E. C., et al. (2001). Terrestrial ecoregions of the worlds: a new map of life on earth. Bioscience 51 (11), 933–938. doi: 10.1641/0006-3568(2001)051[0933:Teotwa]2.0.Co;2
Parker J., Kenyon R. V., Troxel D. E. (1983). Comparison of interpolating methods for image resampling. IEEE Trans. Med. Imaging 2 (1), 31–39. doi: 10.1109/tmi.1983.4307610
Petrie M. D., Peters D. P. C., Yao J., Blair J. M., Burruss N. D., Collins S. L., et al. (2018). Regional grassland productivity responses to precipitation during multiyear above- and below-average rainfall periods. Global Change Biol. 24 (5), 1935–1951. doi: 10.1111/gcb.14024
Ratajczak Z., Carpenter S. R., Ives A. R., Kucharik C. J., Ramiadantsoa T., Stegner M. A., et al. (2018). Abrupt change in ecological systems: inference and diagnosis. Trends Ecol. Evol. 33 (7), 513–526. doi: 10.1016/j.tree.2018.04.013
Rietkerk M., Bastiaansen R., Banerjee S., van de Koppel J., Baudena M., Doelman A. (2021). Evasion of tipping in complex systems through spatial pattern formation. Science 374 (6564), 169–16+. doi: 10.1126/science.abj0359
Sala O. E., Gherardi L. A., Reichmann L., Jobbagy E., Peters D. (2012). Legacies of precipitation fluctuations on primary production: theory and data synthesis. Philos. Trans. R. Soc. B-Biol. Sci. 367 (1606), 3135–3144. doi: 10.1098/rstb.2011.0347
Scheffer M., Bascompte J., Brock W. A., Brovkin V., Carpenter S. R., Dakos V., et al. (2009). Early-warning signals for critical transitions. Nature 461 (7260), 53–59. doi: 10.1038/nature08227
Su H., Wang R., Feng Y., Li Y., Li Y., Chen J., et al. (2021). Long-term empirical evidence, early warning signals and multiple drivers of regime shifts in a lake ecosystem. J. Ecol. 109 (9), 3182–3194. doi: 10.1111/1365-2745.13544
Sun Y., Yang Y., Zhao X., Tang Z., Wang S., Fang J. (2021). Global patterns and climatic drivers of above- and belowground net primary productivity in grasslands. Sci. China-Life Sci. 64 (5), 739–751. doi: 10.1007/s11427-020-1837-9
Verma M., Friedl M. A., Richardson A. D., Kiely G., Cescatti A., Law B. E., et al. (2014). Remote sensing of annual terrestrial gross primary productivity from MODIS: an assessment using the FLUXNET la thuile data set. Biogeosciences 11 (8), 2185–2200. doi: 10.5194/bg-11-2185-2014
Wang S. P., Niu H. S., Cui X. Y., Jiang S., Li Y. H., Xiao X. M., et al. (2005). Plant communities - ecosystem stability in inner Mongolia. Nature 435 (7045), E5–E6. doi: 10.1038/nature03862
Wang C., Wang Z.-H., Sun L. (2020). Early-warning signals for critical temperature transitions. Geophys. Res. Lett. 47 (14), e2020GL088503. doi: 10.1029/2020gl088503
Wang Y., Xiao J., Li X., Niu S. (2022). Global evidence on the asymmetric response of gross primary productivity to interannual precipitation changes. Sci. Tot. Environ. 814, 152786. doi: 10.1016/j.scitotenv.2021.152786
Wilcox K. R., Shi Z., Gherardi L. A., Lemoine N. P., Koerner S. E., Hoover D. L., et al. (2017). Asymmetric responses of primary productivity to precipitation extremes: a synthesis of grassland precipitation manipulation experiments. Global Change Biol. 23 (10), 4376–4385. doi: 10.1111/gcb.13706
Willis K. J., Jeffers E. S., Tovar C. (2018). What makes a terrestrial ecosystem resilient? a complex set of biotic and abiotic factors determines the resilience of an ecosystem. Science 359 (6379), 988–989. doi: 10.1126/science.aar5439
Wu D., Ciais P., Viovy N., Knapp A. K., Wilcox K., Bahn M., et al. (2018). Asymmetric responses of primary productivity to altered precipitation simulated by ecosystem models across three long-term grassland sites. Biogeosciences 15 (11), 3421–3437. doi: 10.5194/bg-15-3421-2018
Yang Y., Fang J., Fay P. A., Bell J. E., Ji C. (2010). Rain use efficiency across a precipitation gradient on the Tibetan plateau. Geophys. Res. Lett. 37, 1-5. doi: 10.1029/2010gl043920
Zeng X., Hu Z., Chen A., Yuan W., Hou G., Han D., et al. (2022). The global decline in the sensitivity of vegetation productivity to precipitation from 2001 to 2018. Glob Chang Biol. 28 (22), 6823–6833. doi: 10.1111/gcb.16403
Zhang T., Chen Z., Zhang W., Jiao C., Yang M., Wang Q., et al. (2021). Long-term trend and interannual variability of precipitation-use efficiency in Eurasian grasslands. Ecol. Indic. 130, 108091. doi: 10.1016/j.ecolind.2021.108091
Zhang C., Lu D., Chen X., Zhang Y., Maisupova B., Tao Y. (2016). The spatiotemporal patterns of vegetation coverage and biomass of the temperate deserts in central Asia and their relationships with climate controls. Remote Sens. Environ. 175, 271–281. doi: 10.1016/j.rse.2016.01.002
Zhang T., Yu G., Chen Z., Hu Z., Jiao C., Yang M., et al. (2020). Patterns and controls of vegetation productivity and precipitation-use efficiency across Eurasian grasslands. Sci. Tot. Environ. 741, 140204. doi: 10.1016/j.scitotenv.2020.140204
Keywords: Eurasian grasslands, precipitation-use efficiency, productivity, regime shift, state transitions
Citation: Zhang T, Chen Z, Jiao C, Zhang W, Han L, Fu Z, Sun Z, Liu Z, Wen Z and Yu G (2023) Using the dynamics of productivity and precipitation-use efficiency to detect state transitions in Eurasian grasslands. Front. Ecol. Evol. 11:1189059. doi: 10.3389/fevo.2023.1189059
Received: 18 March 2023; Accepted: 26 June 2023;
Published: 13 July 2023.
Edited by:
Huakun Zhou, Chinese Academy of Sciences (CAS), ChinaReviewed by:
Jia Lu, China Institute of Water Resources and Hydropower Research, ChinaZi-jian Xie, Chinese Research Academy of Environmental Sciences, China
Copyright © 2023 Zhang, Chen, Jiao, Zhang, Han, Fu, Sun, Liu, Wen and Yu. This is an open-access article distributed under the terms of the Creative Commons Attribution License (CC BY). The use, distribution or reproduction in other forums is permitted, provided the original author(s) and the copyright owner(s) are credited and that the original publication in this journal is cited, in accordance with accepted academic practice. No use, distribution or reproduction is permitted which does not comply with these terms.
*Correspondence: Guirui Yu, eXVnckBpZ3NucnIuYWMuY24=