 Madison Wikston1*
 Brie-Anne A. Breton1
 Sibelle Torres Vilaça1Amanda M. Bennett2Christopher J. Kyle1,3David V. Beresford1,2
 David Lesbarrères4
 Chris C. Wilson5
 David M. Green6
 Marie-Josée Fortin7
 Dennis L. Murray1,2
- 1Environmental and Life Sciences Graduate Program, Trent University, Peterborough, ON, Canada
- 2Department of Biology, Trent University, Peterborough, ON, Canada
- 3Forensic Science Department, Trent University, Peterborough, ON, Canada
- 4Environment and Climate Change Canada, National Wildlife Research Centre, Ottawa, ON, Canada
- 5Ontario Ministry of Northern Development, Mines, Natural Resources and Forestry, Trent University, Peterborough, ON, Canada
- 6Redpath Museum, McGill University, Montreal, QC, Canada
- 7Department of Ecology and Evolutionary Biology, University of Toronto, Toronto, ON, Canada
Documenting biodiversity, species occurrence, and species status require reliable monitoring techniques, but the complex life history and cryptic behavior of many anurans create challenges for conventional monitoring approaches. Environmental DNA (eDNA) surveys are a promising alternative (or complement) to conventional anuran monitoring, but their relative success has not been fully tested. We assessed the comparative efficacy of targeted eDNA detection via quantitative PCR (qPCR) and three conventional amphibian survey methods (visual encounter, breeding call, and larval dipnet surveys) for detecting nine anuran species in natural wetlands in southern Ontario, Canada. Our analyses revealed that all assessment methods yielded imperfect detection, with visual encounter and eDNA surveys detecting the greatest species richness and eDNA surveys requiring the fewest sampling events. Amphibian community composition results differed among survey methods and sampling events, and detection efficacy was markedly variable, with some species requiring two to three methods to maximize detection success. Notably, two relatively terrestrial species (Anaxyrus americanus and Hyla versicolor) had relatively low and seasonally variable eDNA detection rates, suggesting that species-specific ecology likely affects eDNA presence or detection. These findings suggest that optimized monitoring for complex anuran communities may require application of multiple monitoring methods, which may need to be tailored to individual target species or communities.
Introduction
Population monitoring is critical for identifying species declines and mitigating biodiversity loss, particularly for data-deficient and rapidly declining taxa. Amphibians are perhaps the most threatened vertebrate group, with >40% of species showing evidence of numerical decline, including multiple instances of local extinction and extirpation (Stuart et al., 2004; Johnson et al., 2017; Leung et al., 2017). This alarming decline highlights the need to develop effective amphibian monitoring programs so that conservation status of populations and communities can be assessed quickly and reliably. Amphibian species vary considerably in their habitat requirements (Mattfeldt et al., 2009), breeding periods (Bridges and Dorcas, 2000), and life cycles (Wells, 2007), creating challenges for selecting the best monitoring tools for tracking changes in their distribution and abundance. It follows that gaps in our understanding of amphibian population trends can be attributed, in part, to a lack of robust, reliable, and universally applicable monitoring techniques.
Amphibians are commonly surveyed using a variety of conventional monitoring methods that exhibit varying levels of success and efficacy. These approaches usually involve conducting visual or auditory (i.e., breeding call) surveys, which can be influenced by a range of biotic and abiotic factors affecting assessment reliability (De Solla et al., 2005; Schmidt, 2005; Petitot et al., 2014). Indeed, visual and auditory surveys typically require environmental conditions (i.e., rainfall, humidity, and temperature; see Mazerolle et al., 2005; Schmidt, 2005; Asad et al., 2020) and habitat characteristics (i.e., vegetation type and coverage; see Bailey et al., 2004) that are conducive to high probability of detection when animals are present. Likewise, target species must be reasonably abundant in the surveyed area for reliable detection (see Gu and Swihart, 2004; Tanadini and Schmidt, 2011). Observer error also can contribute to unreliable amphibian detections from conventional surveys because individuals have different levels of expertise in identifying amphibian species in the field (Lotz and Allen, 2007; McClintock et al., 2010; Barata et al., 2017). In addition, because amphibians undergo multiple life stages and are sensitive to environmental conditions, detectability via conventional surveys may vary through space and time. It follows that these complexities challenge the reliability of conventional amphibian surveys and should encourage consideration and evaluation of alternative methods.
Additional challenges arise when amphibian monitoring programs attempt to track changes in multiple species concurrently, using a one-size-fits-all approach. This common practice ignores differences in species ecology and corresponding detectability, leading to under-detection when surveys are ill-timed or poorly suited for a particular species (Bridges and Dorcas, 2000). Detection rates for individual species within amphibian communities can be improved via strategic use of multiple survey methods and sufficient effort (Ryan et al., 2002; Petitot et al., 2014) or accounting for detection probabilities during data collection and analysis (Schmidt, 2005; Mazerolle et al., 2007). Accordingly, even in the best circumstances, conventional amphibian monitoring methods remain imperfect.
Environmental DNA (eDNA) detection is growing in acceptance as an alternative method for monitoring wildlife (Taberlet et al., 2018; Pawlowski et al., 2020), including a variety of amphibian species, communities (e.g., Goldberg et al., 2011; Valentini et al., 2016; Malekian et al., 2018) and pathogens of primary concern for amphibians (e.g., ranavirus, chytridiomycosis, and Saprolegnia spp.; Vilaça et al., 2020; Congram et al., 2022; Pavić et al., 2022). Sloughed cells, feces, gametes, and other sources of eDNA can be detected by sampling water from aquatic habitats, without requiring physical capture or direct observation of the organism itself (Taberlet et al., 2018; Pawlowski et al., 2020). These advancements are especially promising for low-density and cryptic amphibian species that pose challenges to conventional monitoring (Pilliod et al., 2013; Spear et al., 2015). Despite these advantages, some aspects of eDNA technology are still being refined. Occupancy can be underestimated for a variety of reasons, and current challenges include improving sampling designs by identifying ecologically relevant sampling periods (Eiler et al., 2018), determining sufficient sampling replication (Goldberg et al., 2018), and counteracting inhibition that interferes with DNA amplification (Jane et al., 2015).
We conducted eDNA and conventional amphibian surveys (visual encounter, breeding call, and larval dipnet surveys) to assess their relative performance in detecting nine anuran species in southern Ontario, Canada (Figure 1). We predicted that eDNA methods would detect greater species richness than conventional surveys, and that the efficacy of different methods would vary by species. Specifically, we expected that explosive breeders would have high detectability across all survey methods during their respective breeding seasons, whereas common, primarily aquatic species would have consistent detectability throughout the sampling period, with higher detectability using eDNA. More broadly, this study contributes to efforts to improve amphibian population monitoring through assessment, refinement, and ultimate adoption of new survey methods.
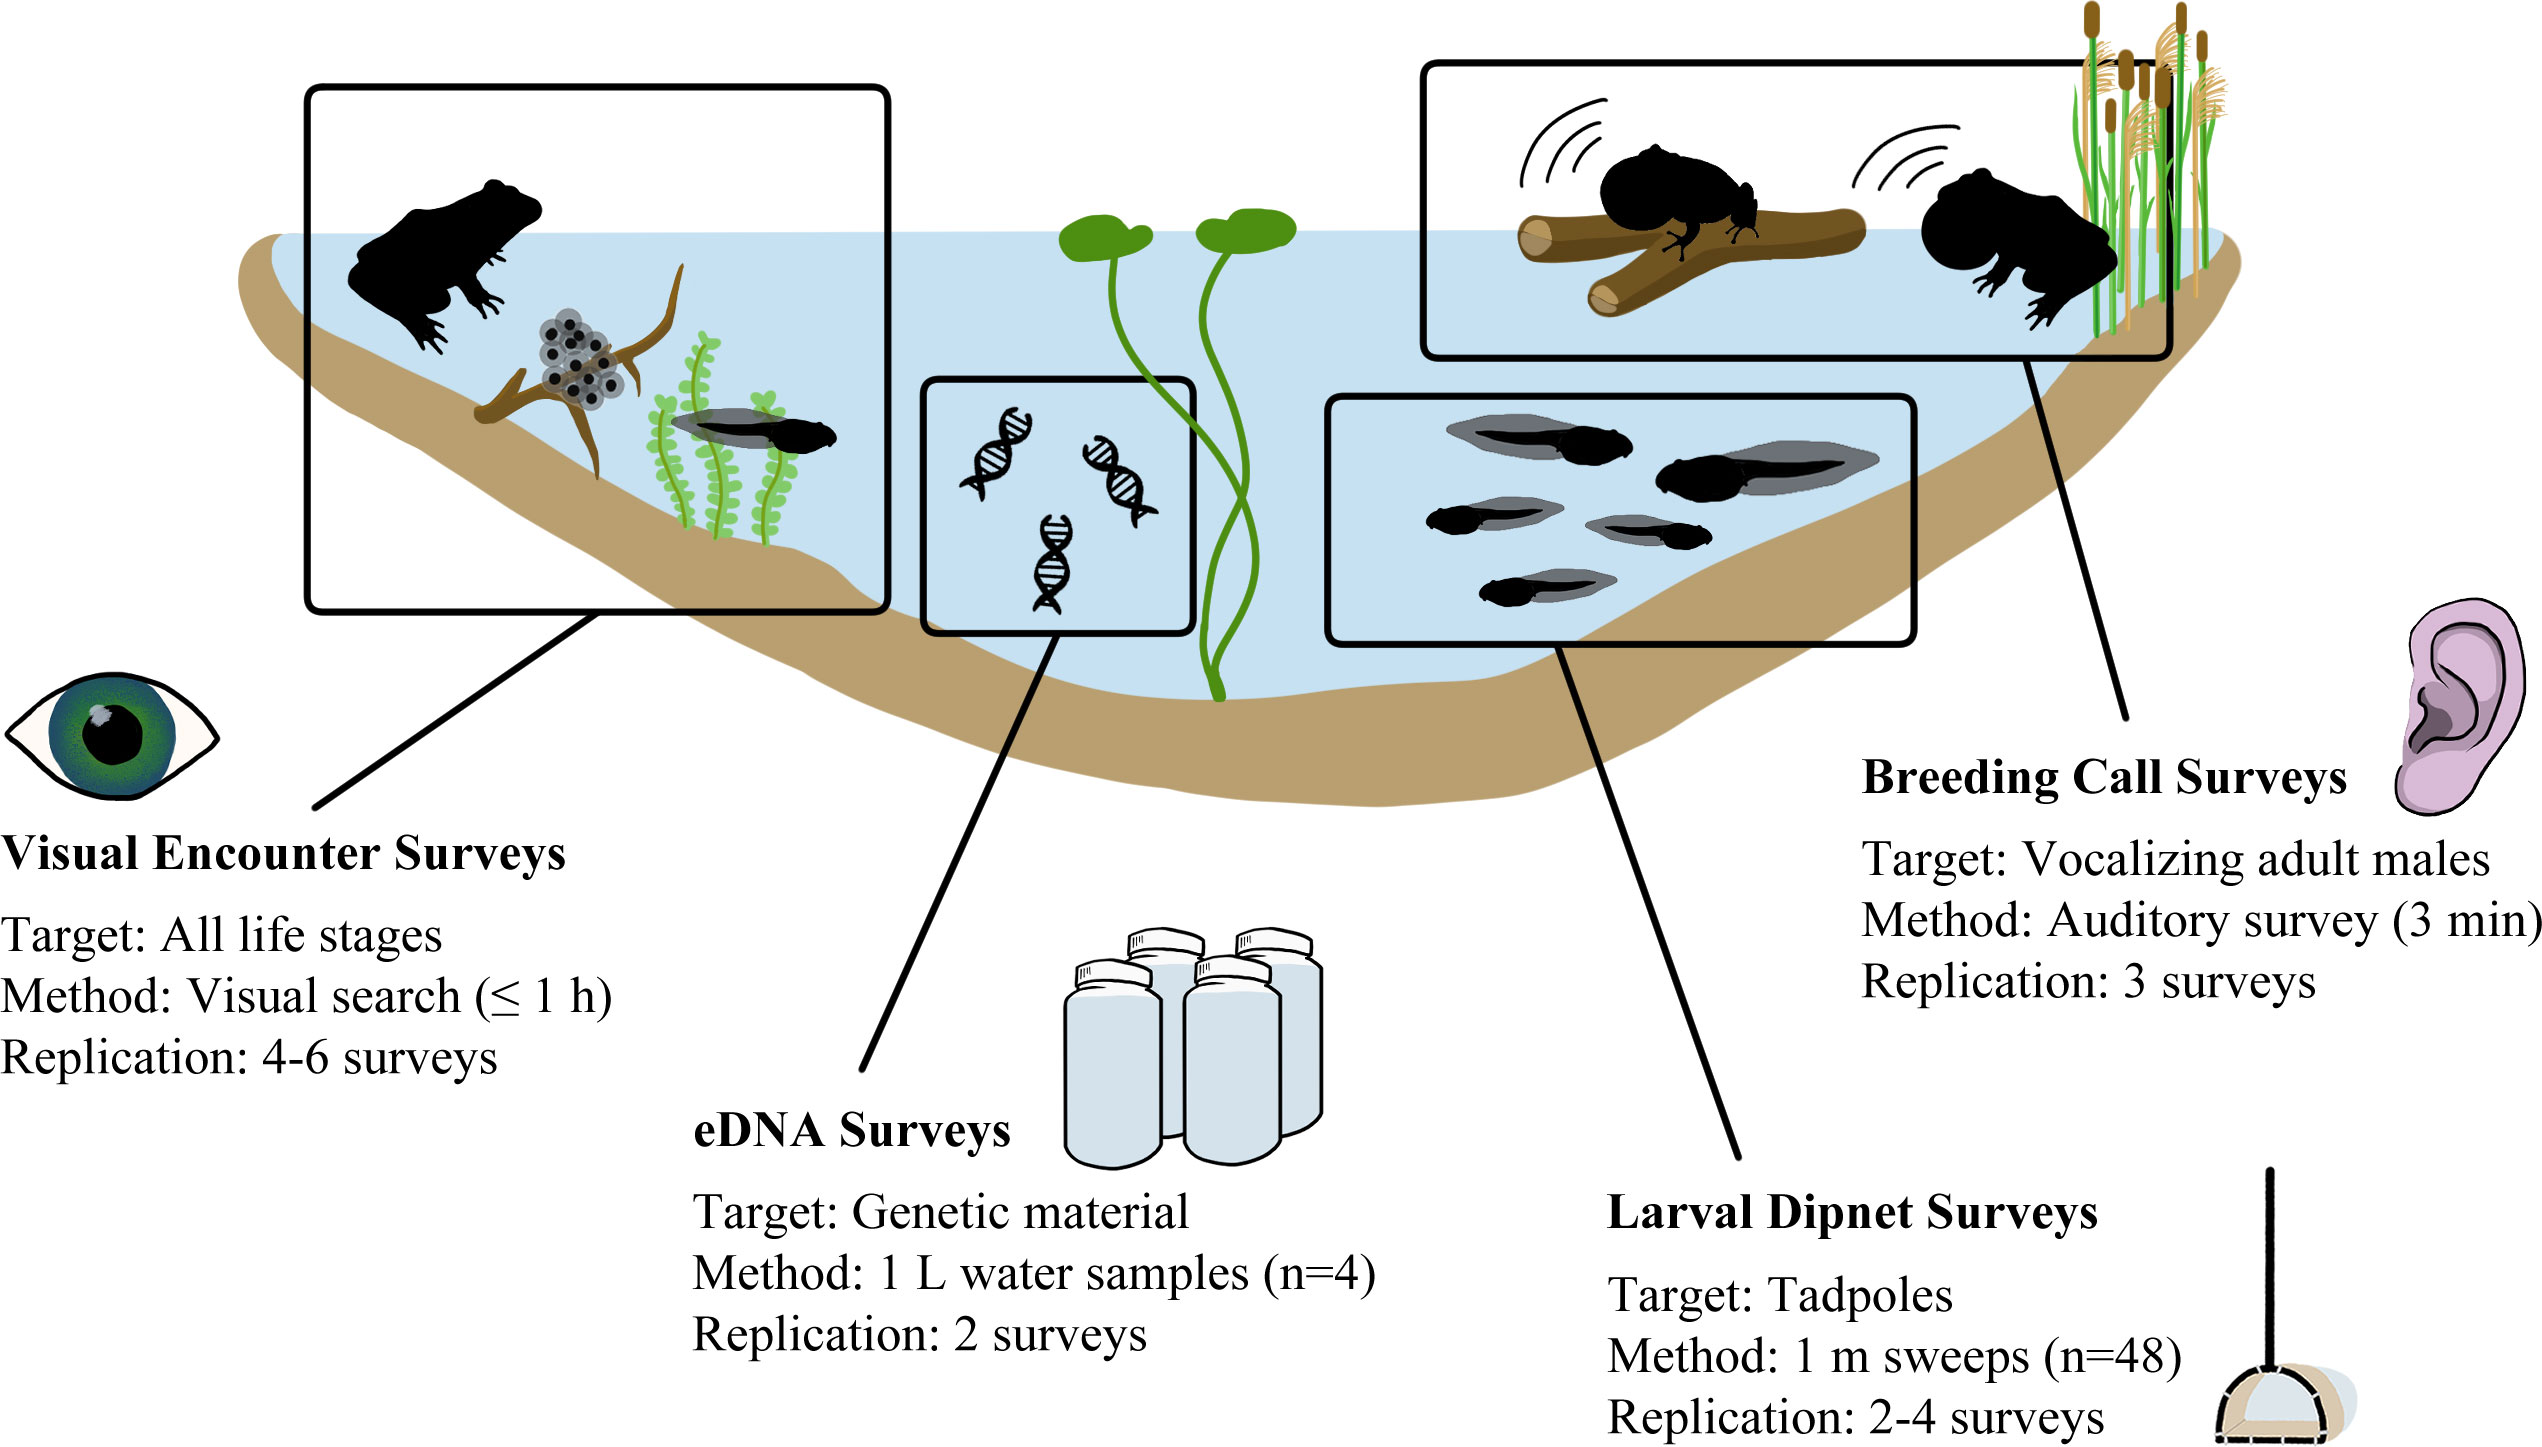
Figure 1 Conceptual framework depicting the amphibian monitoring survey techniques compared in this study, including each survey’s targets, methods, and level of replication.
Methods
Study area and target species
The study was conducted during April to August 2016 across 30 waterbodies near Peterborough, Ontario, Canada (Figure 2; Supplementary Table 1). The local anuran community is composed of nine species with diverse breeding and larval periods: American toad (Anaxyrus americanus), gray treefrog (Hyla versicolor), spring peeper (Pseudacris crucifer), boreal chorus frog (P. maculata), American bullfrog (Lithobates catesbeianus), green frog (L. clamitans), northern leopard frog (L. pipiens), mink frog (L. septentrionalis), and wood frog (L. sylvaticus; Tattersall and Ultsch, 2008; Mills, 2016). During the study, all field equipment was decontaminated with 10% bleach solution and rinsed to destroy residual DNA (Wilson et al., 2014), thereby avoiding cross-contamination from amphibian pathogens known to be present in the area (Vilaça et al., 2020; Congram et al., 2022).
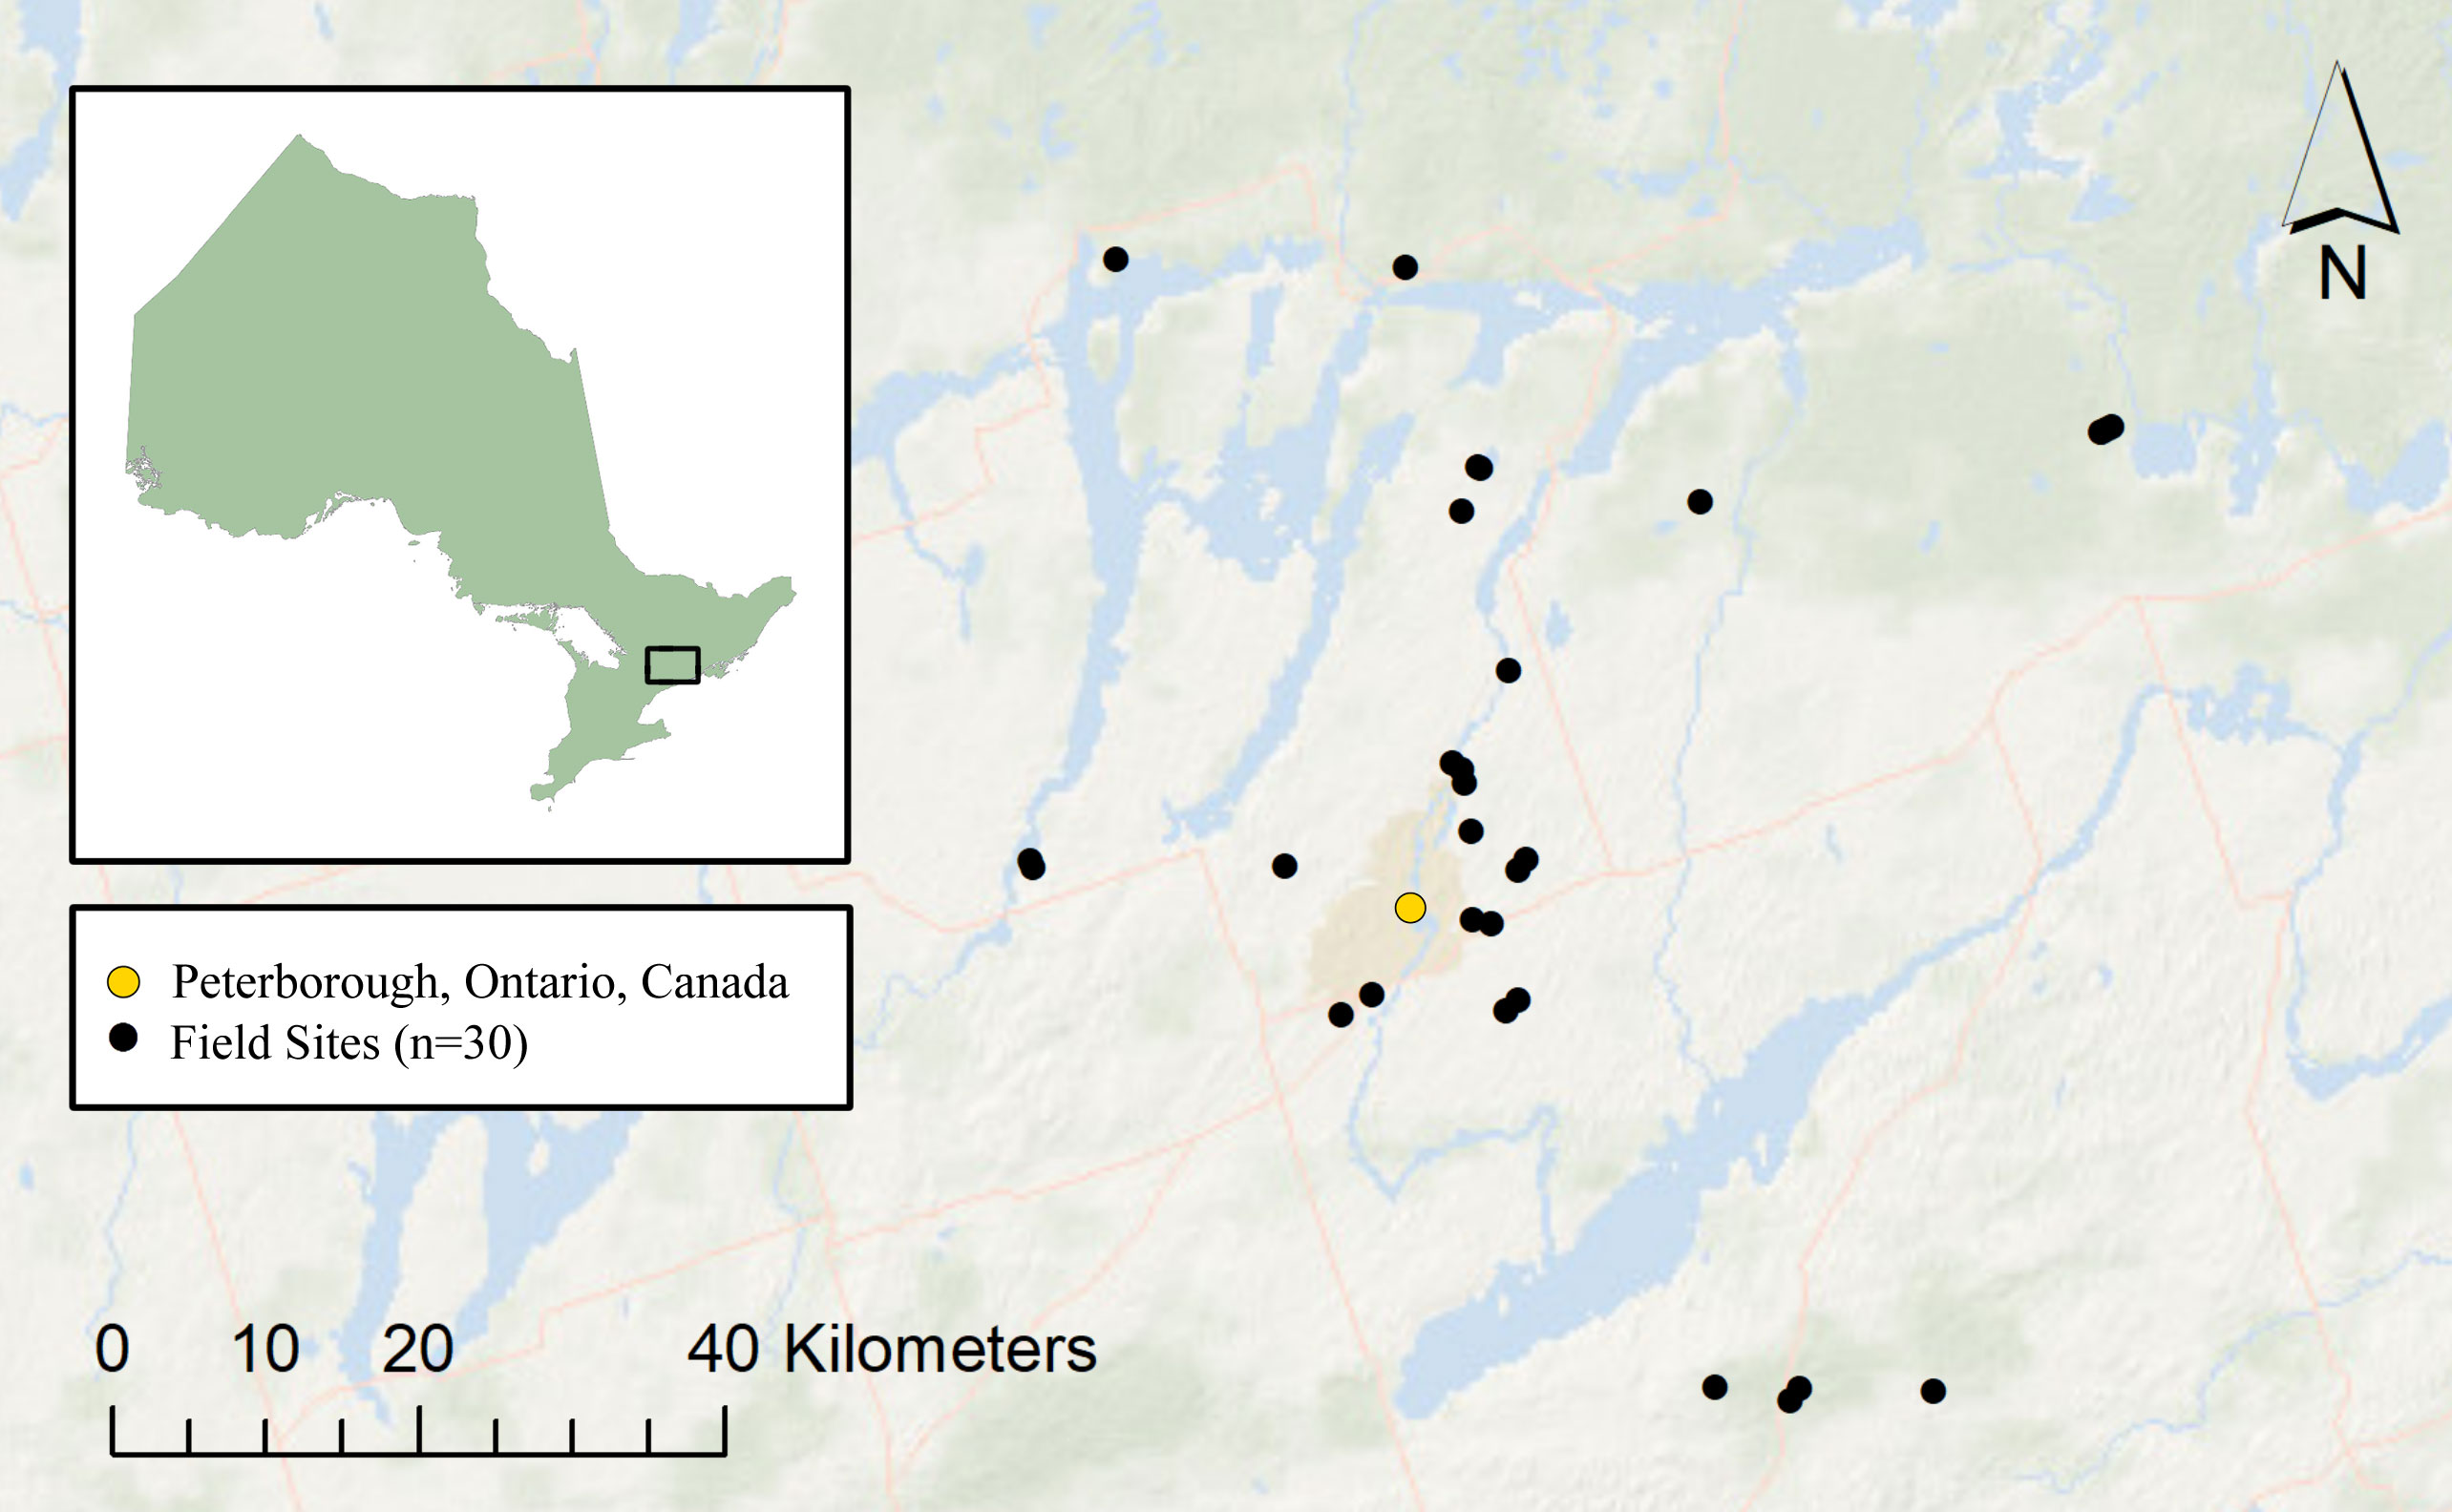
Figure 2 Location of field sites (n = 30) surrounding Peterborough, Ontario, Canada (44.3001°N, 78.3162°W).
Conventional surveys
We surveyed anurans in waterbodies using visual encounter (visual), breeding call (call), and larval dipnet (dipnet) surveys; different versions of these approaches form the basis of many contemporary anuran monitoring programs (e.g., Muths et al., 2005; Badzinski et al., 2008; Mattfeldt et al., 2009). Visual surveys targeted all life stages during spring (20 April to 19 May), early summer (6 June to 8 July), and later summer (28 July to 19 August) survey periods. Representative samples were obtained by surveying twice within each survey period, at 2- to 10-day intervals (Crisafulli, 1997). Two-member crews searched littoral (water depth ≤ 1.25 m) and riparian zones (transitional habitat between the water’s edge and a change in terrestrial vegetation/substrate, or up to 6 m from shore; Crisafulli, 1997) following parallel transects 2 m apart (Crump and Scott, 1994). We overturned all moveable cover and scanned water, leaf matter, and vegetation for organisms. When water was too deep to wade, we made observations along the waterbody’s perimeter (Crisafulli, 1997). Surveys ended once all accessible habitats had been searched or 1 h had elapsed. For sites that could not be completely searched within 1 h, new transects were established during subsequent visits.
Dipnet surveys targeted larvae and took place during the early summer and late summer sampling periods to ensure sufficient development of tadpoles for species identification. Two surveys were conducted within each sampling period, at 2- to 10-day intervals (Crisafulli, 1997). We established transects extending the length of the waterbody’s perimeter or until 100 m was reached and divided each transect into 12 equal-length segments that were further divided into four equivalent depth zones (to a maximum possible depth of 1.4 m; Shaffer et al., 1994). An equal-volume 1-m sweep was taken haphazardly within each depth zone, and netted larvae were identified to species before being returned to their habitat at survey’s end (Shaffer et al., 1994). This process was repeated for each of the 12 segments, totaling 48 sweeps per survey (Shaffer et al., 1994). Shallow water level precluded dipnetting at one site.
Call surveys targeted vocalizing adult males during their breeding period. To encompass breeding periods of all target species, 3-min point surveys (Shirose et al., 1997) were conducted three times at intervals of >15 days (Bird Studies Canada, 2009). Sampling periods spanned early breeding (29 April to 5 May), mid breeding (20 May to 24 May), and late breeding (18 June to 29 June). As per the Marsh Monitoring Program’s Amphibian Survey Protocol, surveys ran between 30 min after sunset and midnight, with minimum air temperatures of 5°C, 10°C, and 17°C, respectively (Bird Studies Canada, 2009). We used two observers/survey to account for inter-observer variation (Pierce and Gutzwiller, 2007). Surveys were conducted at least 5 min after observer arrival at the site and composed of identifying anuran calls <100 m from their point location and spanning 180° in front of them (Bird Studies Canada, 2009). Calls were indexed as follows: no calls (0); calls were not overlapping and individuals could be counted (1); some calls overlapped and individuals could be estimated (2); and calls were continuous/overlapping (full chorus) and individuals could not be reliably estimated (3) (Bishop et al., 1997; Bird Studies Canada, 2009).
eDNA sample collection, filtration, and extraction
eDNA surveys were conducted twice per site, during the spring and early summer sampling periods. For each survey, we collected four 1-L surface water samples from each of the four cardinal directions or ≥ 20 m apart. Samples were transported in a cooler with ice, and each cooler contained a negative water sample (cooler blank).
Water samples were refrigerated at 4°C for ≤ 12 h (Hinlo et al., 2017) and filtered through 4.7-cm-diameter grade 691 1.5-µm Glass Microfibre Filters (VWR, Radnor, PA, USA) on a Filter Funnel Manifold (Pall Corporation, Port Washington, NY, USA) by an EZ-stream vacuum pump (Millipore Sigma, Billerica, MA, USA). Filtration equipment was sanitized using 10% bleach solution and thorough rinsing with deionized water, and 500 mL of deionized water was filtered pre- and post-sample filtration (filter blanks) to monitor for contamination (Wilson et al., 2014). Clogged filters were replaced ≤ 4 times, and detritus was removed prior to storage at −80°C (Wilson et al., 2014).
We extracted filters in halves using the DNeasy Blood & Tissue DNA Kit (Qiagen Inc., Valencia, California, USA; Hinlo et al., 2017). Following Goldberg et al. (2011), samples digested overnight in 360 µL of lysis buffer and 40 µL of Proteinase K (20 mg/mL), and undigested material was removed using QIAshredders (Qiagen Inc., Valencia, CA, USA). Extracted DNA was eluted twice with 100 µL of 70°C TlowE (10 mM Tris, pH 7.5, 0.1 mM EDTA) to increase yields (Xue et al., 2009) and purified using the OneStep™ PCR Inhibitor Removal Kit (Zymo Research, Irvine, CA, USA). We stored recombined sample halves at −20°C.
qPCR eDNA assays
Standard curves were generated using two standard dilution series from 1 to 106 copies of synthetic oligonucleotides per 5-µL volume, designed as per Wilson et al. (2016). Species-specific amplicons (71–130 bp) within the mitochondrial cytochrome c subunit 1 (CO1) barcoding region were amplified using primers and probes developed by Beauclerc et al. (2019). Each 20 µL of qPCR reaction contained 10 µL of Taqman® Environmental Master Mix 2.0 (Applied Biosystems, Waltham, MA, USA), 0.4 µM forward primer, 0.4 µM reverse primer, 0.4 µM species-specific probe, 0.4 µM synthetic probe, 3.4 μL of ddH2O, and 5 µL of extracted DNA. Samples were amplified in triplicate (three qPCR replicates) using the StepOnePlus™ Real-time PCR System (Applied Biosystems, Waltham, MA, USA) under the following parameters: 50°C for 2 min, 95°C for 10 min, and 40 cycles of 95°C for 15 s and a species-specific temperature for 1 min (Beauclerc et al., 2019).
eDNA validation
During preliminary tests, inconsistencies between eDNA and visual survey results from the previous year (2015) led us to suspect inhibition at one site. While internal positive controls (IPCs) did not indicate inhibition, assays returned unexpectedly low DNA yields when this site’s samples were combined with uninhibited ones. Thus, we attempted to minimize inhibition by using the Zymo’s OneStep™ PCR Inhibitor Removal Kit (Williams et al., 2017) and the Environmental Master Mix (Applied Biosystems, Waltham, MA, USA; Jane et al., 2015).
To minimize the likelihood of false-positive detections, a limit of detection (LOD) was calculated using threshold cycle (Ct) values from qPCR standard dilution series (n = 24–29) for each species (Hunter et al., 2017). The upper 95% confidence interval was selected as a conservative LOD, ranging from 0.13 to 0.47 copies per reaction depending on species (Supplementary Table 2). A limit of quantification such as that suggested by Serrao et al. (2018) was not calculated, as samples were not collected from wetlands where species were known to be absent a priori. To monitor for contamination, we also analyzed nine extraction negatives and 19–24 qPCR negatives for all species. Green frog was used as a proxy for additional contamination monitoring as it was detected at 100% of field sites, and we analyzed all cooler blanks (n = 28) and 40 randomly selected filter blanks (27% of total) for green frog DNA.
To assess variability among qPCR assays, a coefficient of variation (CV) was calculated for qPCR triplicates of positive eDNA samples. An eDNA detection required that at least one of the three qPCR replicates produced an amplification curve with a copy number above the species-specific LOD (see Dejean et al., 2012; Sigsgaard et al., 2015; Smart et al., 2015). Replicates that fell below the species-specific LOD were converted to zero-values, and triplicates were averaged to determine a final quantity for each sample. A site-level detection required that a species be detected in at least one sample.
Statistical analysis
We assessed whether sampling period affected prevalence of detections by scoring presence–absence species detections for conventional surveys (visual, n = 160; dipnet, n = 98; call, n = 90) and above species-specific LOD thresholds for all eDNA samples(n = 240). Generalized linear models used sampling period as the predictor and presence-absence as the response (package stats, glm function; R Core Team, 2019), using a type III likelihood ratio chi-square test (package car, Anova function; Fox and Weisberg, 2019). Statistical significance is a function of sample size and should not be conflated with biological significance (Gibbons and Pratt, 1975; Yoccoz, 1991); we report p-values to help contextualize results, but we also interpret trends in the data rather than exclusively relying on an arbitrary threshold p-value.
We assessed community similarity across time by calculating Jaccard similarity coefficients (J) between each sampling event (pooling data from all sites) using
where A is the number of species detected during sampling event a, B is the number of species detected during sampling event b, and C is the number of species detect in both (Jaccard, 1908; Real and Vargas, 1996). For ephemeral waterbodies with seasonal drying, analyses were limited to periods when water was present.
We tested whether survey method influenced species prevalence assessment via generalized logistic mixed-effects regressions (GLMER) for each species with site-level detection (presence-absence) as the response, survey type as the predictor, and site as a random effect to account for repeated sampling (package lme4, GLMER function; Bates et al., 2019). We estimated marginal means (package emmeans, emmeans function with Tukey adjustment; Lenth, 2019) to determine p-values of each survey type. Boreal chorus frog, American bullfrog, and mink frog were excluded due to low sample size. In addition, low variance in green frog’s prevalence among survey methods resulted in the GLMER failing to converge as expected. Thus, we used a chi-square test and post-hoc pairwise analysis (package stats, chisq.test function; R Core Team, 2019) as a substitute for a GLMER in this case; visual and eDNA surveys were analyzed as a single category because they yielded identical site-level detections for green frog.
Last, we used Jaccard coefficients to assess the community similarity inferred from the different detection methods. All analyses were conducted in R version 3.6.1 (R Core Team, 2019).
Results
Conventional surveys
Conventional survey methods differed in their species detections: Visual surveys resulted in detections for all nine target species, but call surveys failed to detect American bullfrog or mink frog at all, and dipnet surveys never detected American bullfrog, mink frog, or boreal chorus frog. Notably, visual surveys rarely detected boreal chorus frogs but successfully detected green frogs in all 30 waterbodies. In contrast, call and dipnet surveys each detected green frogs at only 73.3% of sites (Table 1).
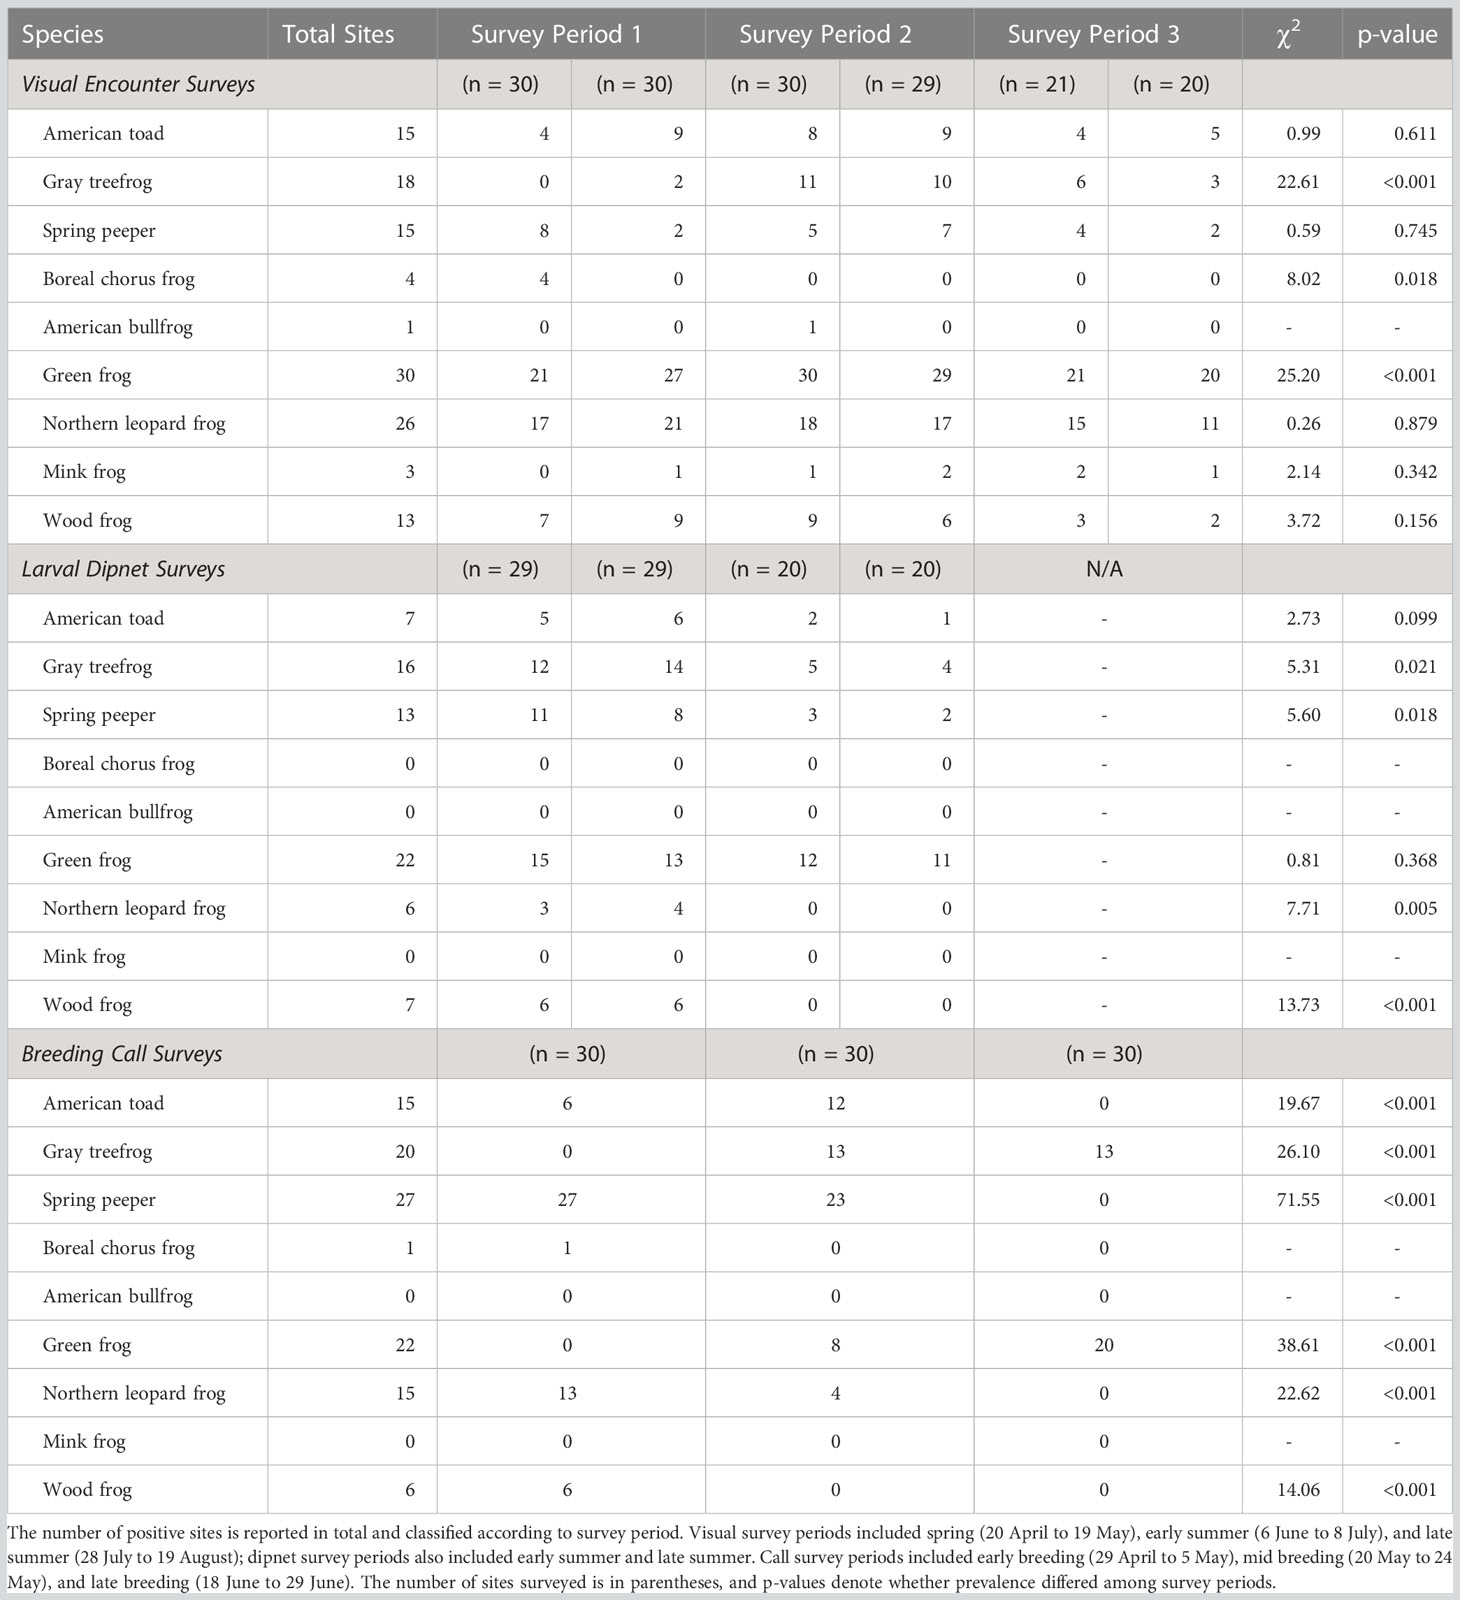
Table 1 Outcome of conventional amphibian monitoring surveys across 30 waterbodies in southern Ontario, Canada.
Species were detected inconsistently through sampling periods. For visual surveys, gray treefrogs were detected most frequently in early summer, boreal chorus frogs only in spring, and green frogs least frequently in spring (Table 1). Of the six species detected via dipnet surveys, four were mostly or entirely captured in early summer (Table 1). Dipnet surveys yielded comparable detections across sampling periods for green frogs and a trend of more frequent American toad detections in early spring (Table 1). For call surveys, boreal chorus frogs were detected at only one site during early breeding. For the remaining six species detected via call surveys, each had significantly different detection rates between sampling periods (Table 1).
Expectedly, breeding call surveys exhibited high variability in community composition among temporally distinct sampling events (Figure 3). To a lesser extent, community composition from dipnet and visual surveys also shifted through time. In addition, for call and dipnet surveys, sampling events separated by shorter time intervals yielded more similar communities compared to more temporally distant events (Figure 3).
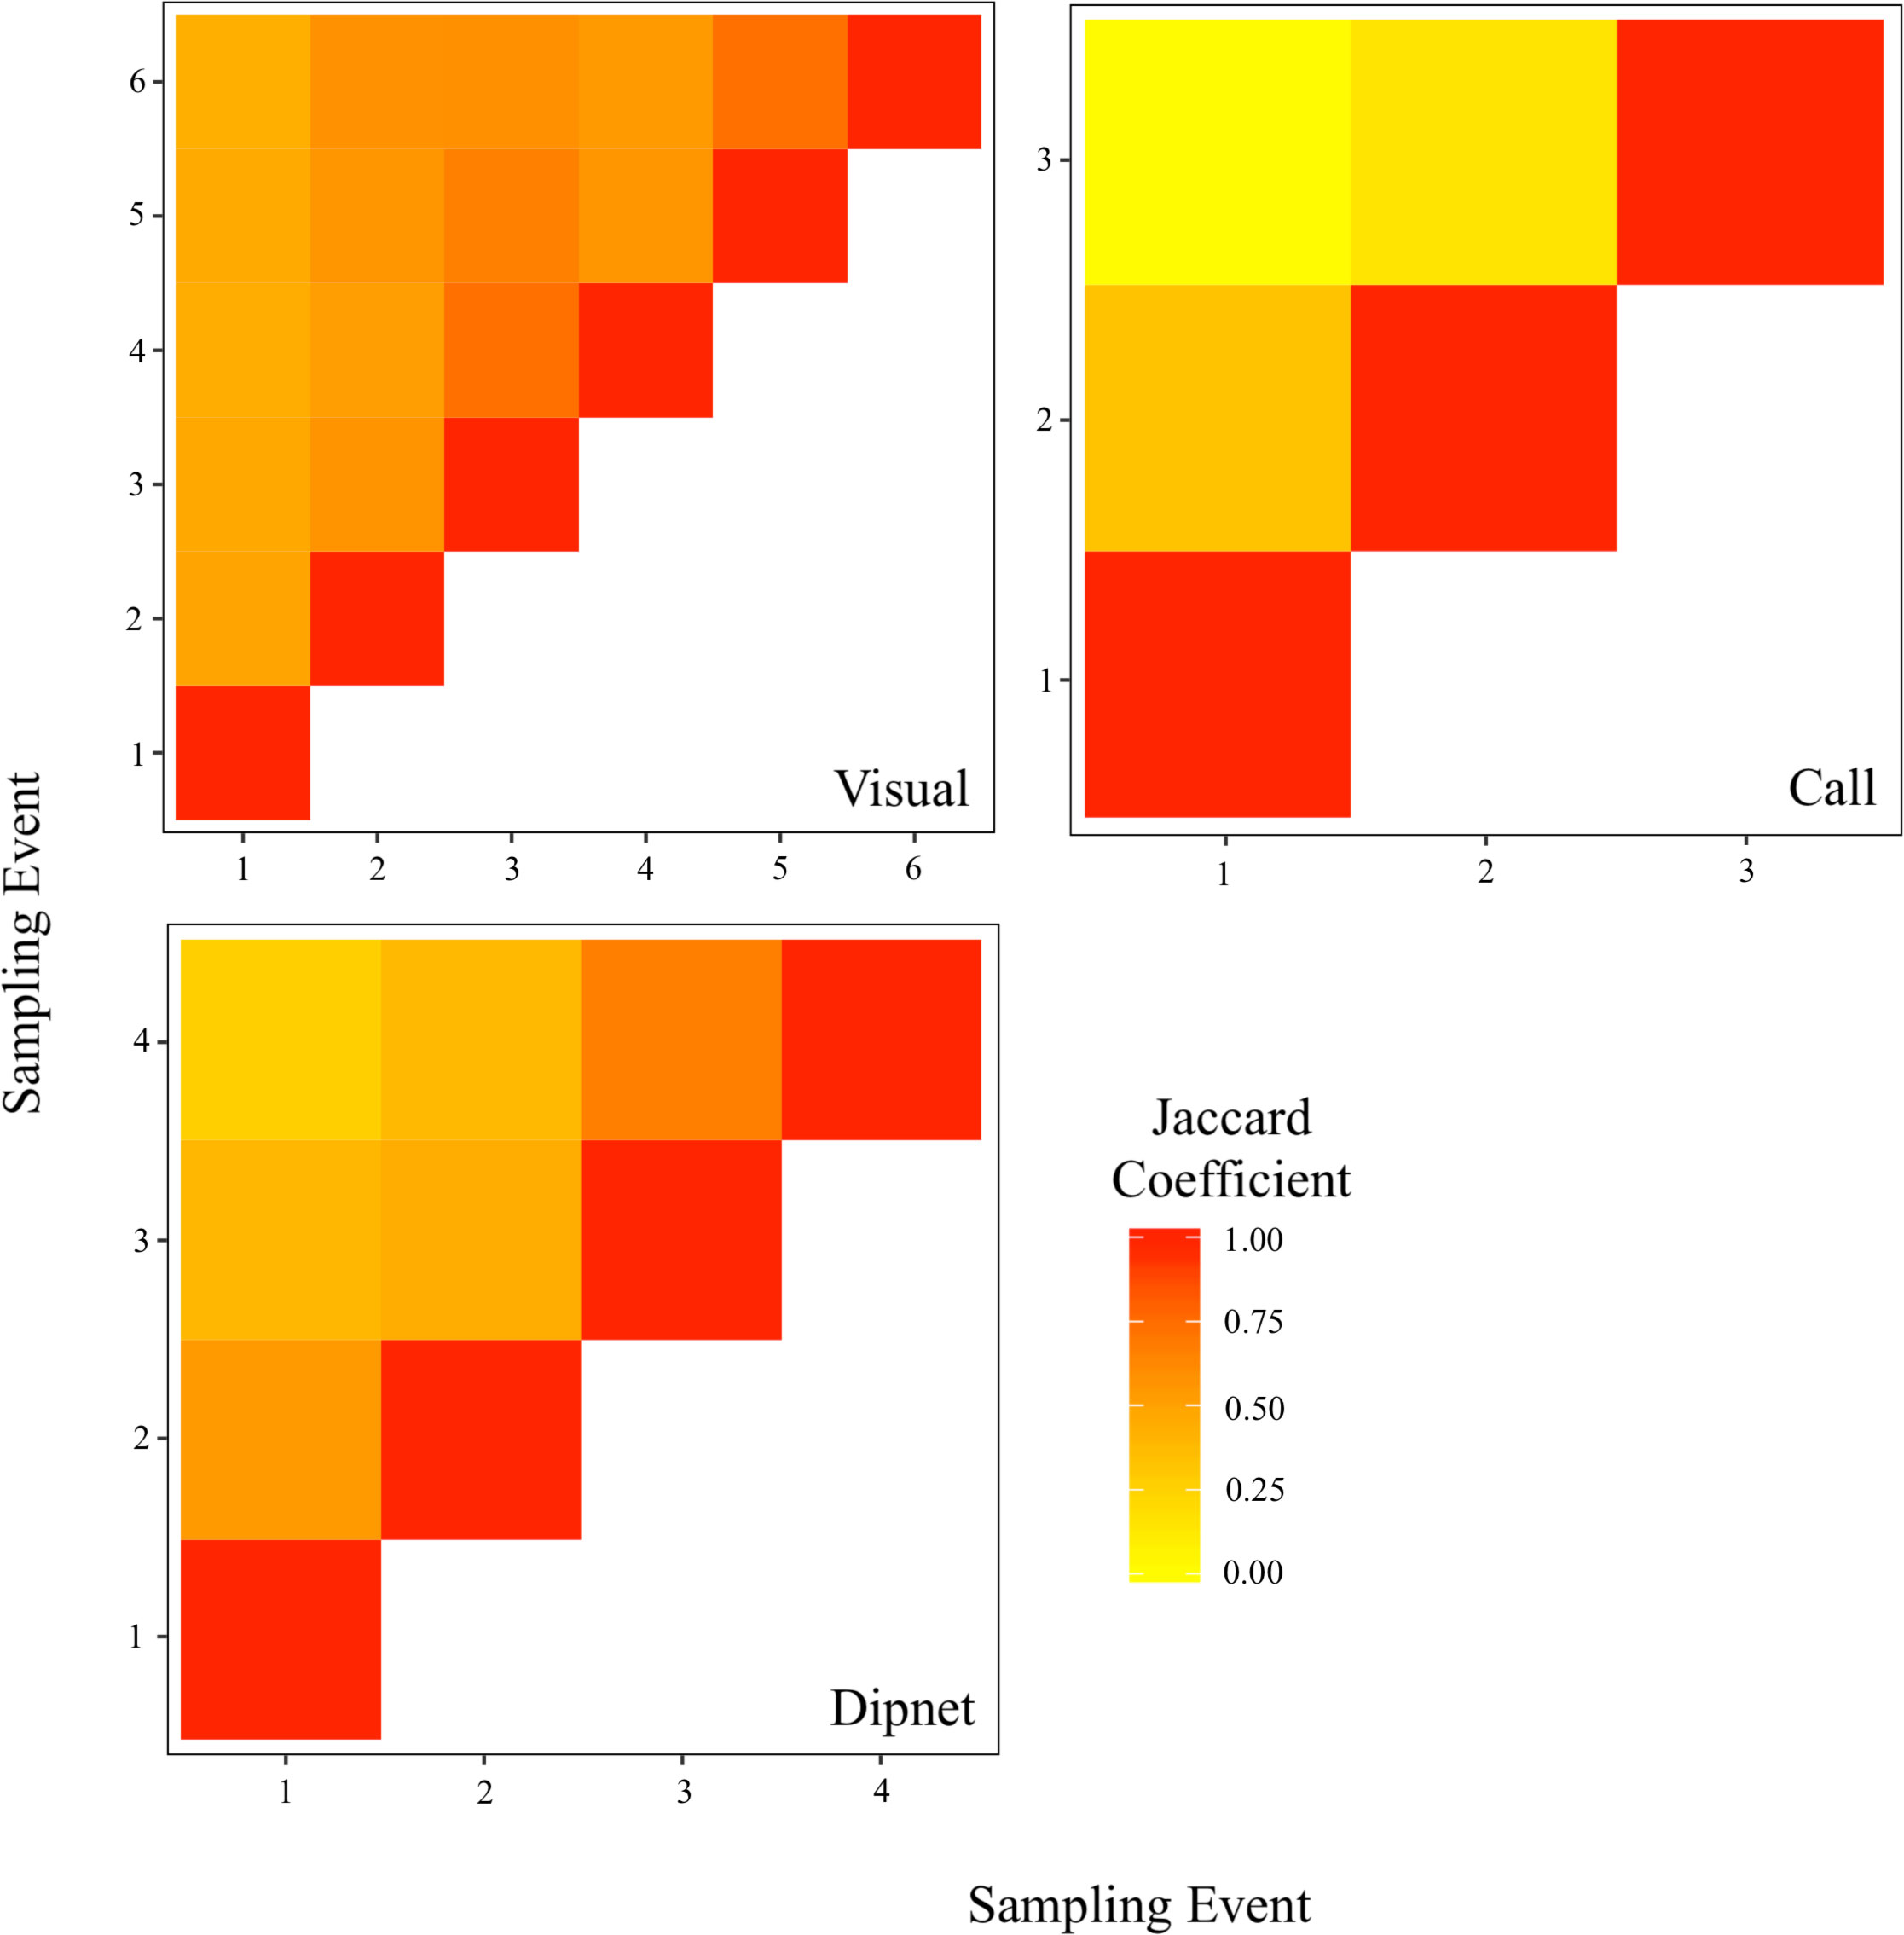
Figure 3 Community similarity between sampling events for three conventional amphibian monitoring methods. Surveys targeted nine amphibian species across 30 waterbodies in southern Ontario, Canada. Jaccard coefficients (J) are expressed on a gradient from 0.00 (completely dissimilar; yellow) to 1.00 (identical; red). Sampling events occurred during distinct survey periods: visual surveys 1 and 2 occurred in spring (20 April to 19 May); visual surveys 3 and 4, and dipnet surveys 1 and 2 occurred in early summer (6 June to 8 July); visual surveys 5 and 6, and dipnet surveys 3 and 4 occurred in late summer (28 July to 19 August); call surveys occurred during early breeding (29 April to 5 May), mid breeding (20 May to 24 May), and late breeding (18 June to 29 June).
eDNA—qPCR assays and contamination monitoring
Amplification efficiencies for qPCR assays were within the generally accepted bounds of 90%–110% (Raymaekers et al., 2009), where the ideal amplification efficiency is 100% (Rogers-Broadway and Karteris, 2015). Primer-probe sets also performed as expected, detecting DNA at all standard concentrations. Standards containing one copy per reaction had the lowest amplification frequency for gray treefrog (8.7%), boreal chorus frog (12.0%), and American toad (16.7%), with all others amplifying in 32.0%–60.9% of replicates (Supplementary Table 2). Standards containing 10 copies per reaction amplified in between 79.2% and 100% of assays, and all other standards (102–106 copies per reaction) amplified in 100% of assays.
eDNA procedures yielded low cross-contamination, with green frog DNA detected in one of the 28 cooler blanks (2.47 copies per reaction) and two of the 40 filtration blanks (0.82 and 0.29 copies per reaction). These assays ran separately from field samples and may indicate contamination between filtration manifolds. Of the qPCR and extraction negatives, 0.27 copies per reaction of mink frog DNA was detected in a single qPCR negative—a concentration below the species’ LOD (0.30 copies per reaction). This assay also detected mink frog DNA in three field samples: two detections were verified via another assay or conventional survey, and the third (2.2 copies per reaction) was both well above the LOD and taken from appropriate mink frog habitat. Thus, we included all samples in our analysis.
eDNA—field samples
Effectiveness of eDNA detection varied considerably among species and sites. Mean CV for qPCR triplicates ranged from 50.1% (American toad) to 173.2% (boreal chorus frog and American bullfrog; Supplementary Table 2). Across all species and sampling periods, intra-site variation ranged from 26.6% (n = 53) of detections occurring in one of the four samples compared to 34.7% (n = 69) in four of the four samples (Table 2). Species with notably low spatial repeatability included mink frog, which was never detected in more than two of the four spatial replicates at a given site. American bullfrog and boreal chorus frog were detected only in early summer and never in more than a single eDNA sample.
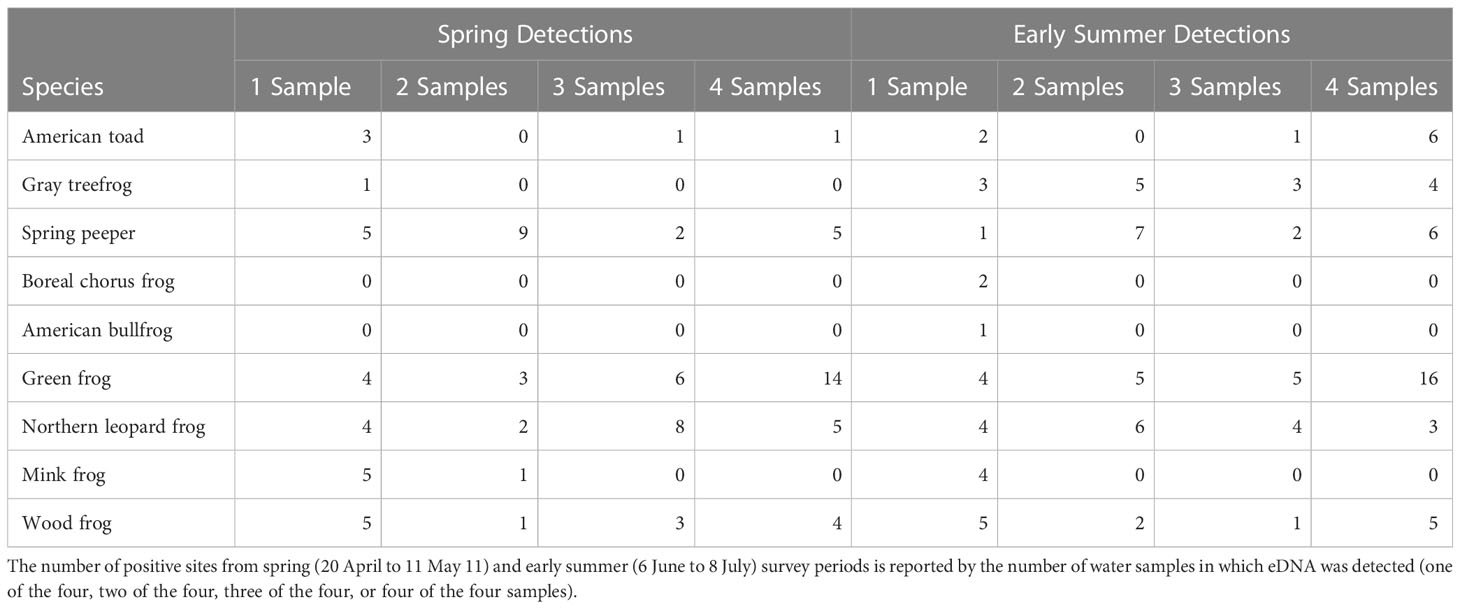
Table 2 Intra-site variation in eDNA amphibian monitoring surveys across 30 waterbodies in southern Ontario, Canada.
When using eDNA, most species were detected at between 30% and 80% of study sites (n = 30), with the exceptions of American toad (one site), boreal chorus frog (two sites), and green frog (all 30 sites; Table 3). Two species, American toad and gray treefrog, had greater detections in early summer than spring (both p< 0.001). All other species had comparable detections across sampling periods (p > 0.05). Notably, the inclusion of a second sampling period increased the number of occupied sites for all species (Table 3), with an evident shift in community composition between spring and early summer (J = 0.52).
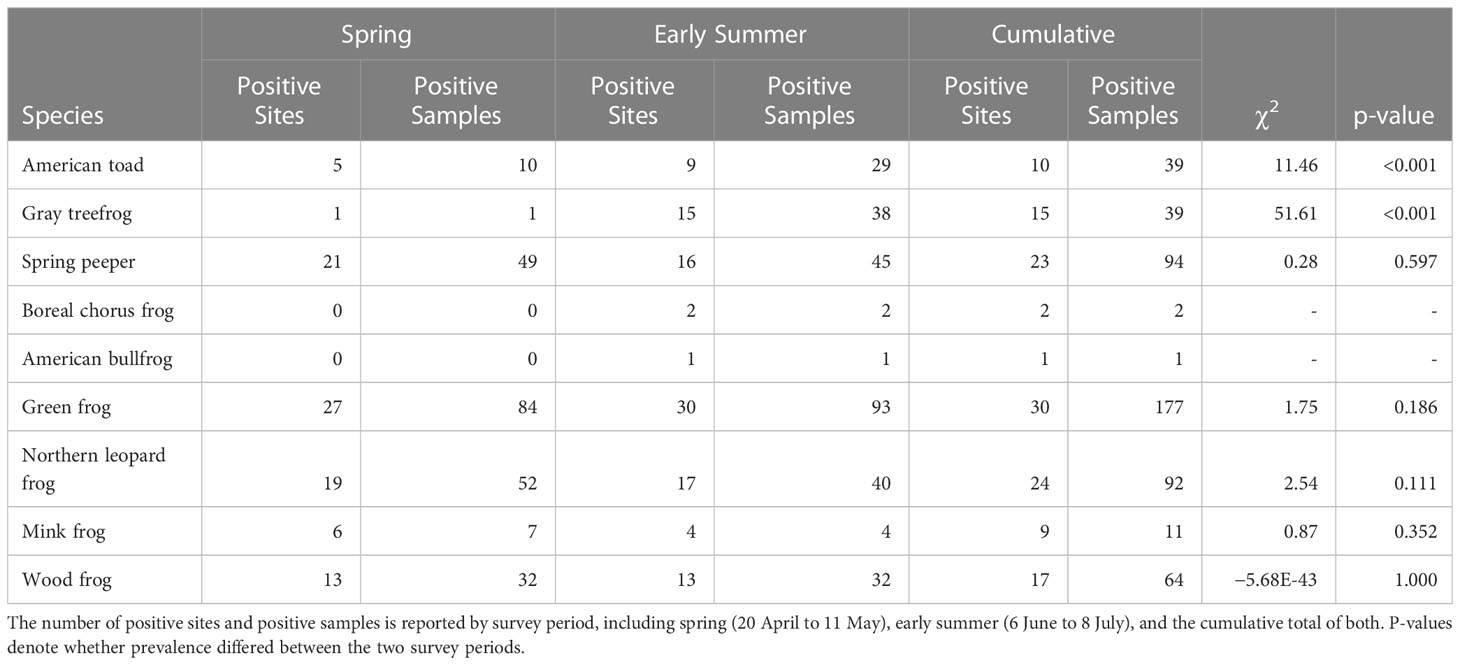
Table 3 Outcome of eDNA amphibian monitoring surveys across 30 waterbodies in southern Ontario, Canada.
Methods comparison
eDNA surveys detected the greatest mean species richness across sites (4.37 ± 0.28 species, mean ± SE), outperforming both call and dipnet surveys (Figure 4). While estimated species richness was comparable between eDNA and visual surveys (4.17 ± 0.26 species), eDNA sampling achieved these results more efficiently, with fewer site visits. Call surveys (3.53 ± 0.25 species) and visual surveys (3.63 ± 0.27 species) detected comparable mean species richness by the third survey, after which the field effort for call surveys ended. Dipnet surveys yielded in the lowest species richness (2.45 ± 0.23 species).
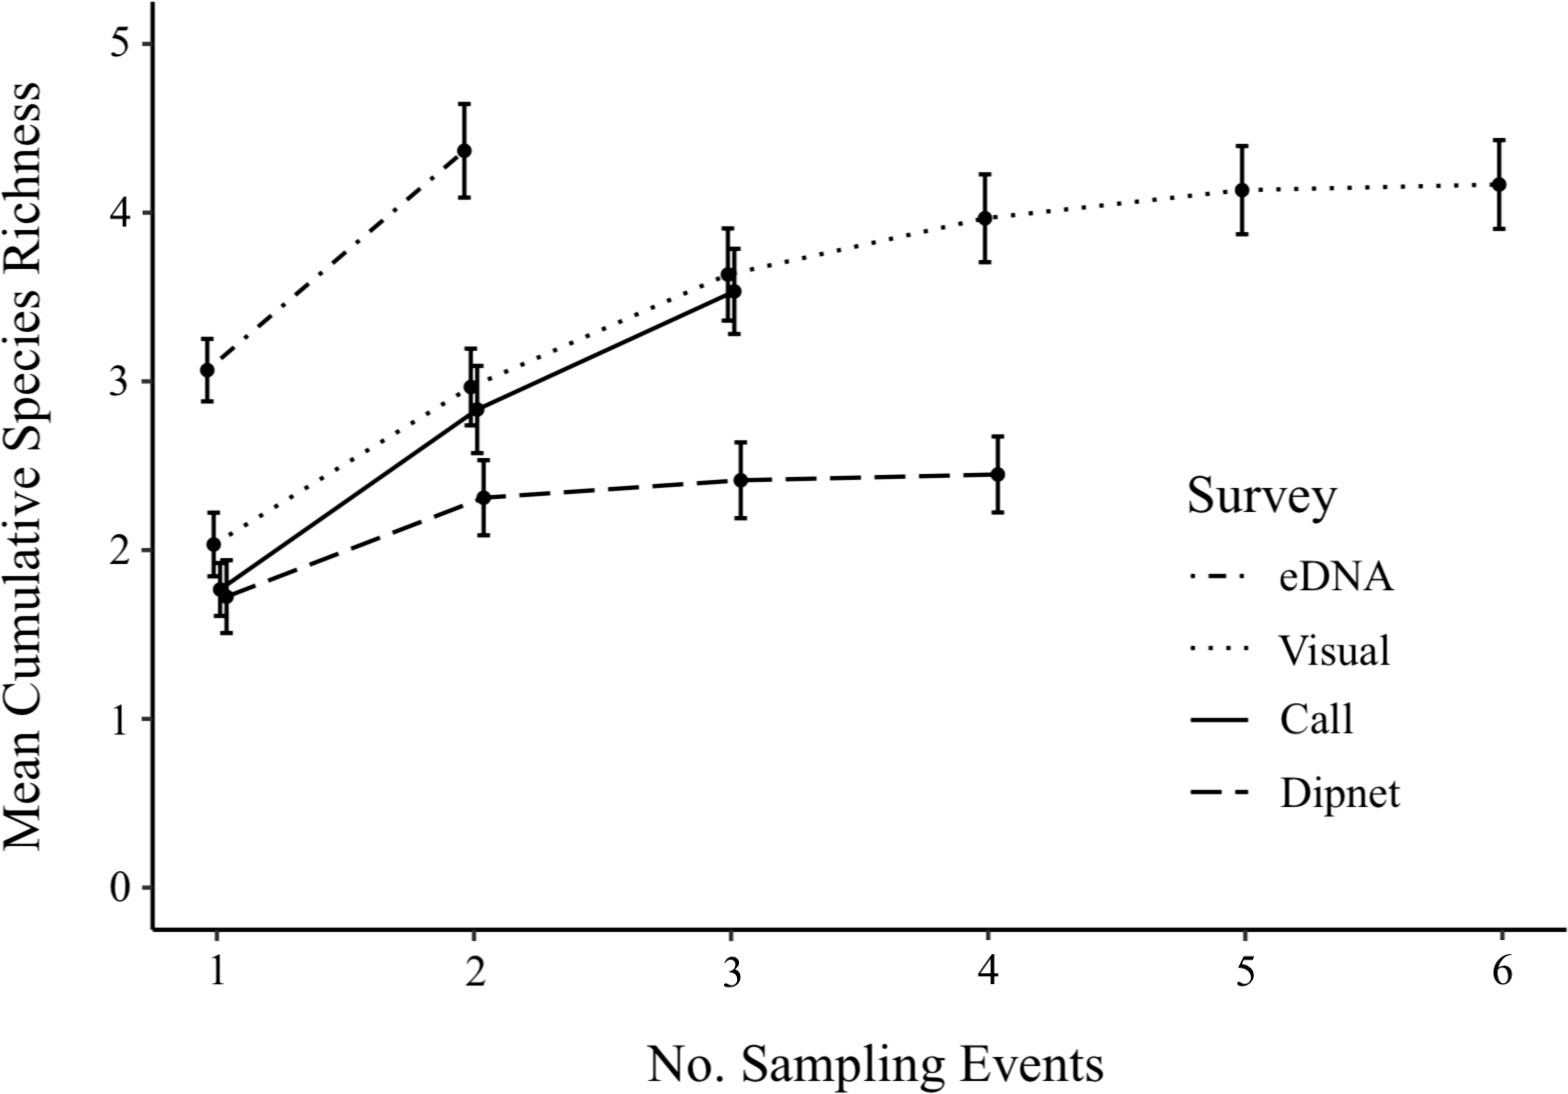
Figure 4 Cumulative species richness (± SE) from eDNA and conventional amphibian monitoring surveys across 30 waterbodies in southern Ontario, Canada. Surveys targeted nine amphibian species during distinct sampling periods: eDNA survey 1, and visual surveys 1 and 2 occurred in Spring (20 April to 19 May); eDNA survey 2, visual surveys 3 and 4, and dipnet surveys 1 and 2 occurred in early summer (6 June to 8 July); visual surveys 5 and 6, and dipnet surveys 3 and 4 occurred in late summer (28 July to 19 August); call surveys occurred during early breeding (29 April to 5 May), mid breeding (20 May to 24 May), and late breeding (18 June to 29 June).
Community composition was most similar between visual and eDNA surveys (J = 0.68), and least similar between dipnet and call surveys (J = 0.47). Visual and call surveys (J = 0.53), visual and dipnet surveys (J = 0.52), eDNA and dipnet surveys (J = 0.50), and eDNA and call surveys (J = 0.54) all exhibited differences in community composition.
Detection rates differed according to survey type for some species. Specifically, eDNA and call surveys both performed well for spring peepers, detecting them at 76.7% and 90.0% of sites, respectively, outperforming visual and dipnet surveys (Figure 5). eDNA and visual surveys detected green frogs and northern leopard frogs at high rates, outperforming dipnet and call surveys. In addition, eDNA performed the best for wood frogs, detecting them at 56.7% of sites, with visual surveys following at 43.3% (Table 4).
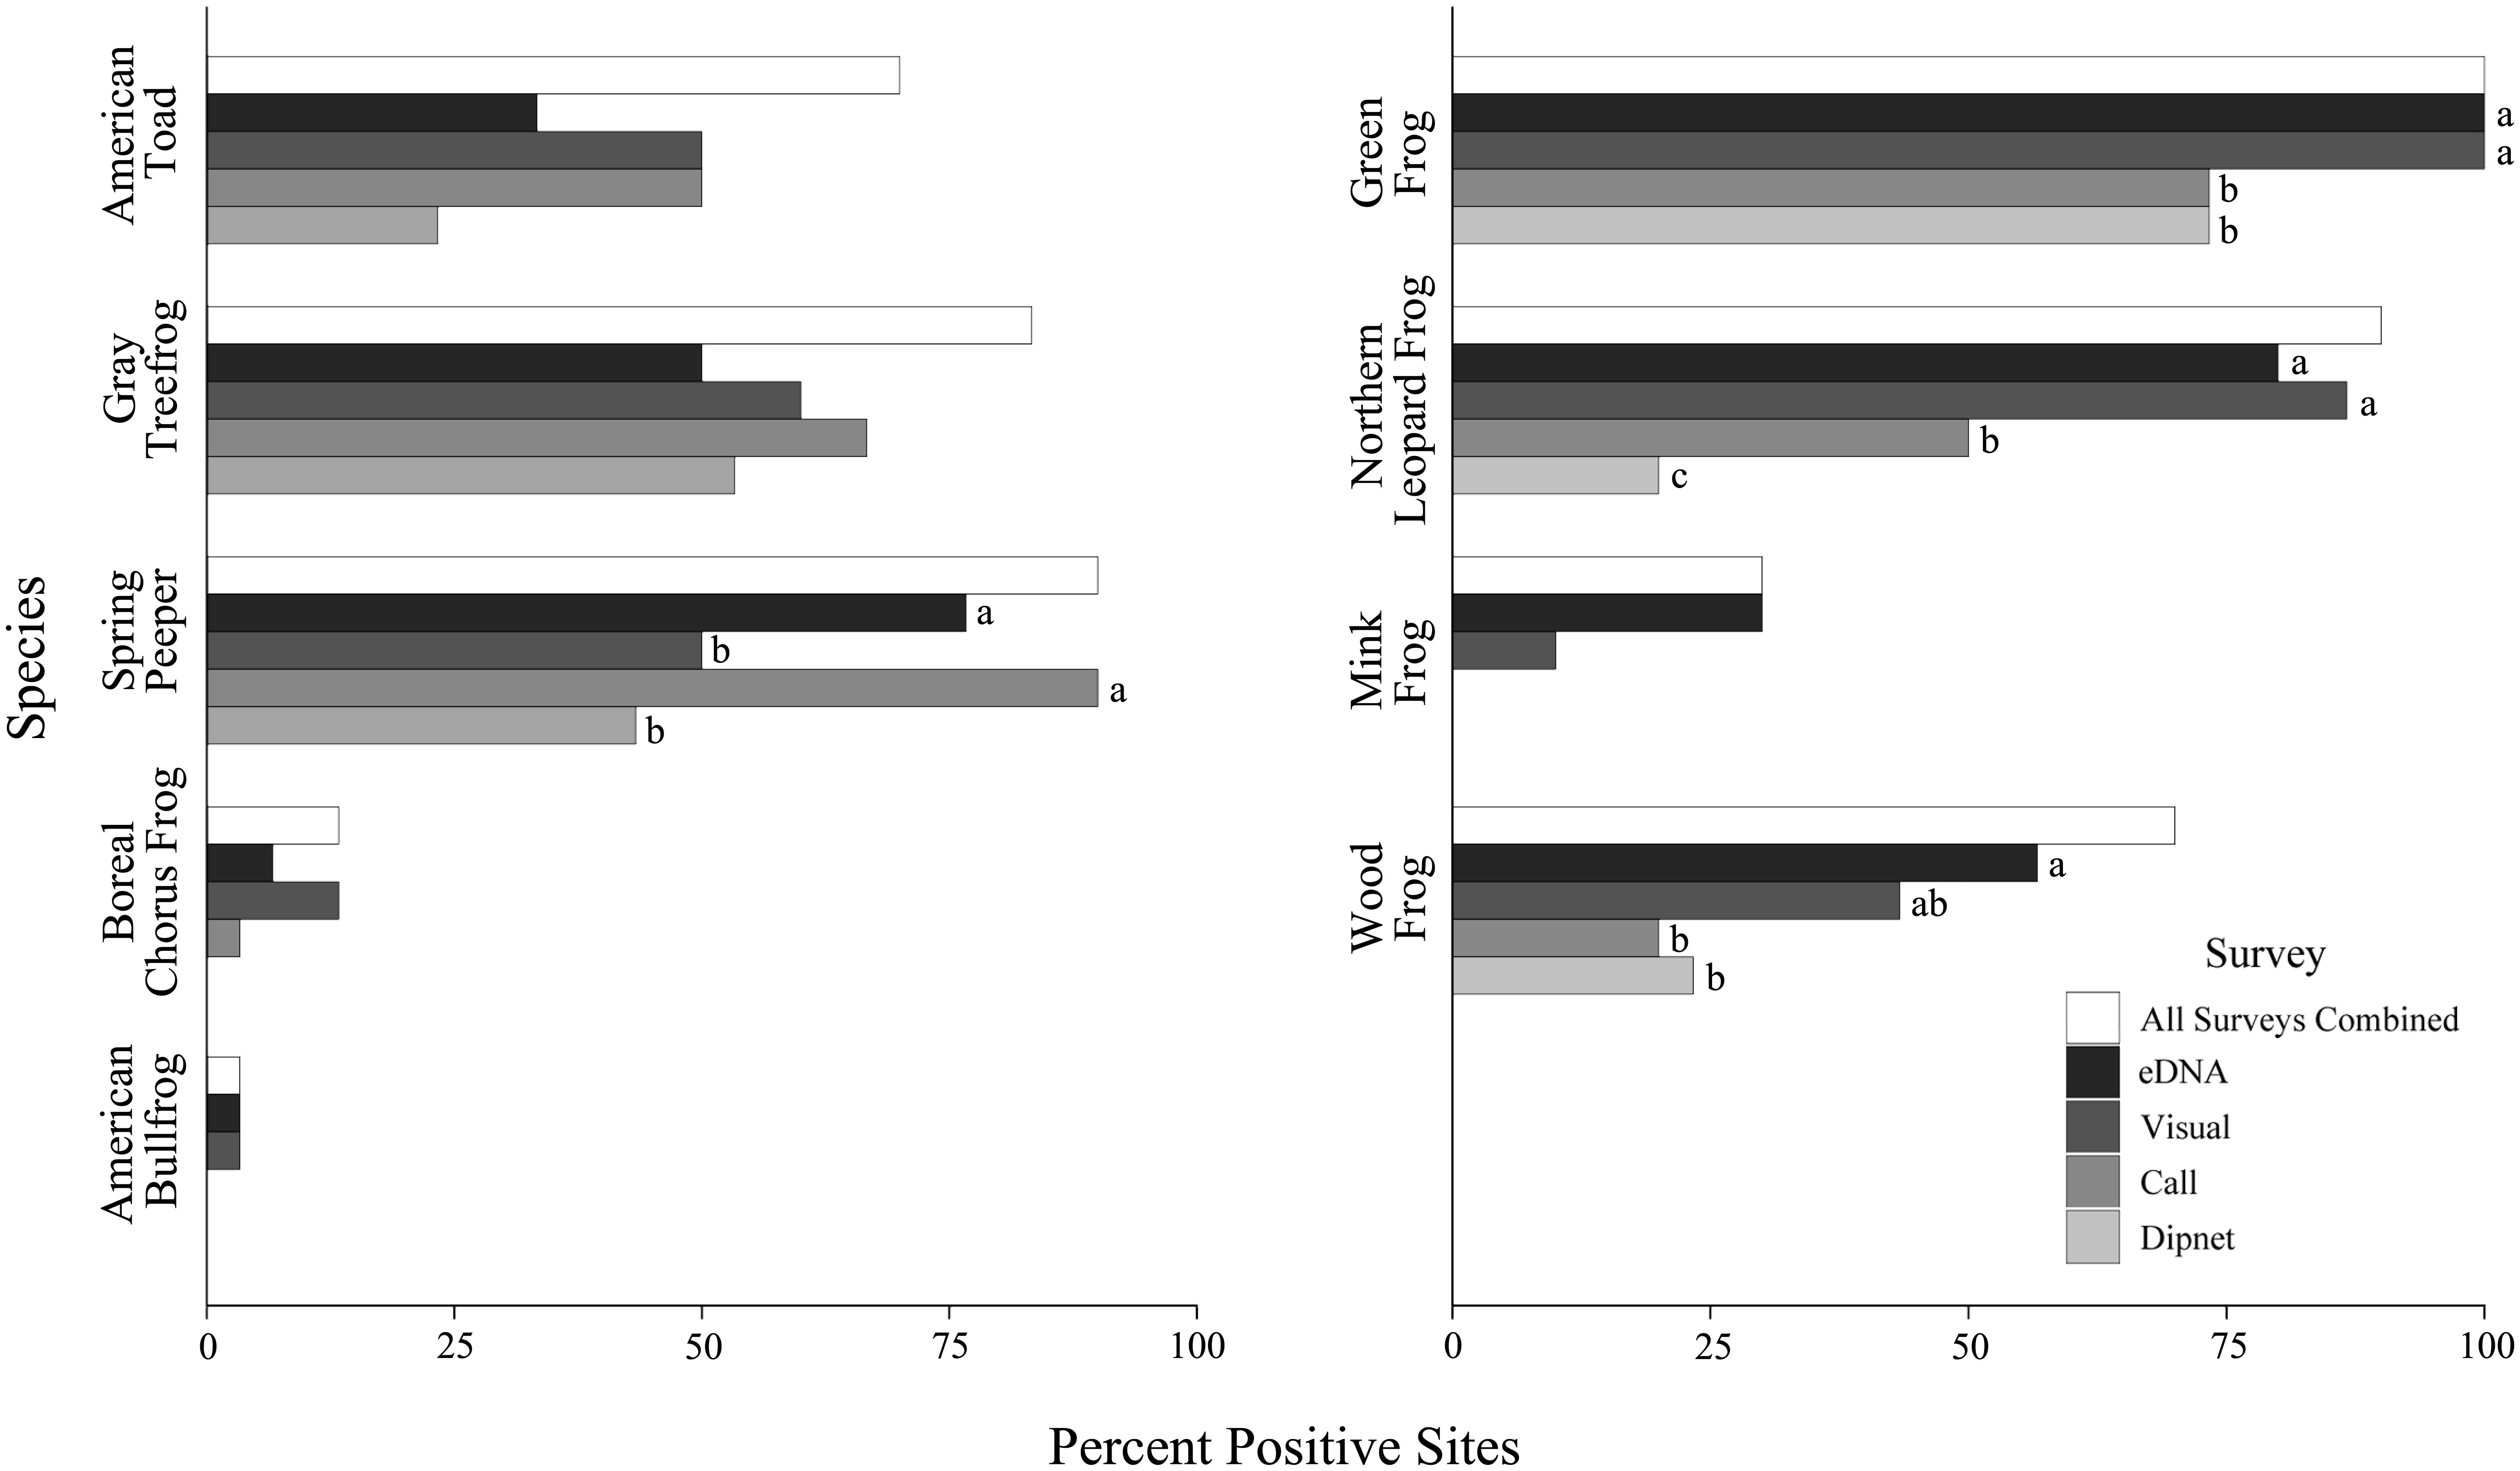
Figure 5 Outcome of eDNA and conventional amphibian monitoring surveys across 30 waterbodies in southern Ontario, Canada. Percentage of sites with detections for each species is given by survey type. The total occupied sites (results of all survey methods combined) are expressed in white. Letters indicate statistically significant differences in detection levels at p < 0.05 based on post-hoc analyses (Supplementary Table 3).
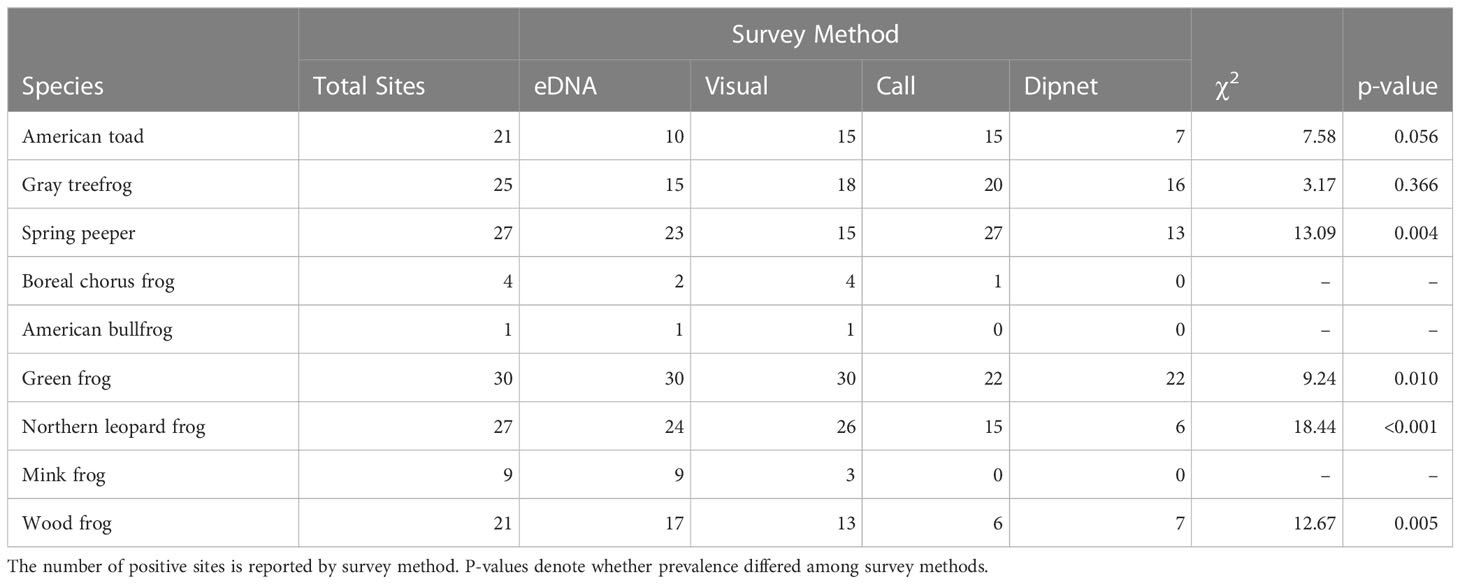
Table 4 Outcome of conventional and eDNA amphibian monitoring surveys across 30 waterbodies in southern Ontario, Canada.
Each method yielded unique detections, with eDNA leading with 14 unique detections across four species. Most notably, both mink frog and wood frog were detected solely by eDNA at six of the 30 sites each (Figure 6). Call surveys made 12 unique detections, compared to nine and one unique detection for visual and dipnet surveys, respectively. Notably, eDNA methods performed poorly when targeting American toad and gray treefrog, with eDNA detected at 47.6% (10 of 21) and 60.0% (15 of 25) of known occupied sites, respectively. Call and, to a lesser extent, visual surveys were most successful at detecting American toads and gray treefrogs (Figure 6).
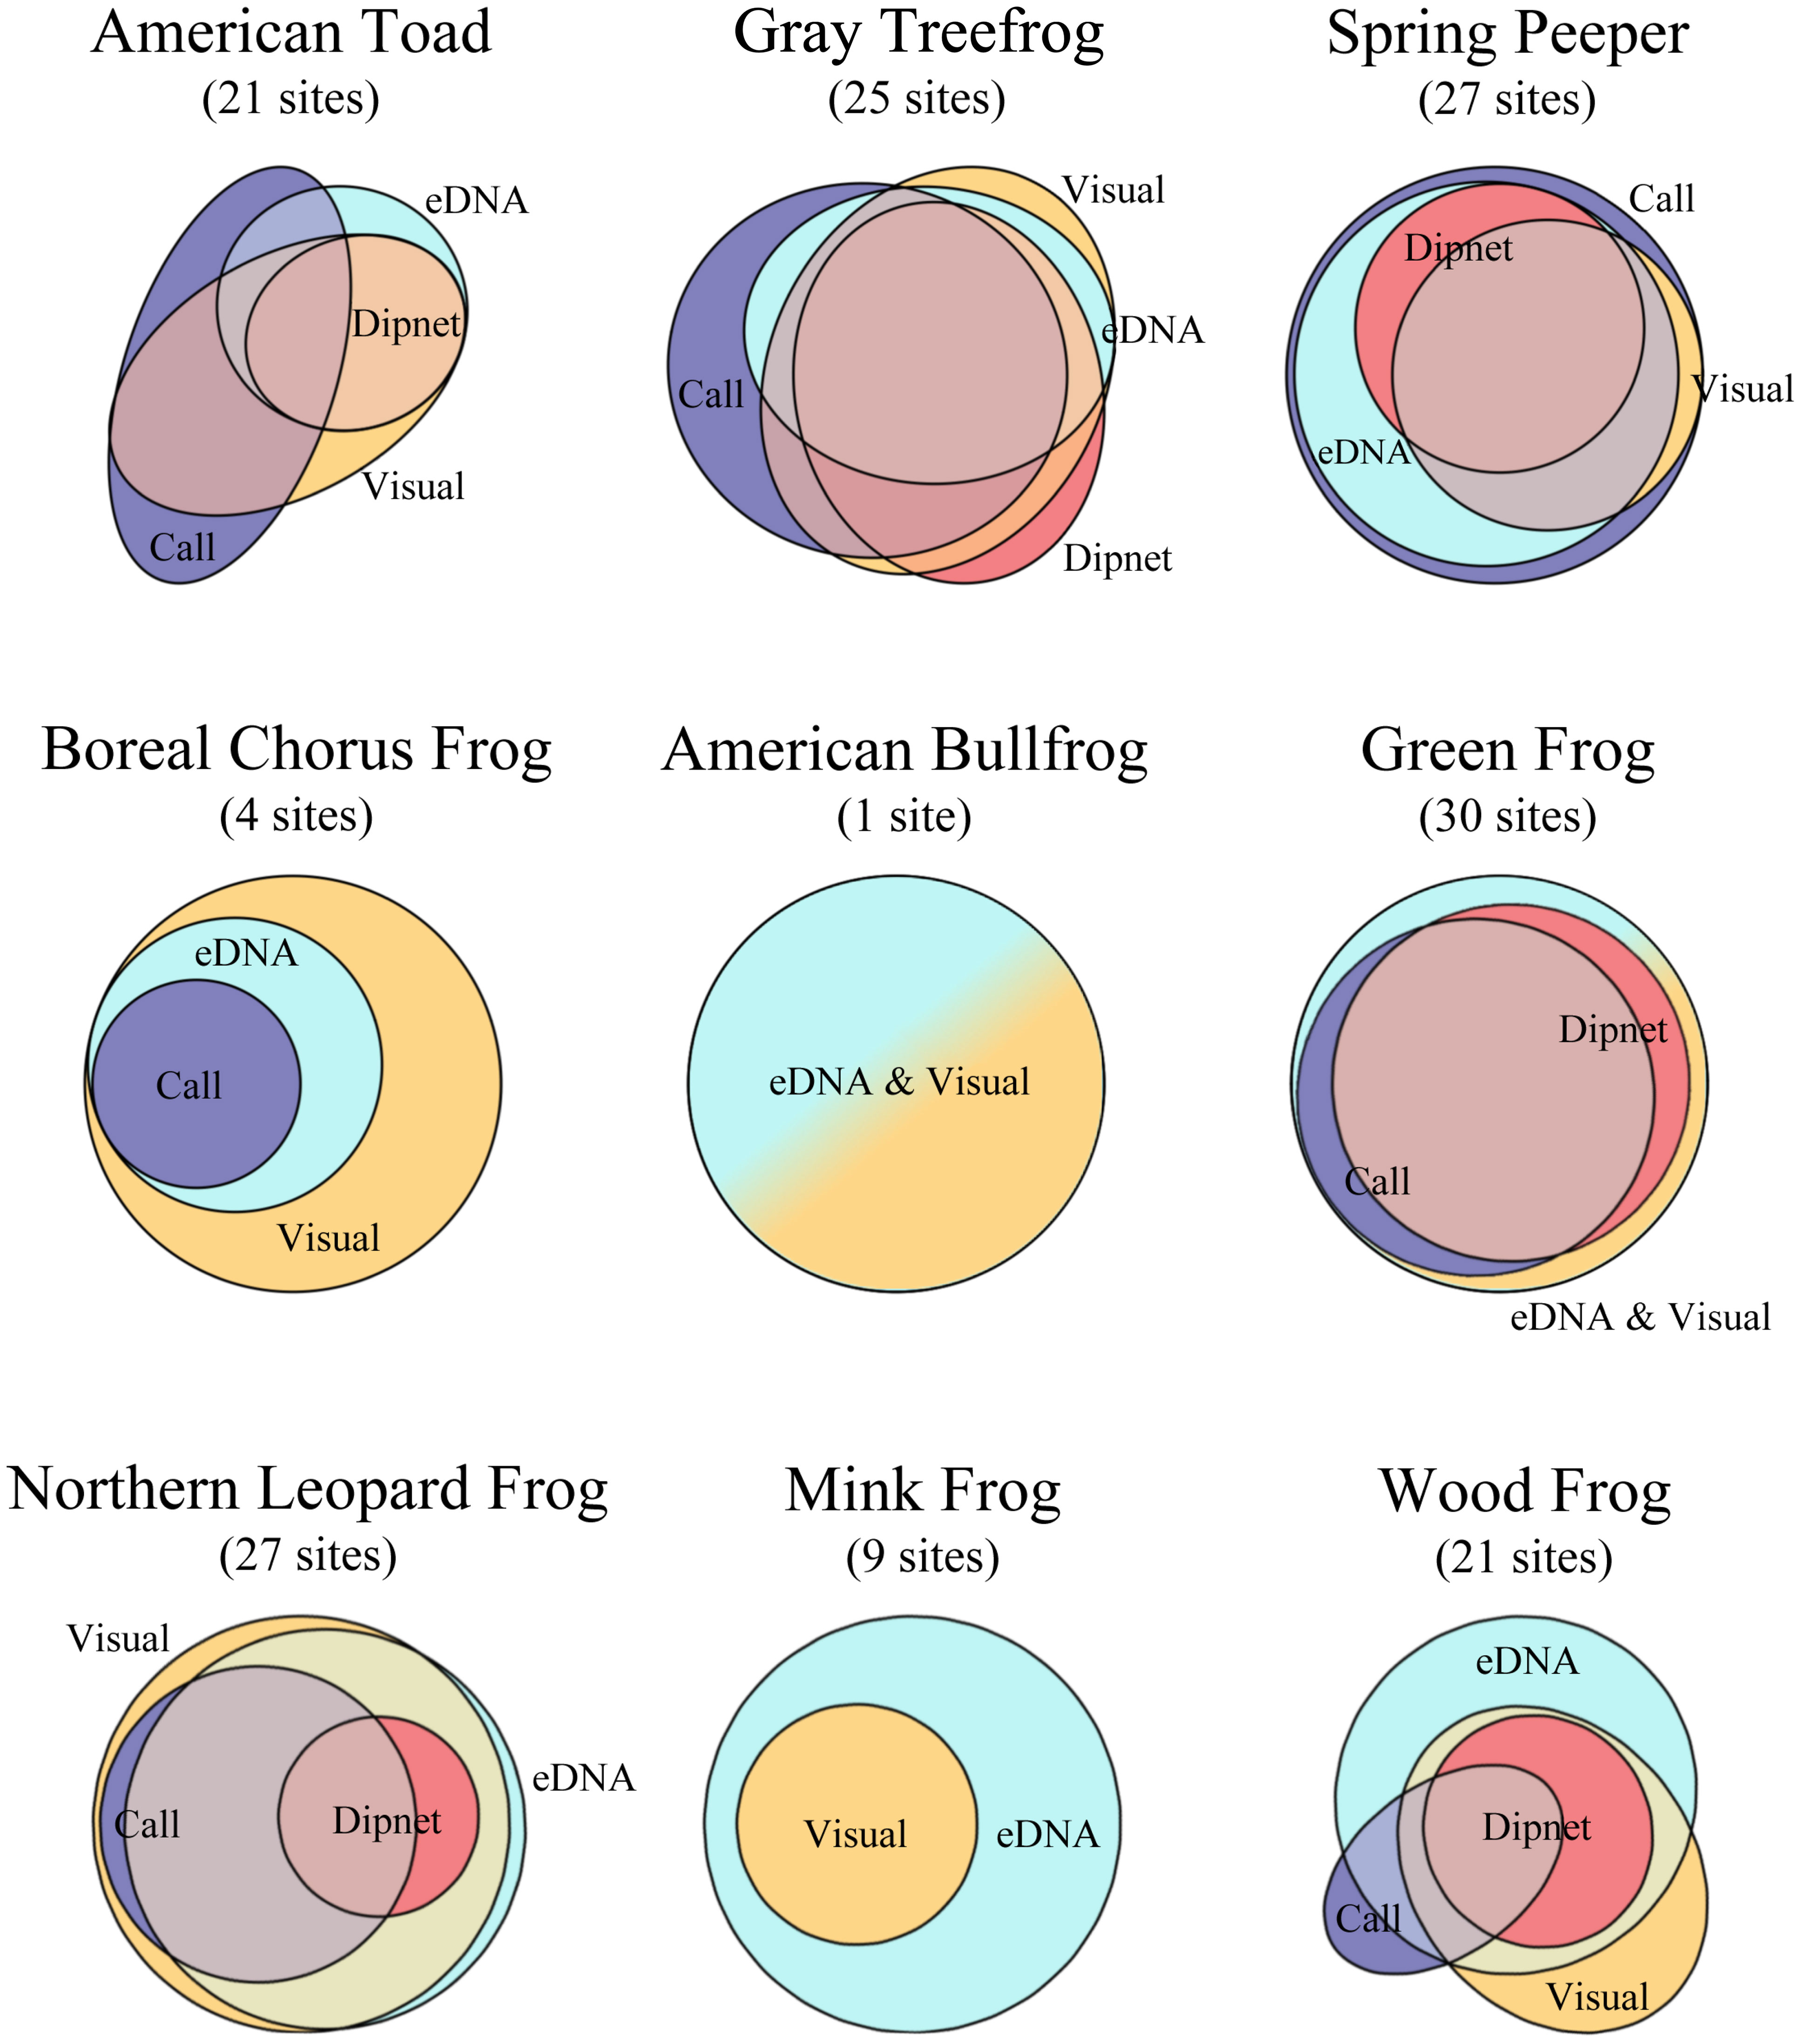
Figure 6 Proportion of positive sites as determined by eDNA and conventional amphibian monitoring surveys across 30 waterbodies in southern Ontario, Canada. eDNA survey detections are in light blue, visual encounter survey detections are in yellow, breeding call survey detections are in purple, and larval dipnet survey detections are in pink. Overlapping areas represent the proportion of detections made by multiple survey types, and areas that do not overlap represent unique detections. The total positive sites are in parentheses under species name.
Discussion
We found that the four amphibian survey methods differed in their ability to detect the presence of nine anuran species in southern Ontario, Canada. In general, eDNA and visual surveys performed comparably, with both detecting a greater species richness than call or dipnet surveys. Notably, eDNA methods were more efficient than visual surveys, detecting most species after fewer sampling events. Species detections via all methods varied through time, and each method produced false-negative detections that reflected survey limitations, timing of field sampling, or variation in species life history. These findings suggest that eDNA-based methods can serve as a valuable complement to conventional methods, improving the success and efficacy of amphibian monitoring programs (see Lacoursière-Roussel et al., 2016; Moss et al., 2022). However, we emphasize that eDNA-based methods require species- and system-specific testing and refinement before they can be fully integrated into amphibian monitoring programs.
Our finding that eDNA-based surveys detected more anuran species compared to dipnet and call surveys is consistent with previous research (see Smart et al., 2015; Lacoursière-Roussel et al., 2016; Valentini et al., 2016). For example, Moss et al. (2022) found that eDNA-based methods were generally comparable or superior to conventional approaches when surveying amphibian presence-absence. We attribute the comparable species richness results of our eDNA and visual survey methods largely to the rigor and intensity of conventional surveys that we performed (including repeated sampling, and per site average cumulative survey durations of 4.26 h for visual surveys, 4.48 h for dipnet surveys, and 0.15 h for call surveys). Our finding that eDNA methods detected relatively high species richness with minimal field investment (two survey events) emphasizes that eDNA methods may be more effective than conventional survey methods particularly when time and personnel are limited. However, robust amphibian community monitoring may require application of multiple monitoring methods.
Conventional amphibian survey methods are broadly understood to have limitations, as they can underestimate population abundance due to false-negative detections and generally contribute bias and imprecision to species monitoring (Tanadini and Schmidt, 2011). Common sources of false-negative error from conventional surveys include low population densities, variability in environmental and habitat conditions, species-specific behavioral traits, and observer error due to lack of experience or training (see Lotz and Allen, 2007; Tanadini and Schmidt, 2011; Asad et al., 2020; Hammond et al., 2021). In contrast, eDNA-based sampling is known to detect amphibians at low densities (Pilliod et al., 2013; Sepulveda et al., 2019), is less biased by cryptic and elusive behavior (see Kaganer et al., 2022), and can be performed with minimal expertise or training (e.g., Biggs et al., 2015). However, eDNA’s unique utility necessitates novel considerations. Despite relatively high species richness results, our eDNA detections were highly variable among the four water samples collected per sampling event. This finding underscores eDNA’s sensitivity to complex natural processes and environmental factors (see Strickler et al., 2015; Harrison et al., 2019). Specifically, sampling heterogeneity is influenced by factors affecting eDNA dispersion, including wetland size, amphibian population and distribution, and water flow conditions (Strickler et al., 2015; Goldberg et al., 2018; Wood et al., 2021). High environmental variation is known to exist within localized amphibian breeding sites (Beentjes et al., 2019; Congram et al., 2022), necessitating thorough consideration of eDNA sampling heterogeneity during study design.
In addition, natural environments contain inhibitors (tannins, proteins, humic compounds, etc.) that can further confound eDNA survey results by reducing the efficacy of qPCR assays (Lance and Guan, 2020; Sidstedt et al., 2020). Constraints related to inhibition are common to eDNA studies (e.g., Sigsgaard et al., 2015; Adams et al., 2019), and we urge consideration of inhibition-reducing techniques during eDNA procedural optimization and validation. We used preliminary IPCs, an inhibitor removal kit (Williams et al., 2017), a qPCR master mix with low sensitivity to PCR inhibitors (Jane et al., 2015), and a pre-established/optimized extraction procedure (Goldberg et al., 2011) to minimize inhibition in our samples. Despite this concerted effort, our species detections via eDNA methods were still imperfect (see Supplementary Table 1). Our finding that all monitoring methods produced false-negative detections reflects the natural limitations of each method. It follows that a robust approach to monitoring amphibian communities should limit false negatives by using multiple survey methods, inclusive of eDNA and conventional surveys when time and personnel are available.
We found prominent temporal variation in our eDNA survey results, which likely reflects the substantive ecological differences across the anuran community that we targeted (see also Takahara et al., 2020). Seasonal changes in species life history, including variation in breeding, habitat use, and larval characteristics, are known to affect eDNA detection (Goldberg et al., 2011; Takahara et al., 2020). Furthermore, movement and behavior are known to be variable even within species, resulting in different breeding onsets and larval period durations among even neighboring wetlands (Benard and Greenwald, 2023). We attempted to target as many species as possible by incorporating two temporally distinct sampling periods into our study design. Much like previous studies of temporal eDNA replication (see Beentjes et al., 2019; Troth et al., 2021), we found that the addition of a second sampling period improved detection outcomes for most species and increased species richness results by an average of approximately one species per site. Our findings highlight that amphibian eDNA monitoring programs, especially at the community level, will benefit from repeated sampling events.
In addition, species-specific differences in physiology and behavior can lead to variable eDNA detections even among closely related species; Breton et al. (2022) found that wood frog (L. sylvatica) and northern leopard frog (L. pipiens) tadpoles produced detectable DNA at different rates under identical controlled conditions. While the biological processes behind this finding are lesser known, Breton et al. (2022) suggest the potential for a physiological origin. Building on this work, we found that temporal variation in eDNA detections in situ largely reflected species-specific seasonal activity patterns. In particular, eDNA surveys detected mid-season breeders (American toad and gray treefrog) less often in spring than in early summer (near their peak larval period), with eDNA surveys failing to outperform conventional methods for these species. In contrast, eDNA detection rates were consistent across time for early breeders, as well as late breeders with overwintering tadpoles; this is likely explained by their larval periods encompassing both of our eDNA survey periods. Finally, eDNA surveys also detected wood frogs (explosive breeders that can be challenging to monitor via conventional methods; De Solla et al., 2006) outside of their restrictive breeding window, as tadpole genetic material could be captured long after the adults had resumed their terrestrial lifestyle. While eDNA sampling has been shown to detect amphibians outside of active breeding and circadian periods (Rees et al., 2014; Eiler et al., 2018), a rapid loss of detectable eDNA has also been observed after tadpoles have been removed from a system (Breton et al., 2022). Therefore, our results suggest that ideal eDNA sampling windows for semi-terrestrial species are still restrictive, and survey optimization should involve identifying sampling periods that coincide with peak larval periods.
Finally, we recommend some additional methodological considerations that will improve the reliability and broaden the utility of eDNA monitoring. Many eDNA protocols now verify positive samples with low repeatability via reamplification (e.g., Goldberg et al., 2018; Kaganer et al., 2022); such efforts to improve reliability can be bolstered by additional means including our use of species-specific LODs (Hunter et al., 2017), synthetic oligonucleotides to eliminate contamination from qPCR controls (Wilson et al., 2016), and monitoring for contamination. In addition, recent advancements such as high-volume water sampling (Schabacker et al., 2020) and eDNA metabarcoding (e.g., Sasso et al., 2017; Taberlet et al., 2018) can greatly enhance the efficacy of comprehensive community surveys. Although eDNA metabarcoding is sensitive and particularly efficient for monitoring numerous and diverse targets (Deiner et al., 2017), targeted single-species qPCR testing can be more sensitive for detecting rare amphibians (Moss et al., 2022). While their utilities differ, both eDNA-based methods provide valuable ecological information. In particular, the suitability of eDNA-based presence–absence data in occupancy modeling (e.g., Smith and Goldberg, 2022) offers a useful tool for managers when developing conservation strategies.
To conclude, we highlight that best success in amphibian community monitoring can be achieved by adopting multiple survey techniques, including both conventional and eDNA-based methods. Similarly to other studies (Takahara et al., 2020; Svenningsen et al., 2022), we have shown that no single survey method reliably detected all amphibian species under a wide range of sampling conditions. Before eDNA-based methods can reliably replace conventional survey methods in amphibian monitoring programs, additional research into the sources of variation in species detectability and optimization of survey protocols must be a priority. Field and laboratory protocols should be optimized at the scale of individual studies or systems to account for species-specific, site-specific, and lab-specific sources of detection error. Adoption of these recommendations will help ensure that amphibian monitoring programs are supported by the best-available survey methods and thereby improve our ability to reliably assess changes in the prevalence and distribution of this imperilled group of organisms.
Data availability statement
The datasets presented in this study can be found in online repositories. The names of the repository/repositories and accession number(s) can be found below: Borealis, https://doi.org/10.5683/SP3/DCUGTW.
Ethics statement
The animal study was reviewed and approved by Trent University’s Animal Care Committee.
Author contributions
All authors: conception and design. MW, BB, and AB: field data collection. MW, BB, and STV: laboratory analyses. MW: statistical analyses. MW, CW, and DM: drafted the manuscript. All authors: manuscript revision. All authors contributed to the article and approved the submitted version.
Funding
This project was supported by a Natural Sciences and Engineering Research Council of Canada (NSERC) Strategic Grant (463602-14) and Canada Research Chairs funding.
Acknowledgments
We thank M. Boudreau, A. Eads, T. Hossie, C. Smith, K. Wozney, C. Wikston, M. Congram, L. Bazley, P. Heney, L. Smith, and T. Ward for assistance in the field, in the laboratory, and with the analyses. We also thank those who volunteered their private property for this study.
Conflict of interest
The authors declare that the research was conducted in the absence of any commercial or financial relationships that could be construed as a potential conflict of interest.
Publisher’s note
All claims expressed in this article are solely those of the authors and do not necessarily represent those of their affiliated organizations, or those of the publisher, the editors and the reviewers. Any product that may be evaluated in this article, or claim that may be made by its manufacturer, is not guaranteed or endorsed by the publisher.
Supplementary material
The Supplementary Material for this article can be found online at: https://www.frontiersin.org/articles/10.3389/fevo.2023.1179158/full#supplementary-material
References
Adams C. I. M., Hoekstra L. A., Muell M. R., Janzen F. J. (2019). A brief review of non-avian reptile environmental DNA (eDNA), with a case study of painted turtle (Chrysemys picta) eDNA under field conditions. Diversity 11, 50. doi: 10.3390/d11040050
Asad S., Abrams J. F., Guharajan R., Sikui J., Wilting A., Rodel M.-O. (2020). Stream amphibian detectability and habitat associations in a reduced impact logging concession in Malaysian Borneo. J. Herpetol. 54, 385–392. doi: 10.1670/19-136
Badzinski D. S., Archer R. W., Timmermans S. T. A., Harrison K. E., Jones K. E., Doyle M. (2008). Assessment of trends in frog and toad populations in Ontario using citizen science monitoring data (Canada: The Ecological Monitoring and Assessment Network Coordinating Office, Environment).
Bailey L. L., Simons T. R., Pollock K. H. (2004). Spatial and temporal variation in detection probability of Plethodon salamanders using the robust capture–recapture design. J. Wildl. Manage. 68, 14–24. doi: 10.2193/0022-541X(2004)068[0014:SATVID]2.0.CO;2
Barata I. M., Griffiths R. A., Ridout M. S. (2017). The power of monitoring: optimizing survey designs to detect occupancy changes in a rare amphibian population. Sci. Rep. 7, 16491. doi: 10.1038/s41598-017-16534-8
Bates D., Maechler M., Bolker B., Walker S., Christensen R. H. B., Singmann H., et al. (2019) Linear mixed-effects models using “Eigen” and S4. r package version 1.1-21. Available at: https://CRAN.R-project.org/package=lme4.
Beauclerc K., Wozney K., Smith C., Wilson C. (2019). Development of quantitative PCR primers and probes for environmental DNA detection of amphibians in Ontario. Conserv. Genet. Resour. 11, 43–46. doi: 10.1007/s12686-017-0962-3
Beentjes K. K., Speksnijder A. G. C. L., Schilthuizen M., Hoogeveen M., van der Hoorn B. B. (2019). The effects of spatial and temporal replicate sampling on eDNA metabarcoding. PeerJ 7, e7335. doi: 10.7717/peerj.7335
Benard M. F., Greenwald K. R. (2023). Environmental drivers of amphibian breeding phenology across multiple sites. Diversity 15, 253. doi: 10.3390/d15020253
Biggs J., Ewald N., Valentini A., Gaboriaud C., Dejean T., Griffiths R. A., et al. (2015). Using eDNA to develop a national citizen science-based monitoring programme for the great crested next (Triturus cristatus). Biol. Conserv. 183, 19–28. doi: 10.1016/j.biocon.2014.11.029
Bird Studies Canada (2009). Marsh monitoring program participant’s handbook for surveying amphibians (Port Rowan, Ontario: Bird Studies Canada in cooperation with Environment Canada and the U.S. Environmental Protection Agency). Available: https://www.naturecounts.ca.
Bishop C. A., Pettit K. E., Gartshore M. J., MacLeod D. A. (1997). “Extensive monitoring in anuran populations using call counts and road transects in ontario, (1992 to 1993),” in Amphibians in decline: Canadian studies of a global problem, herpetological conservation, vol. 1 . Ed. Green D. M. (St. Louis, MO: Society for the Study of Amphibians and Reptiles), 149–160.
Breton B.-A., Beaty L., Bennett A. M., Kyle C. J., Lesbarrères D., Vilaça S. T., et al. (2022). Testing the effectiveness of environmental DNA (eDNA) to quantify larval amphibian abundance. Environ. DNA. 00, 1–12. doi: 10.1002/edn3.332
Bridges A. S., Dorcas M. E. (2000). Temporal variation in anuran calling behavior: implications for surveys and monitoring programs. Copeia 2000, 587–592. doi: 10.1643/0045-8511(2000)000[0587:TVIACB]2.0.CO;2
Congram M., Vilaça S. T., Wilson C. C., Kyle C. J., Lesbarrères D., Wikston M. J. H., et al. (2022). Tracking the prevalence of a fungal pathogen, Batrachochytrium dendrobatidis (chytrid fungus), using environmental DNA. Environ. DNA 4, 687–699. doi: 10.1002/edn3.283
Crisafulli C. M. (1997). “A habitat-based method for monitoring pond-breeding amphibians,” in Sampling amphibians in lentic habitats: methods and approaches for the pacific Northwest (Northwest fauna, no. 4). Eds. Olson D. H., Leonard W. P., Bury R. B. (Olympia, WA: Society for Northwestern Vertebrate Biology).
Crump M. L., Scott N. J. Jr. (1994). “Visual encounter surveys,” in Measuring and monitoring biological diversity: standard methods for amphibians. Eds. Heyer W. R., Donnelly M. A., McDiarmid R. W., Hayek L. C., Foster M. S. (Washington, DC: Smithsonian Institution Press), 84–92.
Deiner K., Bik H. M., Mächler E., Seymour M., Lacoursière-Roussel A., Altermatt F., et al. (2017). Environmental DNA metabarcoding: transforming how we survey animal and plant communities. Mol. Ecol. 26, 5872–5895. doi: 10.1111/mec.14350
Dejean T., Valentini A., Miquel C., Taberlet P., Bellemain E., Miaud C. (2012). Improved detection of an alien invasive species through environmental DNA barcoding: the example of the American bullfrog Lithobates catesbeianus. J. Appl. Ecol. 49, 953–959. doi: 10.1111/j.1365-2664.2012.02171.x
De Solla S. R., Fernie K. J., Barrett G. C., Bishop C. A. (2006). Population trends and calling phenology of anuran populations surveyed in Ontario estimated using acoustic surveys. Biodivers. Conserv. 15, 3481–3497. doi: 10.1007/s10531-004-6905-9
De Solla S. R., Shirose L. J., Fernie K. J., Barrett G. C., Brousseau C. S., Bishop C. A. (2005). Effect of sampling effort and species detectability on volunteer based anuran monitoring programs. Biol. Conserv. 121, 585–594. doi: 10.1016/j.biocon.2004.06.018
Eiler A., Löfgren A., Hjerne O., Nordén S., Saetre P. (2018). Environmental DNA (eDNA) detects the pool frog (Pelophylax lessonae) at times when traditional monitoring methods are insensitive. Sci. Rep. 8, 5452. doi: 10.1038/s41598-018-23740-5
Fox J., Weisberg S. (2019). An {R} companion to applied regression. 3rd ed. (Thousand Oaks CA: Sage). Available at: https://socialsciences.mcmaster.ca/jfox/Books/Companion/.
Gibbons J. D., Pratt J. W. (1975). P-values: interpretation and methodology. Am. Stat. 29, 20–25. doi: 10.1080/00031305.1975.10479106
Goldberg C. S., Pilliod D. S., Arkle R. S., Waits L. P. (2011). Molecular detection of vertebrates in stream water: a demonstration using rocky mountain tailed frogs and Idaho giant salamanders. PloS One 6, e22746. doi: 10.1371/journal.pone.0022746
Goldberg C. S., Strickler K. M., Fremier A. K. (2018). Degradation and dispersion limit environmental DNA detection of rare amphibians in wetlands: increasing efficacy of sampling designs. Sci. Total Environ. 633, 695–703. doi: 10.1016/j.scitotenv.2018.02.295
Gu W., Swihart R. K. (2004). Absent or undetected? effects of non-detection of species occurrence on wildlife-habitat models. Biol. Conserv. 116, 195–203. doi: 10.1016/S0006-3207(03)00190-3
Hammond T. T., Curtis M. J., Jacobs L. E., Tobler M. W., Swaisgood R. R., Shier D. M. (2021). Behavior and detection method influence detection probability of a translocated, endangered amphibian. Anim. Conserv. 24, 401–411. doi: 10.1111/acv.12645
Harrison J. B., Sunday J. M., Rodgers S. M. (2019). Predicting the fate of eDNA in the environment and implications for studying biodiversity. Proc. R. Soc B. 286, 20191409. doi: 10.1098/rspb.2019.1409
Hinlo R., Gleeson D., Lintermans M., Furlan E. (2017). Methods to maximise recovery of environmental DNA from water samples. PloS One 12, e0179251. doi: 10.1371/journal.pone.0179251
Hunter M. E., Dorazio R. M., Butterfield J. S. S., Meigs-Friend G., Nico L. G., Ferrante J. A. (2017). Detection limits of quantitative and digital PCR assays and their influence in presence–absence surveys of environmental DNA. Mol. Ecol. Resour. 17, 221–229. doi: 10.1111/1755-0998.12619
Jaccard P. (1908). Nouvelles recherches sur la distribution florale. Bull. la Soc Vaud. Des. Sci. Nat. 44, 223–270. doi: 10.5169/seals-268384
Jane S. F., Wilcox T. M., Mckelvey K. S., Young M. K., Schwartz M. K., Lowe W. H., et al. (2015). Distance, flow and PCR inhibition: eDNA dynamics in two headwater streams. Mol. Ecol. Resour. 15, 216–227. doi: 10.1111/1755-0998.12285
Johnson C. N., Balmford A., Brook B. W., Buettel J. C., Galetti M., Guangchun L., et al. (2017). Biodiversity losses and conservation responses in the anthropocene. Science 356, 270–275. doi: 10.1126/science.aam9317
Kaganer A. W., Stapleton G. S., Bunting E. M., Hare M. P. (2022). Aquatic eDNA can advance monitoring of a small-bodied terrestrial salamander and amphibian pathogen. Environ. DNA 00, 1–12. doi: 10.1002/edn3.316
Lacoursière-Roussel A., Dubois Y., Normandeau E., Bernatchez L. (2016). Improving herpetological surveys in eastern north America using the environmental DNA method. Genome 59, 991–1007. doi: 10.1139/gen-2015-0218
Lance R. F., Guan X. (2020). Variation in inhibitor effects on qPCR assays and implications for eDNA surveys. Can. J. Fish. Aquat. 77, 23–33. doi: 10.1139/cjfas-2018-0263
Lenth R. (2019) Emmeans: estimated marginal means, aka least-squares means. r package version 1.4.3. Available at: https://CRAN.R-project.org/package=emmeans.
Leung B., Greenberg D. A., Green D. M. (2017). Trends in mean growth and stability in temperate vertebrate populations. Divers. Distrib. 23, 1371–1380. doi: 10.1111/ddi.12636
Lotz A., Allen C. R. (2007). Observer bias in anuran call surveys. J. Wildl. Manage. 71, 675–679. doi: 10.2193/2005-759
Malekian M., Sadeghi P., Goudarzi F. (2018). Assessment of environmental DNA for detection of an imperiled amphibian, the luristan newt (Neurergus kaiseri, Schmidt 1952). Herpetol. Conserv. Biol. 13, 175–182.
Mattfeldt S. D., Bailey L. L., Campbell Grant E. H. (2009). Monitoring multiple species: estimating state variables and exploring the efficacy of a monitoring program. Biol. Conserv. 142, 720–737. doi: 10.1016/j.biocon.2008.12.002
Mazerolle M. J., Bailey L. L., Kendall W. L., Royle J. A., Converse S. J., Nichols J. D. (2007). Making great leaps forward: accounting for detectability in herpetological field studies. J. Herpetol. 41, 672–689. doi: 10.1670/07-061.1
Mazerolle M. J., Desrochers A., Rochefort L. (2005). Landscape characteristics influence pond occupancy by frogs after accounting for detectability. Ecol. Appl. 15, 824–834. doi: 10.1890/04-0502
McClintock B. T., Bailey L. L., Pollock K. H., Simons T. R. (2010). Unmodeled observation error induces bias when inferring patterns and dynamics of species occurrence via aural detections. Ecology 91, 2446–2454. doi: 10.1890/09-1287.1
Mills P. B. (2016). Metamorphosis – Ontario’s amphibians at all stages of development (Canada: Peter B. Mills).
Moss W. E., Harper L. R., Davis M. A., Goldberg C. S., Smith M. M., Johnson P. T. (2022). Navigating the trade-offs between environmental DNA and conventional field surveys for improved amphibian monitoring. Ecosphere 13, e3941. doi: 10.1002/ecs2.3941
Muths E., Jung R. E., Bailey L. L., Adams M. J., Corn P. S., Dodd C. K. Jr., et al. (2005). Amphibian research and monitoring initiative (ARMI): a successful start to a national program in the united states. Appl. Herpetology 2, 355–371. doi: 10.1163/157075405774483139
Pavić D., Grbin D., Hudina S., Prosenc Zmrzljak U., Miljanović A., Košir R., et al. (2022). Tracing the oomycete pathogen Saprolegnia parasitica in aquaculture and the environment. Sci. Rep. 12, 16646. doi: 10.1038/s41598-022-16553-0
Pawlowski J., Apothéloz-Perret-Gentil L., Altermatt F. (2020). Environmental DNA: what’s behind the term? clarifying the terminology and recommendations for its future use in biomonitoring. Mol. Ecol. 29, 4258–4264. doi: 10.1111/mec.15643
Petitot M., Manceau N., Geniez P., Besnard A. (2014). Optimizing occupancy surveys by maximizing detection probability: application to amphibian monitoring in the Mediterranean region. Ecol. Evol. 4, 3538–3549. doi: 10.1002/ece3.1207
Pierce B. A., Gutzwiller K. J. (2007). Interobserver variation in frog call surveys. J. Herpetol. 41, 424–429. doi: 10.1670/0022-1511(2007)41[424:IVIFCS]2.0.CO;2
Pilliod D. S., Goldberg C. S., Arkle R. S., Waits L. P. (2013). Estimating occupancy and abundance of stream amphibians using environmental DNA from filtered water samples. Can. J. Fish. Aquat. 70, 1123–1130. doi: 10.1139/cjfas-2013-0047
Raymaekers M., Smets R., Maes B., Cartuyvels R. (2009). Checklist for optimization and validation of real-time PCR assays. J. Clin. Lab. Anal. 23, 145–151. doi: 10.1002/jcla.20307
R Core Team (2019). R: a language and environment for statistical computing (Vienna, Austria: R Foundation for Statistical Computing). Available at: https://www.R-project.org/.
Real R., Vargas J. M. (1996). The probabilistic basis of Jaccard’s index of similarity. Syst. Biol. 45, 380–385. doi: 10.1093/sysbio/45.3.380
Rees H. C., Bishop K., Middleditch D. J., Patmore J. R. M., Maddison B. C., Gough K. C. (2014). The application of eDNA for monitoring of the great crested newt in the UK. Ecol Evol. 4, 4023–4032. doi: 10.1002/ece3.1272
Rogers-Broadway K.-R., Karteris E. (2015). Amplification efficiency and thermal stability of qPCR instrumentation: current landscape and future perspectives. Exp. Ther. Med. 10, 1261–1264. doi: 10.3892/etm.2015.2712
Ryan T. J., Philippi T., Leiden Y. A., Dorcas M. E., Wigley T. B., Gibbons J. W. (2002). Monitoring herpetofauna in a managed forest landscape: effects of habitat types and census techniques. For. Ecol. Manage. 167, 83–90. doi: 10.1016/S0378-1127(01)00692-2
Sasso T., Lopes C. M., Valentini A., Dejean T., Zamudio K. R., Haddad C. F. B., et al. (2017). Environmental DNA characterization of amphibian communities in the Brazilian Atlantic forest: potential application for conservation of a rich and threatened fauna. Biol. Conserv. 215, 225–232. doi: 10.1016/j.biocon.2017.09.015
Schabacker J. C., Amish S. J., Ellis B. K., Gardner B., Miller D. L., Rutledge E. A., et al. (2020). Increased eDNA detection sensitivity using a novel high-volume water sampling method. Environ. DNA 2, 244–251. doi: 10.1002/edn3.63
Schmidt B. R. (2005). Monitoring the distribution of pond-breeding amphibians when species are detected imperfectly. Aquat. Conserv.: Mar. Freshw. Ecosyst. 15, 681–692. doi: 10.1002/aqc.740
Sepulveda A. J., Schabacker J., Smith S., Al-Chokhachy R., Luikart G., Amish S. J. (2019). Improved detection of rare, endangered and invasive trout in using a new large-volume sampling method for eDNA capture. Environ. DNA 1, 227–237. doi: 10.1002/edn3.23
Serrao N. R., Reid S. M., Wilson C. C. (2018). Establishing detection thresholds for environmental DNA using receiver operator characteristic (ROC) curves. Conserv. Genet. Resour. 10, 555–562. doi: 10.1007/s12686-017-0817-y
Shaffer H. B., Alford R. A., Woodward B. D., Richards S. J., Altig R. G., Gascon C. (1994). “Quantitative sampling of amphibian larvae,” in Measuring and monitoring biological diversity: standard methods for amphibians. Eds. Heyer W. R., Donnelly M. A., McDiarmid R. W., Hayek L. C., Foster M. S. (Washington, DC: Smithsonian Institution Press), 130–141.
Shirose L. J., Bishop C. A., Green D. M., MacDonald C. J., Brooks R. J., Helferty N. J. (1997). Validation tests of an amphibian call count survey technique in Ontario, Canada. Herpetologica 53, 312–320.
Sidstedt M., Rådström P., Hedman J. (2020). PCR inhibition in qPCR, dPCR and MPS–mechanisms and solutions. Anal. Bioanal. Chem. 412, 2009–2023. doi: 10.1007/s00216-020-02490-2
Sigsgaard E. E., Carl H., Møller P. R., Thomsen P. F. (2015). Monitoring the near-extinct European weather loach in Denmark based on environmental DNA from water samples. Biol. Conserv. 183, 46–52. doi: 10.1016/j.biocon.2014.11.023
Smart A. S., Tingley R., Weeks A. R., Van Rooyen A. R., McCarthy M. A. (2015). Environmental DNA sampling is more sensitive than a traditional survey technique for detecting an aquatic invader. Ecol. Appl. 25, 1944–1952. doi: 10.1890/14-1751.1
Smith M. M., Goldberg C. S. (2022). Facilitative interaction promotes occupancy of a desert amphibian across a climate gradient. Oecologia 198, 815–823. doi: 10.1007/s00442-022-05127-6
Spear S. F., Groves J. D., Williams L. A., Waits L. P. (2015). Using environmental DNA methods to improve detectability in a hellbender (Cryptobranchus alleganiensis) monitoring program. Biol. Conserv. 183, 38–45. doi: 10.1016/j.biocon.2014.11.016
Strickler K. M., Fremier A. K., Goldberg C. S. (2015). Quantifying effects of UV-b, temperature, and pH on eDNA degradation in aquatic microcosms. Biol. Conserv. 183, 85–92. doi: 10.1016/j.biocon.2014.11.038
Stuart S. N., Chanson J. S., Cox N. A., Young B. E., Rodrigues A. S. L., Fischman D. L., et al. (2004). Status and trends of amphibian declines and extinctions worldwide. Science 306, 1783–1786. doi: 10.1126/science.1103538
Svenningsen A. K. N., Pertoldi C., Bruhn D. (2022). eDNA metabarcoding benchmarked towards conventional survey methods in amphibian monitoring. Animals 12, 763. doi: 10.3390/ani12060763
Taberlet P., Bonin A., Zinger L., Coissac E. (2018). Environmental DNA for biodiversity research and monitoring (New York: Oxford University Press).
Takahara T., Iwai N., Yasumiba K., Igawa T. (2020). Comparison of the detection of 3 endangered frog species by eDNA and acoustic surveys across 3 seasons. Freshw. Sci. 39, 18–27. doi: 10.1086/707365
Tanadini L. G., Schmidt B. R. (2011). Population size influences amphibian detection probability: implications for biodiversity monitoring programs. PloS One 6, e28244. doi: 10.1371/journal.pone.0028244
Tattersall G. J., Ultsch G. R. (2008). Physiological ecology of aquatic overwintering ranid frogs. Biol. Rev. 83, 119–140. doi: 10.1111/j.1469-185X.2008.00035.x
Troth C. R., Sweet M. J., Nightingale J., Burian A. (2021). Seasonality, DNA degradation and spatial heterogeneity as drivers of eDNA detection dynamics. Sci. Total Environ. 768, 144466. doi: 10.1016/j.scitotenv.2020.144466
Valentini A., Taberlet P., Miaud C., Civade R., Herder J., Thomsen P. F., et al. (2016). Next-generation monitoring of aquatic biodiversity using environmental DNA metabarcoding. Mol. Ecol. 25, 929–942. doi: 10.1111/mec.13428
Vilaça S. T., Grant S. A., Beaty L., Brunetti C. R., Congram M., Murray D. L., et al. (2020). Detection of spatiotemporal variation in ranavirus distribution using eDNA. Environ. DNA. 2, 210–220. doi: 10.1002/edn3.59
Wells K. D. (2007). The ecology and behaviour of amphibians (Chicago, IL, USA: Th University of Chicago Press), 1148.
Williams K. E., Huyvaert K. P., Piaggio A. J. (2017). Clearing muddied waters: capture of environmental DNA from turbid waters. PloS One 12, e0179282. doi: 10.1371/journal.pone.0179282
Wilson C. C., Bronnenhuber J., Boothroyd M., Smith C., Wozney K. (2014). Environmental DNA (eDNA) monitoring and surveillance: field and laboratory standard operating procedures. Peterborough, Ontario: Aquatic Research and Monitoring Section, Ontario Ministry of Natural Resources and Forestry 10.
Wilson C. C., Wozney K. M., Smith C. M. (2016). Recognizing false positives: synthetic oligonucleotide controls for environmental DNA surveillance. Methods Ecol. Evol. 7, 23–29. doi: 10.1111/2041-210X.12452
Wood Z. T., Lacoursière-Roussel A., LeBlanc F., Trudel M., Kinnison M. T., McBrine C. G., et al. (2021). Spatial heterogeneity of eDNA transport improves stream assessment of threatened salmon presence, abundance, and location. Front. Ecol. Evol. 9. doi: 10.3389/fevo.2021.650717
Xue X., Teare M. D., Holen I., Zhu Y. M., Woll P. J. (2009). Optimizing the yield and utility of circulating cell-free DNA from plasma and serum. Clin. Chim. Acta 404, 100–104. doi: 10.1016/j.cca.2009.02.018
Keywords: environmental DNA (eDNA), quantitative PCR (qPCR), environmental monitoring, species richness, community composition, amphibian communities
Citation: Wikston M, Breton B-AA, Vilaça ST, Bennett AM, Kyle CJ, Beresford DV, Lesbarrères D, Wilson CC, Green DM, Fortin M-J and Murray DL (2023) Comparative efficacy of eDNA and conventional methods for monitoring wetland anuran communities. Front. Ecol. Evol. 11:1179158. doi: 10.3389/fevo.2023.1179158
Received: 03 March 2023; Accepted: 02 June 2023;
Published: 03 July 2023.
Edited by:
Yixin Zhang, Soochow University, ChinaReviewed by:
Fraser John Combe, Ceva Animal Health, LLC, United StatesAndrea Galimberti, University of Milano – Bicocca, Italy
Copyright © 2023 Wikston, Breton, Vilaça, Bennett, Kyle, Beresford, Lesbarrères, Wilson, Green, Fortin and Murray. This is an open-access article distributed under the terms of the Creative Commons Attribution License (CC BY). The use, distribution or reproduction in other forums is permitted, provided the original author(s) and the copyright owner(s) are credited and that the original publication in this journal is cited, in accordance with accepted academic practice. No use, distribution or reproduction is permitted which does not comply with these terms.
*Correspondence: Madison Wikston, bWFkaXNvbndpa3N0b25AdHJlbnR1LmNh