 Zichen Wang1†
 Lu Zhang
 Peng Zhang
- 1State Key Laboratory of Biocontrol, School of Life Sciences, Sun Yat-Sen University, Guangzhou, China
- 2Southern Marine Science and Engineering Guangdong Laboratory (Zhuhai), Zhuhai, Guangdong, China
Environmental DNA (eDNA) metabarcoding is a powerful tool for monitoring biodiversity in natural ecosystems. The accuracy of eDNA metabarcoding relies heavily on the PCR primers that amplify target sequences. For vertebrates, most available primers are designed for particular groups. There have been inadequate attempts to design “universal” primers applicable to all vertebrates. Here, we developed three new universal primer sets (V12S-U, V16S-U, and VCOI-U) targeting mitochondrial 12S, 16S, and COI genes, respectively. They work for all vertebrate groups, with amplification length of 200-250 bp, facilitating the use of short-read sequencing platforms. We evaluated and compared the species detection ability of our primer sets and seven previously published ones through both in-silico PCR and experiment tests with mock DNA and zoo eDNA. The species detection success of the new primer sets is over 90%, showing better performance than previously published primer sets. We also tested our new primers with water eDNA samples of natural environments, and detected a total of 895 vertebrate OTUs (BLAST identity ≥ 0.95), comprising 182 species, 195 genera, and 94 families. Our results indicated that utilizing multiple markers can achieve better species detection than using only a single marker, which is especially important for monitoring large biological communities like vertebrates. The new primer sets enable researchers to detect the presence of species of different vertebrate groups in one eDNA metabarcoding survey, which simplifies the workflow and reduces the cost. It has the potential to serve as an alternative/complementary tool for future eDNA metabarcoding studies targeting vertebrates.
Introduction
In nearly a century, the loss of global biodiversity has exerted a considerable impact on the ecological environment (Pimm et al., 2014). According to the WWF data, the average abundance of the monitored populations of vertebrates, an important component of biodiversity, declined by 68% over the last 40 years (WWF, 2020). To slow or even stop this loss, more effective conservation and management measures are needed, which relies on the accurate and efficient investigation of the existing vertebrate diversity (Thomsen and Willerslev, 2015).
Monitoring the presence and diversity of vertebrate species using conventional survey methods such as trapping and observing are time-consuming, may cause harm to organism individuals or be strictly dependent on taxonomic expertise (Wheeler et al., 2004). Recent technological advances have provided an alternative approach for species detection, that is, environmental DNA (eDNA) metabarcoding, which detects the presence of species by analyzing the DNA from biological residues in environments (Taberlet et al., 2012a). This approach uses primers specified for a given taxonomic group to amplify target DNA fragments from eDNA samples, which is coupled with next-generation sequencing (NGS) to obtain sequences, then compares the sequences with the reference database (Epp et al., 2012; Port et al., 2016; Valentini et al., 2016). In theory, any species of the given taxonomic group can be detected without ‘a priori’ knowledge of the species likely to be present in the sampled ecosystem (Taberlet et al., 2012b; Bohmann et al., 2014). Compared to conventional survey methods, eDNA metabarcoding has the advantages of easier implementation (only environment samples are collected), being noninvasive (no organisms are caught, disturbed or killed during survey), and no need of taxonomic expertise (Darling and Mahon, 2011; Shaw et al., 2016; Deiner et al., 2017). Overall, eDNA metabarcoding is more cost-effective and has higher species detection sensitivity than traditional methods, thus shows great promise in biodiversity surveys.
The accuracy and efficacy of eDNA metabarcoding surveys rely heavily on the primers used for PCR amplification (Freeland, 2017; Alberdi et al., 2018). For eDNA metabarcoding surveys targeting vertebrates, vertebrate-specific PCR primers with good amplification specificity and sensitivity are crucial (Zhang et al., 2020). There are currently some good eDNA primers for specific vertebrate groups including amphibian (Evans et al., 2016), birds (Ushio et al., 2018), fishes (Miya et al., 2015), mammals (Ushio et al., 2017) and reptiles (West et al., 2023). In real-world applications, using universal primers that can be applied to the entire taxonomic span of vertebrates will be more convenient than using primers specific to different vertebrate groups (Saenz Agudelo et al., 2022). However, relatively few universal primers for vertebrates have been designed (Riaz et al., 2011; Valsecchi et al., 2020). Meanwhile, the sensitivity of available vertebrate-specific eDNA primers is not satisfactory. For example, Kelly et al. (2014) tested the sensitivity of the widely used 12SF1/R1 vertebrate-specific primer pair designed by Riaz et al. (2011) using an aquarium fish tank with known species, and detected only 7 species among the 12 vertebrate species in the tank. To ensure that investigators can gain a full picture of the vertebrate species diversity of the studied areas by conducting eDNA surveys, it is of value to develop new vertebrate-universal primer sets with high specificity and sensitivity.
Because vertebrates are a large group comprising of a number of species-rich lineages such as fishes, reptiles, and birds, among which the genetic divergence is great, developing universal eDNA primers for the entire vertebrates is not easy. Currently, even the most widely used primer set MiFish (Miya et al., 2015) that is designed on the 12S rRNA gene and works for fishes (much smaller than vertebrates) can achieve only about 90% detection success for fish species. Although it is almost impossible to design a universal primer set that is able to detect 100% of the vertebrate species in the environments, designing several primer sets that can detect 80% of the vertebrate species in the environment is plausible. If simultaneously using three universal primer sets (assuming each primer set amplifies a random subset of vertebrate species), the species detection success rate will theoretically increase to about 99%. In fact, a growing body of evidence has demonstrated that using multiple eDNA markers increases the probability of species detection (Shaw et al., 2016; Zhang et al., 2018; Morey et al., 2020). Therefore, designing universal primer sets on different mitochondrial genes and using them together (multilocus strategy) may be a good solution to applying eDNA metabarcoding to vertebrate diversity surveys.
In addition, because eDNAs degrade quickly under natural environmental conditions and long amplified fragments may increase the risk of amplification failure and false negative results (Dejean et al., 2011; Thomsen et al., 2012; Bylemans et al., 2018), the length of the amplified gene fragments from eDNA samples is normally short. Although short amplified fragments can ensure reliable amplification from eDNA samples, using one single short fragment may not be able to provide enough variation sites for accurate species identification among such a large taxonomic group as vertebrates (Freeland, 2017). Therefore, in order to accurately identify the vertebrate species in the environment, it is also highly necessary to simultaneously analyze several short metabarcoding gene fragments.
The overall goal of this study is to develop a set of novel vertebrate-universal primers containing multiple barcode loci, which can be used in eDNA metabarcoding studies on vertebrates to obtain more accurate and comprehensive vertebrate biodiversity data of the ecosystem. To achieve this goal, we aligned whole mitochondrial genome sequences of 792 representative species of different vertebrate families, including all major taxonomic units of Vertebrata, to locate more reliable primer design sites. The universal primers were designed on the mitochondrial 12S rRNA, 16S rRNA and COI genes, respectively, amplifying three short but hypervariable fragments of these genes (200-250 bp). This amplification length range is suitable for using short-read sequencing platforms such as Illumina HiSeq whose sequencing cost is much lower than that of the widely employed long-read MiSeq platform. We performed two evaluations to test the versatility of the newly designed primers: (i) in-silico PCR test of the primers with over 6000 vertebrate mitochondrial genome sequences, and (ii) in vitro PCR amplification using mock DNA and zoo eDNA with known species compositions. Finally, we examined the effectiveness of the new primers in real-case tests using water samples from different natural environments. We hope that the newly designed vertebrate-specific PCR primer set can serve as a helpful tool for future eDNA metabarcoding surveys of vertebrate biodiversity.
Materials and methods
Primer design
To select suitable mitochondrial DNA (mtDNA) regions for universal primer design, we downloaded 6567 complete mitochondrial genome sequences of vertebrates from NCBI as of 13 November 2020, each corresponding to one unique vertebrate species. These data belong to 792 different vertebrate families in total. We thus selected 792 vertebrate mitochondrial genome sequences from them to represent each of the families for sequence alignment. The 792 mtDNA sequences covered 154 orders and included 3 cyclostomes, 37 cartilaginous fishes, 347 ray-finned fishes, 4 lobe-finned fishes, 44 amphibians, 59 reptiles, 167 birds, and 131 mammals (Table S1).
We used ClustalW algorithm embedded in MegAlign (DNASTAR Inc.) to perform multiple sequence alignment. The alignment was manually inspected to search for appropriate DNA regions for vertebrate-universal primer design. To facilitate using short-read sequencing platforms such as Illumina HiSeq, we required that the target amplification region be less than 250 bp in most vertebrate species. Gene regions were considered suitable for primer design if they encompassed a short and highly variable fragment flanked by highly conserved primer sites of more than 16 bp. We paid special attention to selecting the 3’ end of the primers, avoiding sequences with low complexity and high-GC content to reduce non-specific amplification. The primers were initially designed by using degenerate bases whenever necessary to better match the whole vertebrate group. Finally, some degenerate bases were further optimized to decrease the overall degeneracy of the primers for better amplification efficiency.
Primer test with in-silico PCR
To test whether the newly designed PCR primers were universal for vertebrates, we performed an in-silico PCR test. The 6567 complete vertebrate mitochondrial genome sequences downloaded from NCBI were used as templates. Based on these 6567 sequences and their taxonomic information, a sequence database organized by taxonomic groups was constructed by using the OBICONVERT command in the OBITools software package (Boyer et al., 2016). Then, the amplification success rate of the primers in different vertebrate taxa was evaluated by using the in-silico PCR implemented in the ECOPCR software (Ficetola et al., 2010) with the following settings: (a) amplicon length in the range of 5-500 bp (excluding primers) and (b) a maximum of three mismatches between each primer and the target sequence and no mismatches in the last two nucleotides at the 3′ end of the primer (Epp et al., 2012). The taxonomic specificity of the primers was evaluated by the percentage of the amplified species against all species of a given taxon in the database. The taxonomic discrimination ability of each different primer set was assessed by using the “ecotaxspecificity” command in the OBITools software package. Two taxa (species or genus) are considered as distinguishable if they have at least 2 nucleotide differences.
In addition, we also investigated the amplification specificity and levels of interspecific variations of the three barcode fragments using the ‘PrimerTree’ package in R version 3.3.131 (Cannon et al., 2016). Briefly, PrimerTree performs the following analysis: (1) in-silico PCR against sequences in the NCBI database; (2) retrieval of DNA sequences predicted to be amplified; (3) taxonomic identification of these sequences; (4) multiple DNA sequence alignment; (5) reconstruction of a phylogenetic tree and (6) visualization of the tree with taxonomic annotation. Thus, by using the PrimerTree package, species whose sequences can be amplified, phylogenetic relationships among these amplified species, and interspecific variations in the amplified sequences can be rapidly visualized.
Primer test using both mock DNA and zoo eDNA with known species compositions
We also tested the newly designed PCR primers under two artificial conditions and compared them with previous published primers. (i) Mock DNA. We constructed two kinds of mock DNA mixtures using known input-DNA amounts of vertebrate species: “mock-even” and “mock-gradient” communities. We used 50 vertebrate species representing the seven major lineages of vertebrates (Chondrichthyes, Actinoptreygii, Dipnoi, Amphibia, Reptilla, Aves, and Mammalia) placed in 30 orders and 47 different families (Table S2). This taxonomic composition reflects most of the vertebrate groups. Mock-even DNA used 10 ng DNA per species, representing an ideal condition of even species density. Mock-gradient DNA was constructed with the first species represented by 1 ng of DNA, increasing geometrically by a factor of ~1.2 until the most abundant species at 1,034.8 ng, a 1000-fold range, which mimics the common situation where a sample contains both abundant and rare species. (ii) Water eDNA of zoo with known species compositions. We sampled one liter of water from three exhibition areas in the Guangzhou Zoo (Guangzhou, China) using disposable plastic bottles, respectively, and combined them into a 3-liter water sample. The three exhibition areas harbor a total of 34 vertebrate species (23 fishes, 2 frogs, 8 turtles and 1 mammal). The eDNA extraction followed the same protocol described in the next section.
We did PCR with 10 primer sets listed in Table 1, excluding Ve16S and mlCOIintF&jgHCO2198, because amplicon sizes of the latter were too long for short-read sequencing platforms. PCR were carried out in triplicate in a 25 μL reaction volume containing 1× HiFi PCR buffer (TransGen Inc., Beijing, China), 0.2 mM dNTPs, 1 U HiFi Taq DNA Polymerase, 0.4 μM each primer and a certain amount of template DNA. To mimic variations of DNA concentrations in natural eDNA experiments, the mock-even and mock-gradient were tested with high (7ng DNA/reaction) and low (0.7ng DNA/reaction) DNA concentrations, respectively. The zoo eDNA was tested only by high DNA concentration (7ng DNA/reaction). Except for MarVer1 and MarVer3, the other eight primer sets used the following thermal cycling program: an initial denaturation for 30 s at 98°C followed by 40 cycles of 15 s at 98°C, 30 s at optimal annealing temperature (see Table 1), 30 s at 72°C and a final extension of 10 min at 72°C. MarVer1 and MarVer3 used the touch-down PCR protocol described by Valsecchi et al., 2020. PCR products were purified using a TIANGEN universal DNA purification kit (Beijing, China) following the manufacturer’s instructions. The concentrations of the purified PCR products were measured using a NanoDrop-2000 spectrophotometer (Thermo Scientific). The purified PCR products were subject to Illumina library preparation using NEBNext Ultra DNA Library Prep Kit (New England Biolabs Inc.). DNA library was sequenced on an Illumina HiSeq X-Ten platform using the paired-end 150-bp mode.
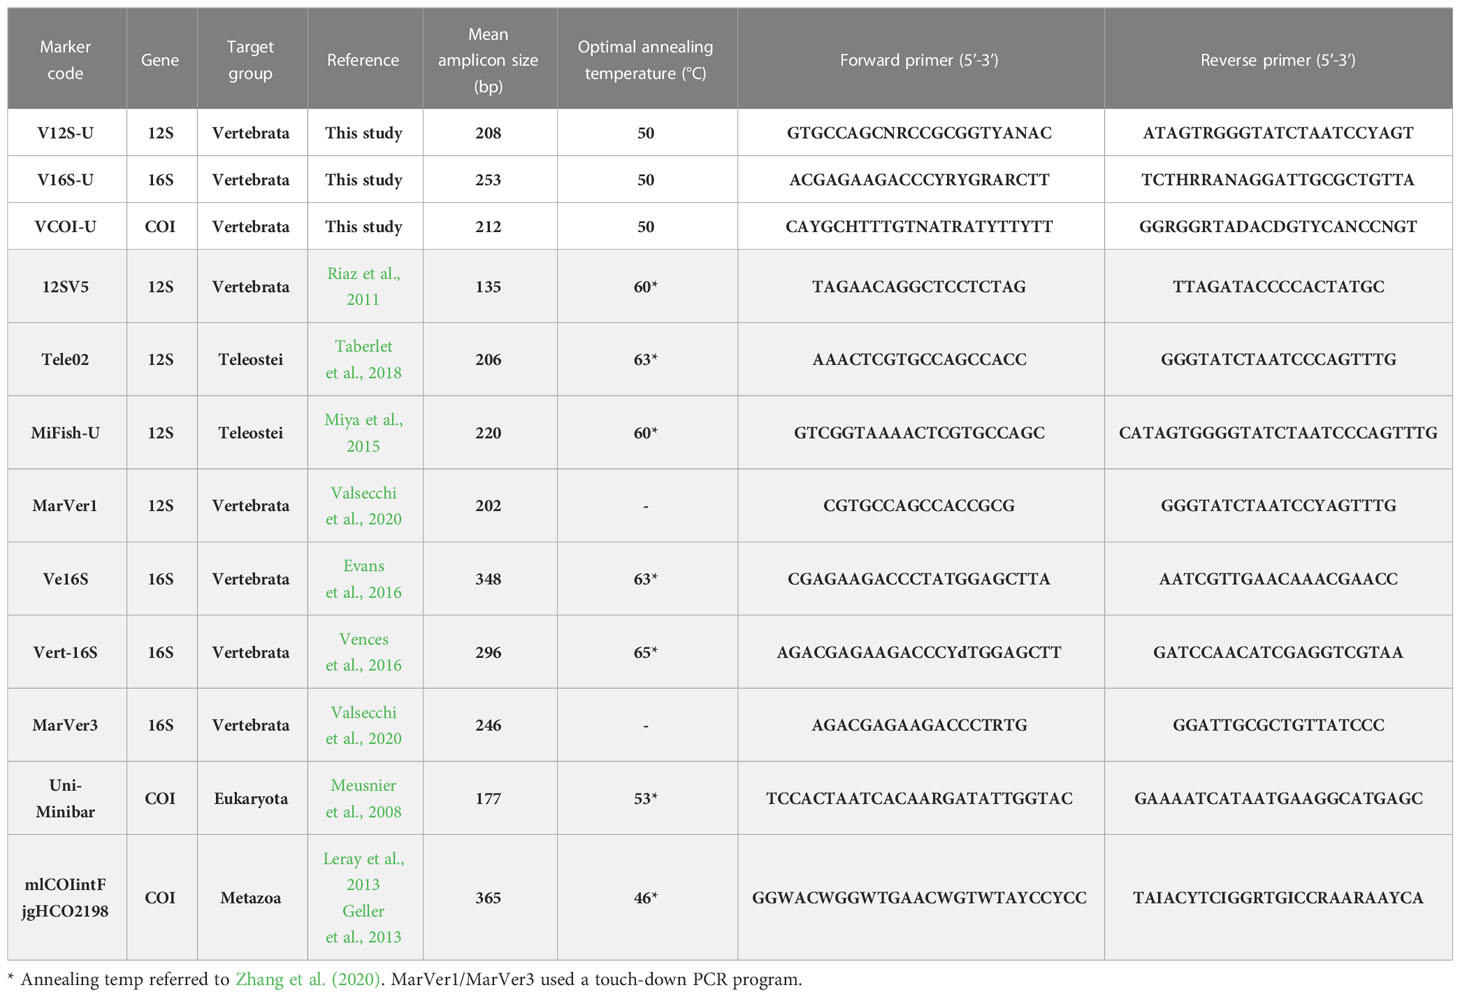
Table 1 Summary of the 12 eDNA metabarcoding primer sets analyzed in this study (primers designed by other authors are shaded).
Primer test using natural environmental DNA
Study sites and water sampling
To evaluate the ability of our primer sets to amplify vertebrate DNAs from real natural environments, we performed metabarcoding analysis using water eDNAs sampled from three different areas of China: Tangjiahe (TJH) National Nature Reserve (Sichuan province, China), Hekou (HK) town (Guangdong province, China) and Xintian (XT) town (Guangdong province, China) (Figure S1). The TJH site is a national nature reserve and represents a highly protected natural environment, the XT site is located in a provincial nature reserve with restricted human influence, and the HK site is located also in a provincial nature reserve but influenced by human agricultural activities. In TJH, we collected water samples from 10 localities of a local river in spring (May, 2018) and autumn (October, 2018), respectively; in HK and XT, we each collected water samples from 10 localities of a local river (October, 2019) (Figure S1). In each water sampling location, 2-L water sample was collected from 5 to 10 cm below the surface and approximately 1 m from the river bank using disposable 1-L plastic bottles. Water samples were filtered immediately in filed through a disposable 0.45-μm pore size CN Membrane filter (47 mm diameter; Nalgene™ 145-2045). Filter membranes were transferred into individual 15-ml sterile microcentrifuge tubes containing 95% ethanol, transported on ice to the laboratory and stored at −80°C until DNA extraction.
DNA extraction, PCR and sequencing
eDNA extraction was carried out in a clean bench designated for eDNA processing only. All equipment and utensils (including the bench surface) were cleaned with a 10% bleach solution prior to sample processing and between samples. Samples were processed in small batches (4 to 8 samples per batch) to reduce cross-contamination. For each sample, 1/4 size of the filter membrane was blotted with sterilized filter paper and cut into pieces with sterilized scissors. DNA extraction was done by using TIANGEN Magnetic Bead-based Universal DNA Extraction Kit (DP705; TransGen Inc., Beijing, China). To control for contamination during DNA extraction, each extraction batch included an extraction blank with 100 μL ddH2O. The extracted DNA was stored in 1× TE buffer at -20°C.
Our goal was to test the performance of our newly designed primers in monitoring the vertebrate diversity of the target areas, so we pooled the ten eDNA samples of the same sampling area (in equal concentration) into four total eDNA samples (TJH-spring, TJH-autumn, XT, HK). The extraction blanks of the four sampling areas were also separately pooled into four blank samples as negative control. These four pooled eDNA samples and four extraction blank samples were used as PCR templates and the PCR reagents and cycling condition were the same as mentioned above. All the PCR amplifications were performed in triplicate with separate amplification blank (no template), and checked with gel electrophoresis in which all the extraction blanks and amplification blanks have no visible amplification. PCR products, extraction blanks, amplification blanks of the same sample were separately mixed and purified using a TIANGEN universal DNA purification kit (Beijing, China). The concentrations of the purified DNAs were measured using a NanoDrop-2000 spectrophotometer (Thermo Scientific). Finally, the four experimental PCR products, four extraction blanks, and four amplification blanks were subject to Illumina library preparation with an NEBNext Ultra DNA Library Prep Kit (New England Biolabs Inc.), labeled by different P7 indexing primers. The libraries were sequenced on an Illumina HiSeq X-Ten platform using the paired-end 150-bp mode.
Bioinformatics analysis
The Illumina raw reads were filtered to remove sequencing adapter contamination and low-quality reads (sequencing quality < 5) by using Trimmomatic (Bolger et al., 2014) and FastQC (http://www.bioinformatics.babraham.ac.uk/projects/fastqc/). The clean reads were sorted into different samples by different P7 indexes. The sorted reads were trimmed using an in-house Python script (available at https://figshare.com/s/f4698f489238b911713c) to remove primer sequences. The primer-trimmed pair-end reads were merged into sequences using the software FLASH (Magoc and Salzberg, 2011) with a minimum overlap of 10 bp. The merged sequences were then analyzed using the program VSEARCH v2.17.1 (Rognes et al., 2016). The derep_fulllength function of VSEARCH was used to dereplicate the merged sequences, retaining the sequences with minimum abundance of 3 (miniquesize=3). Potential chimeric sequences were identified and discarded using the VSEARCH command uchime3_denovo, requiring parental abundance to be at least 16 times greater than that of the chimeras. The cluster_fast function was used to cluster similar sequences (similarity ≥ 97%) into operational taxonomic unit (OTU) sequences, and fastx_filter was used to retain only OTUs represented by at least 10 similar sequences. Finally, if any OTUs of an experimental PCR also existed in its extraction blank or amplification blank result, these OTUs would be considered as contaminations and removed.
Each filtered OTU sequence was first assigned to high-level vertebrate taxonomic groups (Cyclostomata, Chondrichthyes, Actinopterygii, non-tetrapod Sarcopterygii, Amphibia, Reptilia, Aves, Mammalia) according to the best-hit of BLAST search against a customized database. This database encompassed all available vertebrate 12S, 16S, and COI sequences gathered from the NCBI and BOLD databases. If the top BLAST hit for an OTU did not meet the minimum criteria (query coverage ≥ 99% and identity ≥ 90%), it would be designated as a non-vertebrate sequence. Subsequently, the identified vertebrate OTU sequences were subjected to species or genus identification, depending on the predetermined similarity thresholds. For species-level identification, the similarity thresholds for the 12S, 16S, and COI fragments were set at ≥98% (Cilleros et al., 2019; Valsecchi et al., 2020), ≥99% (Stat et al., 2019; Kumar et al., 2022), and ≥97% (Srivathsan et al., 2022; Zainal Abidin et al., 2022), respectively. Likewise, for genus-level identification, the similarity thresholds for the 12S, 16S, and COI fragments were defined as 98-95%, 99-95%, and 97-95%, respectively. OTUs that exhibited a sequence identity of less than 95% to their best-matching species were excluded from further assignment.
Results
Primer design
Based on the multiple sequence alignment of 792 vertebrate mitochondrial genomes (representing 792 vertebrate families, that is, about 70% of the known vertebrate families), we designed three sets of universal primers, situated on the 12S rRNA gene, the 16S rRNA gene, and the COI gene, respectively. They were named the VertU primer sets (U represents universal), including V12S-U, V16S-U, and VCOI-U. The sequence logos of the VertU primers illustrating the base match between the primers and vertebrate mtDNA sequences were given in Figure 1A. Because priming sites conserved across vertebrates within the 12S/16S genes are limited, the V12S-U and V16S-U primers overlapped to some extent with many of the previously designed 12S/16S primers, but they are not fully identical. The relative gene locations of the V12S-U, V16S-U, VCOI-U, and other published primer sets were illustrated in Figure 1B and the primer sequences were given in Table 1.
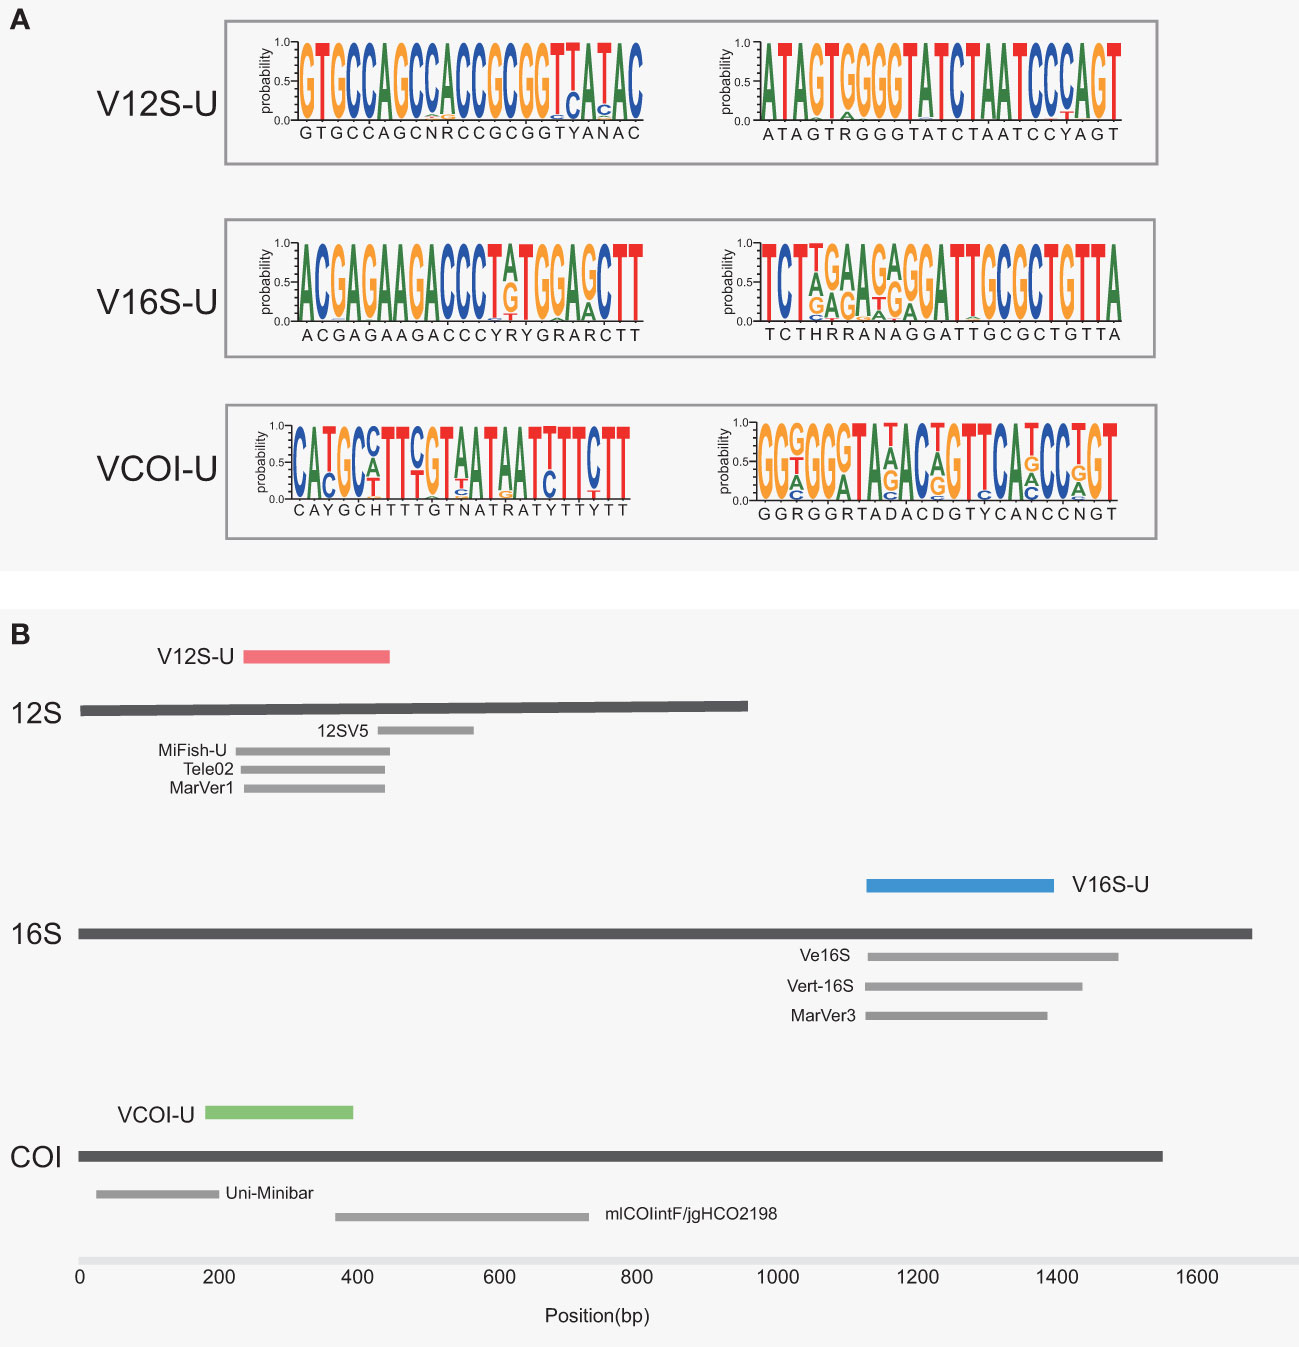
Figure 1 (A) Sequence logo of the primer illustrating the quality of the match between the primer and its target sequence. A total of 6567 vertebrate sequences were summarized. The primer sequences are indicated under the logos. (B) Location of the three eDNA metabarcoding markers designed in this study. Other nine eDNA markers designed by previous studies were shown as gray bars.
V12S-U amplifies a fragment of the 12S rRNA gene about 200 bp in length. The V12S-U fragment largely overlaps with the amplified regions of MiFish-U (Miya et al., 2015) and Tele02 (Taberlet et al., 2018) that target bony fishes, and with the amplified region of MarVer1 (Valsecchi et al., 2020) that targets marine vertebrates, but only partially overlaps with the amplified region of the widely used 12SV5 (Riaz et al., 2011) that targets all vertebrates (Figure 1B). The priming sites of V12S-U are very close to those of MarVer1. The difference is that the forward primer of V12S-U moves 7 bp forwards to gain a more complex 3’ end (“YANAC” compared to “CCGCG” in the MarVer1 forward primer), and the reverse primer of V12S-U moves 3 bp backwards to gain a 3’ end that is more conserved across vertebrates.
V16S-U amplifies a variable region of the 16S rRNA gene about 250 bp in length. The V16S-U fragment basically overlaps with that of the recently designed MarVer3 (Valsecchi et al., 2020), and partially overlaps with those of the previously designed Ve16S (Evans et al., 2016) and Vert-16S (Vences et al., 2016). The primer sites of V16S-U and MarVer3 largely overlap. The difference is that the forward primer of V16S-U shifts 6 bp forwards to gain a 3’ end that is more conserved across vertebrates, and the reverse primer of V16S-U moves 4 bp backwards to skip a “CCC” structure in the 3’ end (“TGTTA” instead of “ATCCC” in the MarVer3 reverse primer). In addition, compared to the MarVer3 primers, the V16S-U primers use more degenerate bases in order to match more vertebrates.
VCOI-U amplifies a fragment of the COI gene about 200 bp in length. The VCOI-U fragment only overlaps with the tail of Uni-Minibar fragment (Meusnier et al., 2008) and the head of mlCOIintF/jgHCO2198 fragment (Geller et al., 2013; Leray et al., 2013).
As showed in Table 1, the amplicons of the VertU primer sets are all designed around 200 bp, which are well suitable for sequencing with the cost-effective short sequencing platforms such as HiSeq or NovaSeq. The recently designed MarVer1 and MarVer3 primers also adopt such an amplicon length range. In contrast, amplicons of Vert-16S, Ve16S and mlCOIintF/jgHCO2198 are about 300-360 bp, too large to employ short-read sequencing platforms.
In-silico PCR evaluation
We used a total of 6567 complete mitochondrial genome sequences (each corresponds to a vertebrate species) downloaded from NCBI as test templates to check the amplification performance of the newly designed primers based on in-silico PCR evaluation. As a comparison, we also evaluated some widely used eDNA metabarcoding primers designed by other authors. The information of the 6567 mitochondrial genomes and detailed in-silico PCR results were given in Table S3.
For the 12S rRNA gene, the overall amplification success rates across vertebrates of V12S-U, 12SV5, MarVer1, Tele02, MiFish-U are 99%, 99%, 95%, 96%, and 81%, respectively. Among all the eight major vertebrate groups (cyclostome, cartilaginous fish, ray-finned fish, lobe-finned fish, amphibian, reptile, bird, and mammal), V12S-U and MarVer1 show similar in-silico PCR performance, and have better amplification success than the other primers (Figure 2). Tele02 and MiFish-U show lower amplification success in tetrapod vertebrates as they are particularly designed for fishes. V16S-U has comparable amplification success with previously designed Vert-16S and MarVer3 among the eight major vertebrate groups. In contrast, Ve16S shows an apparent lower amplification success than V16S-U, Vert-16S and MarVer3 in all vertebrate groups (Figure 2). The overall amplification success across vertebrates of V16S-U, Vert-16S, MarVer3, and Ve16S are 98%, 98%, 98%, and 33%, respectively. VCOI-U shows better amplification performance in nearly all vertebrate groups than the eukaryote-universal Uni-Minibar and the metazoa-universal mlCOIintF/jgHCO2198 (Figure 2). The overall amplification success across vertebrates of VCOI-U, mlCOIintF/jgHCO2198, and Uni-Minibar are 99%, 87%, and 2%, respectively.
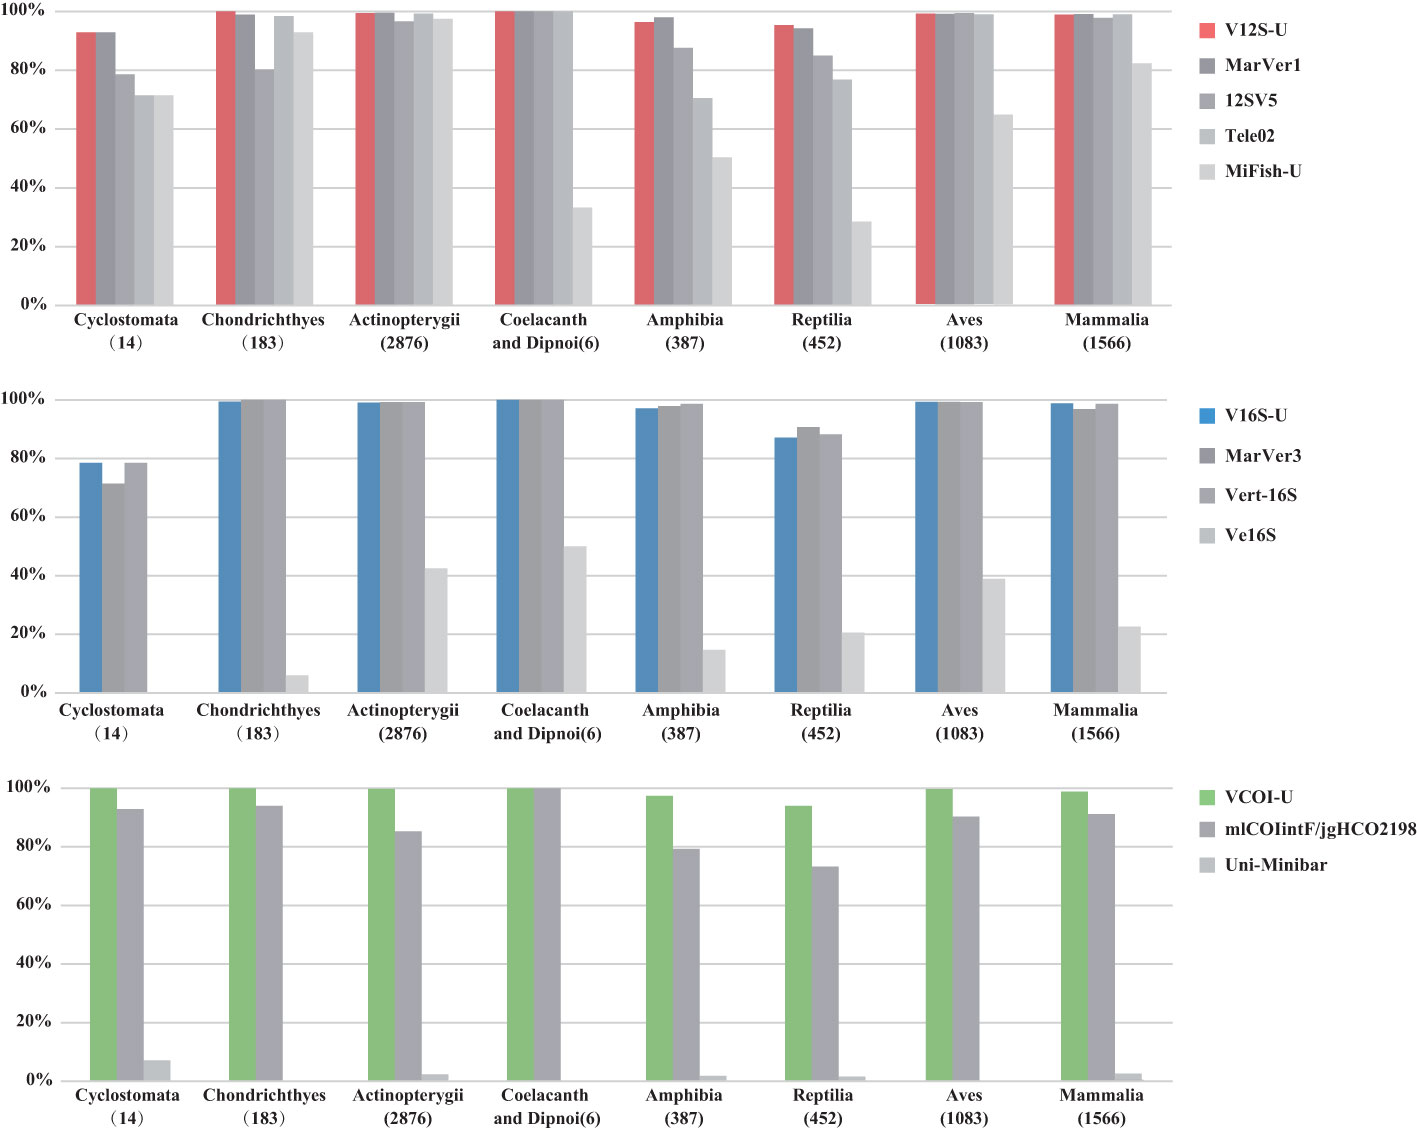
Figure 2 The PCR success rate of the three VertU markers and other published eDNA markers in the in-silico PCR test. The total number of mitochondrial genome sequences analyzed for each vertebrate group is shown in parentheses.
In addition, we evaluated the taxonomic discrimination ability of ten primer sets (excluding Uni-Minibar and Ve16S because these two primer sets have low amplification success) by calculating the distinguishable percentage at both species-level and genus-level based on the in-silico PCR result. If the barcode region of the primer set has at least 2 nucleotide differences between two taxa, these two taxa are considered as distinguishable by this primer set. Higher distinguishable percentage for a primer set within a vertebrate group means that this primer set is more likely able to distinguish closely related species of this vertebrate group. Lower distinguishable percentage means worse taxonomic discrimination ability. The distinguishable percentages of the ten primer sets for different vertebrate groups at both the species and genus levels are given in Table 2. According to these results, 12SV5 has the lowest taxonomic discrimination ability among the ten tested primer sets. The other nine primer sets have ~73-85% distinguishable percentage at the species level for the whole vertebrate. The newly designed V12S-U, V16S-U and VCOI-U show at least comparable taxonomic discrimination ability to those of previously published primer sets. The taxonomic discrimination ability of the three VertU markers for different vertebrate groups roughly followed the order VCOI-U > V16S-U > V12S-U. It should be noted that none of the tested primer sets has 100% distinguishable percentage at the species level across the whole vertebrate. Therefore, it is of importance to use multiple primer sets to amplify several barcode regions for more accurate species detection and discrimination.
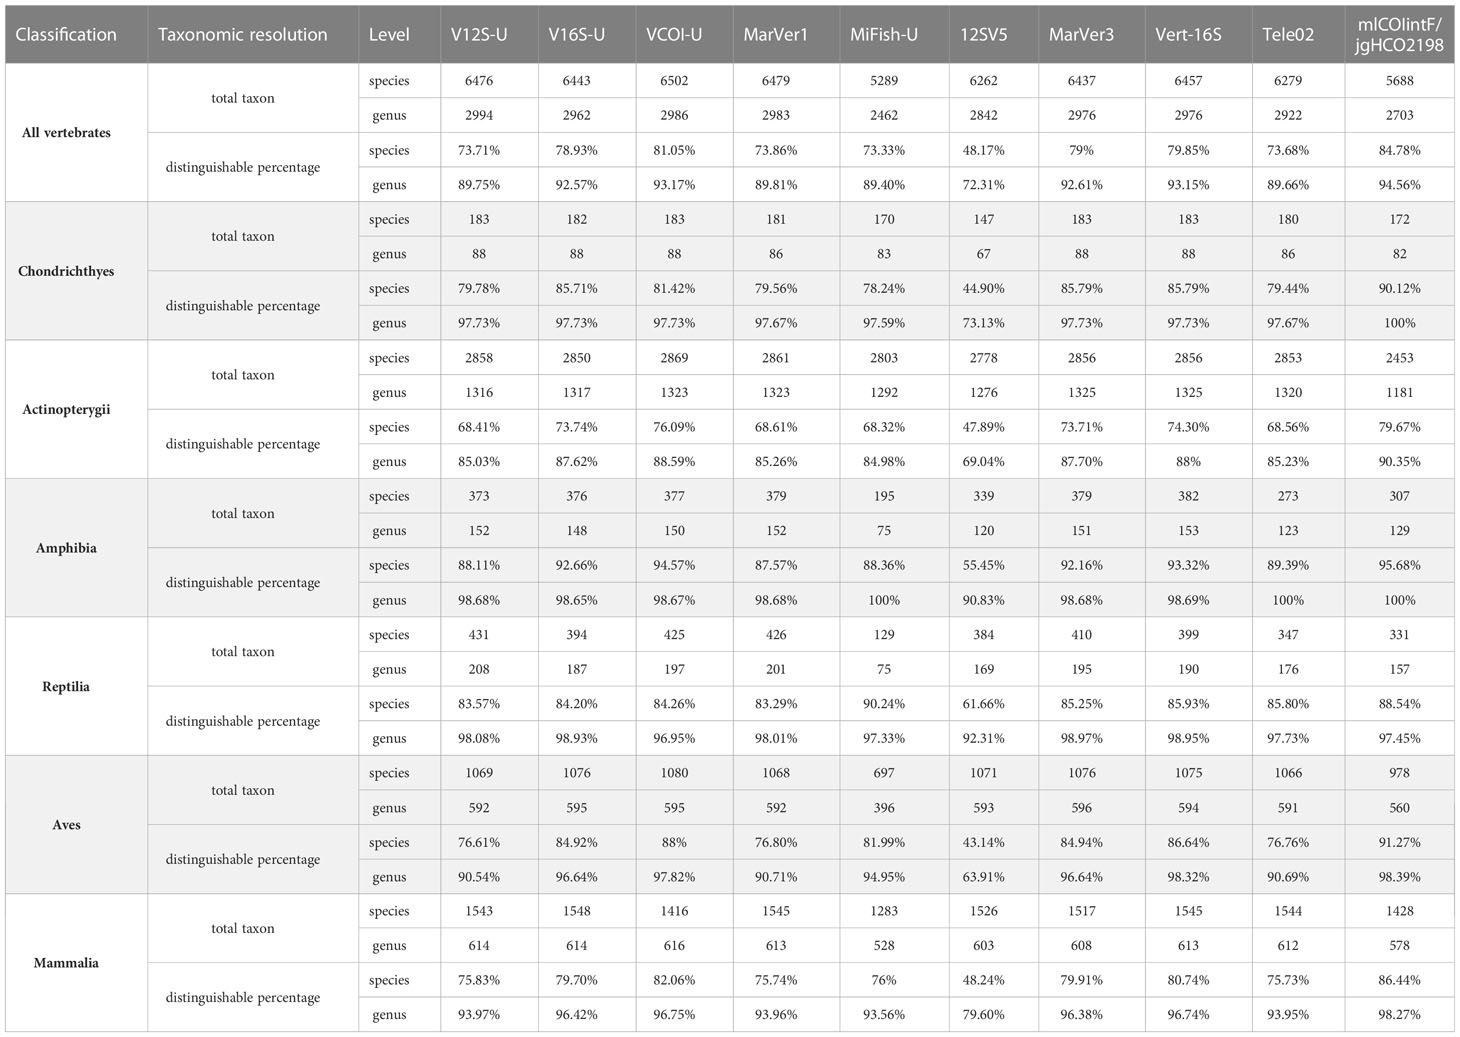
Table 2 The distinguishable percentages of ten primer sets for different vertebrate groups at both the species and genus levels.
Finally, we also investigated the amplification specificity to vertebrates of the primers of the three VertU markers by using the PrimerTree analysis, results of which are given in Figure 3. The phylogenetic trees show that nearly all biological groups amplified by V16S-U are vertebrates, and that V12S-U can amplify sequences from both vertebrates and invertebrates but its major amplified biological groups are vertebrates (Figure 3). In contrast, VCOI-U amplifies a diverse group of invertebrate species in addition to vertebrate species, and the amplified invertebrate species outnumber the amplified vertebrate species (Figure 3). Therefore, the amplification specificity order of the three VertU markers are V16S-U, V12S-U, and VCOI-U.
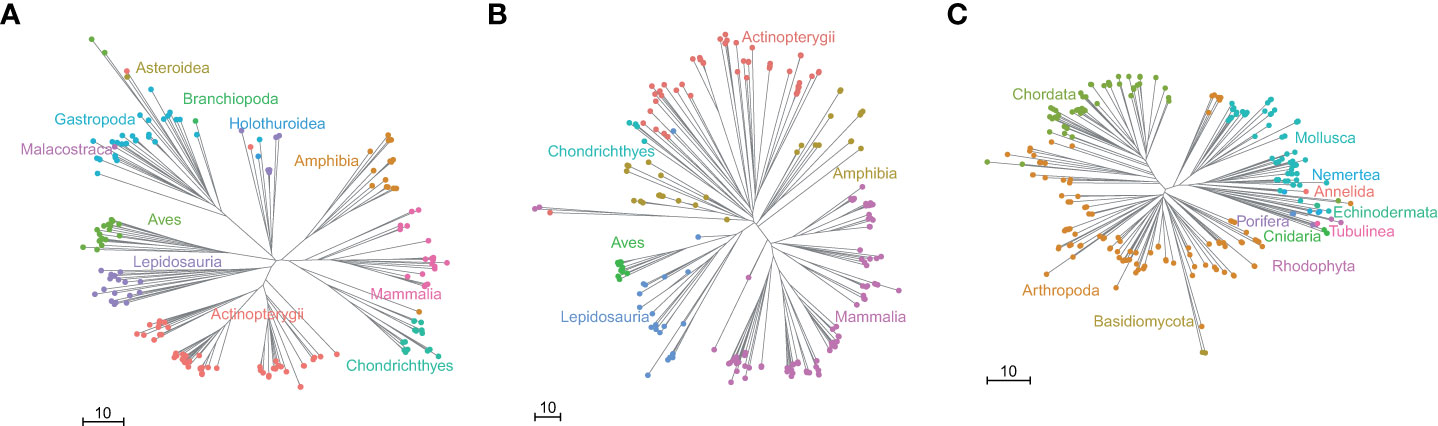
Figure 3 The PrimerTree results for the three VertU markers. The figure shows phylogenetic trees annotated at the class level for (A) V12S-U and (B) V16S-U primer pairs, and phylum level for (C) VCOI-U. Different classes (phyla) are represented by filled circles with different colors. Lengths of branches correspond to the base differences among sequences.
Primer evaluation with mock DNA and zoo eDNA
We evaluated and compared the vertebrate species detection performance of the three VertU primer sets together with seven other previously published primer sets MarVer1, 12SV5, Tele02, MiFish-U, MarVer3, Vert-16S, and Uni-minibar, using two types of DNA templates: mock DNA mixtures that consisted of DNA extracts from 50 vertebrate species, and water eDNA samples from the Guangzhou Zoo with known species compositions (see Materials and methods). The mock DNA test represents a kind of ideal DNA condition, while the zoo eDNA test is somewhat close to real eDNA surveys. The PCR amplification results of the ten tested primer sets were shown in Figure 4. When PCRs were performed with mock DNAs that contained only pure vertebrate genomic DNAs, the ten tested primer sets all produced clean target amplicons (Figure 4A). However, when PCRs were performed with zoo eDNA that contained more complex sources of DNA, the ten tested primer sets showed different amplification specificity: V12S-U, V16S-U, VCOI-U, 12SV5, and MiFish-U still produced clean target bands; MarVer1, Tele02, MarVer3, Vert-16S, and Uni-minibar produced target bands but with visible nonspecific amplifications, and the nonspecific amplifications of MarVer1, Tele02, MarVer3 were more severe than those of Vert-16S and Uni-minibar (Figure 4B).
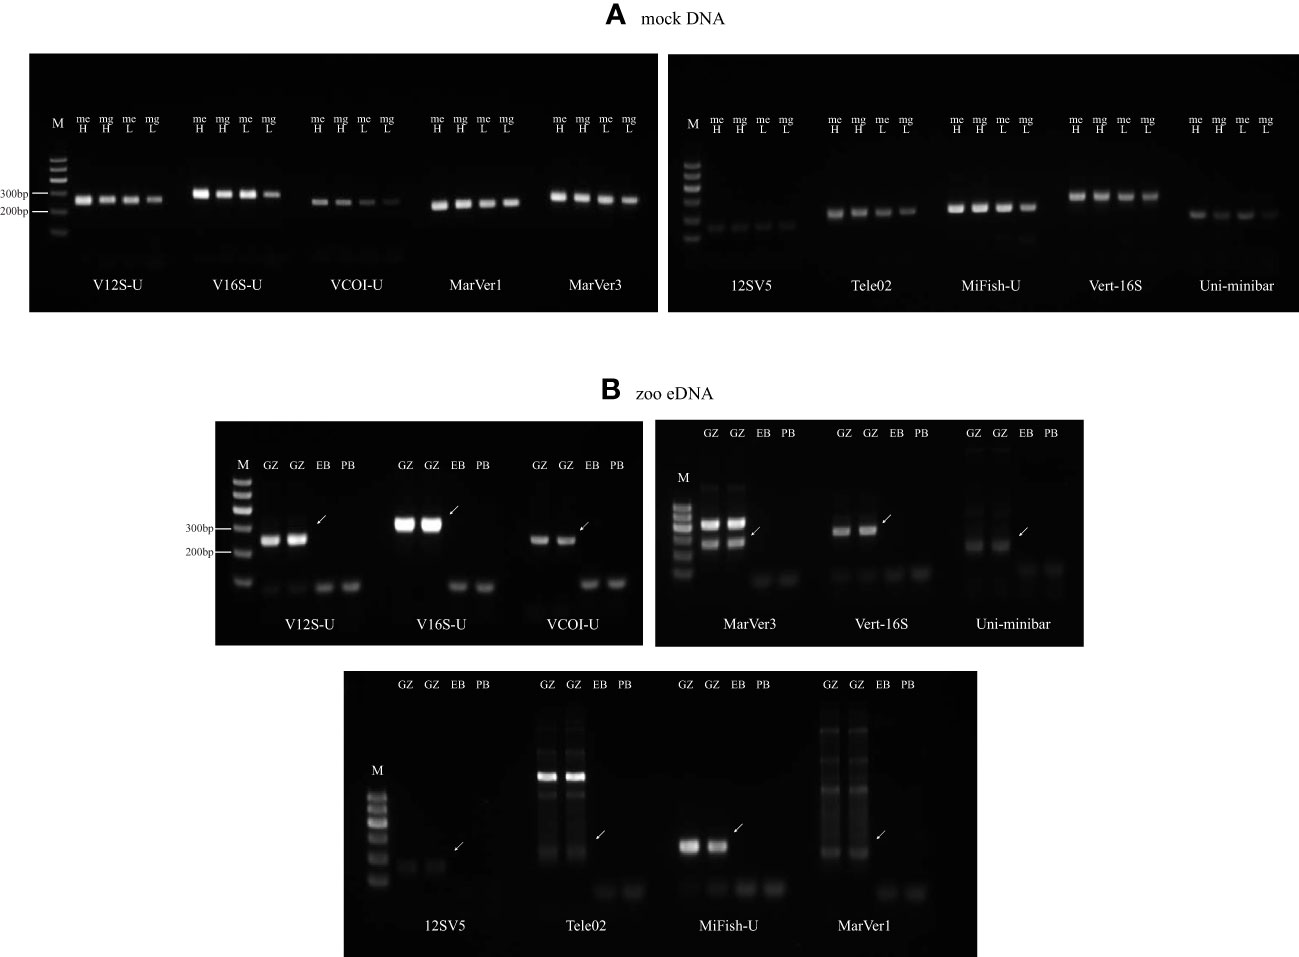
Figure 4 Agarose electrophoresis images of amplification products of ten eDNA primer sets: V12S-U (12S), MarVer1 (12S), 12SV5 (12S), Tele02 (12S), MiFish-U (12S), V16S-U (16S), MarVer3 (16S), Vert-16S (16S), VCOI-U (COI) and Uni-minibar (COI). (A) DNAs of mock-even (me) and mock-gradient (mg) both with high (H) and low (L) concentration are used as templates. (B) eDNA extracts collected from GuangZhou Zoo (GZ), extraction blank (EB), and PCR blank (PB) are used as templates. Bands pointed by arrows are target bands.
We sequenced these PCR products with Illumina HiSeq sequencing. For the mock DNA test, we obtained a total of 5.77 G sequencing data (38,482,184 clean reads). The species detection results of the mock DNA test were shown in Figure 5 and the detailed sequence abundance information for each species were given in Table S4. Overall, the species detection ability of each tested primer set revealed by the mock DNA test was in agreement with the in-silico PCR prediction result. In all mock DNA tests (even/gradient distribution, low/high DNA concentration), V12S-U, V16S-U, MarVer1, and MarVer3 could always detect all 50 target vertebrate species (100% success), showing the highest stability. VCOI-U, MiFish-U, Vert-16S occasionally missed one or two species (> 96% success), also pretty reliable. 12SV5 and Tele02 could detect 40-47 species (80-94% success). Uni-minibar only detected 24-37 species (48-74% success) in all mock DNA tests, apparently worse than the above-mentioned primer sets, but obviously performed better than the in-silico PCR prediction result. In addition, we briefly compared the relationship between input DNA amounts and sequence abundances using the result of the mock-gradient test, and found only weak positive regression relationship (Figure S2), suggesting that sequence abundances in eDNA metabarcoding surveys can only serve as a half-quantitative indicator for biomass of species.
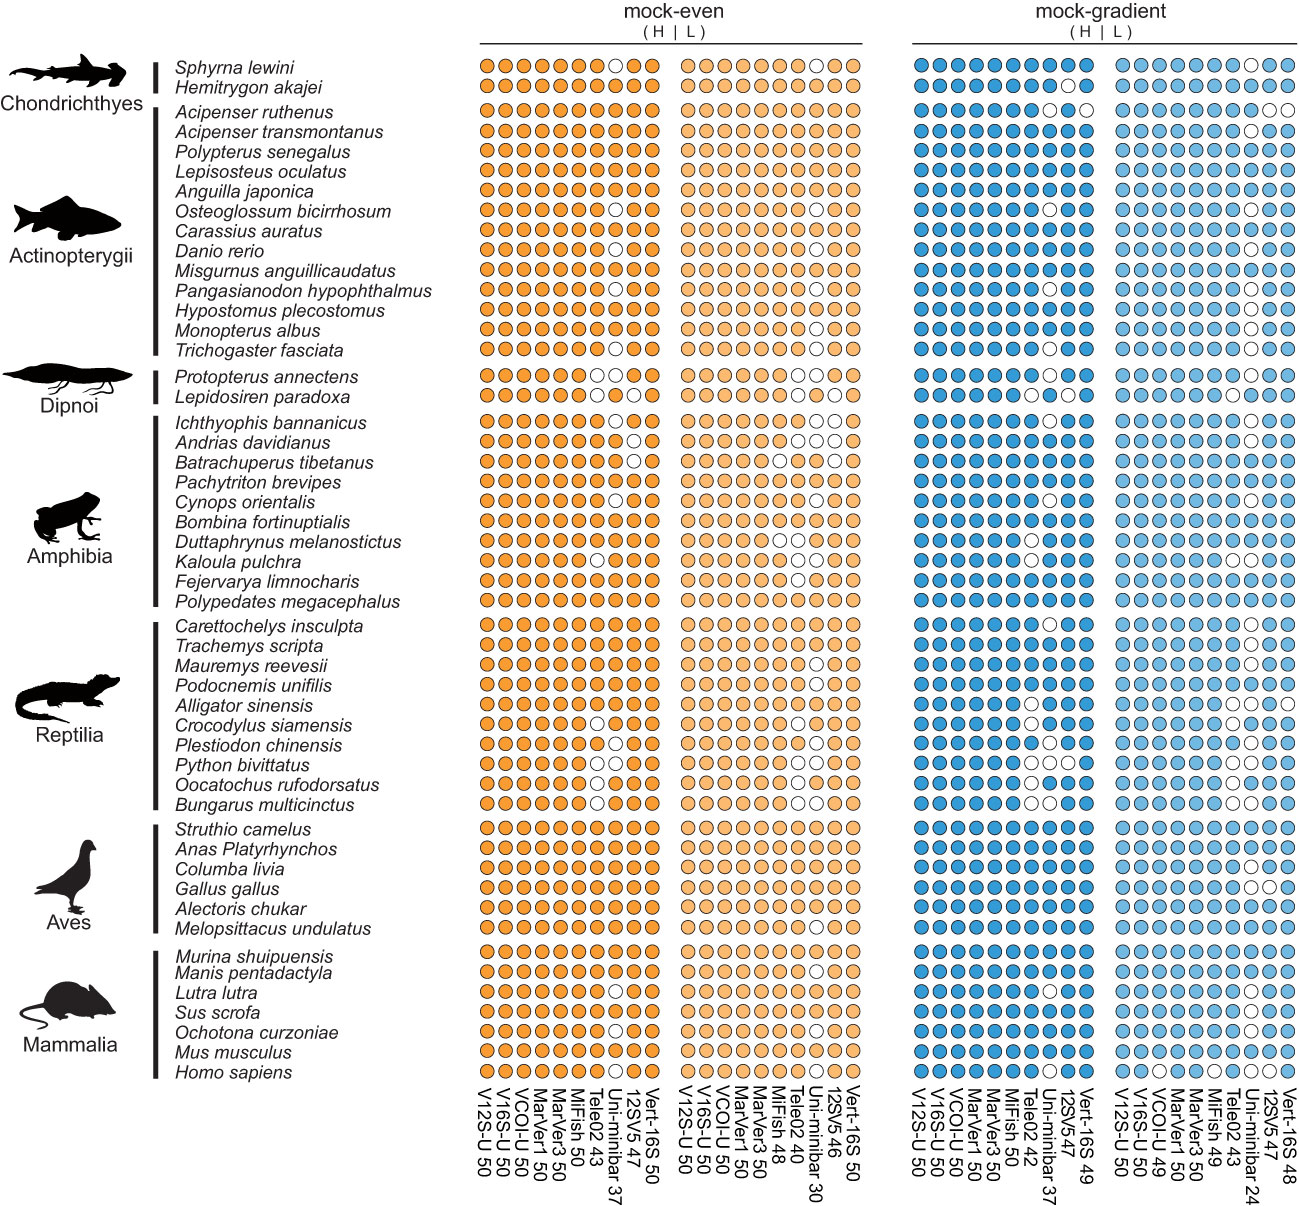
Figure 5 Vertebrate species detection performance of ten primer sets evaluated by mock DNA mixtures of 50 vertebrate species. Filled circles represent successful detection, while the blank circles indicate no detection. H/L means using high/low DNA concentrations in the amplification reactions. Detailed sequence abundances for each circle were given Table S4.
For the zoo eDNA test, we obtained a total of 6.59 G sequence data (43,970,446 clean reads). Of the 34 vertebrate species known to be present in the sampling areas, we detected all the 34 species with the VertU primers (100% success), which are collectively distributed across 4 classes and 18 families (Table 3). Among the three VertU markers, V16S-U detected all 34 species (100% success), both V12S-U and VCOI-U detected 33 species (97% success). Among the seven previously published primer sets, only Vert-16S could detect all the 34 vertebrate species but this marker is too long for the adoption of short-read sequencing platforms. Tele02 detected 32 vertebrate species, but it missed all two target amphibian species, implying that this primer set is less suitable for detecting amphibians. MarVer1 detected 32 species and MarVer3 detected 31 species, which is not as good as their performance in the mock DNA test. MiFish-U detected a total of 30 vertebrate species and found all 23 target fish species, which is in line with its fish-specificity. 12SV5 only detected 28 species, its sequence abundances among species were rather uneven (concentrated on several species; Table 3), showing obvious amplification bias. Uni-minibar detected only 8 vertebrate species, again performed the worst among all tested primer set.
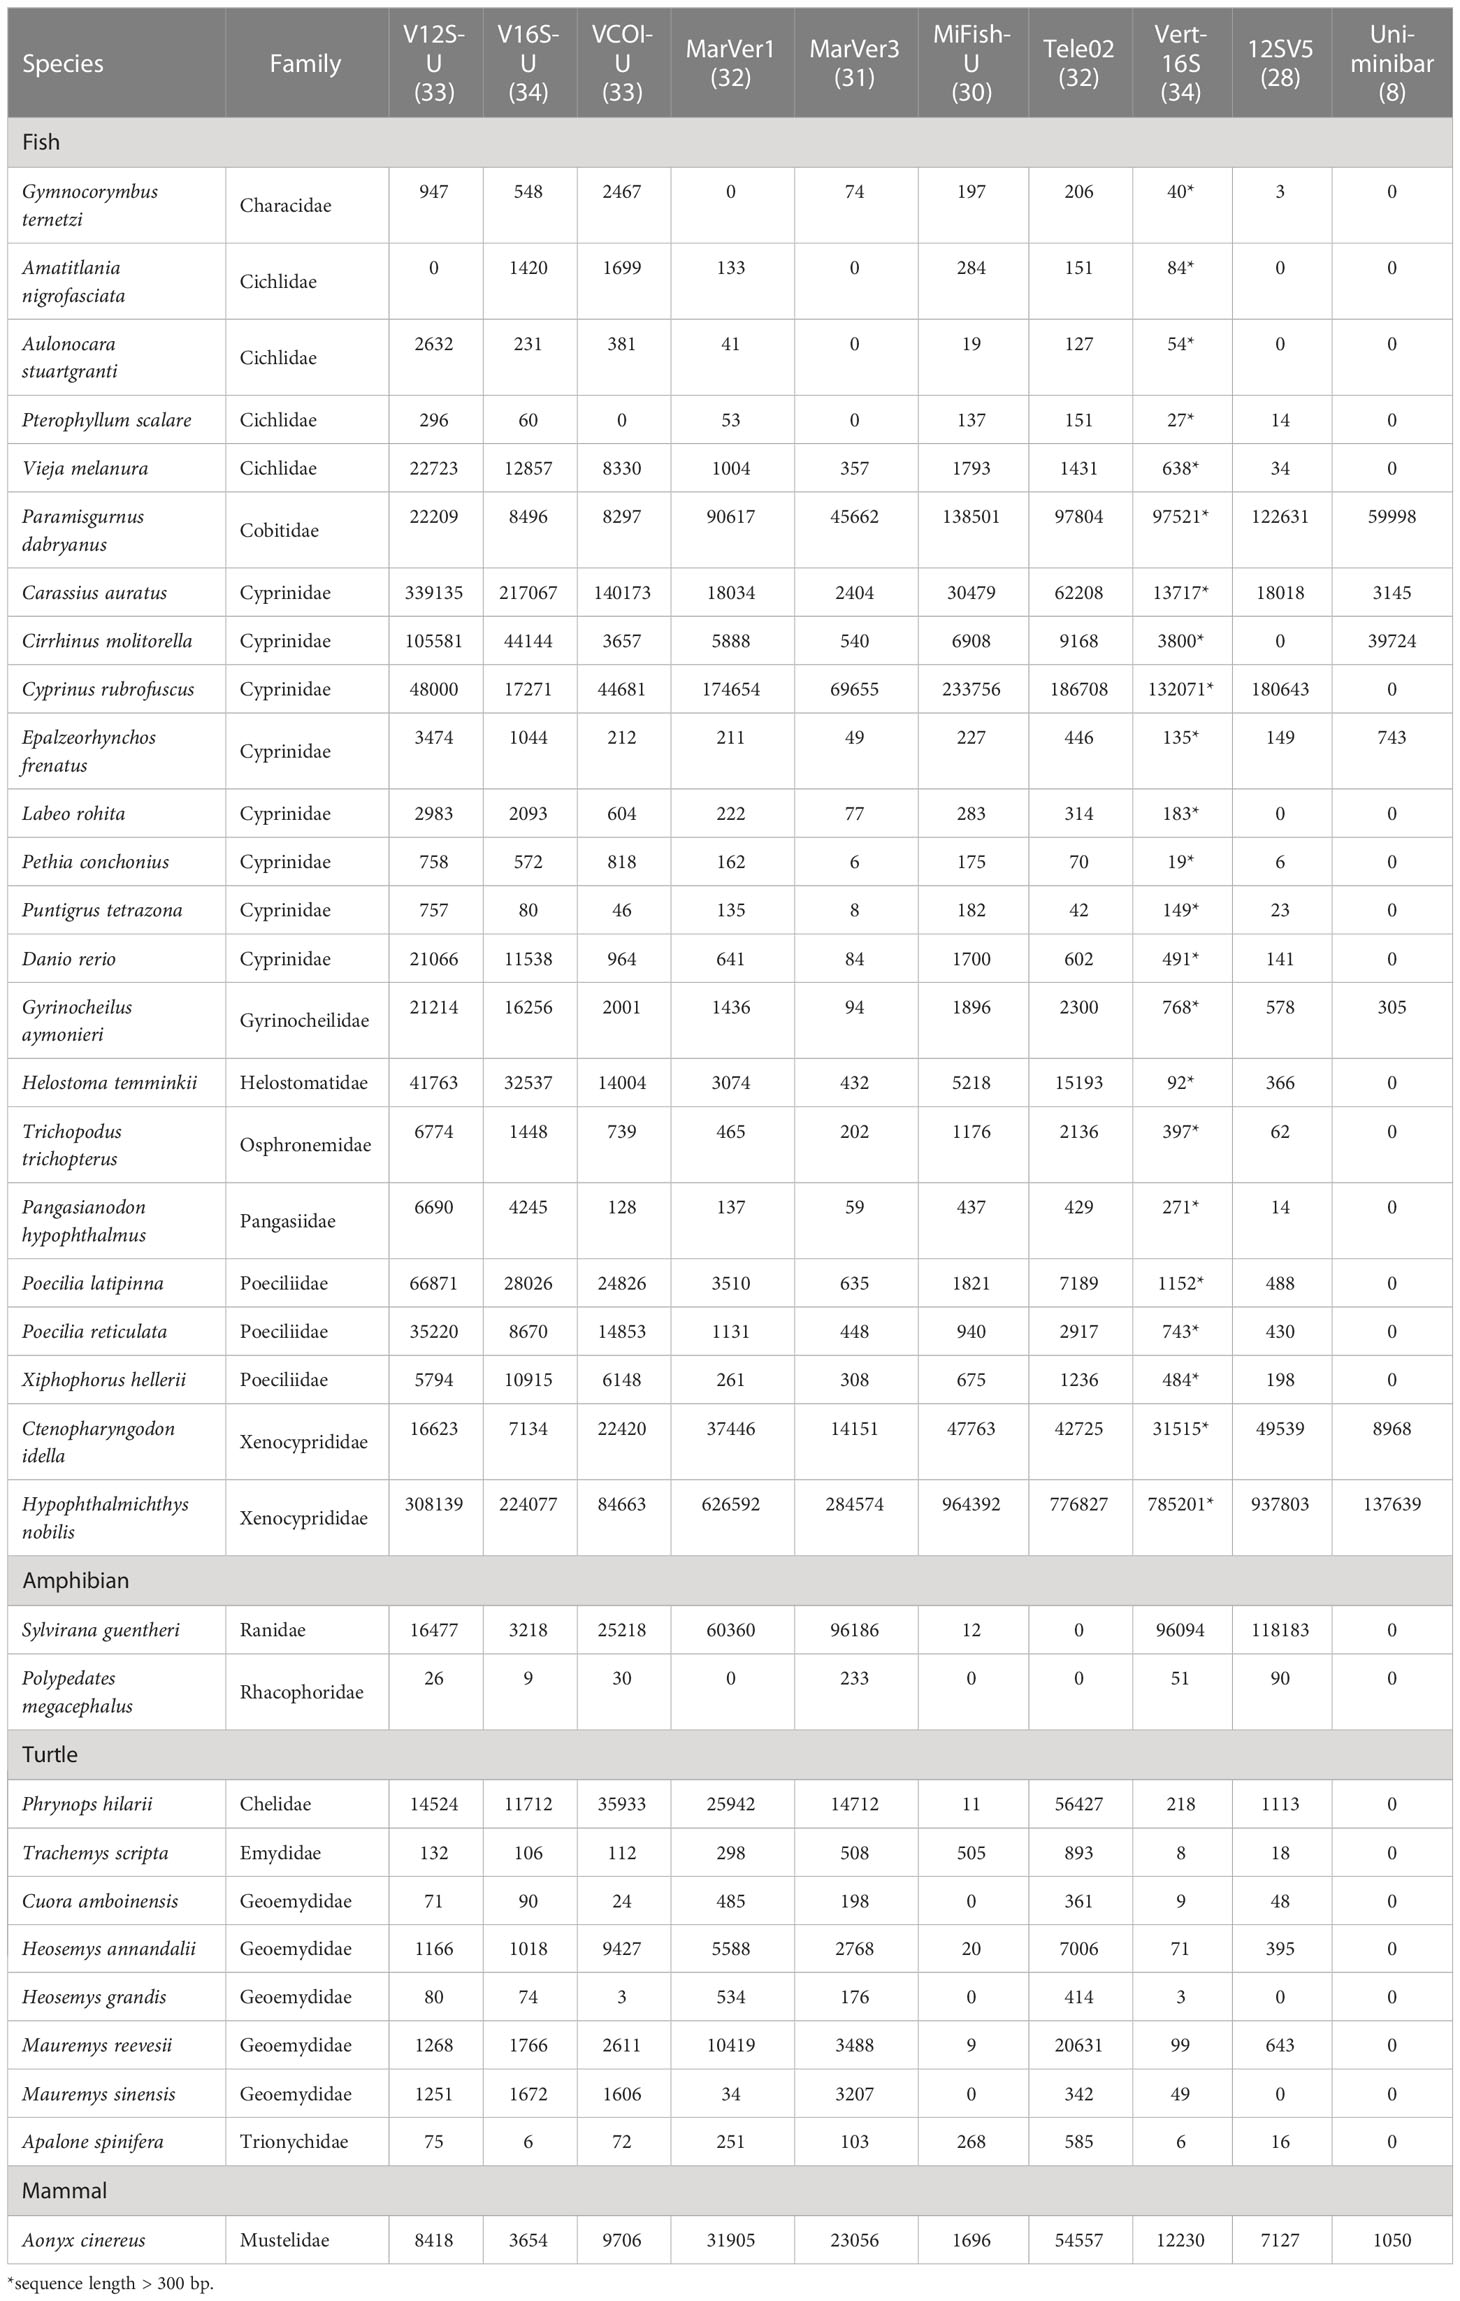
Table 3 Taxonomic composition and sequence abundances of the 34 vertebrate species detected in the metabarcoding analysis of the zoo eDNA.
These results show that under ideal condition containing only vertebrate DNAs, nearly all tested primer sets perform pretty well, but when using real eDNA samples with more complex DNA compositions, different primer sets will exhibit different species detection performances. In general, all the three newly designed VertU primer sets showed robust vertebrate species detection ability in both the mock DNA and zoo eDNA tests. Compared with previously published primer sets, VertU primer sets exhibited at least similar, and often better, species detection performance. It should be noted that, in both the mock DNA and zoo eDNA tests, every target species could be detected by at least two VertU markers, which demonstrated the advantage of using multilocus strategy in eDNA metabarcoding studies.
Primer evaluation with natural eDNA samples
To test the real performance of the three VertU markers in detecting vertebrate species from different environmental types, we performed metabarcoding analyses of water eDNAs sampled from different ecological environments in China (see Methods). After PCR amplification, high-throughput sequencing and quality control, we obtained a total of 68,292,490 Illumina HiSeq clean reads (~ 9.42 G sequence data). The clean read numbers of TJH-A, TJH-S, XT and HK eDNA samples were 14,815,932, 15,078,108, 21,782,528, and 16,615,922, respectively. After primer trimming, the sequence reads retained for each marker (12S, 16S and COI) of each sample varied from 2,859,472 to 8,016,098. The FLASH merged sequences varied from 1,293,594 to 3,725,724. The number of VSEARCH unique sequences varied from 11,416 to 101,689 and could be clustered into 151 to 4094 OTU sequences (vertebrate OTU varied from 64 to 304). Sequence reads of the extraction blank PCR and the amplification blank PCR were on average ~3% of those of the corresponding PCR with eDNA, in which vertebrate reads were no more than 0.1%, suggesting that our experiments had no apparent contamination issues. Sequence read counts after each filtering step for the sequencing libraries were summarized in Table 4.
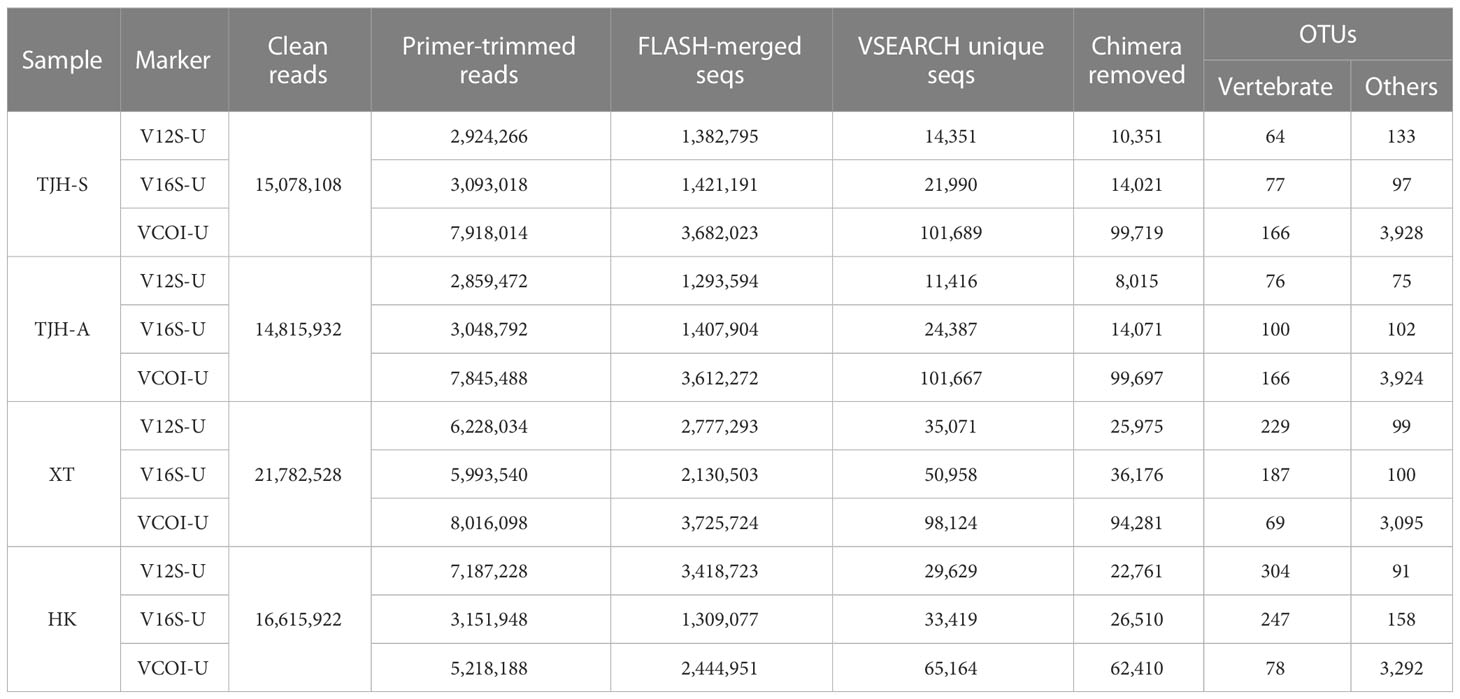
Table 4 Summary of Illumina read counts and unique sequences following each bioinformatics filtering step.
The vertebrate OTU sequences were identified to vertebrate taxa by BLAST search against our local 12S/16S/COI database. After combining the results from all four tested eDNA samples, we detected a total of 895 vertebrate OTUs (BLAST identity ≥ 0.95), covering 182 species, 195 genera, and 94 families. About 84% of the detected vertebrate species were previously documented in the corresponding areas. The detected vertebrate taxa from the four total eDNA samples were summarized in Table 5, and detailed taxonomic information was given in Tables S5-S8. These vertebrate taxa were broadly distributed in five major vertebrate groups: fish, amphibian, reptile, bird, and mammal, suggesting that the VertU markers do work for the whole vertebrate, not restricted to certain groups. The fish species detected in the XT and HK areas were more than those detected in the TJH areas. Many of the detected fish species in the XT and HK areas were related to common human food, thus very likely came from food market, aquaculture, and fishery transport. It is reasonable because the TJH national reserve is a remote area with very few human influences while the XT and HK natural reserves are overlapped with human activity areas. In addition, it should be noted that, for every studied area, more species or genera were detected by using all the three markers together than by using a single marker (Figure 6), which again demonstrated the benefit of applying the multilocus eDNA metabarcoding strategy.
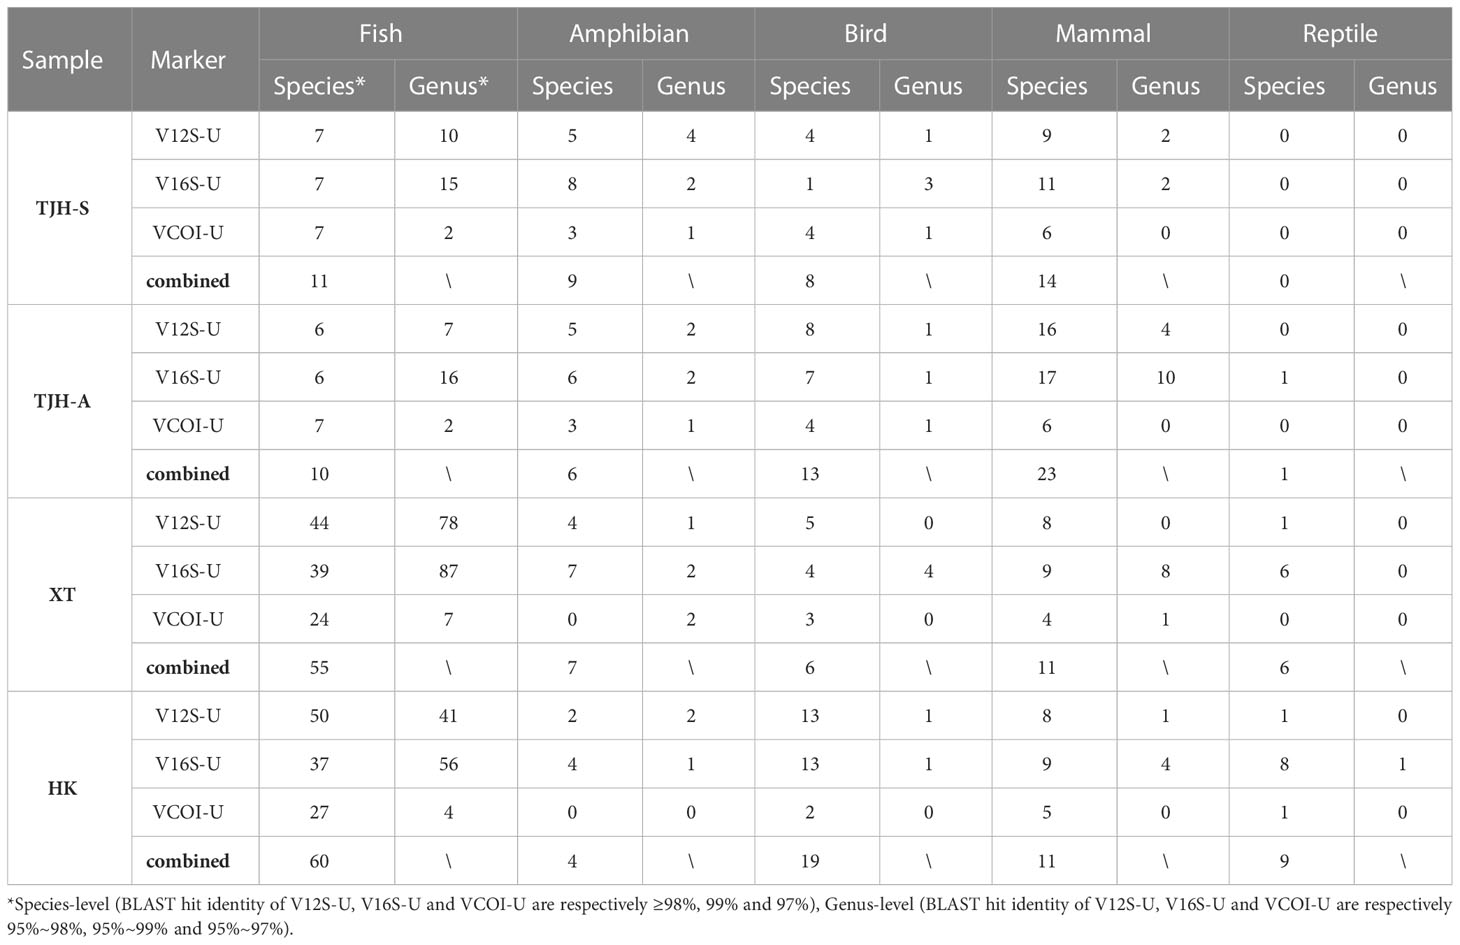
Table 5 The number of vertebrate taxa detected by the three VertU markers in the four natural metabarcoding analyses (only species and genus-level results are shown).
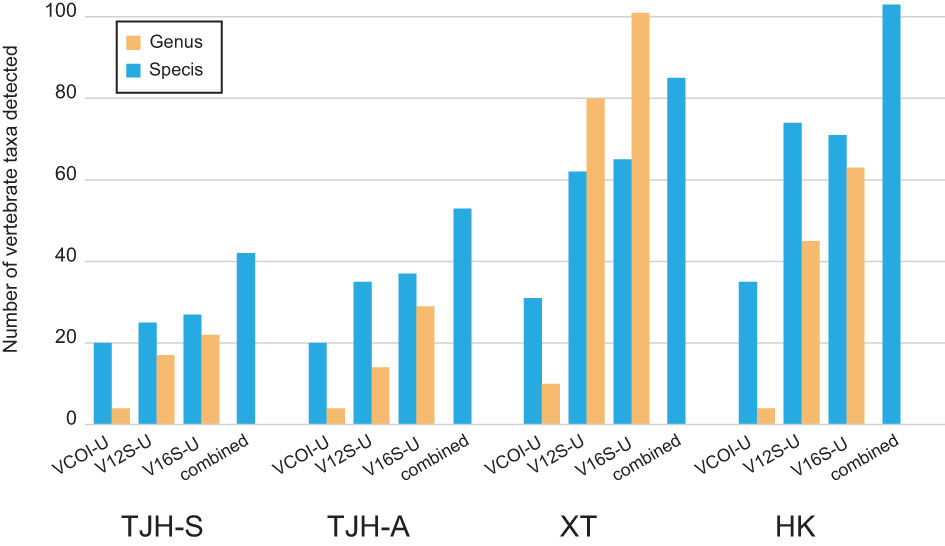
Figure 6 A comparison of detecting vertebrate diversity with eDNA metabarcoding by using a single marker or using a combination of three markers.
In the four natural eDNA tests, the mean proportion of vertebrate sequences for V12S-U, V16S-U, and VCOI-U were 37.6%, 62.8%, and 25.5%, respectively. This result is in consistence with the PrimerTree result, showing that V16S-U has the highest vertebrate specificity among the three markers. When the total number of detected species was considered, V16S-U showed the best detection performance of vertebrate species, with 130 vertebrate species detected, while V12S-U detected 121 species and VCOI-U detected 64 species. When the number of exclusive species detected was considered, V16S-U again showed the best performance, with 52 exclusive vertebrate species detected, while V12S-U detected 34 exclusive vertebrate species and VCOI-U detected 7. In summary, among the three VertU markers, V16S-U has the best overall performance on both amplification specificity and species detection, and the other two markers are good complementary in detecting the vertebrate diversity.
Discussion
In this study, our overall objective was to develop a set of vertebrate-universal eDNA metabarcoding primers that generate multiple barcode fragments for monitoring vertebrate biodiversity. With this multilocus strategy, it is possible to assess the biodiversity of different vertebrate groups in a single eDNA survey, facilitating vertebrate biodiversity monitoring with eDNAs. The reliability and efficiency of this new primer set were validated by in-silico PCR, mock DNA, zoo eDNA, and natural environmental sample tests, indicating that they are a promising tool for biodiversity assessment of vertebrates. However, during the primer design and eDNA survey process, we also realized a number of issues that may be helpful for future works. Here, we discuss these issues and provide recommendations based upon the findings of this and previous studies.
Suggestions of applying the three VertU markers
Among the three VertU markers (V12S-U, V16S-U, and VCOI-U), V16S-U showed the best performance in all of our tests. This marker could amplify 98% of vertebrate species in the in-silico PCR test, detected all target vertebrate species in the mock DNA and zoo eDNA tests, and detected the largest number of 130 vertebrate species in the natural eDNA test, showing efficient and stable performance. Both V12S-U and VCOI-U had an over 90% amplification success of vertebrates in the in-silico PCR test. However, in the mock DNA test, V12S-U was not able to detect all the 50 vertebrate species, missing all two cartilaginous fishes and two lobe-finned fishes, showing some amplification bias. VCOI-U generated thousands of off-target sequences (Table 4) in the natural eDNA test, mainly coming from bacteria and aquatic invertebrates. The overall amplification specificity to vertebrate of V12S-U and VCOI-U are about 40% and 25%, respectively, which is not high but acceptable given the sequencing cost of Illumina HiSeq. To compensate for their lower specificity, we suggest sequencing more data for these two markers in eDNA metabarcoding practice. Although V12S-U and VCOI-U had some extent of amplification bias and non-specific amplification, they could detect a bulk of vertebrate species that were missed by V16S-U from our eDNA samples, showing good complementary ability. In fact, no matter how perfectly a barcode marker has been designed, its detection success will no doubt vary greatly across highly diverse ecosystems. Therefore, in order to achieve maximum species detection success, utilizing several barcode markers together (multilocus strategy) is recommended, which is also the original intention of developing multiple barcode markers in this study.
It is also important to note that correct species-level identification is important when using multiple markers for eDNA metabarcoding. If OTU sequences cannot be assigned to species-level, the taxonomic information from different barcode markers is unable to integrate and cross-validate. This issue will greatly restrict the power of using multiple markers for eDNA metabarcoding. Our species-level assignment workflow required an OTU sequence of 97-99% similarity with the reference sequences. However, these species-level identification thresholds are somewhat empirical and address vertebrates as a whole. In order to obtain more precise species-level identification, researchers may need to choose more appropriate species-level identification thresholds separately for the three VertU markers for their target vertebrate groups. Moreover, the completeness of the reference sequence database is essential for correct species-level assignments in eDNA metabarcoding studies (Schenekar et al., 2020). Therefore, if possible, researchers should build up their custom reference database with more complete coverage of local species (Milan et al., 2020) to take full advantage of using multiple markers.
Suggestions for designing universal primers
In this study, we used 792 mitochondrial genomes, representing 792 different vertebrate families and covering about 70% known vertebrate families, as the reference sequences for primer design. To our knowledge, this effort represented the most comprehensive taxon sampling to date in designing vertebrate-universal eDNA barcode primers. This intense taxon sampling helped us to detect rare base changes at the primer sites and guided us to select a better 3’ end of the primers, which is important for both amplification specificity and sensitivity. During the primer design process, we found that the taxonomic coverage of the reference sequences was more important than the number of the reference sequences to more accurately locate the conserved primer sites and estimate the variation level of each base position in vertebrates. The variation level of each base position of the primer site estimated from the 792 family-level reference sequences was almost identical to that estimated from all the 6567 vertebrate mtDNAs (data not shown), while using 800 randomly chosen sequences (without taxonomic coverage consideration) would give some biased estimates (personal observation). Therefore, we suggest that when designing universal primers for other large biological groups such as mollusks or crustaceans in the future, it may be a good strategy to collect all available reference sequences in GenBank at family level.
Most previously designed universal eDNA primers avoided using degenerate base, perhaps to increase the amplification sensitivity and specificity. In each of our primers, we used a number of degenerate bases to match more rare base changes among vertebrates. Although when using degenerated primers, more competition between target and non-target taxa for primer annealing will occur, causing the taxa which are less represented in the eDNA pool hard to be detected (Collins et al., 2019), this issue can be partly overcome by analyzing more sequencing data given that the sequencing cost of short-read platforms is rather low. For example, based on about 4 Gb of sequencing data, our degenerate primers could detect some rare (existed but not abundant) vertebrate species from the TJH eDNA samples, such as Rhinopithecus roxellana and Lutra lutra, showing that using degenerated primers did not reduce the sensitivity of detecting less presented taxa. Using degenerate bases in the primers can make them match more species thus increase the species detection success of the markers. Since the advantages far outweigh the disadvantages, we recommend researchers not to worry about but to use degenerate bases when designing universal primers for their target organism groups. It is particularly helpful when designing universal primers for invertebrate groups because invertebrate mtDNAs are more variable than vertebrates and it is difficult to find highly conserved priming sites without nucleotide polymorphisms.
Finally, we would like to emphasize the importance of selecting appropriate 3’ ends in designing universal primers. As shown earlier, the primer locations of V12S-U and V16S-U are very close to those of the recently published MarVer1 and MarVer3 (Valsecchi et al., 2020). The differences between them lie in the 3’ ends of the primers. The MarVer1 and MarVer3 primer design gave priority to the conservativeness across vertebrates rather than sequence complexity and GC content. The 3’ end of the forward primer of MarVer1 is “CCGCG” and the 3’ end of the reverse primer of MarVer3 is “ATCCC”, both are too simple and high-GC. In contrast, the 3’ end of the forward primer of V12S-U is “YANAC” and the 3’ end of the reverse primer of V16S-U is “TGTTA”, both are more complex and low-GC. Theoretically, low complexity and high-GC at the 3’ end of primer may easily cause non-specific amplification under complex DNA environment (Nichols et al., 2018). In our tests, MarVer1 and MarVer3 produced the expected single amplification band when using the mock DNA, but produced strong non-specific bands when using zoo eDNA that contained DNAs from bacteria, algae, protist, etc. (Figure 4). In comparison, both V12S-U and V16S-U produced few non-specific amplifications when using the zoo eDNA sample (Figure 4). In eDNA metabarcoding studies, strong non-specific amplification will take up a lot of high-throughput sequencing data, greatly reducing the effective sequence data for vertebrate species thus decreasing the probability of finding low abundance species (Collins et al., 2019). Our primer comparison test highlights the importance of the selection of the 3’ end of a primer.
Monitoring vertebrate biodiversity with eDNA metabarcoding
The VertU primer sets are specially designed for monitoring the whole vertebrate biodiversity with the eDNA metabarcoding approach. It shows a satisfactory performance of detecting vertebrate biodiversity using water eDNA samples. In line with previous study (Ushio et al., 2017; Lyet et al., 2021), we found that eDNA metabarcoding with water samples could detect not only aquatic vertebrates, such as fishes and amphibians, but also many terrestrial vertebrates including mammals and birds. For example, from the water samples of the TJH area, a number of terrestrial mammals were detected such as takin (Budorcas taxicolor), Reeves’s muntjac (Muntiacus reevesi) and the golden snub-nosed monkey (Rhinopithecus roxellana), as well as some birds such as the Siberian rubythroat (Luscinia calliope). These species are known to occur in the sampling area so that their detection by eDNA should be credible. The detection of terrestrial species is not surprising because terrestrial species may occasionally access water and leave their biological traces into the stream we sampled. However, because opportunities for terrestrial species to access water are spatially and temporally stochastic, the number, type, and sampling time of water samples will all influence the eDNA metarbarcoding result of the area (Burian et al., 2021). Therefore, in order to obtain more comprehensive information of species diversity for the survey area, sampling from various water types (e.g., streams, ponds, water holes) and collecting more water samples in different seasons are highly necessary.
The “multilocus” design of VertU enhances its universality across the whole vertebrate and lowers the probability of false-negative detection of species due to amplification failure. It allows taking a “snapshot” of biodiversity for different vertebrate groups simultaneously in a single eDNA metabarcoding analysis, greatly reducing the cost for eDNA biodiversity monitoring of vertebrates, and will benefit a wider range of investigators. However, due to the broad amplification spectrum and high sensitivity of the VertU primers, cross-contaminations and false-positive detection will likely become issues and should be carefully dealt with, as discussed in previous studies (Ficetola et al., 2015; Wilson et al., 2015). In addition, besides collecting eDNA from water samples, there are many other ways to collect eDNAs nowadays, generating, for example, airborne, soil, or even blood-sucking insect eDNAs (Andersen et al., 2012; Schnell et al., 2012; Clare et al., 2021). We recommend future studies to apply the VertU primer sets with more eDNA sampling approaches to monitor vertebrate biodiversity.
Data availability statement
The datasets presented in this study can be found in online repositories. The names of the repository/repositories and accession number(s) can be found below: https://www.ncbi.nlm.nih.gov/sra, PRJNA895860.
Author contributions
PZ and DL designed and supervised the research. ZW, XL, QW, and LZ collected the eDNA samples. ZW and XL performed the experiment and analyzed the data. PZ, ZW and XL wrote the paper. All authors contributed to the article and approved the submitted version.
Funding
This work was supported by National Natural Science Foundation of China (grants No. 32071611) to PZ and National Natural Science Foundation of China (grants No. 32170449) to DL.
Acknowledgments
We thank Prof. Pengfei Fan of Sun Yat-Sen university for assistance in filed work.
Conflict of interest
The authors declare that the research was conducted in the absence of any commercial or financial relationships that could be construed as a potential conflict of interest.
Publisher’s note
All claims expressed in this article are solely those of the authors and do not necessarily represent those of their affiliated organizations, or those of the publisher, the editors and the reviewers. Any product that may be evaluated in this article, or claim that may be made by its manufacturer, is not guaranteed or endorsed by the publisher.
Supplementary material
The Supplementary Material for this article can be found online at: https://www.frontiersin.org/articles/10.3389/fevo.2023.1164206/full#supplementary-material
Supplementary Figure 1 | The study areas of this study: Tangjiahe National Nature Reserve (TJH), Xintian town (XT), and Hekou town (HK). Environmental DNA sampling maps (left side) show the rivers (blue lines) and locations of the eDNA sampling sites (black dots). The natural environment of each river is shown on the right.
Supplementary Figure 2 | The relationship between the amount of DNA input and the sequence abundances amplified by the ten primer sets. These results are summarized from the result of mock-gradient DNA. The regression curve is shown and its blue area is the 95% confidence interval.
References
Alberdi A., Aizpurua O., Gilbert M. T. P., Bohmann K. (2018). Scrutinizing key steps for reliable metabarcoding of environmental samples. Methods Ecol. Evol. 9 (1), 134–147. doi: 10.1111/2041-210X.12849
Andersen K., Bird K. L., Rasmussen M., Haile J., Breuning-Madsen H., Kjaer K. H., et al. (2012). Meta-barcoding of ‘dirt’ DNA from soil reflects vertebrate biodiversity. Mol. Ecol. 21 (8), 1966–1979. doi: 10.1111/j.1365-294X.2011.05261.x
Bohmann K., Evans A., Gilbert M. T. P., Carvalho G. R., Creer S., Knapp M., et al. (2014). Environmental DNA for wildlife biology and biodiversity monitoring. Trends Ecol. Evol. 29 (6), 358–367. doi: 10.1016/j.tree.2014.04.003
Bolger A. M., Lohse M., Usadel B. (2014). Trimmomatic: a flexible trimmer for illumina sequence data. Bioinformatics 30 (15), 2114–2120. doi: 10.1093/bioinformatics/btu170
Boyer F., Mercier C., Bonin A., Le Bras Y., Taberlet P., Coissac E. (2016). Obitools: a unix-inspired software package for DNA metabarcoding. Mol. Ecol. Resour. 16 (1), 176–182. doi: 10.1111/1755-0998.12428
Burian A., Mauvisseau Q., Bulling M., Domisch S., Qian S., Sweet M. (2021). Improving the reliability of eDNA data interpretation. Mol. Ecol. Resour. 21 (5), 1422–1433. doi: 10.1111/1755-0998.13367
Bylemans J., Gleeson D. M., Hardy C. M., Furlan E. (2018). Toward an ecoregion scale evaluation of eDNA metabarcoding primers: a case study for the freshwater fish biodiversity of the Murray-darling basin (Australia). Ecol. Evol. 8 (17), 8697–8712. doi: 10.1002/ece3.4387
Cannon M. V., Hester J., Shalkhauser A., Chan E. R., Logue K., Small S. T., et al. (2016). In silico assessment of primers for eDNA studies using PrimerTree and application to characterize the biodiversity surrounding the cuyahoga river. Sci. Rep. 6 (1), 22908. doi: 10.1038/srep22908
Cilleros K., Valentini A., Allard L., Dejean T., Etienne R., Grenouillet G., et al. (2019). Unlocking biodiversity and conservation studies in high-diversity environments using environmental DNA (eDNA): a test with guianese freshwater fishes. Mol. Ecol. Resour. 19 (1), 27–46. doi: 10.1111/1755-0998.12900
Clare E. L., Economou C. K., Faulkes C. G., Gilbert J. D., Bennett F., Drinkwater R., et al. (2021). eDNAir: proof of concept that animal DNA can be collected from air sampling. PeerJ. 9, e11030. doi: 10.7717/peerj.11030
Collins R. A., Bakker J., Wangensteen O. S., Soto A. Z., Corrigan L., Sims D. W., et al. (2019). Non-specific amplification compromises environmental DNA metabarcoding with COI. Methods Ecol. Evol. 10 (11), 1985–2001. doi: 10.1111/2041-210X.13276
Darling J. A., Mahon A. R. (2011). From molecules to management: adopting DNA-based methods for monitoring biological invasions in aquatic environments. Environ. Res. 111 (7), 978–988. doi: 10.1016/j.envres.2011.02.001
Deiner K., Bik H. M., Mächler E., Seymour M., Lacoursière Roussel A., Altermatt F., et al. (2017). Environmental DNA metabarcoding: transforming how we survey animal and plant communities. Mol. Ecol. 26 (21), 5872–5895. doi: 10.1111/mec.14350
Dejean T., Valentini A., Duparc A., Pellier-Cuit S., Pompanon F., Taberlet P., et al. (2011). Persistence of environmental DNA in freshwater ecosystems. PloS One 6 (8), e23398. doi: 10.1371/journal.pone.0023398
Epp L. S., Boessenkool S., Bellemain E. P., Haile J., Esposito A., Riaz T., et al. (2012). New environmental metabarcodes for analysing soil DNA: potential for studying past and present ecosystems. Mol. Ecol. 21 (8), 1821–1833. doi: 10.1111/j.1365-294X.2012.05537.x
Evans N. T., Olds B. P., Renshaw M. A., Turner C. R., Li Y., Jerde C. L., et al. (2016). Quantification of mesocosm fish and amphibian species diversity via environmental DNA metabarcoding. Mol. Ecol. Resour. 16 (1), 29–41. doi: 10.1111/1755-0998.12433
Ficetola G. F., Coissac E., Zundel S., Riaz T., Shehzad W., Bessière J., et al. (2010). An in silico approach for the evaluation of DNA barcodes. BMC Genomics 11 (1), 434. doi: 10.1186/1471-2164-11-434
Ficetola G. F., Pansu J., Bonin A., Coissac E., Giguet-Covex C., De Barba M., et al. (2015). Replication levels, false presences and the estimation of the presence/absence from eDNA metabarcoding data. Mol. Ecol. Resour. 15 (3), 543–556. doi: 10.1111/1755-0998.12338
Freeland J. R. (2017). The importance of molecular markers and primer design when characterizing biodiversity from environmental DNA. Genome 60 (4), 358–374. doi: 10.1139/gen-2016-0100
Geller J., Meyer C., Parker M., Hawk H. (2013). Redesign of PCR primers for mitochondrial cytochromec oxidase subunitI for marine invertebrates and application in all-taxa biotic surveys. Mol. Ecol. Resour. 13 (5), 851–861. doi: 10.1111/1755-0998.12138
Kelly R. P., Port J. A., Yamahara K. M., Crowder L. B., Hofmann G. E. (2014). Using environmental DNA to census marine fishes in a large mesocosm. PloS One 9 (1), e86175. doi: 10.1371/journal.pone.0086175
Kumar G., Reaume A. M., Farrell E., Gaither M. R. (2022). Comparing eDNA metabarcoding primers for assessing fish communities in a biodiverse estuary. PloS One 17 (6), e0266720. doi: 10.1371/journal.pone.0266720
Leray M., Yang J. Y., Meyer C. P., Mills S. C., Agudelo N., Ranwez V., et al. (2013). A new versatile primer set targeting a short fragment of the mitochondrial COI region for metabarcoding metazoan diversity: application for characterizing coral reef fish gut contents. Front. Zoology 10 (1), 34. doi: 10.1186/1742-9994-10-34
Lyet A., Pellissier L., Valentini A., Dejean T., Hehmeyer A., Naidoo R. (2021). eDNA sampled from stream networks correlates with camera trap detection rates of terrestrial mammals. Sci. Rep. 11 (1), 11362. doi: 10.1038/s41598-021-90598-5
Magoc T., Salzberg S. L. (2011). FLASH: fast length adjustment of short reads to improve genome assemblies. Bioinformatics 27 (21), 2957–2963. doi: 10.1093/bioinformatics/btr507
Meusnier I., Singer G. A. C., Landry J., Hickey D. A., Hebert P. D. N., Hajibabaei M. (2008). A universal DNA mini-barcode for biodiversity analysis. BMC Genomics 9 (1), 214. doi: 10.1186/1471-2164-9-214
Milan D. T., Mendes I. S., Damasceno J. S., Teixeira D. F., Sales N. G., Carvalho D. C. (2020). New 12S metabarcoding primers for enhanced Neotropical freshwater fish biodiversity assessment. Sci. Rep. 10 (1), 17966. doi: 10.1038/s41598-020-74902-3
Miya M., Sato Y., Fukunaga T., Sado T., Poulsen J. Y., Sato K., et al. (2015). MiFish, a set of universal PCR primers for metabarcoding environmental DNA from fishes: detection of more than 230 subtropical marine species. R. Soc. Open Sci. 2 (7), 150088. doi: 10.1098/rsos.150088
Morey K. C., Bartley T. J., Hanner R. H. (2020). Validating environmental DNA metabarcoding for marine fishes in diverse ecosystems using a public aquarium. Environ. DNA 2 (3), 330–342. doi: 10.1002/edn3.76
Nichols R. V., Vollmers C., Newsom L. A., Wang Y., Heintzman P. D., Leighton M., et al. (2018). Minimizing polymerase biases in metabarcoding. Mol. Ecol. Resour. 18, 927–939. doi: 10.1111/1755-0998.12895
Pimm S. L., Jenkins C. N., Abell R., Brooks T. M., Gittleman J. L., Joppa L. N., et al. (2014). The biodiversity of species and their rates of extinction, distribution, and protection. Science 344 (6187), 1246752. doi: 10.1126/science.1246752
Port J. A., O’Donnell J. L., Romero Maraccini O. C., Leary P. R., Litvin S. Y., Nickols K. J., et al. (2016). Assessing vertebrate biodiversity in a kelp forest ecosystem using environmentalDNA. Mol. Ecol. 25 (2), 527–541. doi: 10.1111/mec.13481
Riaz T., Shehzad W., Viari A., Pompanon F., Taberlet P., Coissac E. (2011). ecoPrimers: inference of new DNA barcode markers from whole genome sequence analysis. Nucleic Acids Res. 39 (21), e145. doi: 10.1093/nar/gkr732
Rognes T., Flouri T., Nichols B., Quince C., Mahé F. (2016). VSEARCH: a versatile open source tool for metagenomics. PeerJ 4, e2584. doi: 10.7717/peerj.2584
Saenz Agudelo P., Delrieu Trottin E., DiBattista J. D., Martínez Rincon D., Morales González S., Pontigo F., et al. (2022). Monitoring vertebrate biodiversity of a protected coastal wetland using eDNA metabarcoding. Environ. DNA. 4 (1), 77–92. doi: 10.1002/edn3.200
Schenekar T., Schletterer M., Lecaudey L. A., Weiss S. J. (2020). Reference databases, primer choice, and assay sensitivity for environmental metabarcoding: lessons learnt from a re-evaluation of an eDNA fish assessment in the Volga headwaters. River Res. Appl. 36 (7), 1004–1013. doi: 10.1002/rra.3610
Schnell I. B., Thomsen P. F., Wilkinson N., Rasmussen M., Jensen L. R., Willerslev E., et al. (2012). Screening mammal biodiversity using DNA from leeches. Curr. Biol. 22 (8), R262–R263. doi: 10.1016/j.cub.2012.10.014
Shaw J. L. A., Clarke L. J., Wedderburn S. D., Barnes T. C., Weyrich L. S., Cooper A. (2016). Comparison of environmental DNA metabarcoding and conventional fish survey methods in a river system. Biol. Conserv. 197, 131–138. doi: 10.1016/j.biocon.2016.03.010
Srivathsan A., Loh R. K., Ong E. J., Lee L., Ang Y., Kutty S. N., et al. (2022). Network analysis with either illumina or MinION reveals that detecting vertebrate species requires metabarcoding of iDNA from a diverse fly community. Mol. Ecol. 00, 1–18. doi: 10.1111/mec.16767
Stat M., John J., DiBattista J. D., Newman S. J., Bunce M., Harvey E. S. (2019). Combined use of eDNA metabarcoding and video surveillance for the assessment of fish biodiversity. Conserv. Biol. 33 (1), 196–205. doi: 10.1111/cobi.13183
Taberlet P., Bonin A., Zinger L., Coissac E. (2018). Environmental DNA for biodiversity research and monitoring (Oxford University Press). doi: 10.1093/oso/9780198767220.001.0001
Taberlet P., Coissac E., Hajibabaei M., Rieseberg L. H. (2012b). Environmental DNA. Mol. Ecol. 21, 1789–1793. doi: 10.1111/j.1365-294X.2012.05542.x
Taberlet P., Coissac E., Pompanon F., Brochmann C., Willerslev E. (2012a). Towards next-generation biodiversity assessment using DNA metabarcoding. Mol. Ecol. 21 (8), 2045–2050. doi: 10.1111/j.1365-294X.2012.05470.x
Thomsen P. F., Kielgast J., Iversen L. L., Wiuf C., Rasmussen M., Gilbert M. T. P., et al. (2012). Monitoring endangered freshwater biodiversity using environmental DNA. Mol. Ecol. 21 (11), 2565–2573. doi: 10.1111/j.1365-294X.2011.05418.x
Thomsen P. F., Willerslev E. (2015). Environmental DNA - an emerging tool in conservation for monitoring past and present biodiversity. Biol. Conserv. 183, 4–18. doi: 10.1016/j.biocon.2014.11.019
Ushio M., Fukuda H., Inoue T., Makoto K., Kishida O., Sato K., et al. (2017). Environmental DNA enables detection of terrestrial mammals from forest pond water. Mol. Ecol. Resour. 17 (6), e63–e75. doi: 10.1111/1755-0998.12690
Ushio M., Murata K., Sado T., Nishiumi I., Takeshita M., Iwasaki W., et al. (2018). Demonstration of the potential of environmental DNA as a tool for the detection of avian species. Sci. Rep. 8 (1), 4493. doi: 10.1038/s41598-018-22817-5
Valentini A., Taberlet P., Miaud C., Civade R., Herder J., Thomsen P. F., et al. (2016). Next-generation monitoring of aquatic biodiversity using environmental DNA metabarcoding. Mol. Ecol. 25 (4), 929–942. doi: 10.1111/mec.13428
Valsecchi E., Bylemans J., Goodman S. J., Lombardi R., Carr I., Castellano L., et al. (2020). Novel universal primers for metabarcoding environmental DNA surveys of marine mammals and other marine vertebrates. Environ. DNA 2 (4), 460–476. doi: 10.1002/edn3.72
Vences M., Lyra M. L., Perl R. G. B., Bletz M. C., Stanković D., Lopes C. M., et al. (2016). Freshwater vertebrate metabarcoding on illumina platforms using double-indexed primers of the mitochondrial 16S rRNA gene. Conserv. Genet. Resour. 8 (3), 323–327. doi: 10.1007/s12686-016-0550-y
West K. M., Heydenrych M., Lines R., Tucker T., Fossette S., Whiting S., et al. (2023). Development of a 16S metabarcoding assay for the environmental DNA (eDNA) detection of aquatic reptiles across northern Australia. Mar. Freshw. Res. 74, 432–440. doi: 10.1071/MF20288
Wheeler Q. D., Raven P. H., Wilson E. O. (2004). Taxonomy: impediment or expedient? Science 303 (5656), 285. doi: 10.1126/science.303.5656.285
Wilson C. C., Wozney K. M., Smith C. M. (2015). Recognizing false positives: synthetic oligonucleotide controls for environmental DNA surveillance. Methods Ecol. Evol. 7 (1), 23–29. doi: 10.1111/2041-210X.12452
WWF (2020). Living planet report 2020 - bending the curve of biodiversity loss. Eds. Almond R. E. A., Grooten M., Petersen T. (Gland, Switzerland: WWF).
Zainal Abidin D. H., Mohd Nor S. A., Lavoué S., A Rahim M., Mohammed Akib N. A. (2022). Assessing a megadiverse but poorly known community of fishes in a tropical mangrove estuary through environmental DNA (eDNA) metabarcoding. Sci. Rep. 12 (1), 16346. doi: 10.1038/s41598-022-19954-3
Zhang G. K., Chain F. J. J., Abbott C. L., Cristescu M. E. (2018). Metabarcoding using multiplexed markers increases species detection in complex zooplankton communities. Evolutionary Appl. 11 (10), 1901–1914. doi: 10.1111/eva.12694
Keywords: environmental DNA, metabarcoding, universal primer, species survey, vertebrata
Citation: Wang Z, Liu X, Liang D, Wang Q, Zhang L and Zhang P (2023) VertU: universal multilocus primer sets for eDNA metabarcoding of vertebrate diversity, evaluated by both artificial and natural cases. Front. Ecol. Evol. 11:1164206. doi: 10.3389/fevo.2023.1164206
Received: 12 February 2023; Accepted: 31 May 2023;
Published: 19 June 2023.
Edited by:
Robert Guralnick, University of Florida, United StatesReviewed by:
Nicolas Delsol, Florida Museum of Natural History, United StatesGirish Kumar, Rochester Institute of Technology, United States
Copyright © 2023 Wang, Liu, Liang, Wang, Zhang and Zhang. This is an open-access article distributed under the terms of the Creative Commons Attribution License (CC BY). The use, distribution or reproduction in other forums is permitted, provided the original author(s) and the copyright owner(s) are credited and that the original publication in this journal is cited, in accordance with accepted academic practice. No use, distribution or reproduction is permitted which does not comply with these terms.
*Correspondence: Peng Zhang, emhhbmdwMzVAbWFpbC5zeXN1LmVkdS5jbg==
†These authors have contributed equally to this work