 Xin Wang
 Zhe Zhang
 Ding Wang
95% of researchers rate our articles as excellent or good
Learn more about the work of our research integrity team to safeguard the quality of each article we publish.
Find out more
ORIGINAL RESEARCH article
Front. Ecol. Evol. , 19 June 2023
Sec. Urban Ecology
Volume 11 - 2023 | https://doi.org/10.3389/fevo.2023.1164602
This article is part of the Research Topic Evaluation of Urban Ecological Security and Measurement of Urban Ecological Resilience View all 18 articles
Introduction: The ecological conservation redline (ECR) policies conducted in China are an important innovation to protect biodiversity, safeguard ecological security, and achieve sustainable development. The Pearl River Delta (PRD) area implemented the ECR policies in 2005.
Methods: This study examines the contrast between the 15 years before and after 2005. It also reveals the ECR policies' effects by comparing land use change, landscape pattern index, and habitat quality inside (IECR) and outside (OECR) the ECR area.
Results and discussion: The results suggest that: (1) The ECR area has served as an ecological barrier in maintaining the stability of natural ecosystems. Over the past 30 years, the PRD area significantly changed land use types and ecosystems, mainly concentrated in the central plains and estuaries. Specifically, in the IECR, land use change was relatively stable, with a decrease of 0.05% and 0.57% in ecological land and an increase of 0.28% and 0.68% in construction land before and after 2005. In contrast, the OECR area land use changed dramatically, with a decrease of 0.37% and 1.36% in ecological land and an increase of 7.06% and 5.02% in construction land before and after 2005. (2) A general trend of landscape fragmentation exists in the study area. The contagion (CONTAG) in the IECR area is higher than in the OECR. The Shannon's diversity index (SHDI) in the IECR is lower than in the OECR area, which indicates a high degree and rapid landscape fragmentation in the OECR area. (3) Over 85% of the IECR scale had a habitat quality of 0.8–1, while the OECR area had an almost half scale with a habitat quality of 0–0.2. On the whole, the ecological stability and landscape connectivity of in the IECR area was higher than that of the OECR area. This indicates that the prohibitions on human disturbance, industrial construction, and logging activities in the IECR area allow green vegetation to succumb under natural conditions. Habitat quality in the IECR area was also higher than that of the OECR area in the PRD area, revealing that the quality of green development in the IECR area was higher. Finally, the ECR policies’ implementation has protected the environment in the PRD area and will provide experience for ecological conservation in other areas.
Human activities are increasingly threatening natural ecosystems, altering the efficiency of ecosystem material cycles and leading to severe habitat fragmentation (Cai et al., 2021). Since the United Nations proposed the Sustainable Development Goals (SDGs) in 2015, ecological and environmental assessment has received more attention in sustainable development. Countries worldwide are striving to promote green and sustainable development. Currently, improving spatial governance capacity and resolving the structural contradiction between territorial spatial development and conservation is urgently necessary.
The ECR policies have been widely implemented for ecological protection and management, and the prototype of ECR policies can be traced back to the “Green Belt” in the 1938, UK (Zou et al., 2015a). The thought of “redlines” led to the establishment of environmental protection and protected areas worldwide (Stahl et al., 2005), such as Europe (Margules and Pressey, 2000; Apitz et al., 2006) and the United States (Ervin, 2003). Control Zone, adopted in the Anji Ecological Plan in 2000, is an early prototype of the Ecological Conservation Redline (ECR) in China. Delineating the ECR ploicies stimulated ecosystem protection and economic development in Anji (Zhang et al., 2022). In 2005, the Pearl River Delta (PRD) area delineated the core areas of nature reserves and key water-covering areas as “redlines” for strict protection. Shenzhen proposed and applied a basic “ecological control line”. In 2007, Kunming designated areas with sensitive ecosystems or the most critical ecological functions into “Ecological line” areas. In 2017, Supported by the policy, the delineation of “Ecological Conservation Redline” was officially carried out nationwide (General Office of the Central Committee of the Communist Party of China and General Office of the State Council, 2017).
The ECR concept has been gradually developed during regional ecological planning, management, and scientific research. ECR has been affirmed in several ways and has become a national strategy. ECR area is an area that must be rigorously protected due to its important ecological functions. ECR area is also the bottom line and lifeline of national ecological security, covering areas with important ecological functions, such as resource conservation, biodiversity maintenance, soil conservation, and sand fixation. ECR area also includes sensitive and fragile areas with water loss, soil erosion, land and rock desertification, and salinization (Zou et al., 2015b). The ECR is delineated based on the scientific assessment of the relevance of ecological conservation. The delineation of ECR can be divided into three steps: identification of protection areas, approval of redline boundaries, boundary survey, and demarcation. The ECR area has three main functions: first, to protect areas with relevant ecological functions, maintain ecosystem service functions, and support sustainable socio-economic development. Second, to protect ecologically fragile and sensitive areas, mitigate and control ecological disasters, and build an ecological barrier to the human living environment. Third, to protect key species and ecosystems, maintain biodiversity, and promote the sustainable use of biological resources. Delineating ECR and implementing permanent protection is crucial to maintain national and regional ecological security, promote sustainable economic and social development, and advance the construction of ecological civilization (Zou et al., 2015a; Gao et al., 2016). How to measure the protection of ecosystems by ECR has become a significant problem (Gao et al., 2016; Gao et al., 2020; Luo et al., 2021).
Chinese scholars have been conducting extensive research on implementing ECR policies. However, research on ECR policies has mainly focused on its concept and delineation. Due to the relatively short period of ECR delineation, research on evaluating the ecological effects of its implementation is scarce. Current studies on ECR effects on ecological conservation mostly focus on qualitative analysis, and their perspectives and methods are limited (Hou et al., 2018; Wang et al., 2021; Yang and Xie, 2021; Zeng, 2021; Yue et al., 2022). Studies have been conducted to evaluate the ecological benefit, environmental impact, human disturbance activity, and ecological security patterns by constructing indicator systems, calculating ecosystem service values, landscape pattern index, and normalized difference vegetation index (NDVI) (Bailey et al., 2021; Bai et al., 2018; Chen et al., 2021; Yang and Xie, 2021; Yang and Qiao, 2023); and to assess the ecosystem value, carbon sequestration function, water conservation, soil conservation and biodiversity, and ecosystem health after ECR delineation (Jia et al., 2018; Yu et al., 2020; Nelson et al., 2009; Jiang and Wu, 2021; Zheng et al., 2022). However, studies comparing habitat changes inside and outside the ECR and before and after ECR delineation remain lacking. This study innovatively uses two perspectives from inside and outside the ECR, based on land use change, and combines the landscape pattern index and habitat quality to reveal the dynamic changes in ecosystems. Analysis of landscape patterns and habitat quality based on land use can reveal the spatial and temporal distribution of ecological conservation effects of ECR policy implementation.
The PRD region is ecologically relevant and has been at the forefront of the country in achieving coordinated economic and environmental development. And PRD area has drawn Eco–redline in 2005. Therefore, the following considerations have attracted great public attention. How has the ECR affected land use change in the PRD area since 2005? What are the spatial and temporal changes in landscape patterns and habitat quality in the PRD area? To address these questions, this study investigated three aspects: (1) the land use change data of the PRD area between 1990 and 2020 were processed, and a land use change matrix was constructed to analyze land use changes from temporal and spatial perspectives; (2) using the Fragstats model, a landscape pattern index was calculated to analyze the process of landscape fragmentation in the PRD area; (3) based on the InVEST software, we analyzed the spatial distribution and spatial changes of habitat quality (Jiao et al., 2021). This study revealed the characteristics of land use change, landscape pattern index, and habitat quality around the ECR delineation. To a certain extent, the study results will provide a reference for future ecological conservation measures in the PRD area.
The PRD area is located in the south-eastern Guangdong Province, downstream of the Pearl River, adjacent to Hong Kong and Macao, and across the sea from southeast Asia, with convenient transportation. The PRD city cluster consists of nine major cities and five new cities (Figure 1).
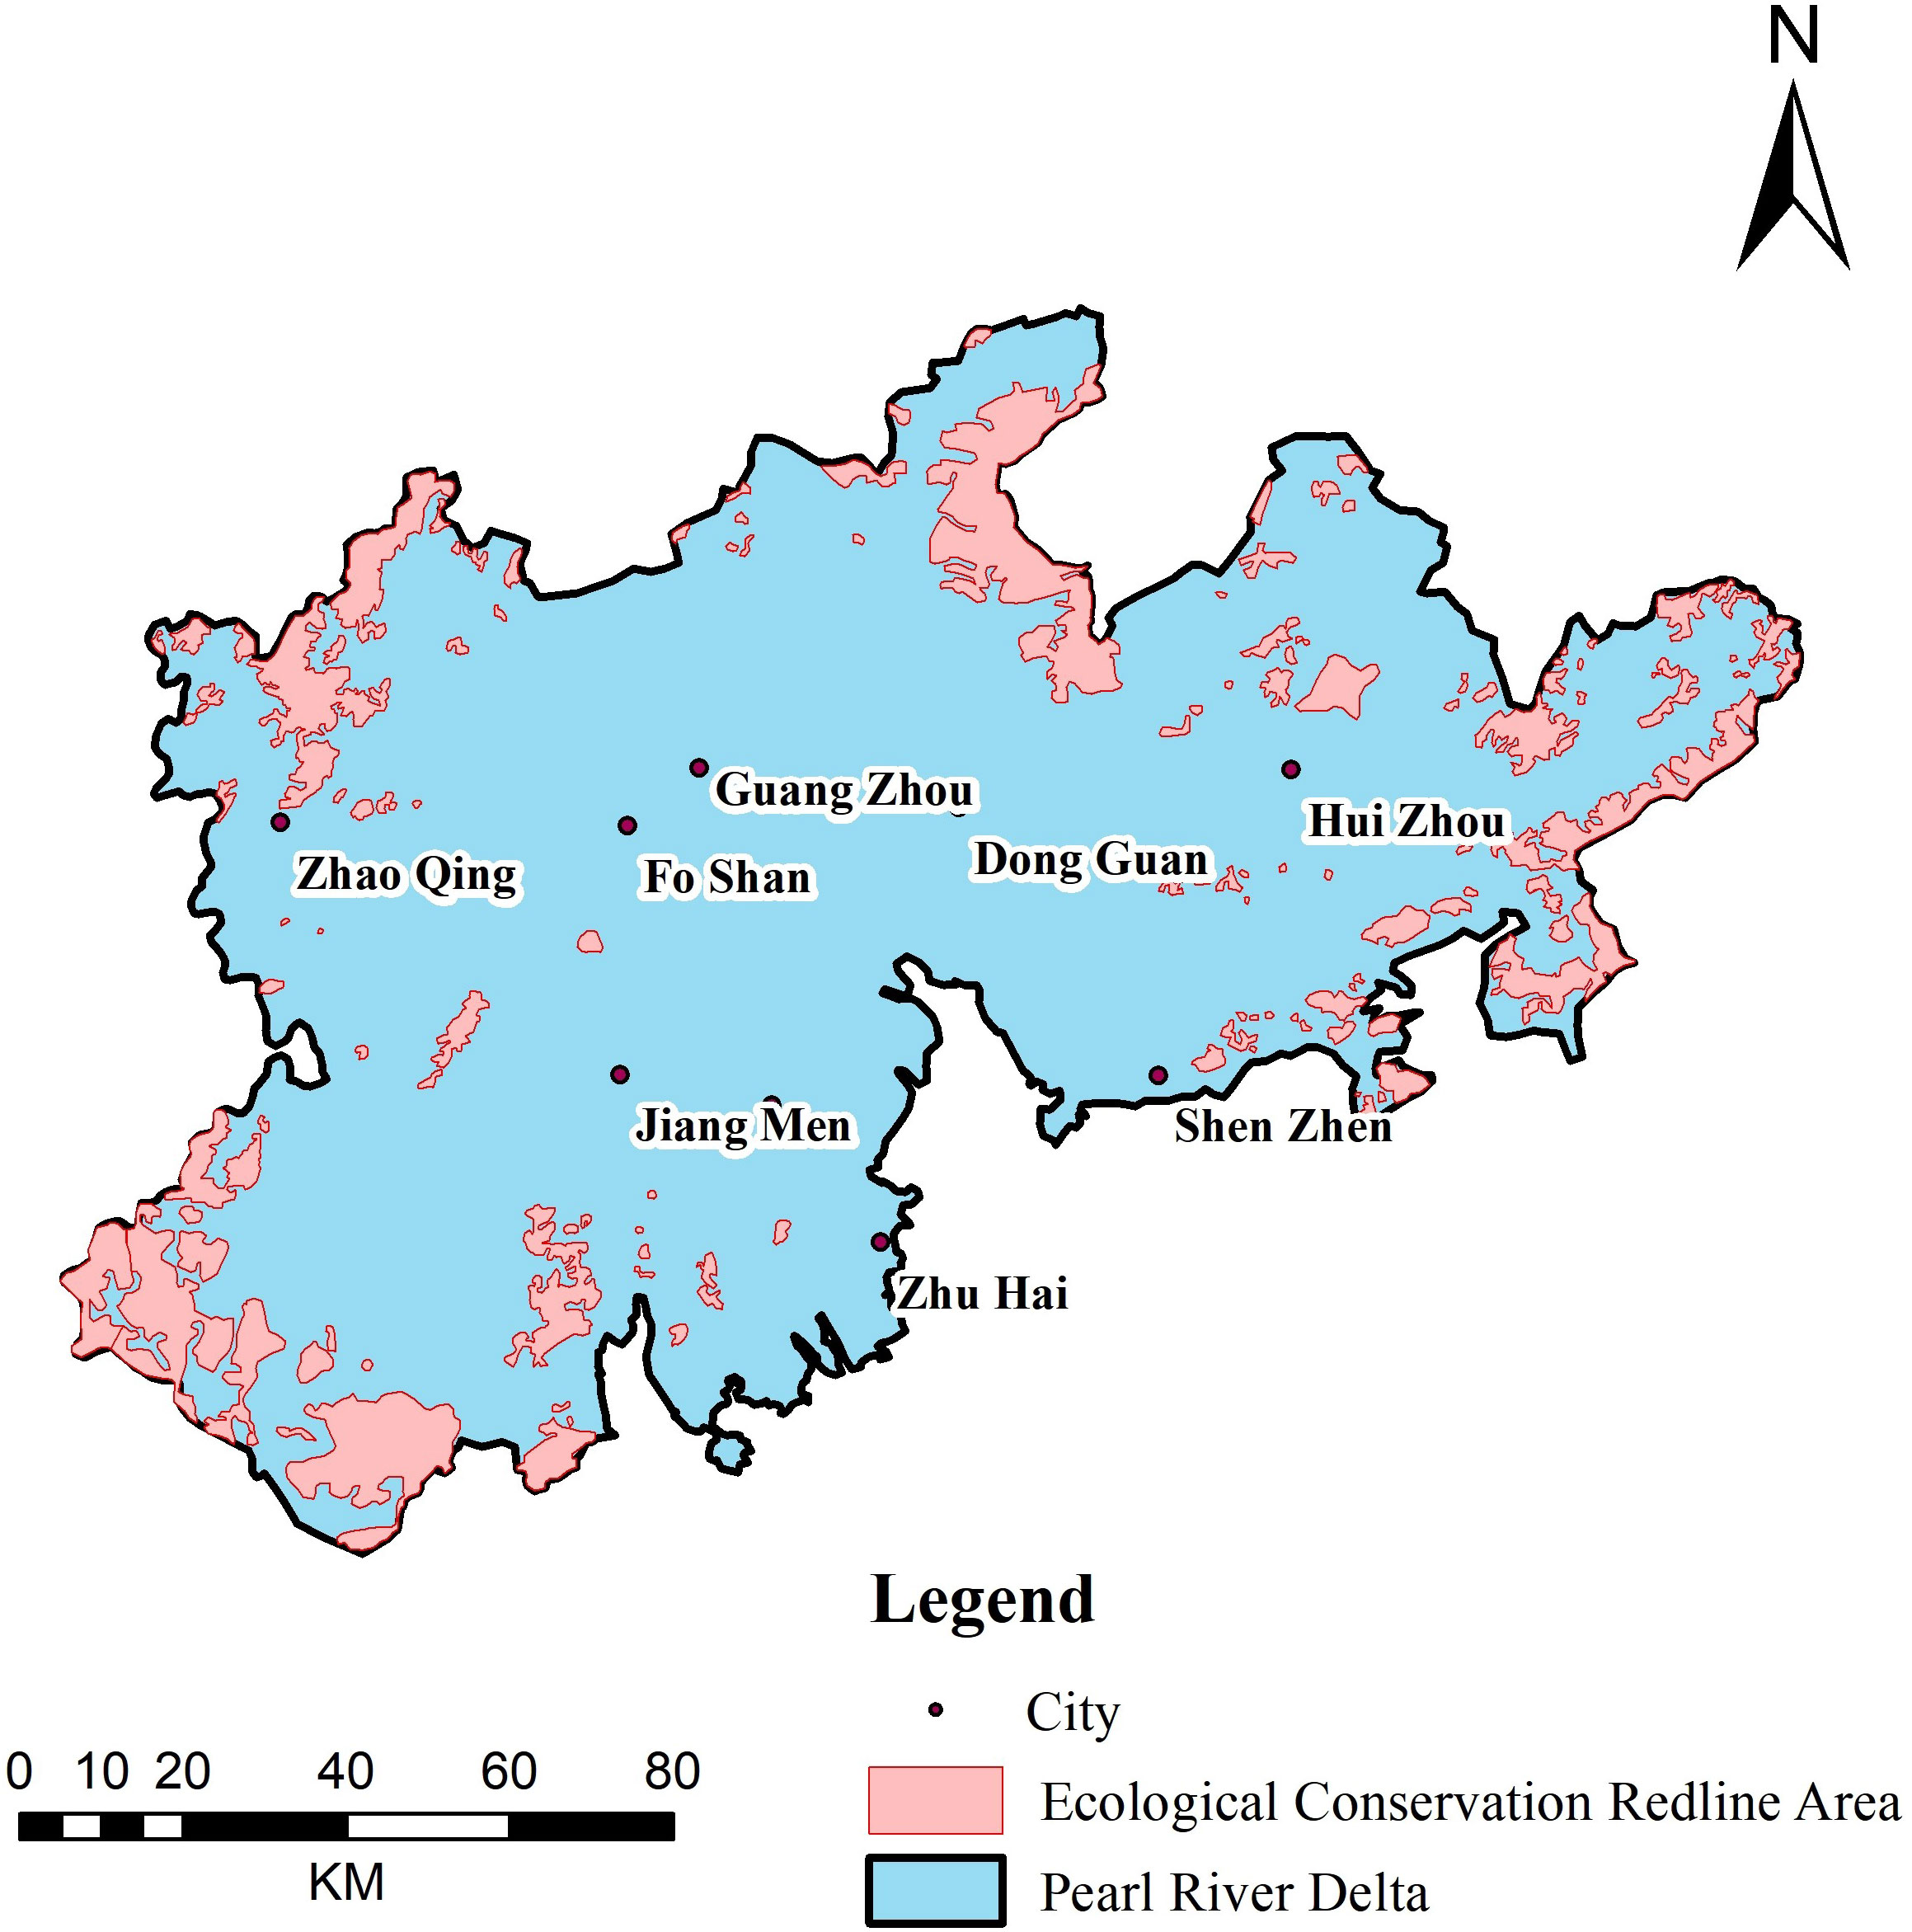
Figure 1 Distribution of ecological conservation redline (ECR) in the Pearl River Delta.
The PRD area is ecologically relevant, with excellent ports, fisheries, oil and gas, marine energy, water resources, and tourism resources such as coastal seawater and sandy beaches. The Pearl River Estuary is the main distribution area and spawning grounds for national-level protected animals and a major migration route for some fish and migratory birds.
The PRD city cluster is one of the most dynamic economic zones in the Asia-Pacific region, generating 85% of the gross domestic product (GDP) of the province with 70% of the population of Guangdong. PRD city cluster is an advanced manufacturing and service base with global influence and is the gateway for abroad. The PRD area is the main region for the participation of China in economic globalization, is a national base for developing scientific innovation and technology research, and is an important engine for national economic development.
Land use data of PRD in 1990, 1995, 2000, 2005, 2010, 2015, and 2020 at a spatial resolution of 30 m from the Resource and Environmental Science and Data Centre of the Chinese Academy of Sciences (https://www.resdc.cn/) were used. The land use and land–cover change (LUCC) consists of seven class 1 and 26 class 2 types of agricultural, forest, grassland, water, construction, and unused lands. The types of land not covered by the PRD include the permanent glacial snow in the watershed, and Gobi, saline, bare rock, and other unused lands. The amount of grassland in the PRD is relatively small and does not demonstrate significant change, so woodland and grassland are combined as ecological land and considered together.
Land use types, including geographical alignment, cropping, merging, elimination, overlaying, attribute table assignment, classification, and zoning statistics associated with the data, were performed on the ArcGIS platform. A projection coordinate system conversion, spatial resampling, and other data processing steps were performed to make the land use consistent across the years. Calculation of the landscape pattern index was carried out in Fragstats. Calculation in the InVEST habitat quality module was performed with parameters derived from existing research and scores from experts in the field. All other statistics and calculations were performed in Excel tools.
Considering the temporal dimension of ECR effectiveness, this study used the ECR areas released by the Guangdong Provincial Government in 2005, covering 12.13% of the total land area of the PRD area (People's Government of Guangdong Province, 2005).
In this study, we referenced relevant studies combined with field research and then selected the land use matrix to reflect the change in land use change. We selected the patch density (PD), percentage of landscape (PLAND), largest patch index (LPI), landscape shape index (LSI), CONTAG, and SHDI to assess the landscape fragmentation. We chose habitat quality to evaluate the development quality (Zhang et al., 2020; Hu et al., 2023).
Using ArcGIS 10.8, we calculated the land change between 1990 and 2020 in the PRD separately, with the following equation:
where Sij is the area of the land use type i converted to type j, n is the total number of land use types, and i and j are the land use types before and after the transfer, respectively.
Landscape pattern analysis is an effective tool for quantitatively characterizing landscape fragmentation (Yu et al., 2020). This study chose six typical indicators: PD, PLAND, LPI, LSI, CONTAG, and SHDI. We analyzed the spatial and temporal characteristics of landscape fragmentation in the PRD region from 1990 to 2020 at two scales: inside and outside the ECR. The calculation methods and equations are as follows:
PD is the density of patches (pcs/100 ha), which expresses the density of specific patches in the landscape and reflects the overall heterogeneity and fragmentation of the landscape and the fragmentation degree of a type.
PLAND (%) is the percentage of the patch area, which is the proportion of the total area occupied by each land type, with the largest area being the dominant landscape, thus helping us to identify the dominant landscape type in the landscape (Pang et al., 2022).
LPI (%) determines the dominant patch type in a landscape. amax (m2) refers to the area of the largest patch in a landscape or a patch type. The value of this index can determine the dominant patch type in the landscape and indirectly reflect the direction and magnitude of human activity disturbance.
where E is the total length of the boundary of all patches in the landscape, and A is the total area of the landscape. The total length of the boundary is divided by the square root of the total area of the landscape and multiplied by the square correction constant. When there is only one square patch, LSI = 1. The more irregular the shape, the larger the LSI.
pi is the percentage of the area occupied by the type i of the landscape; gik is the number of patches of type i and patches of type k adjacent to each other; m is the total number of the patch types in the landscape (0< CONTAG ≤ 100).
The CONTAG (%) indicator describes the degree of agglomeration or tendency for the different patch types to extend in the landscape. In general, the higher the CONTAG value, the higher the connectivity of the landscape and the better the connectivity of the dominant patch types in the landscape.
where A (hm2) is the total area of the landscape; NP (pcs) is the number of patches; E (m) is the total length of the boundary; gik(pcs) is the number of patches of type i and patches of type k adjacent to each other; aij(m2) is the area of the jth patch of type i in the landscape; pij is the ratio area of the patch type i to the entire landscape; and m (pcs) is the total number of patch types in the landscape. SHDI represents the heterogeneity of the landscape and is particularly sensitive to the unbalanced distribution of patch types in the landscape. The range of SHDI values was SHDI ≥ 0. When the landscape consists of only a single patch, SHDI = 0. When the SHDI increases, the number of patch types increases and each patch type is distributed more evenly in the landscape.
The habitat quality module of the InVEST model takes the habitat quality as a continuous variable by combining the sensitivity of the landscape types and the intensity of external threats in a comprehensive calculation, considering factors such as the distance of influence of stressors, spatial weights, and the degree to which the land is legally protected. When conducting the assessment, we fully considered the effects of land cover patterns and changes in land cover patterns on habitat quality (Zhao et al., 2022). In this study, the habitat quality module of the InVEST 3.12.0 software was used to calculate the habitat quality index for the study area from 1990 to 2020 and to analyze the spatial and temporal evolution patterns, calculated as follows (Pang et al., 2022):
where the Dxj is the degree of habitat degradation of raster x in habitat type j; Yris the number of rasters of the threat element; R is the number of threat sources; Wr is the weight of threat source r; ry is the stress value of raster y; βx is the accessibility of the threat element to raster x (according to its degree of legal protection) and takes the value 0–1; Sjr is the sensitivity of habitat type j to threat source r; irxy is the stress value of raster y value ry to the stress level of raster x, in two categories: linear and exponential decay:
Linear decay equation:
Exponential decay equation:
where the dxy is the linear distance between grid x and grid y, and drmax is the maximum stress distance of threat source r.
Habitat quality was calculated as:
where the Qxj is the habitat quality index of raster x in habitat type j; Hj is the habitat suitability of habitat type j (0 ≤ Hj ≤ 1); z is the normalization constant, generally taking the value of 2.5, and k is the half-saturation constant, taking half of the maximum habitat degradation, generally taking the value of 0.5.
The results of the model are a comprehensive, dimensionless index with a habitat quality interval of (0,1). The higher the value, the better the habitat quality of the corresponding area. This study presents a partitioning of the habitat quality data to visualize and compare habitat quality. We used the natural breakpoint method to classify habitat quality into lower (0–0.2), low (0.2–0.4), medium (0.4–0.6), high (0.6–0.8), and higher (0.8–1). The percentage of data for each of the seven periods was calculated.
From 1990 to 2020, the basic scale of land use in the PRD area was ecological land and then agricultural land. Ecological land was mainly located in the hills, terraces, and remnants of Kew in the east, west, and north of the PRD area. However, the agricultural land was mainly located in the plains near the estuarine delta. It is in the central part of the PRD area. The agricultural and ecological land area decreased, while the water and construction land area increased (Figure 2).
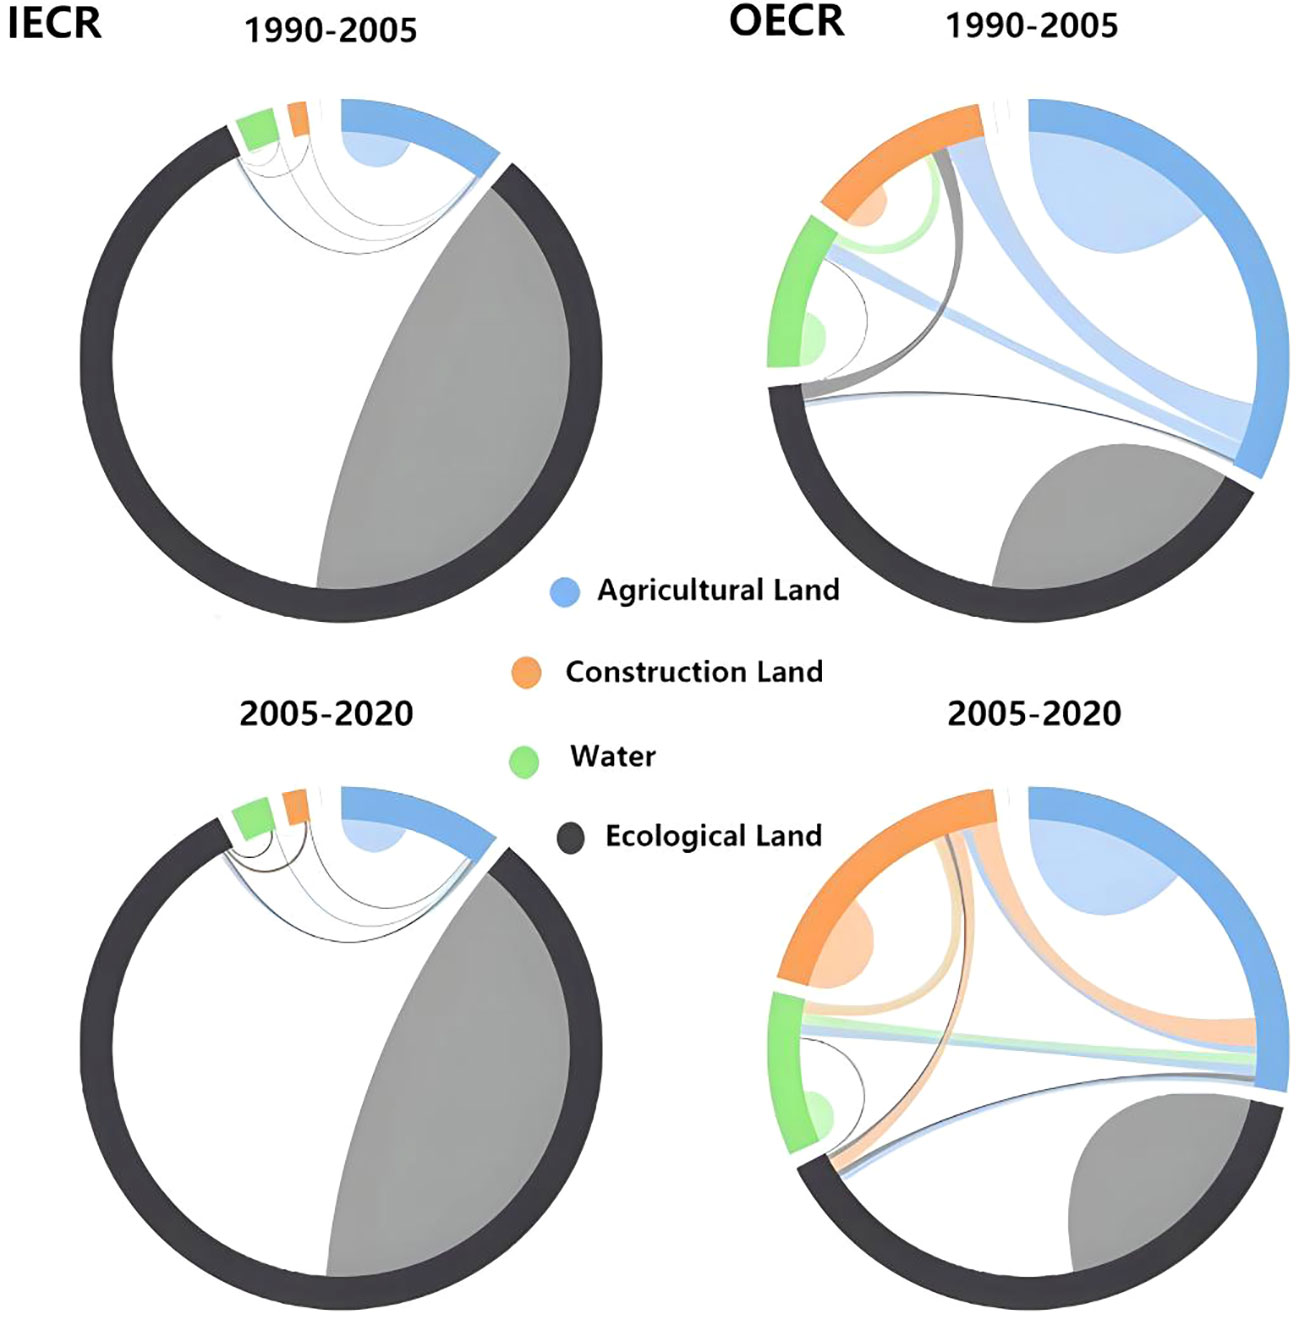
Figure 2 Schematic diagram of the land use and land-cover change (LUCC) in the Pearl River Delta region from 1990 to 2020.
Before and after the ECR delineation, the raster proportion of the construction land in the IECR increased by 0.28% and 0.68%, and in the OECR increased by 7.06% and 5.02% (Table 1). Before and after the ECR delineation, the ecological land in the IECR decreased by 0.05% and 0.057%, and in the OECR decreased by 0.37% and 1.36%. In conclusion, the ECR area has protected ecological land and resisted the expansion of the construction land.
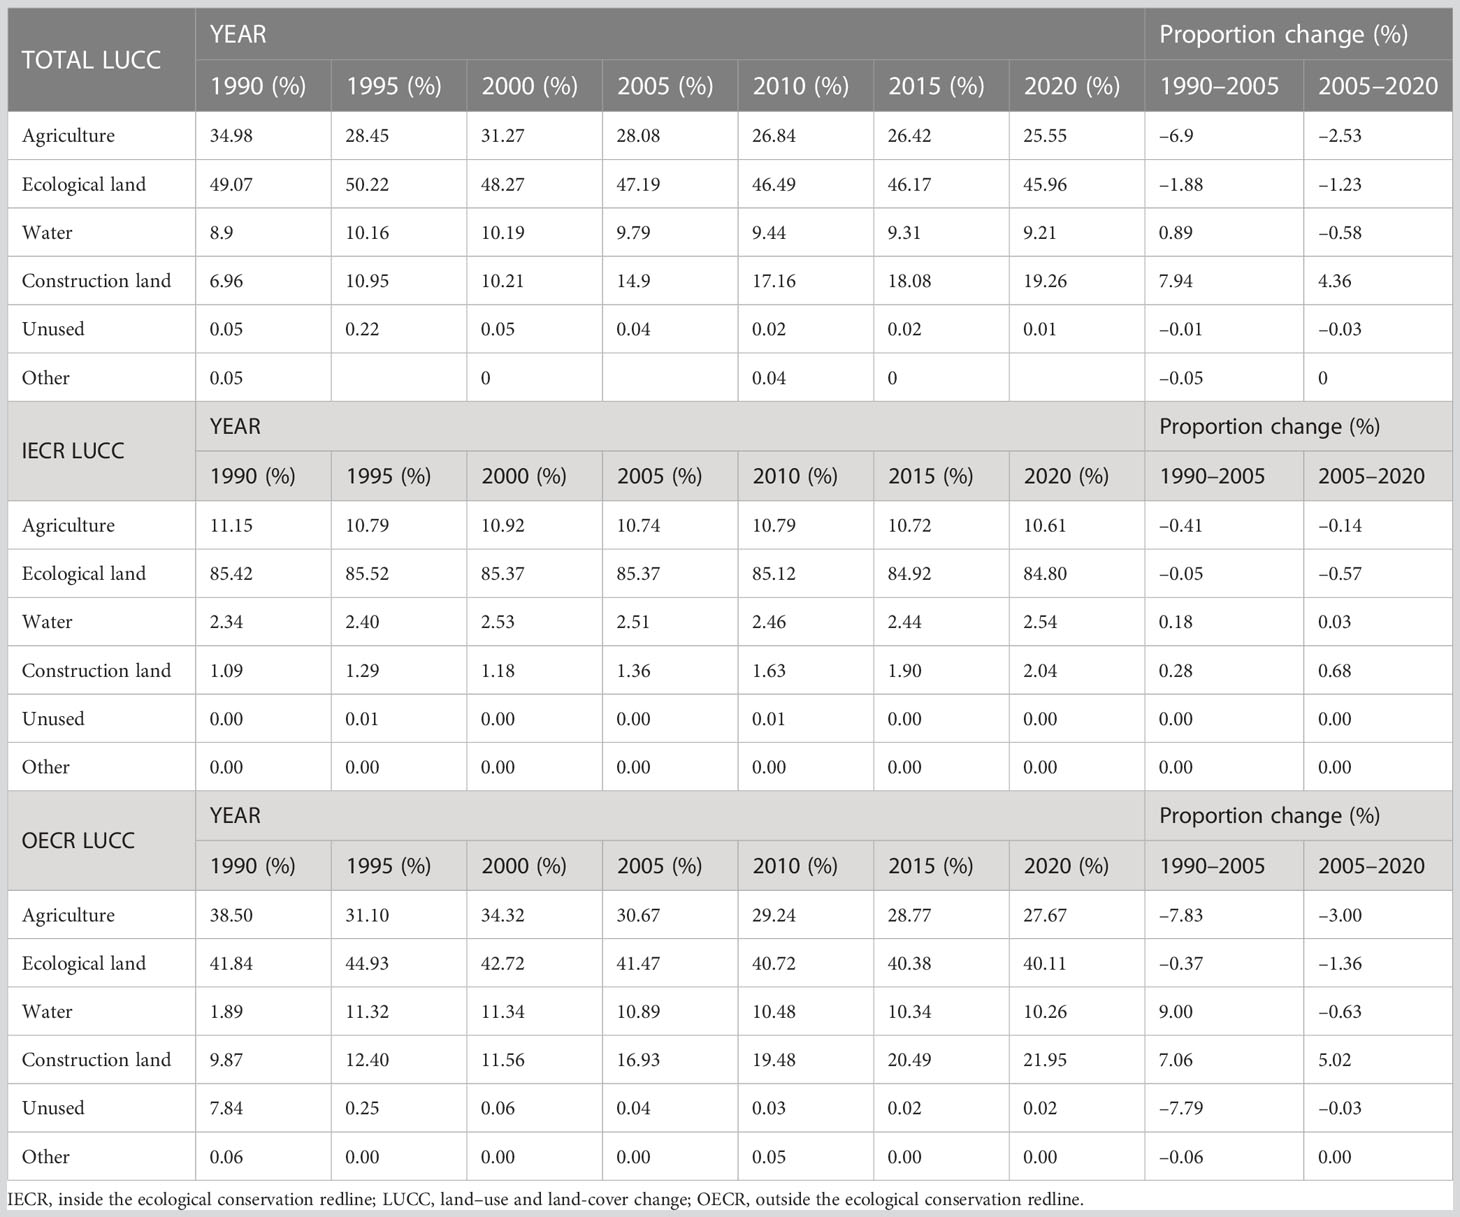
Table 1 Changes in the proportion of land use types in the Pearl River Delta from 1990 to 2020.
The landscape pattern index can represent the landscape fragmentation in the PRD region from 1990 to 2020. The impact of ECR delineation on patch, landscape fragmentation, and landscape diversity and richness was explored by analyzing the variation of the landscape pattern index. The results showed significant outcomings in PD, PLAND, LPI, and LSI during the past 30 decades.
Our results found that the PD of ecological and construction lands in the IECR remained stable despite the ECR delineation. And the construction land PD keeps decreasing (Figure 3A). No significant change in ecological and construction land PLAND in the IECR was found. After the ECR delineation, the ecological land PLAND in the OECR decreased by 1.34%. The construction land PLAND in the OECR increased by 9.1% before 2005 and 5.02% after 2005 (Figure 3B). The PLAND of ecological land in the IECR was twice as large as the PLAND of ecological land in the OECR, and the PLAND of construction land in the OECR was larger than in the IECR.
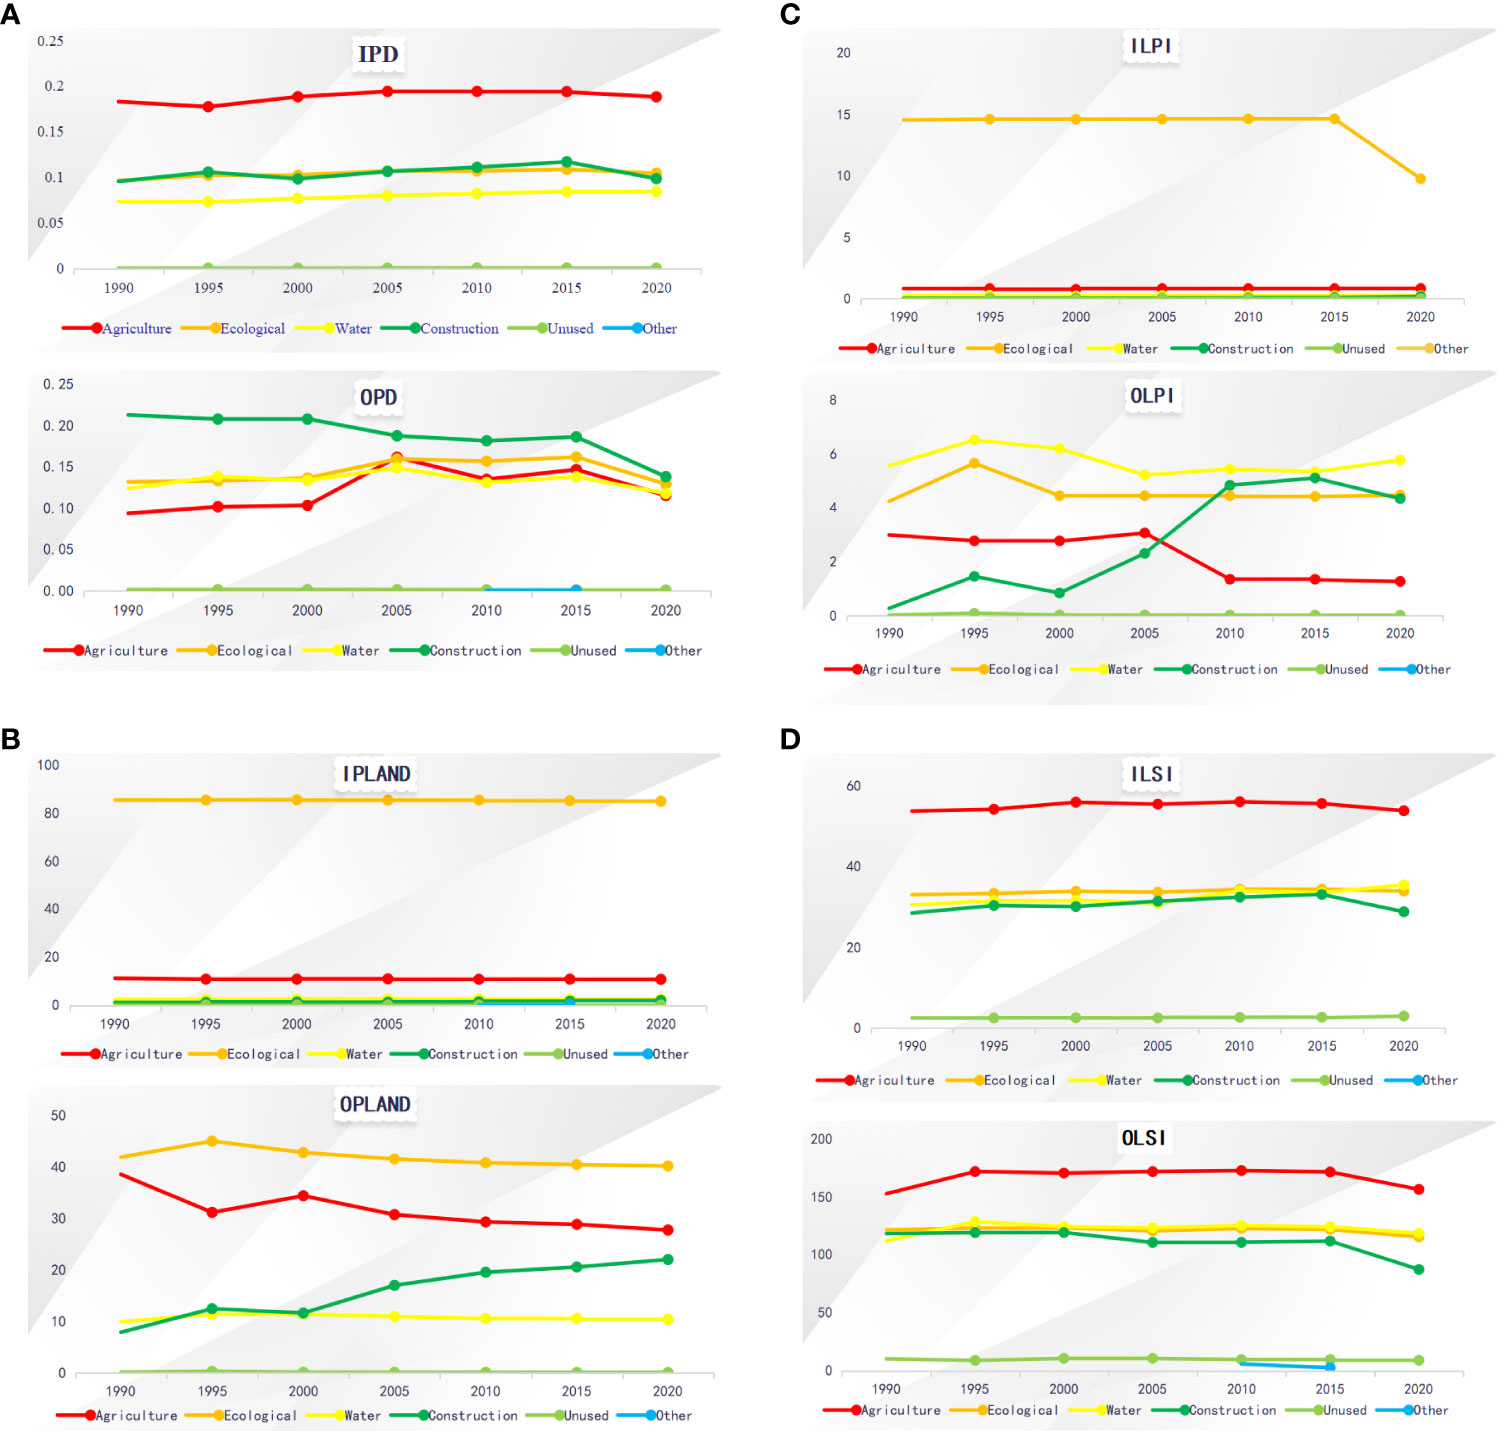
Figure 3 Landscape patch density, percentage, index, and shape index inside and outside the ecological conservation redline in the Pearl River Delta region from 1990 to 2020. (A) Landscape patch density inside (IPD) and outside (OPD) the ecological conservation redline. (B) Percentage of the landscape inside (IPLAND) and outside (OPLAND) the ecological conservation redline. (C) Largest patch index inside (ILPI) and outside (OLPI) the ecological conservation redline. (D) Landscape shape index inside (ILSI) and outside (OLSI) the ecological conservation redline.
After the ECR delineation, the LPI of the ecological land in the IECR decreased by 4.93%, whereas the LPI of the construction land remained unchanged. The LPI for ecological land in the OECR remained basically unchanged. However, the LPI of the construction land maintained a significant upward trend, rising by 2.04% and 2.04% before and after 2005(Figure 3C). The LSI in the IECR showed no significant change. The LSI of ecological and construction lands in the OECR decreased by 6.03% and 30.92%. The LSI in the OECR was three times larger than in the IECR (Figure 3D). The CONTAG of the IECR was stable, while the OECR decreased from 62.5% in 1990 to 56.1% in 2020. And the CONTAG was higher in the IECR than in the OECR (Figure 4A). The SHDI increased yearly and was higher in the OECR than in the IECR (Figure 4B).
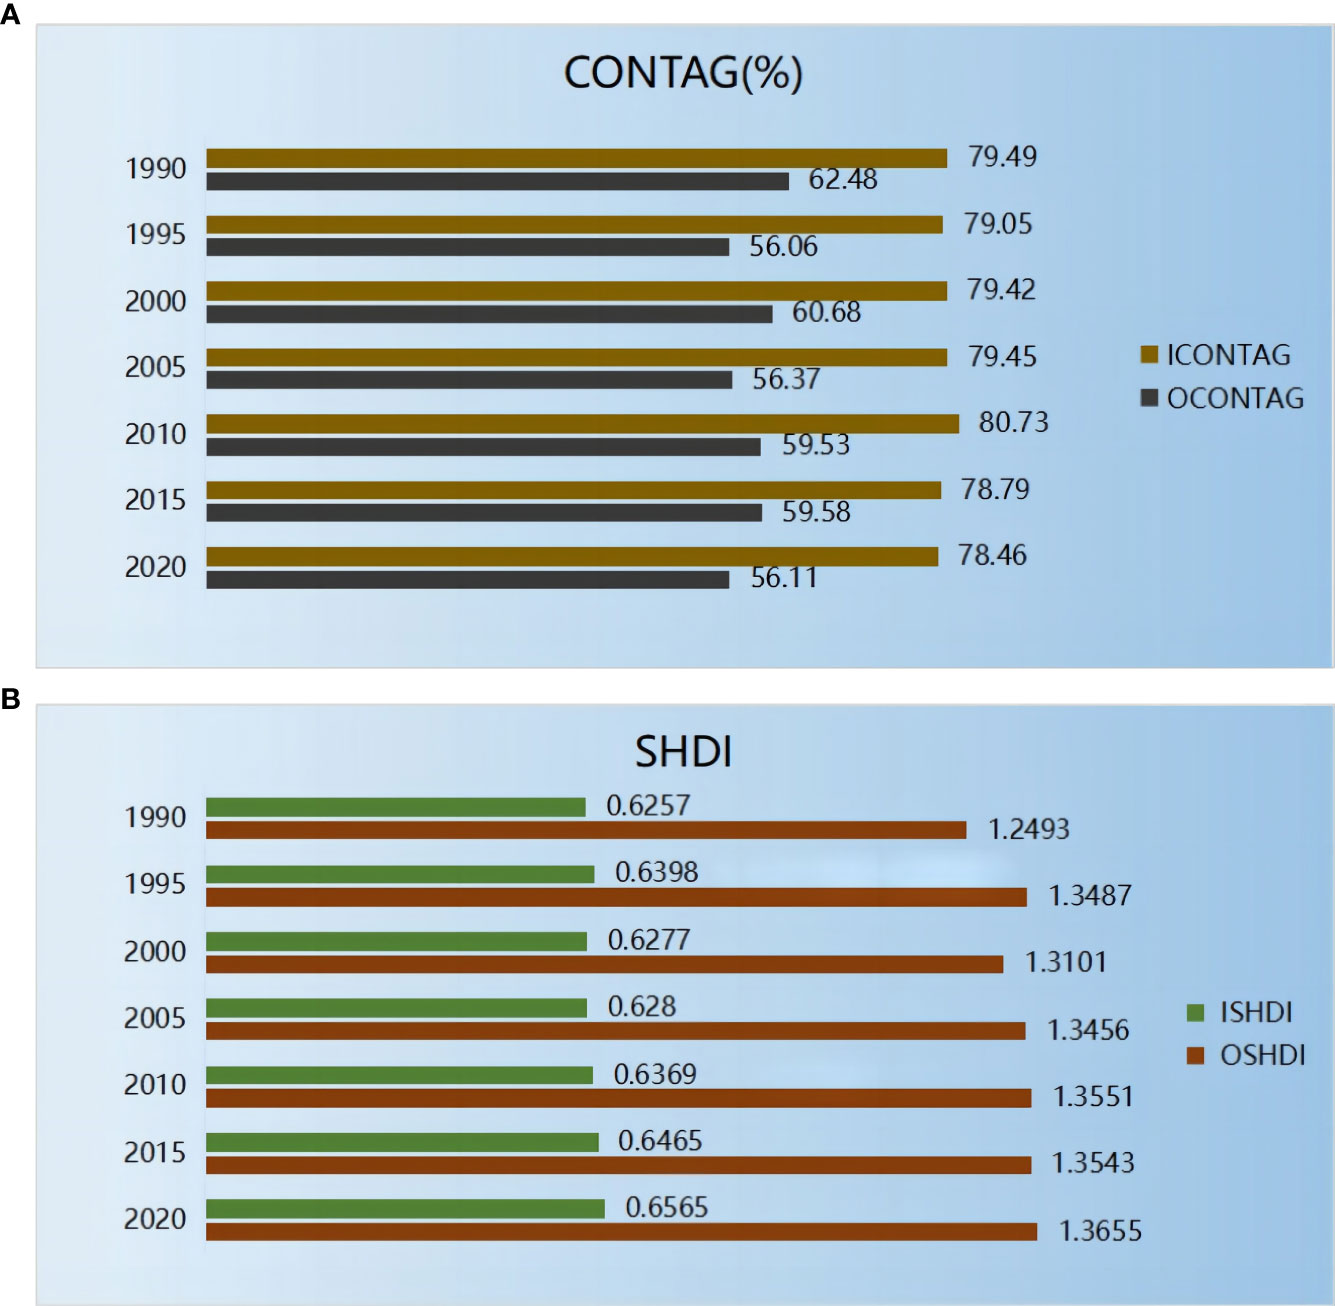
Figure 4 The contagion (CONTAG) and Shannon diversity (SHD) indexes of the landscape in the Pearl River Delta region from 1900 to 2020. (A) The CONTAG index inside (ICONTAG) and outside (OCONTAG) the ecological conservation redline. (B) Shannon diversity index inside (ISHDI) and outside (OSHDI) the ecological conservation redline.
The SHDI increased from 1.25 to 1.37 in the OECR and from 0.6257 to 0.6565 in the IECR. SHDI values in the IECR were generally smaller than in the OECR.
Habitat quality in the PRD region from 1990–2020 was polarized and generally declining, with lower and higher habitat quality occupying larger areas, respectively (Figure 5). From 1990 to 2020, the proportional changes in habitat quality at the PRD level are as follows: the proportion of the lower level of habitat quality increased by 3%, the high level increased by 1%, and the higher level decreased by 3%. In the IECR, the proportion of the higher habitat quality remained stable at 86–87%. In the OECR, the proportion of the lower habitat quality increased by 3%, and the the higher habitat quality decreased by 4%.

Figure 5 Spatial distribution of habitat quality inside and outside the ecological conservation redline of the Pearl River Delta from 1990 to 2020. (A) Distribution and proportion of habitat quality in 1990. (B) Distribution and proportion of habitat quality in the PRD in 1995. (C) Distribution and proportion of habitat quality in the PRD in 2000. (D) Distribution and proportion of habitat quality in the PRD in 2005. (E) Distribution and proportion of habitat quality in the PRD in 2010. (F) Distribution and proportion of habitat quality in the PRD in 2015. (G) Distribution and proportion of habitat quality in the PRD in 2020.
High values of habitat degradation indicate a high degree of potential damage to the habitat quality and a high probability of habitat quality degradation occurring. From 1990 to 2020, the habitat quality values of the entire PRD area lay in the interval of 0.52–0.56, with an overall middle level; and the degradation was in the 0.04–0.05 (Figure 5). The mean value of habitat quality of IECR changed little and was in the interval of 0.85–0.86, with an overall higher level, and the degradation was 0.03 (Table 2). The mean habitat quality of the OECR was located in the middle-level interval of 0.47–0.54, showing fluctuating changes, and the degradation increased by 0.01.
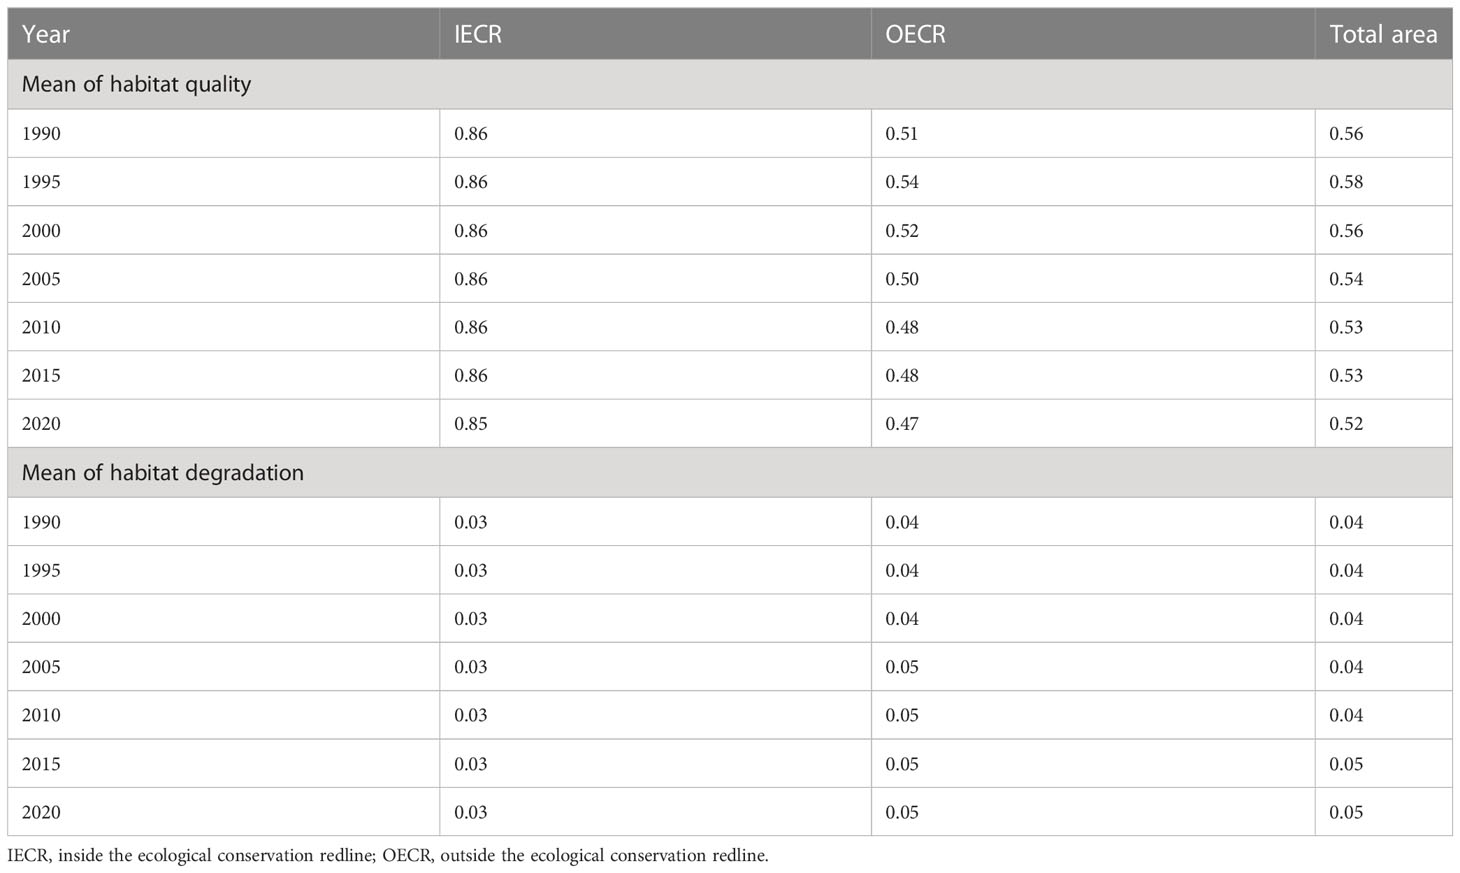
Table 2 Mean values of habitat quality and habitat degradation.
In this study, land use change, landscape pattern index, and habitat quality were chosen to assess the effects of the ECR delineation. We focused on the analysis before and after the ECR delineation in the IECR and OECR in the PRD area. In a similar study, the researcher used economic, social, and ecological data to analyze the characteristics of spatial and temporal changes in the forest landscape and habitat quality in the Guangdong-Hong Kong-Macao Greater Bay Area. They found a significant positive correlation between urban expansion and forest landscape fragmentation. In addition, the overall habitat quality in the Guangdong-Hong Kong-Macao Greater Bay Area was declining yearly, showing a distribution of low habitat quality in the center and high habitat quality in the periphery (Yu et al., 2020; Jiang and Wu, 2021; Jiao et al., 2021).
From 1990 to 2020, the land use type in the PRD was ecological land and then agricultural land. The construction and agricultural land were concentrated in the central part of the PRD area and tended to spread to the surrounding area as the economy developed. The ecological land was on the edge of the PRD area and protected by the ECR area, which was hilly and terraced. And this may prohibit human disturbances and then keep a high vegetation cover. From 1990 to 2005, a large amount of land was changed to construction land, which happened in Guangzhou, Foshan, Shenzhen, Zhongshan, and Zhuhai, probably due to the accelerated urbanization and rapid development of the manufacturing industry. This phenomenon can be driven by the reform and opening up of the region. The opening attracted many people leading to a high-intensity development and construction (Figure 2).
Within 15 years before and after ECR delineation, ecological land in the IECR decreased by 0.05% and 0.057%, and in the OECR decreased by 0.37% and 1.36%. The conversion to construction land in the IECR after the ECR delineation may be due to the construction of ecological facilities (Table 1).
From 2005 to 2020, although the area of ecological land decreased, the conversion scale from construction to ecological land in the OECR was larger than the conversed way. It reflected that the implementation of ECR policies in the later years have played a role in maintaining the ecosystem in the IECR. And this also influenced the awareness of the public for ecological protection. The local government chose a more environmentally friendly spatial layout during the economic construction, reflecting the concept of green development (Figure 2).
Significant differences between the landscape pattern index inside and outside the ECR exist. Our results showed that the maximum values of the PLAND and LPI in the IECR occurred in ecological land, and the maximum values of the PD and LSI occurred in agricultural land. The maximum values of the PLAND, PD, LPI, and LSI in the OECR belong to ecological, construction, water, and agricultural land. The PLAND value of ecological land in the IECR was twice higher than in the OECR (Figure 3B) and accounted for more than 80% of the area of all types of landscape patches in the IECR. It indicated that the woodland cover in the IECR was high and was the dominant landscape type, which is consistent with the LPI results (Figure 3C). High values of PD were found for the agricultural land in the IECR and the construction land in the OECR, indicating a high degree of fragmentation in these land types (Figure 3A). However, in the OECR, the PD of the construction land decreased, and the LPI increased significantly yearly, which indicated that with economic development, the scale of the construction land continued to expand and connect into huge patches, despite the degree of fragmentation decreased.
The maximum LSI in the OECR occurred in agricultural land, and the LSI in the OECR was several times larger than that in the IECR (Figure 3D), indicating that the landscape in the OECR was subject to high intensity of human disturbance. The CONTAG in the OECR decreased continuously (Figure 4A). In contrast, the SHDI increased continuously (Figure 4B). The three CONTAG values in 1990, 2005, and 2020 were 79.49%, 79.46%, and 78.46% in the IECR, and in the OECR, were 62.48%, 56.37%, and 56.11%. The SHDI in 1990, 2005, and 2020 were 0.6257, 0.6276, and 0.6565 in the IECR and 1.2493, 1.3456, and 1.3655 in the OECR. These results indicated that the landscape fragmentation in the OECR was high and still increasing. In contrast, the landscape in the IECR showed a certain degree of fragmentation, but the connectivity was better than that of the OECR.
We discussed the habitat quality outcomes based on land use change and landscape pattern index. It found that the lower level habitat quality was widespread in the vast plain area at the mouth of the Pearl River, spreading outwards in a radial pattern over time. It is probably due to the dense distribution of habitat threats such as energy, industry, population, and construction, which can cause high disturbance to the ecological environment. The high level habitat quality area circles the PRD area. In contrast, in the ECR area and its buffer zone, destructive human activities and industrial construction were restricted, resisting the expansion of urbanization and maintaining a relatively stable natural ecosystem. In addition, the local topography may not be suitable for intensive human development and construction activities.
Habitat quality in the PRD area was middle level, showing a distribution of a higher level of habitat quality around and a lower level of habitat quality in the central region, consistent with previous studies. The lower habitat quality was around the Pearl River Estuary and spread around. The higher habitat quality was in the surrounding hilly terrace(Figure 5). Over 85% of the IECR area had a higher level of habitat quality and a lower level of degradation. In the OECR, approximately half the scale was at a higher level, and half was at a lower level of habitat quality. The degradation was higher in the OECR (Table 2).
The mean value of the habitat quality in the IECR did not vary, and the habitat quality was at a higher level (Table 2), probably because the ECR delineation had strictly restricted destructive activities such as industrial, mining, and deforestation. Therefore, the area was less disturbed by humans and thus maintained a high vegetation cover and ecosystem stability. The habitat quality of the OECR was at a middle level with increasing degradation, probably because these areas are flat, with many towns, rural settlements, etc. The ecological environment was heavily influenced by human activities, urbanization, and economic development, making the stability of the ecosystem challenging.
Recently, the Guangdong Province has been improving the ECR delineation, which may have impacted the results of this study. The choice of parameters was a bit subjective, and the estimation method for habitat quality needs to be further optimized, as shown by the empirical findings of the InVEST model and related studies. In addition, the threat sources selected in this study mainly included surface threat sources of land use change. Moreover, the limited data availability created a lack of line threat sources such as highways and railways. Also, the impact of point threat sources, such as the construction of isolated infrastructure facilities and pollutant emissions, is lacking. Thus, it should be improved to collect point threat sources in subsequent studies. The model parameters should be optimized to obtain more accurate calculation results, thus providing a reference for the construction of regional ecological civilization and ecological security of the national territory.
In this study, the data from 1990 to 2020 were dealt with by ArcGIS, Fragstats, and InVest software, and we obtained the following conclusions:
(1) Land use in the PRD region was dominated by ecological land, followed by agricultural land, with the type of land tilted towards construction land and water, with a 12.3% rise in the construction land area, mainly in the central PRD. The emerging agricultural land was on the bank of the Pearl River Estuary, indicating that the ECR area blocked human disturbance.
(2) The PLAND, PD, LSI, and LPI showed that the ECR area had a slight fragmentation trend and that the ecological land was less disturbed by humans. Construction land in the OECR rapidly increased, indicating that the construction land area was expanding and connecting into patches. The human disturbance was more intense in the OECR than in the IECR. According to CONTAG and SHDI, the landscape connectivity in the IECR was high, with little inter-annual variability. The CONTAG within the ECR was stable, indicating that the delineation of the ECR maintains the landscape connectivity in the IECR. SHDI increased each year and was higher in the OECR than in the IECR (Figure 4B), indicating that more heterogeneous patches in the landscape and a higher degree of landscape fragmentation occurred in the OECR compared to the IECR.
(3) Habitat quality in the PRD area was generally at a middle level, showing a distribution of a higher level of habitat quality around the region and a lower level in the central. Over 85% of the area in the IECR had a higher level of habitat quality and a lower level of degradation. In the OECR, almost half was a higher level of habitat quality, and a half was a lower level. The degradation was higher in the OECR than in the IECR.
ECR has a positive effect on protecting the stability of ecosystems in the IECR, maintaining their biodiversity, slowing down landscape fragmentation, and resisting destructive human interference activities. The ECR area provides a new method for protecting the ecological function areas, ecologically fragile and sensitive areas, and prohibited development areas worldwide.
The original contributions presented in the study are included in the article/supplementary material. Further inquiries can be directed to the corresponding author.
XW and HHG contributed to conception and design of the study. XW collected the data, performed the statistical analysis, and wrote the original draft of the manuscript. All authors contributed equally to manuscript revision and approved the submitted version.
This study was founded by National Natural Science Foundation of China (41871196).
The authors declare that the research was conducted in the absence of any commercial or financial relationships that could be construed as a potential conflict of interest.
All claims expressed in this article are solely those of the authors and do not necessarily represent those of their affiliated organizations, or those of the publisher, the editors and the reviewers. Any product that may be evaluated in this article, or claim that may be made by its manufacturer, is not guaranteed or endorsed by the publisher.
Apitz S. E., Elliott M., Fountain M., Galloway T. S. (2006). European environmental management: moving to an ecosystem approach. Integr. Environ. Assess. Manage. 2, 80–85. doi: 10.1002/ieam.5630020114
Bai Y., Wong C. P., Jiang B., Hughes A. C., Wang M., Wang Q. (2018). Developing China’s ecological redline policy using ecosystem services assessments for land use planning. Nat. Commun. 9, 3034. doi: 10.1038/s41467-018-05306-1
Bailey K., Salerno J., Newton P., Bitariho R., Namusisi S., Tinkasimire R., et al. (2021). Woodlot management and livelihoods in a tropical conservation landscape. Ambio. 50, 1351–1363. doi: 10.1007/s13280-020-01484-9
Cai Z. Y., Li W. M., Cao S. X. (2021). Driving factors for coordinating urbanization with conservation of the ecological environment in China. Ambio. 50, 1269–1280. doi: 10.1007/s13280-020-01458-x
Chen D. S., Pan Y. Q., Jin X. L., Du H. Y., Li M. C., Jiang P. H. (2021). The delineation of ecological redline area for catchment sustainable management from the perspective of ecosystem services and social needs: a case study of the Xiangjiang watershed, China. Ecol. Indic. 121, 107130. doi: 10.1016/j.ecolind.2020.107130
Ervin J. (2003). Protected area assessments in perspective. BioScience. 53, 819–822. doi: 10.1641/0006-3568(2003)053[0819:PAAIP]2.0.CO;2
Gao J. X., Wang Y., Xu M. J., Zou C. X. (2016). Discussion on the relationship between the ecological protection red line and the planning and implementation of the main functional areas. Environ. Prot. 44, 9–11. doi: 10.14026/j.cnki.0253-9705.2016.21.001
Gao J. X, Wang Y., Zou C. X., Xu D. L., Lin N. F., Wang L. X. (2020). China’s ecological conservation redline: a solution for future nature conservation. Ambio 49 (9), 1519–1529. doi: 10.1007/s13280-019-01307-6
General Office of the Central Committee of the Communist Party of China, General Office of the State Council (2017). "Several opinions on delineating and strictly adhering to the ecological protection red line. Bull. State Council People's Republic China. 7, 6–9.
Hou P., Wang Q., Yang M., Li J., Zhai J., Cai M. Y., et al. (2018). China’s ecological protection redlines: evaluation framework and method of protection effect. Geogr. Res. 37, 1927–1937. doi: 10.11821/dlyj201810004
Hu C. Y., Wu W., Zhou X. X., Wang Z. J. (2023). Spatiotemporal changes in landscape patterns in karst mountainous regions based on the optimal landscape scale: a case study of guiyang city in Guizhou province, China. Ecol. Indic. 150, 110211. doi: 10.1016/j.ecolind.2023.110211
Jia Z. M., Ma B. R., Zhang J., Zeng W. H. (2018). Simulating spatial-temporal changes of land-use based on ecological redline restrictions and landscape driving factors: a case study in Beijing. Sustainability 10 (4), 1299. doi: 10.3390/su10041299
Jiang W. K., Wu J. Y. (2021). Spatiotemporal evolution of habitat quality in Guangdong-Hong Kong-Macao greater bay area based on regional GDP and population spatial distribution. Acta Ecol. Sin. 41, 1747–1757. doi: 10.5846/stxb202004050806
Jiao M. Y., Wang Y. F., Hu M. M., Xia B. C. (2021). Spatial deconstruction and differentiation analysis of early warning for ecological security in the Pearl River delta, China. Sustain. Cities Soc. 64, 102557. doi: 10.1016/j.scs.2020.102557
Luo Y. H., Wu J. S., Wang X. Y., Peng J. (2021). Using stepping-stone theory to evaluate the maintenance of landscape connectivity under China’s ecological control line policy. J. Cleaner Prod 296 (1), 126356. doi: 10.1016/j.jclepro.2021.126356
Margules C. R., Pressey R. L. (2000). Systematic conservation planning. Nature. 405, 243–253. doi: 10.1038/35012251
Nelson E., Mendoza G., Regetz J., Polasky S., Tallis H., Cameron D. R., et al. (2009). Modeling multiple ecosystem services, biodiversity conservation, commodity production, and tradeoffs at landscape scales. Front. Ecol. Environ. 7, 4–11. doi: 10.1890/080023
Pang H. X., An R., Liu Y. F. (2022). Gradient response of habitat quality to landscape pattern based on transect method in urbanization procession in wuhan. Ecol. Sci. 41, 33–43. doi: 10.14108/j.cnki.1008-8873.2022.03.004
People's Government of Guangdong Province (2005). Notice on the issuance of the outline of the Pearl River delta environmental protection plan, (2004-2020). Gazette People's Government Guangdong Province. 8, 2.
Stahl J. R.G., Guiseppi-Elie A., Bingman T. S. (2005). The U.S. Environmental Protection Agency’s examination of its risk assessment principles and practices: a brief perspective from the regulated community. Integr. Environ. Assess. Manage. 1, 86–92. doi: 10.1897/IEAM_2004a-018.1
Wang X. M., Wen Y. Y., Liu X. C., Wen D., Long Y. X., Zhao P., et al. (2021). Protection effect and vacancy of the ecological protection redline: a case study in Guangdong-Hong Kong-Macao greater bay area, China. Remote Sens 13 (24), 5171. doi: 10.3390/rs13245171
Yang L., Qiao G. H. (2023). Grassland ecological compensation, income level and policy satisfaction: an empirical analysis based on a survey of herders in ecological protection redline areas. Sustainability 15 (2), 1664. doi: 10.3390/su15021664
Yang M. H., Xie Y. (2021). Spatial pattern change and ecosystem service value dynamics of ecological and non-ecological redline areas in Nanjing, China. Int. J. Environ. Res. Public Health 18 (8), 4224. doi: 10.3390/ijerph18084224
Yu W. J., Ren T., Zhou W. Q., Li W. F. (2020). Forest fragmentation and its relationship with urban expansion in Guangdong-Hong Kong-Macao Great Bay Area, China. Acta Ecol. Sin. 40, 8474–8481.
Yue W. Z., Xia H. X., Wu T., Xiong J. H., Zhong P. Y., Chen Y. (2022). Spatiotemporal evolution of habitat quality and ecological red line assessment in Zhejiang province. Acta Ecol. Sin. 42, 6406–6417. doi: 10.5846/stxb202104010847
Zeng Y. X. (2021). Spatiotemporal analysis of ecological redline optimization effect based on CA-Markov model and landscape pattern indicators. Bull. Surv. Mapp. S2, 244–249. doi: 10.13474/j.cnki.11-2246.2021.0630
Zhang Q., Chen C. L., Wang J. Z., Yang D. Y., Zhang Y. E., Wang Z. F, et al. (2020). The spatial granularity effect, changing landscape patterns, and suitable landscape metrics in the Three Gorges reservoir area 1995–2015. Ecol. Indic. 114, 106259. doi: 10.1016/j.ecolind.2020.106259
Zhang C., Lin D. Y., Wang L. X., Hao H. G., Li Y. Y. (2022). The effects of the ecological conservation redline in China: a case study in Anji county. Int. J. Environ. Res. Public Health 19 (13), 7701. doi: 10.3390/ijerph19137701
Zhao B. X., Li S. J., Ma J., Gao Z. J., Zhang J., Cao X. F. (2022). Evaluation of habitat quality in Jilin province based on InVEST model. J. Northeast Norm. Univ. (Nat. Sci. Ed.). 54, 132–141. doi: 10.16163/j.cnki.dslkxb202110040001
Zheng J. C., Xie B. G., You X. B. (2022). Evolution of habitat quality and its influencing factors in the different terrain gradient of the Guangdong-Hong Kong-Macao greater bay area from 1980 to 2020. Econ. Geogr. 42, 41–50. doi: 10.15957/j.cnki.jjdl.2022.08.005
Zou C. X., Wang L. X., Liu J. H. (2015a). Classification and management of ecological protection redlines in China. Biodivers. Sci. 23, 716–724. doi: 10.17520/biods.2015140
Keywords: ecological conservation redline (ECR), land use change, landscape pattern index, habitat quality, Pearl River Delta (PRD) area
Citation: Wang X, Zhang Z, Hao H, Zhang C and Wang D (2023) Analysis on the effects of ecological conservation redline policies in the Pearl River Delta area, China. Front. Ecol. Evol. 11:1164602. doi: 10.3389/fevo.2023.1164602
Received: 13 February 2023; Accepted: 01 June 2023;
Published: 19 June 2023.
Edited by:
Hualin Xie, Jiangxi University of Finance and Economics, ChinaReviewed by:
Shuai Wang, Beijing Normal University, ChinaCopyright © 2023 Wang, Zhang, Hao, Zhang and Wang. This is an open-access article distributed under the terms of the Creative Commons Attribution License (CC BY). The use, distribution or reproduction in other forums is permitted, provided the original author(s) and the copyright owner(s) are credited and that the original publication in this journal is cited, in accordance with accepted academic practice. No use, distribution or reproduction is permitted which does not comply with these terms.
*Correspondence: Haiguang Hao, aGFvaGdAY3JhZXMub3JnLmNu
Disclaimer: All claims expressed in this article are solely those of the authors and do not necessarily represent those of their affiliated organizations, or those of the publisher, the editors and the reviewers. Any product that may be evaluated in this article or claim that may be made by its manufacturer is not guaranteed or endorsed by the publisher.
Research integrity at Frontiers
Learn more about the work of our research integrity team to safeguard the quality of each article we publish.