
94% of researchers rate our articles as excellent or good
Learn more about the work of our research integrity team to safeguard the quality of each article we publish.
Find out more
ORIGINAL RESEARCH article
Front. Ecol. Evol., 09 August 2023
Sec. Behavioral and Evolutionary Ecology
Volume 11 - 2023 | https://doi.org/10.3389/fevo.2023.1163922
This article is part of the Research TopicAquatic Insect Ecology in a Changing WorldView all 6 articles
Despite the importance of caddisflies in aquatic ecosystems, few studies have assessed the most important variables affecting their species richness throughout a large region or attempted to model such richness throughout the region. We sampled nearly 500,000 adult caddisfly specimens representing 18,288 species occurrences and 282 total species using ultraviolet light traps from nearly 800 streams of varying size and condition throughout the northcentral US, an area of about 1.3 million km2. We tested 18 candidate variables reflecting natural habitat conditions, anthropogenic disturbance, and weather differences for their ability to account for variation in the caddisfly species richness of our samples. Multiple linear regression, including significance testing and ranking by Akaike Information Criterion importance values, determined a best model including eight variables. Caddisfly species richness increased with percentage of intact natural upstream habitat, elevation, dew point, longitude, depth of soil organic matter, and distance of soil to bedrock, and decreased with the percentage of non-native plants and total runoff value. The percentage of intact upstream habitat alone accounted for >40% of the variation in caddisfly species richness. After correcting for dew point to equalize weather conditions, our 7-variable model predicted that, on average, a 50% loss of intact upstream habitat would cause a 30% decrease in caddisfly species richness relative to undisturbed conditions, a 75% loss would cause a 55% decrease, and a near total loss would cause a 75% decrease. Applying our model to the 760,047 stream segments of our study area estimated that, in the absence of disturbance, nearly 90% of stream segments were predicted to contain 31–40 caddisfly species. Based on calculated disturbance levels, however, only 15% of stream segments had maintained at least 90% of that richness, whereas 58% had lost at least half. Species extirpations were generally lowest in the northern forested portion of our study area and, except for some relatively small protected areas, higher in the southern agricultural portion. Overall, our data indicated a tremendous number of site-level extirpations over a large area owing principally to watershed-level habitat disturbance. Such losses probably occur in other aquatic insect taxa throughout much of the United States and elsewhere.
Several recent high-profile studies have documented an alarming decline of insect taxonomic richness and specimen abundance, with climate change and habitat loss frequently driving these declines (Hallmann et al., 2017; Lister and Garcia, 2018; Sánchez-Bayo and Wyckhuys, 2019; Uhler et al., 2021). Aquatic insects have similarly appeared to suffer declines in species richness as well as changes to their community ecology (DeWalt et al., 2005; Bojková et al., 2012; Baranov et al., 2020; Stepanian et al., 2020; van Klink et al., 2020; Greenop et al., 2021; Houghton and DeWalt, 2021). Two challenges faced by nearly all of these studies are an absence of historical data and the frequent covariance between anthropogenic disturbance and natural variables such as latitude, climate, or habitat type (Didham et al., 2020; Uhler et al., 2021). Even in the absence of anthropogenic disturbance, determining the specific variables affecting aquatic insect species richness is difficult, as large-scale spatial variables such as latitude, elevation, and precipitation ultimately cause site-specific changes in flow permanence, stream temperature, dissolved oxygen, current velocity, and benthic substrate, all of which can affect insect assemblages (Kobayashi et al., 2013; Piliére et al., 2014; Dodds et al., 2015; Datry et al., 2016; Karaouzas et al., 2019; Patrick et al., 2019; Zhang et al., 2019; Brasil et al., 2020).
The caddisflies (Trichoptera) are an important taxon for studying the correspondence between environmental conditions and species richness due to their abundance, ecological diversity, and differing responses to various anthropogenic disturbances (Barbour et al., 1999; Dohet, 2002; Morse et al., 2019). Sampling the winged adult stage is particularly useful, since most specimens are identifiable to the species level and are attracted to ultraviolet lights representatively, regardless of their functional feeding group or specific natal microhabitat (Houghton, 2004; Wright et al., 2013; Brakel et al., 2015). Despite their importance, only a few studies have assessed caddisfly assemblages on a landscape level (Moulton and Stewart, 1996; Houghton, 2004; Blinn and Ruiter, 2013; Houghton and DeWalt, 2021), and all were focused on differences between species assemblages or functional diversity, not differences in species richness specifically. Houghton and Holzenthal (2010) documented a decline in caddisfly species richness between 1950 and 1985 within portions of the US state of Minnesota and, in the absence of clear historical environmental data, proposed that the increase in agriculture in the intervening years was the cause of this decline.
To date, no study has rigorously assessed a large suite of natural and anthropogenic variables simultaneously for their effects on caddisfly species richness over a large area. Moreover, no study has attempted to develop predictive models of caddisfly species richness based on the determined important drivers of such richness. Such a study, over a large geographic area that would include many combinations of variables, may be able to disentangle the covariance between natural and anthropogenic variables, and determine which variables are actually affecting species richness. Thus, the objectives of this study were to: produce a model of caddisfly species richness throughout a large geographic region based on a comprehensive set of environmental variables, and to use this model to predict species richness in streams throughout this same large region.
We sampled caddisfly species in streams of the northcentral region of the United States, an area approximating the Upper Midwest and Temperate Plains ecoregions of North America (Omernik and Griffith, 2014), from 37–49° north latitude and 80–98° west longitude, and encompassing 1.3 million km2 (Figure 1). Sampling began in 1999, finished in 2022, and included 770 samples of streams (Table 1). Larger rivers such as the Mississippi were sometimes sampled at multiple locations and several sites were sampled on multiple occasions. Our primary goal in choosing sampling sites was to cover as much area as possible and with a consistent effort. We did not sample in Canada since most of our tested environmental variables were not readily available there.
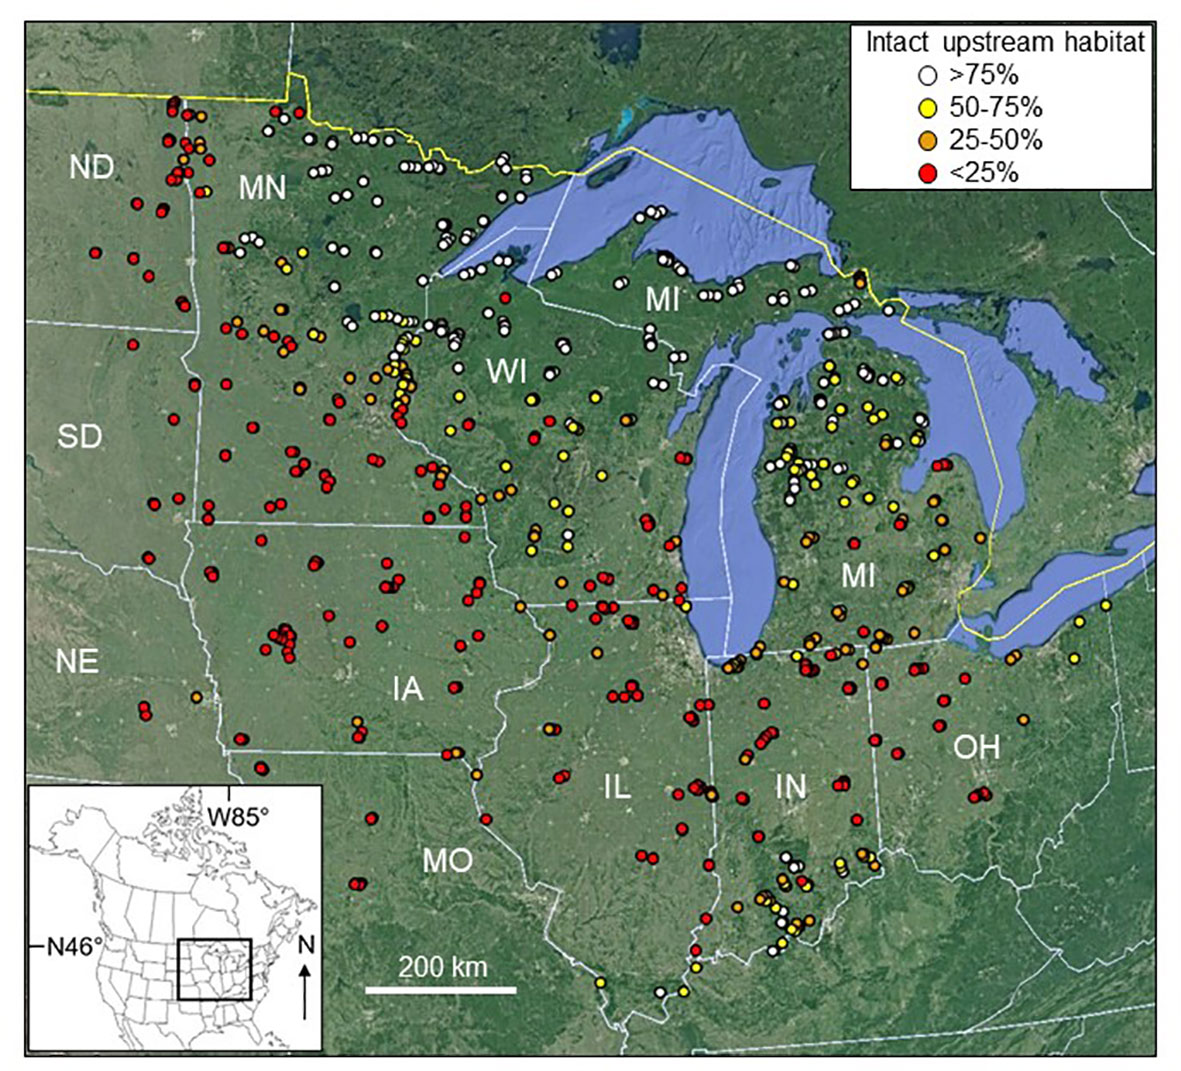
Figure 1 The 770 samples collected during this study, showing the percentage of intact upstream habitat for each. Substantial marker overlap occurs at this level of resolution. IA, Iowa; IL, Illinois; IN, Indiana; MI, Michigan; MN, Minnesota; MO, Missouri; ND, North Dakota; NE, Nebraska; OH, Ohio; SD, South Dakota; WI, Wisconsin. Base map © Google, NOAA.
Sampling occurred based in part on annual (starting 01 January of each year) accumulated degree-days (ADD), and ranged from late May in southern Indiana to early August in northern Michigan, Minnesota, and Wisconsin. Over 95% of samples were collected during June and July (Houghton, 2018). Almost 80% of samples were taken within 1 standard deviation of the mean ADD value for the 770 samples. The outliers were nearly all from northern Michigan, Minnesota, and Wisconsin, since ADDs in those regions do not reach the values of the southern portion of our study area until mid- to late August, well after the observed peak flight period (Houghton and DeWalt, 2021). Thus, samples from these regions had lower ADD values.
Adults were sampled using an ultraviolet light trap, which consisted of an 8-W portable ultraviolet light placed over a white pan filled with 80% EtOH. Traps were placed adjacent to aquatic habitats at dusk and retrieved approximately 2 h later (Houghton, 2004; Wright et al., 2013; Brakel et al., 2015). Samples were collected only if the peak daytime temperature was >25°C, dusk temperature was >15°C, and there was no noticeable wind or precipitation at dusk (Houghton, 2004). All specimens within a sample were identified and counted, except for some female specimens of the Hydroptilidae, which do not have the necessary characteristics for species-level identification. Since both male and female aquatic insects collected with an ultraviolet light trap placed within 40 m of a habitat accurately reflect the assemblage of that habitat (Sode and Wiberg-Larson, 1993; Peterson et al., 1999; Sommerhäuser et al., 1999; Brakel et al., 2015; Pereira et al., 2020), dispersals of adults between sites, while certainly possible, were considered unimportant. Specimens were identified to the species level using Houghton's (2012) treatment of the Minnesota fauna, or with various taxon-specific treatments as needed. Specimen and environmental data were databased using BIOTA software (Colwell, 1996). Almost all voucher specimens reside in the Hillsdale College Insect Collection (HCIC), the Illinois Natural History Survey (INHS), and the University of Minnesota Insect Museum (UMSP).
We tested 16 locality variables for their ability to predict caddisfly species richness (Table 2). The specific variables were chosen since they represented a breadth of natural and anthropogenic landscape and site conditions, generally exhibited low covariance with each other (Table 3), and were all available from the US EPA StreamCat database (https://www.epa.gov/national-aquatic-resource-surveys/streamcat-dataset) (Hill et al., 2016), thus allowing easy extrapolation of our generated models to larger data sets. Further, seven of our variables (Base, Order, Plants, Rip, Run, Shed, Temp) were previously selected from a total set of 52 candidates as the most important in affecting caddisfly taxonomic assemblages and functional feeding group biomass in the northcentral US (Houghton and DeWalt, 2021). We began with a core set of those seven variables and added nine others to encompass further aspects of stream conditions. To access the StreamCat database, the WATERSKMZ kml file (https://www.epa.gov/waterdata) was downloaded into Google Earth (GE). This interface allowed access to the specific data of each stream segment that we sampled. For land cover (Rip, Shed), all samples taken before 2011 used the 2006 data set, and samples during and after 2011 used the 2011 data set. We also included two collection variables (Dew, Moon) to assess weather and lunar variation on specific sampling nights (Table 2).
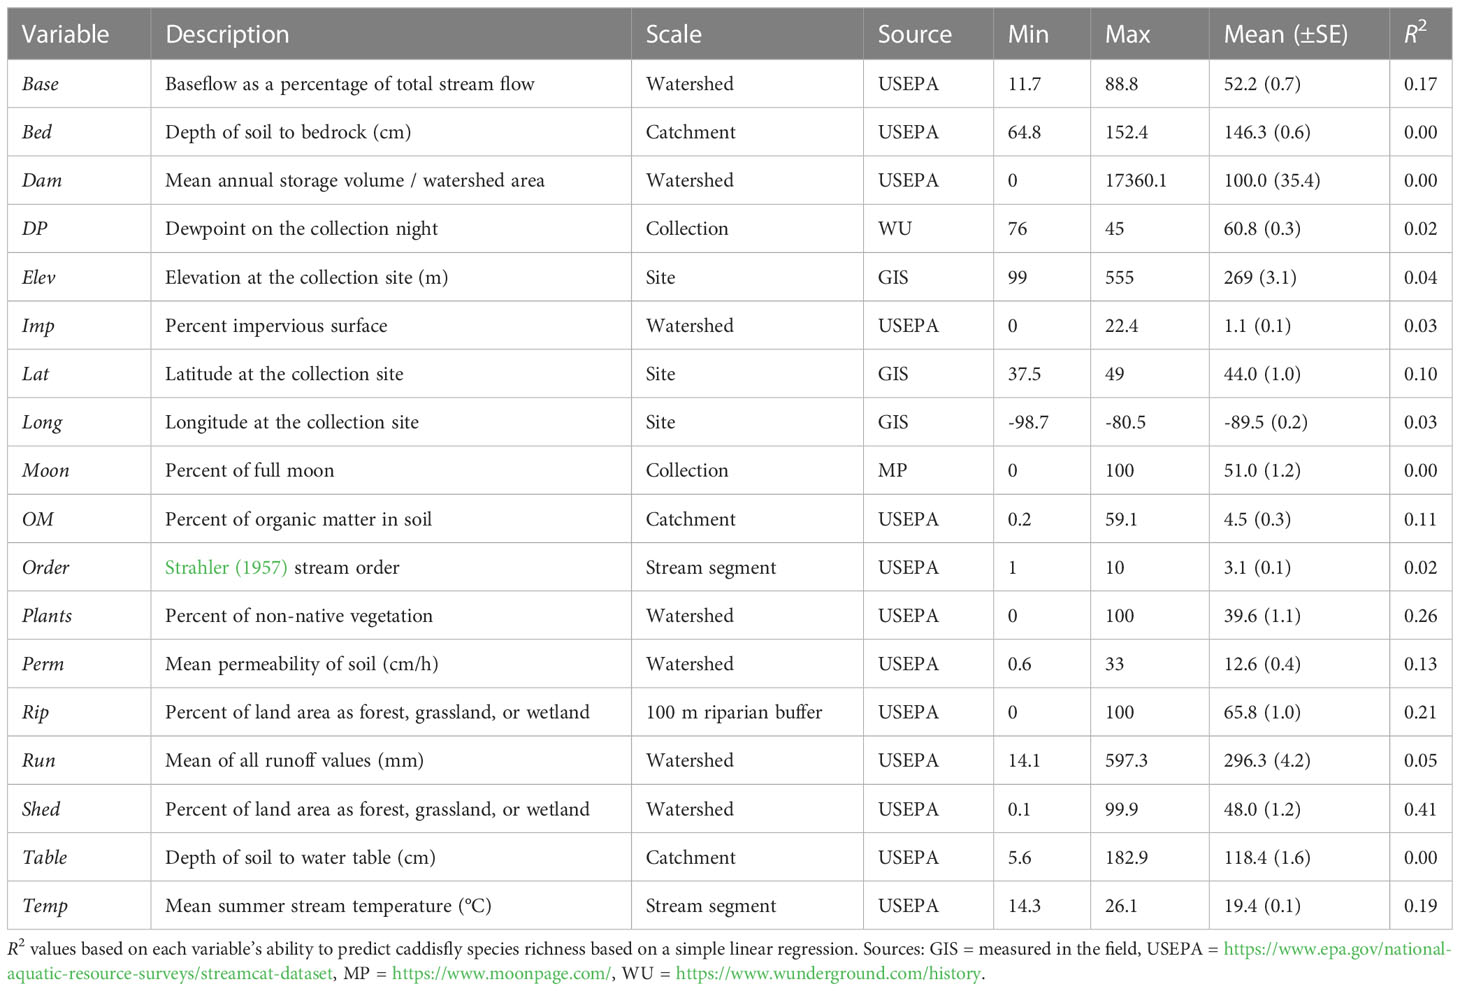
Table 2 The 18 variables used to predict caddisfly species richness in this study, along with their minimum, maximum and mean ( ± SE) values.
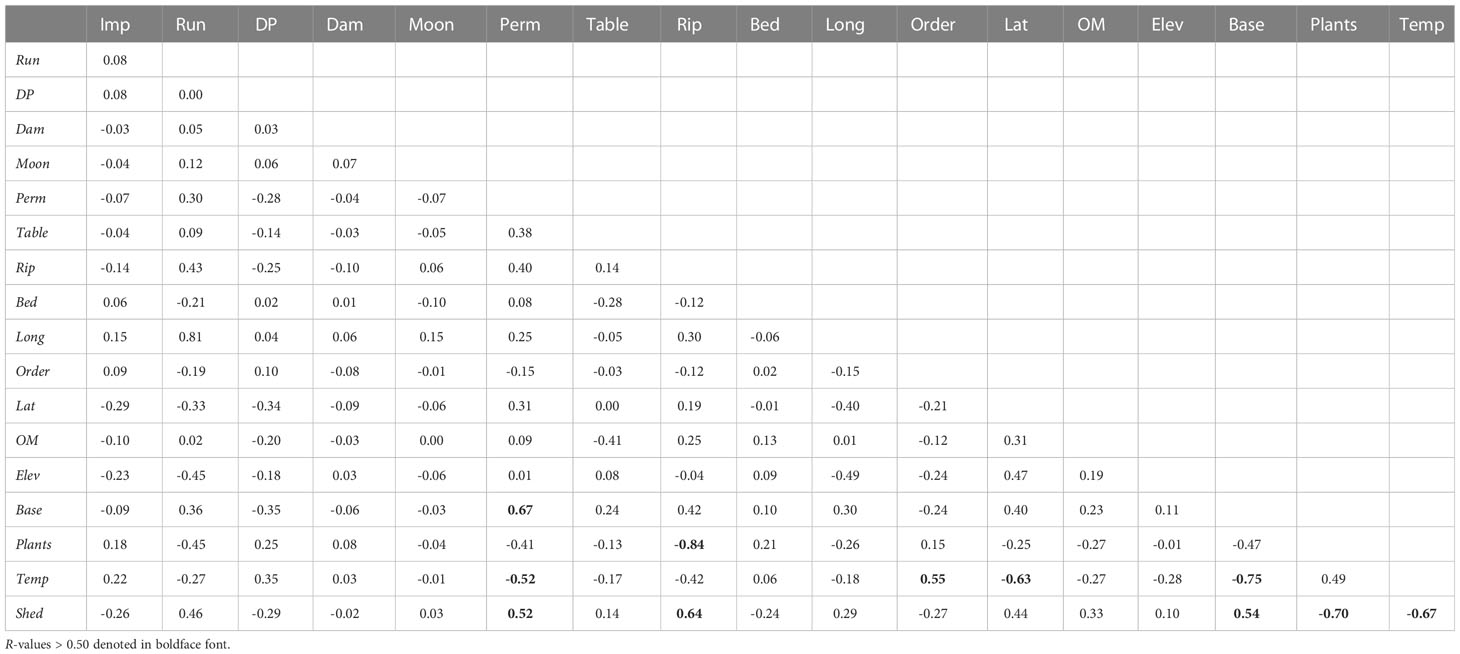
Table 3 Pearson product-moment correlation (R) coefficients between all combinations of the 18 variables in our study.
Potential models of caddisfly species richness were assessed with two complementary aspects of multiple linear regression using R studio version 2022.12.0 + 353 (RStudio Team, 2022). First, all possible models were calculated using the dredge function of the package MuMln (Barton, 2015). An F-test determined the significance of the overall model, and t-tests determined the significance of individual variables to the overall model. Calculated models were also ranked by Akaike Information Criterion corrected for small sample size (AICc) scores and weights. In the case of many models with similar scores and weights, relative importance values of the 18 variables were determined by calculating the combined weights of all models containing a particular variable (South et al., 2019). Congruence between significant variables and those with high AICc importance values indicated the variables to include in the final model. The 18 variables were also evaluated individually for their prediction of caddisfly species richness with simple linear regression using Excel for Windows with the Real Statistics add-in (www.real-statistics.com). We did not model the species richness of individual families due to large discrepancies in the species occurrences between them (Figure 2).
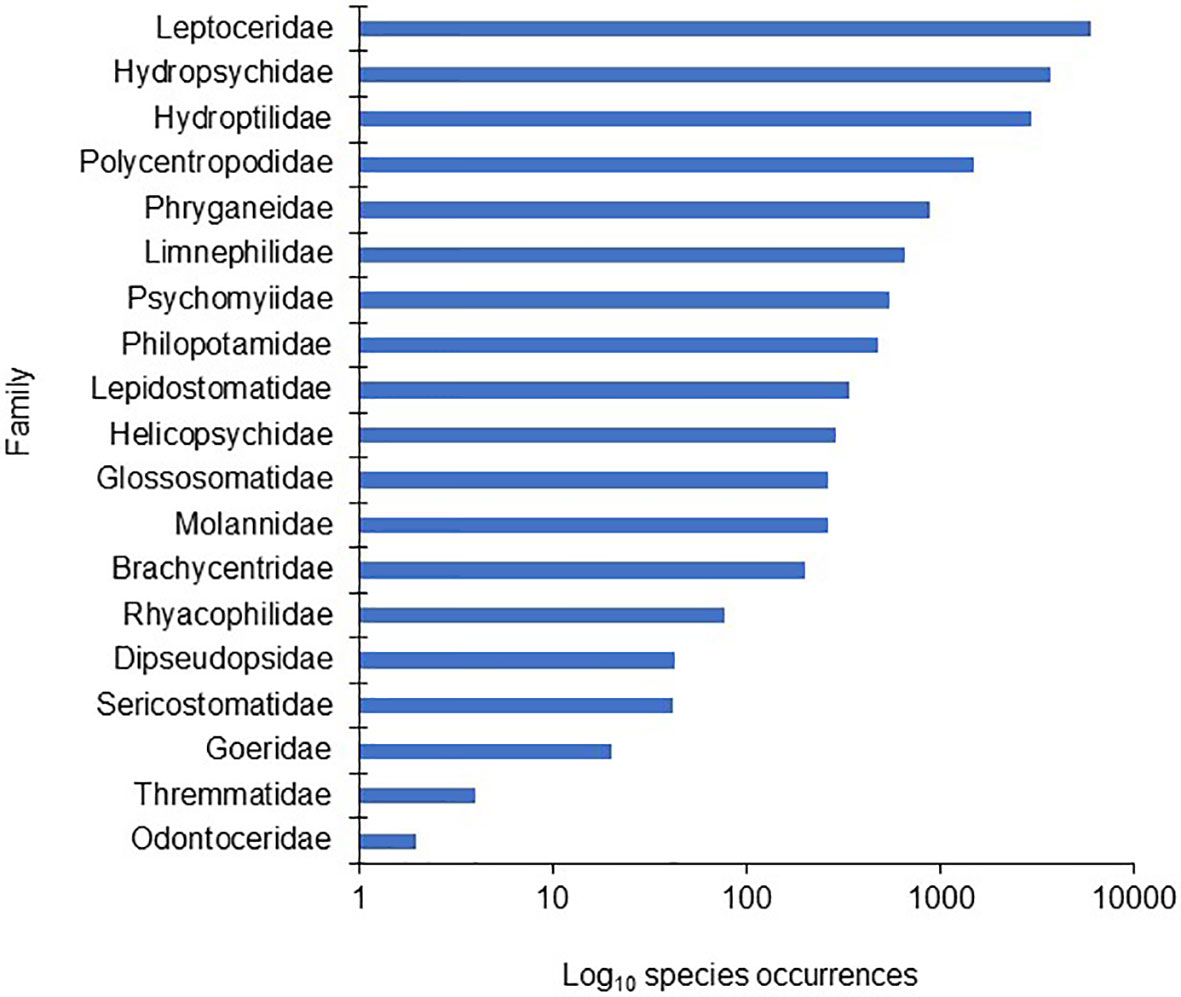
Figure 2 The 19 families of Trichoptera, ranked by the number of total species occurrences within each family found during this study.
Maximal species richness values were estimated for our 770 sites assuming equal sampling conditions and equal undisturbed environmental conditions. Thus, we substituted the global mean value for any collection variable (e.g., DP) identified as significant to our determined model. Similarly, we substituted undisturbed values (e.g., Plants = 0) for the values of significant disturbance variables. Species richness values predicted by such calculated models were then compared to the observed species richness values in each sample with the formula:
where expected value was derived from linear models of the significant site variables and constants, and observed value was the number of species that were actually caught in each sample.
Calculated models were also applied to the 760,047 stream segments of our study area. Values of the significant model variables for each stream segment were downloaded from the StreamCat database using the StreamCat API within the R environment (https://github/USEPA/StreamCatTools). We estimated the difference between observed and expected values of caddisfly species for each stream segment using the same data and formula as above, calculating expected values using the global mean for significant collection variables and undisturbed values for significant disturbance variables, and calculating observed values using the actual values of all of the variables associated with each segment. Land cover values were taken from the 2011 data set for all predictions. Latitude, longitude, and elevation data were only available for the center of the HUC-12 catchment containing each stream segment, thus approximating its location. Predictions of species loss were plotted throughout our study area in 10% increments using ArcMap software. Predicted percent species loss for each stream catchment centroid was converted into a vector/shapefile and then rasterized to a resolution of 300 meters. This conversion allowed for plotting the predicted percent species loss for all 760,047 stream segments without overlap between the data markers. Predicted total species richness of the 760,047 stream segments assuming undisturbed conditions were also mapped using the values for each stream segment, but substituting undisturbed values for any significant disturbance variables. Significant natural environmental variables were assessed for their ability to predict changes in determined undisturbed species richness throughout the 760,047 stream segments using simple liner regression.
We and our colleagues sampled 770 streams, including 173 1st order, 152 2nd order, 161 3rd order, 128 4th order, 88 5th order, 43 6th order, 14 7th order, nine 8th order, one 9th order, and one 10th order. We identified 451,592 caddisfly specimens representing 18,288 species occurrences and 282 total species among 19 families, The Leptoceridae had the highest number of species occurrences (6016), followed by the Hydropsychidae (3711) and Hydroptilidae (2941) (Figure 2). Those three families represented > 2/3 of all species occurrences. Caddisfly richness per sample ranged from 1 to 65 species with an overall mean of 21.2 (Figure 3). Least disturbed streams averaged around 30 species while highly disturbed streams averaged around 10.
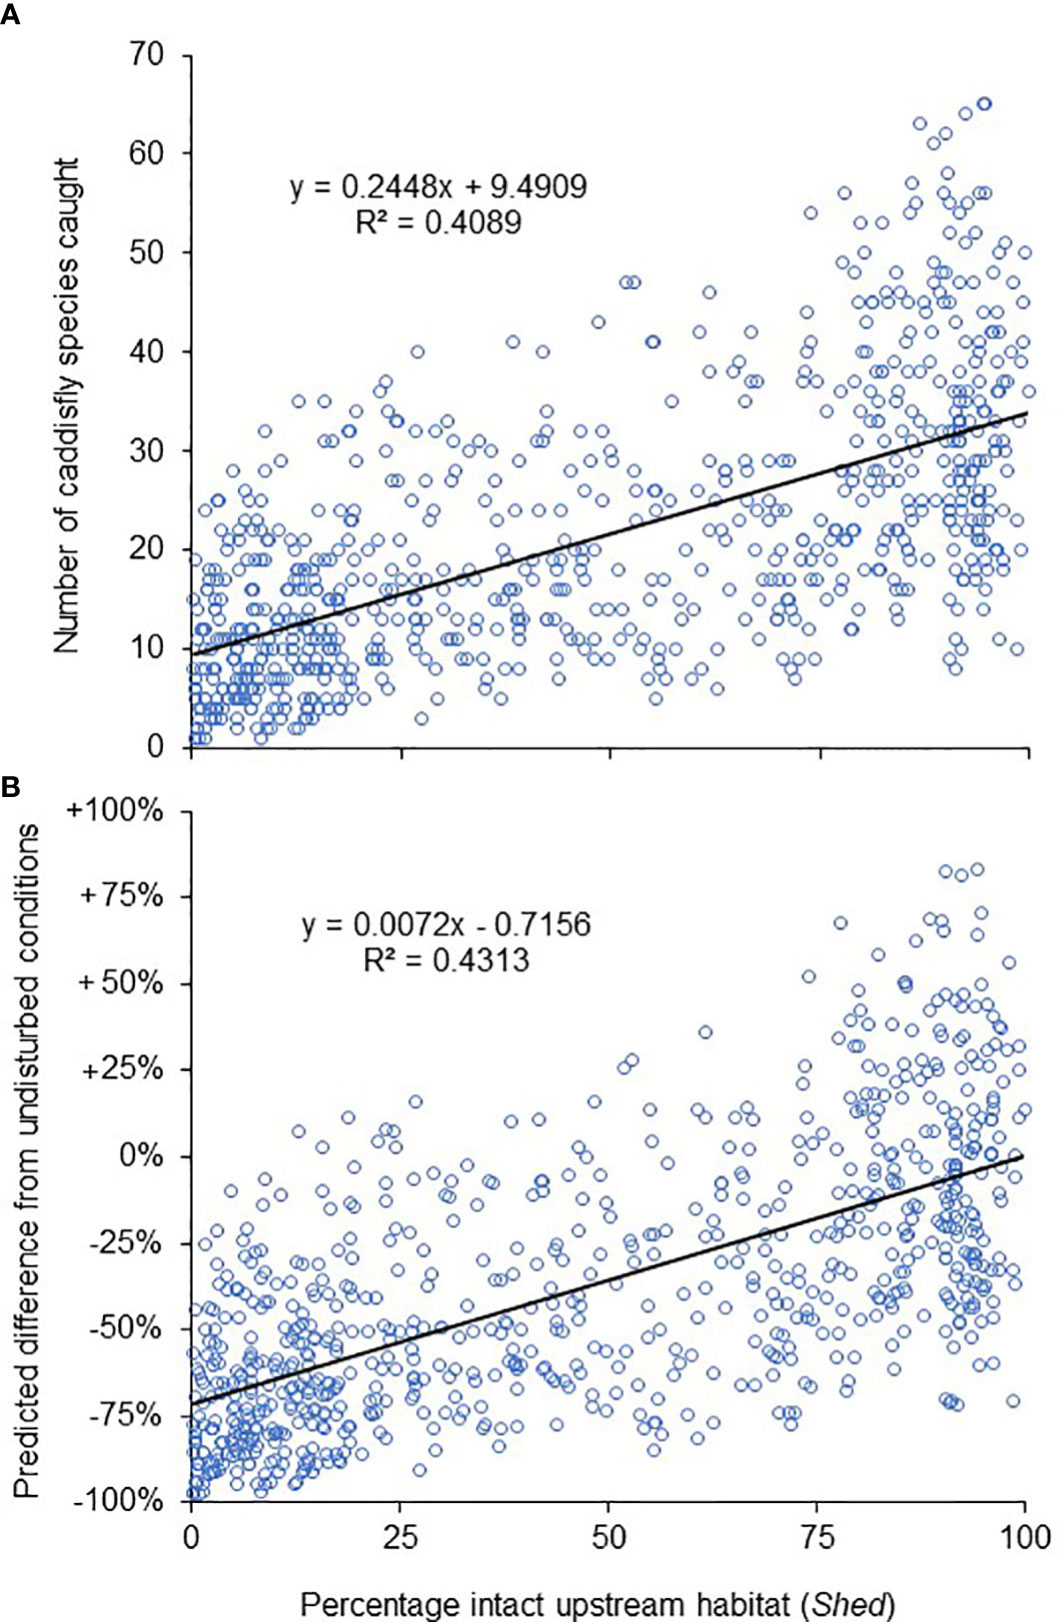
Figure 3 The number of caddisfly species caught from each of our 770 samples relative to intact upstream habitat (Shed) (A), and the percentage of the fauna estimated to have been lost from the same sampling sites (B). Markers for the bottom panel represent an expected number of species from a sample assuming undisturbed conditions (Shed = 100, Plants = 0) and the model from Table 5, subtracted from the actual collected number of species found in that sample, and then divided by the expected number.
The disturbance variables Shed (R2 = 0.41), Plants (0.26), and Rip (0.21) had the highest ability among all variables to predict caddisfly species richness using simple linear regression (Table 2). The variables Temp (0.19), Base (0.17), and Perm (0.13) had the highest values among variables that were not inherently disturbance related. Rip, Shed and Temp exhibited notable collinearity with each other and with several other natural and anthropogenic variables (Table 3).
Multiple linear regression analysis of all 18 variables returned a significant model including the significant variables Bed, DP, Elev, Long, OM, Plants, Run, and Shed (Table 4). No single model had an AICc weight above 0.043, and over 100 models had an adjusted R2 value of 0.4789 to 0.4651, suggesting that there was no definite best model. The variables Bed, DP, Elev, Long, OM, Plants, Run, and Shed all had similarly high AICc importance values (Figure 4). A multiple linear regression analysis of those eight variables returned a significant model with an AICc weight of 1 (Table 5), suggesting that further elimination of any variables would result in an inferior model. Similarly, the low VIF values suggested minimal covariance and redundancy of variables (Quinn and Keough, 2002).
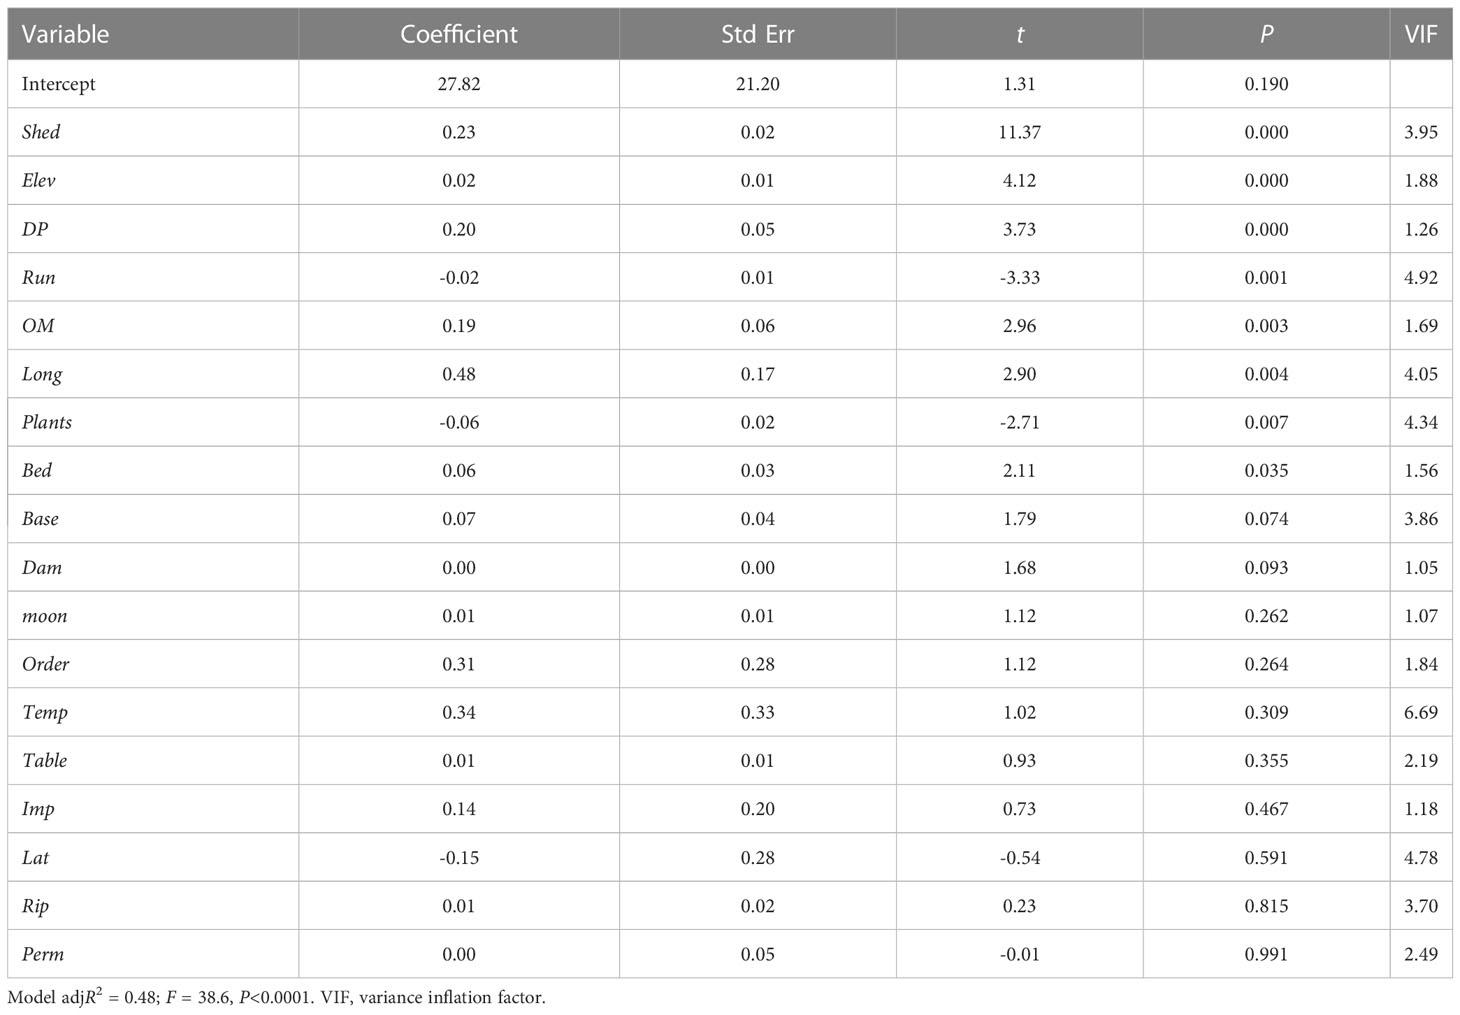
Table 4 Results of multiple linear regression modeling of caddisfly species richness based on our 18 predictor variables (Table 1).
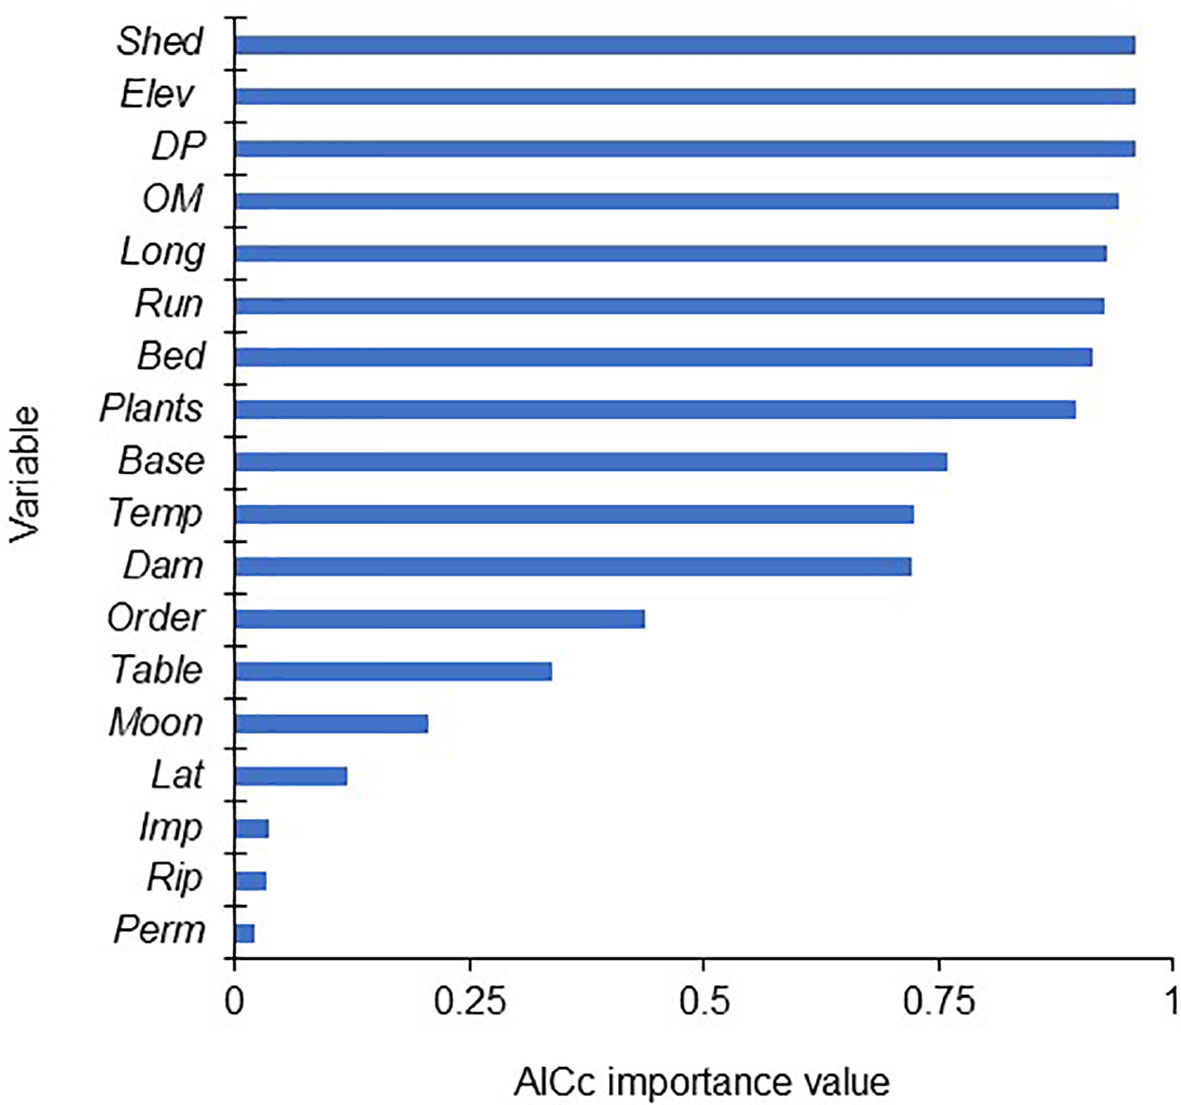
Figure 4 The 18 variables analyzed during this study, ranked by AICc importance value. Importance values were calculated by summing the weights of all multiple regression models that included each variable.
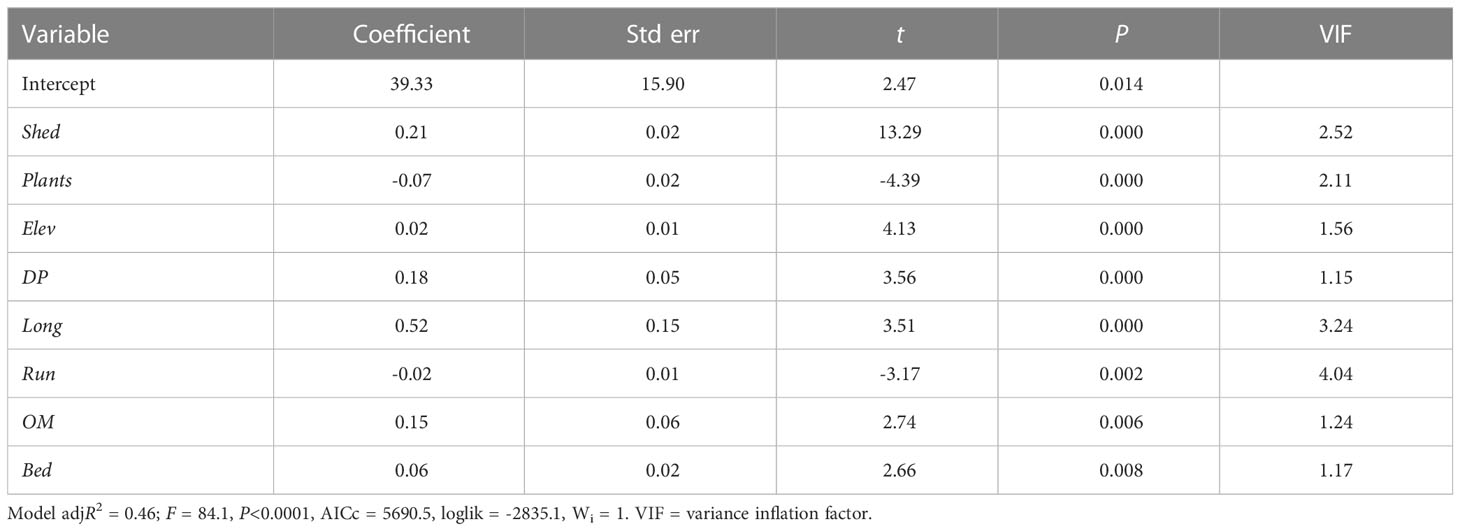
Table 5 Results of multiple linear regression modeling of caddisfly species richness based on the eight most important predictor variables (Table 4).
After replacing the values of the significant collection variable DP with its global mean value in all models to equalize the effect of weather, and the values of the anthropogenic variables Plants and Shed with 0 and 100 respectively to simulate undisturbed conditions, the calculated species richness difference between observed values and those of the same sampling sites under hypothetical undisturbed conditions were notable (Figure 3). The model predicted that, on average, a 50% loss of intact habitat would lead to a 30% decrease in caddisfly species richness, and a 75% loss would lead to a 55% decrease. Habitats with virtually no intact upstream habitat would exhibit a decrease of nearly 75%.
Applying the same model to the stream segments of our study area predicted that around 114,000 of the 760,047 stream segments (15%) had maintained at least 90% of the caddisfly species richness that would be expected under undisturbed conditions, whereas 444,000 segments (58%) had lost at least half of caddisfly richness (Figure 5). The vast majority of stream segments with <20% predicted species loss were in northern Michigan, Minnesota, and Wisconsin, with some smaller areas located in southern Illinois, Indiana, and Ohio (Figure 5). In contrast, over half of our geographic study area was composed of stream segments with predicted losses >60%, predominantly within the southern portion of our study area.
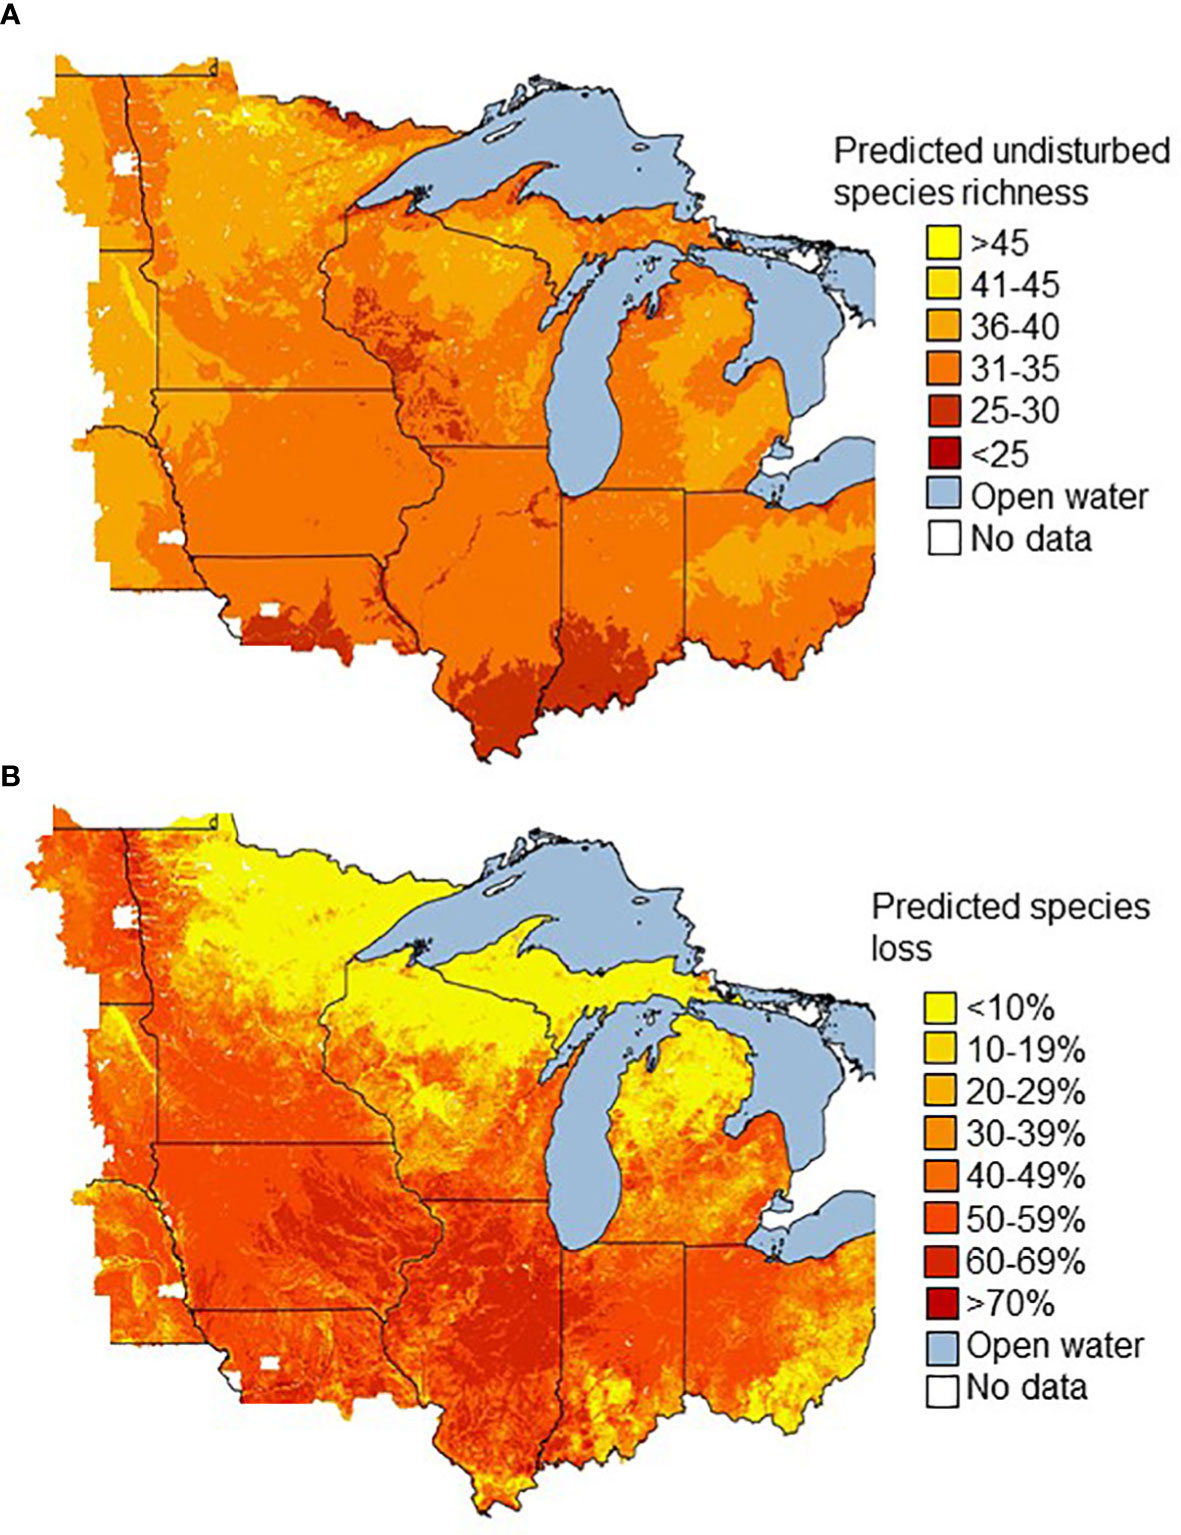
Figure 5 The predicted species richness assuming undisturbed conditions (Shed = 100, Plants = 0) and the model from Table 5 (A) and predicted percent loss of caddisfly species richness relative to these undisturbed conditions (B) for the 760,047 stream segments of our study area. Political boundaries in Figure 1.
After substituting undisturbed values for Shed and Plants to estimate undisturbed species richness, almost 2/3 of the 760,047 stream segments were predicted to have 31–35 caddisfly species, and nearly 90% were predicted to have 31–40 species. Of the five important natural variables from our model, Elev had the most robust simple linear regression (R2 = 0.44) when used as a predictor variable for undisturbed species richness, followed by OM (0.24) and Run (0.18) (Figure 6). Stream segments of low (≤30 species) predicted undisturbed richness were concentrated in the Driftless Area of southwestern Wisconsin, in the older Illinoian glaciated regions of central Missouri, southern Illinois, and southern Indiana, and in small areas of northern Michigan and Minnesota (Figure 5).
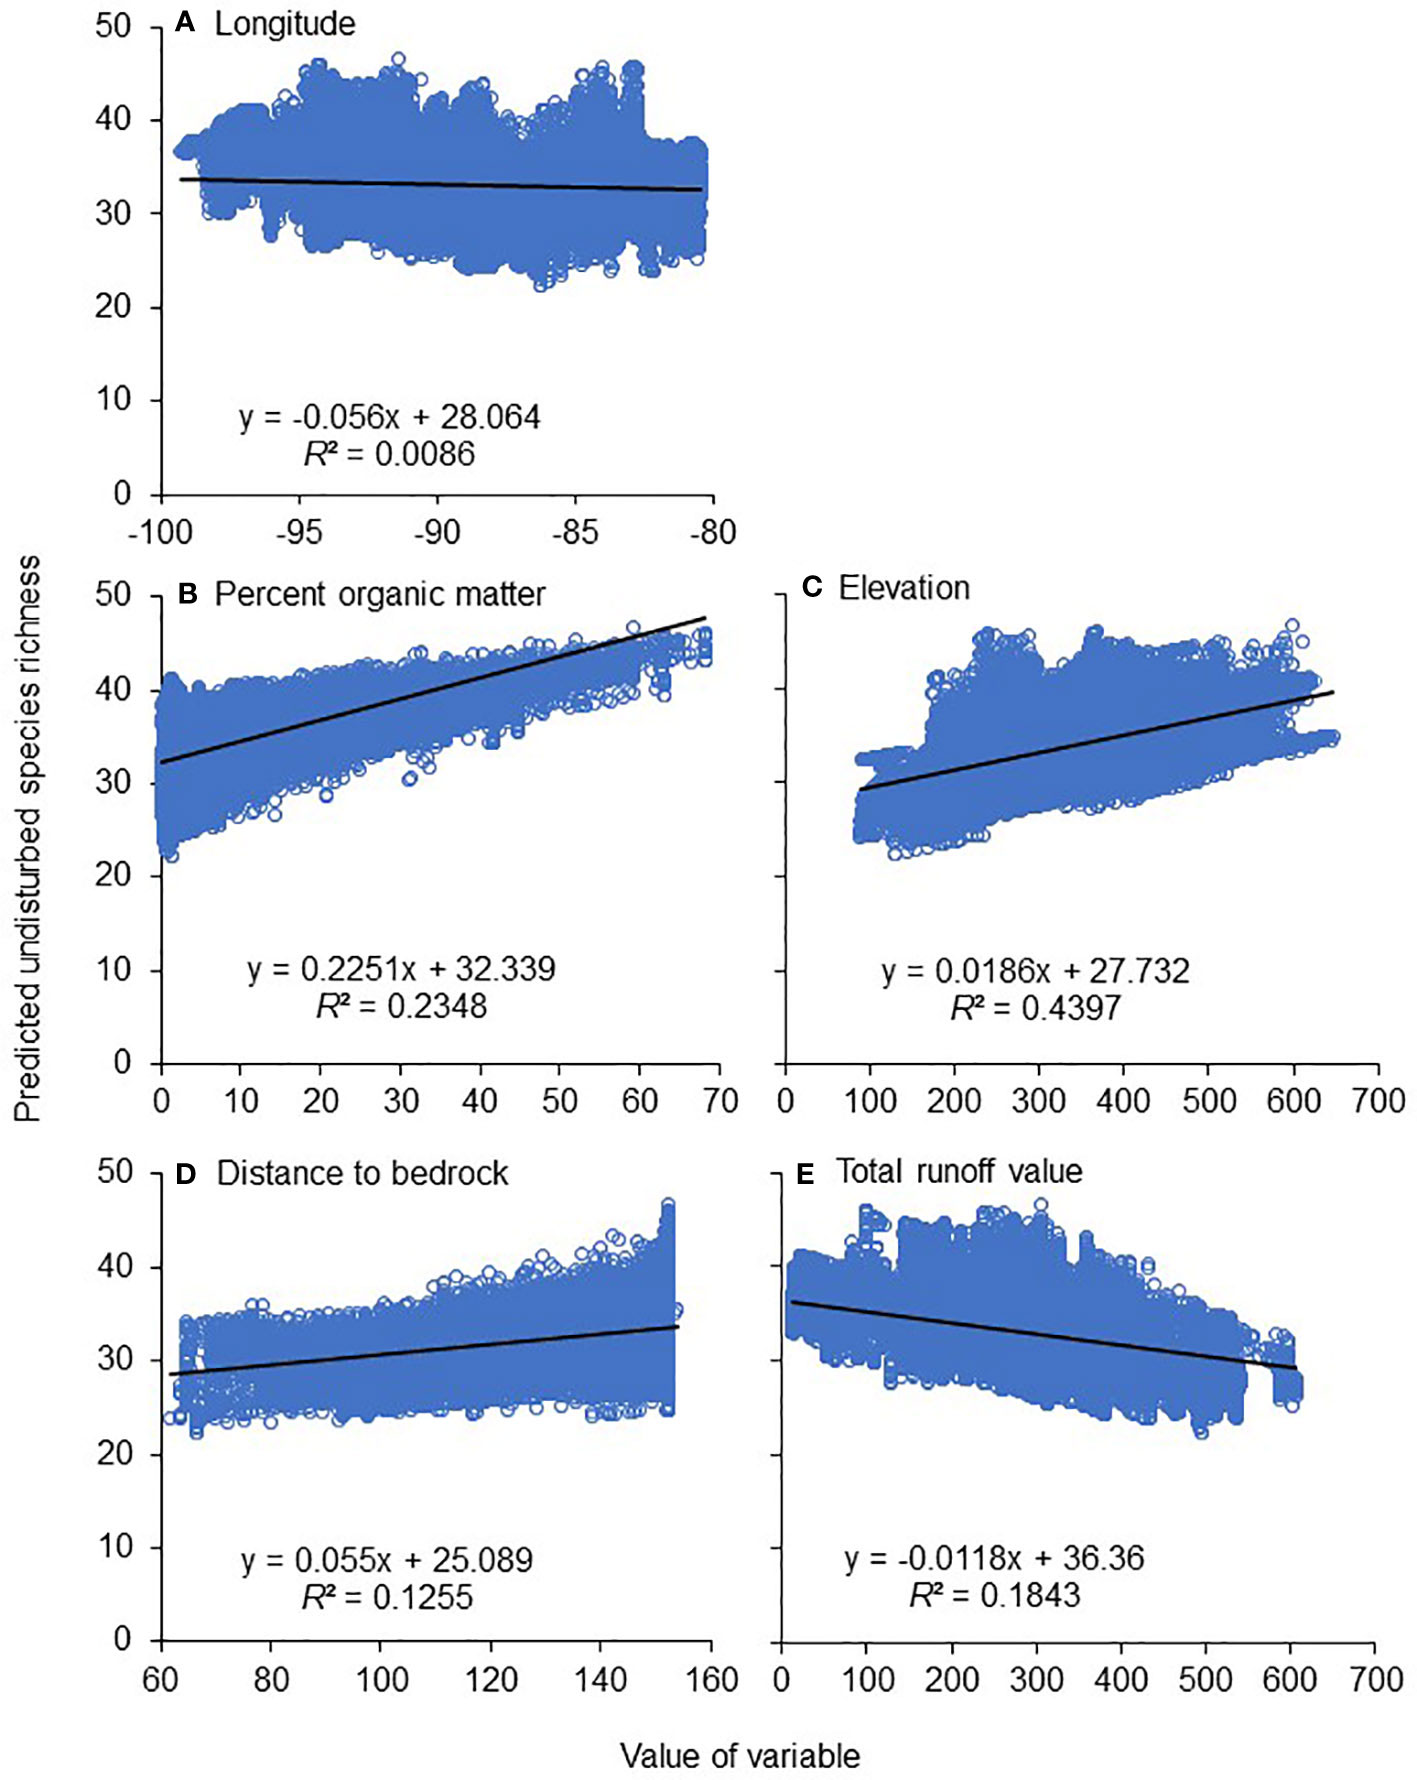
Figure 6 Simple linear regression models of the five determined significant natural environmental variables and their ability to predict species richness in the absence of disturbance (Figure 5A): longitude (A), percent organic matter (B), elevation (C), distance to bedrock (D), and total runoff value (E). Variable descriptions and units in Table 2. n = 760,047 stream segments for each graph.
The predominant land cover type in the watersheds of undisturbed streams was forest (53%), followed by wetland (29%) and grassland (6%) (Figure 7). All three types were lower in more disturbed watersheds, and primarily replaced by row crops and pasture. Row crops composed 72% of the land cover of disturbed watersheds, followed by pasture (10%) and developed land (9%).
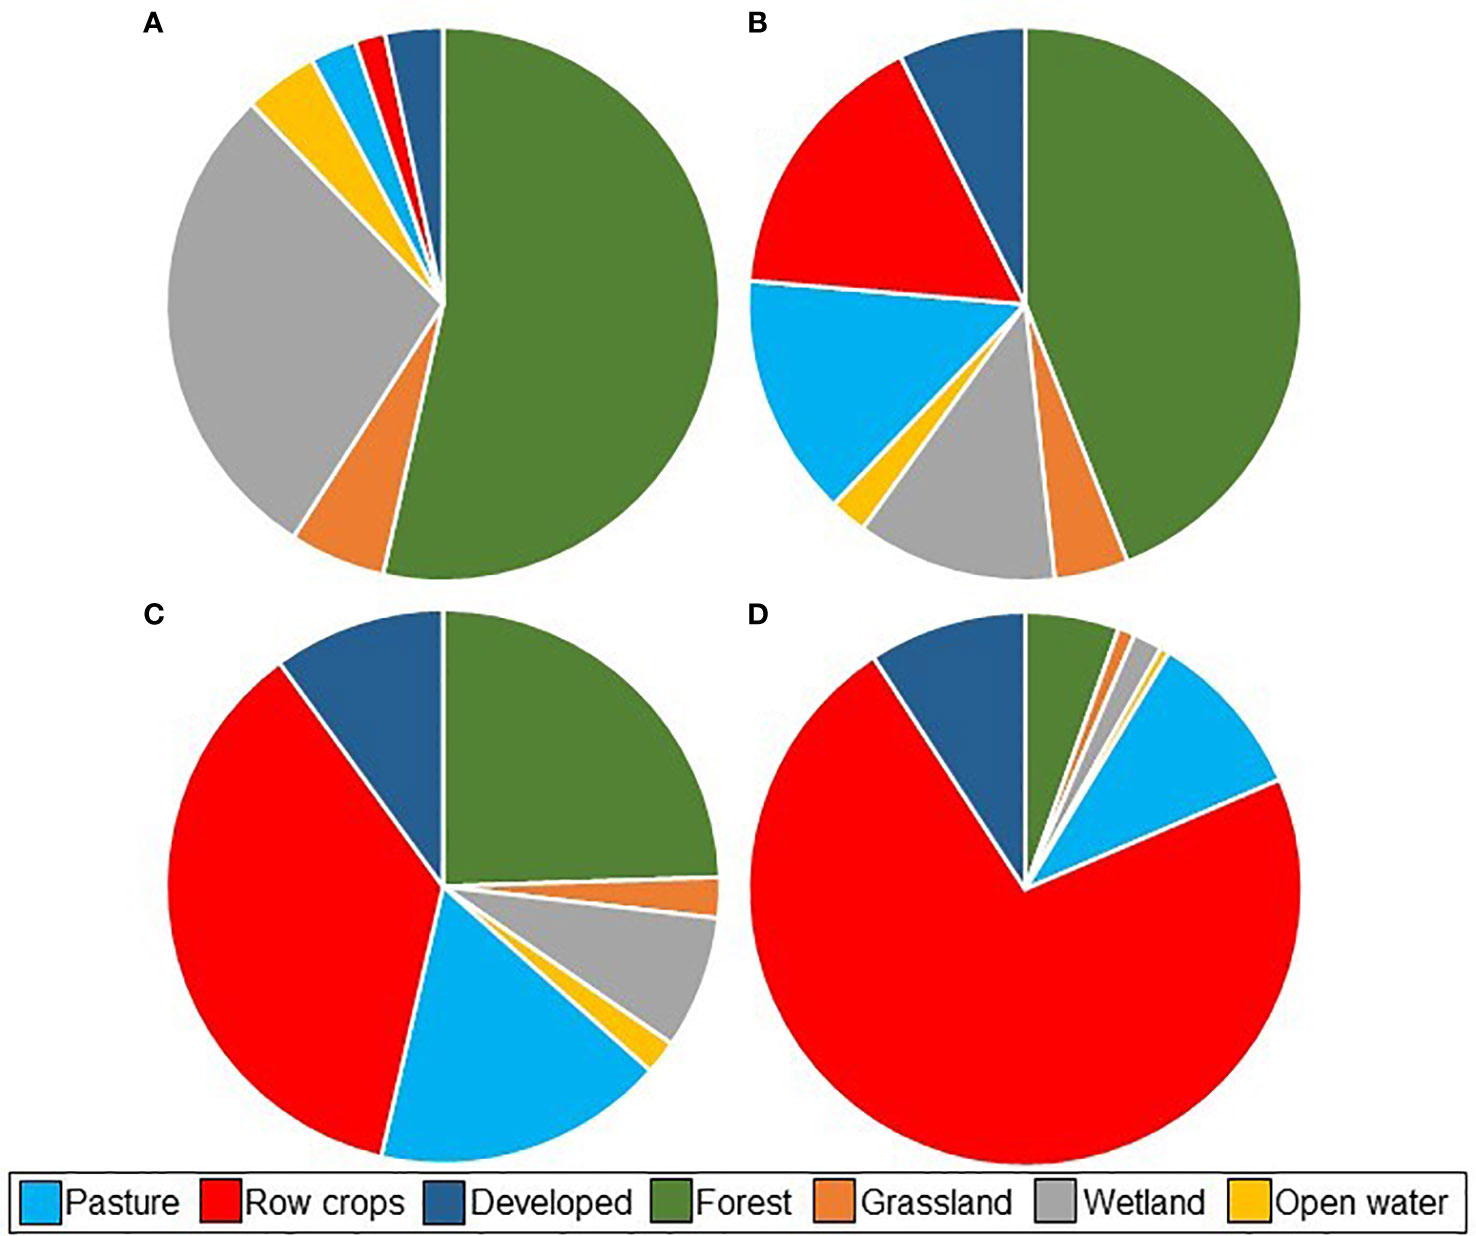
Figure 7 Relative watershed coverage of the seven primary land cover types upstream of the 760,047 stream segments of our study area grouped by overall Shed value. >75% intact upstream habitat (n = 141,933) (A), 50–75% (n = 86,118) (B), 25–50% (n = 138,861) (C),<25% (n = 393,135) (D).
Determining the most important drivers of biological diversity is critical for developing science-based approaches to biological conservation and ecosystem management. Determining such drivers of riverine diversity is particularly urgent, as river systems continue to degrade worldwide (Feio et al., 2022). Thus, it becomes particularly important to establish and prioritize the most important variables affecting the riverine biota. A perpetual challenge for such studies is the frequent collinearity between candidate variables. For example, in our study Temp simultaneously correlated positively with Order and negatively with Lat, Shed, Base, and Perm (Table 3). Such collinearity has been noted in several previous studies (Ebersole et al., 2003; Dohet et al., 2014; Dugdale et al., 2020; Houghton, 2021). Not surprisingly, the land cover variables Shed and Rip correlated positively with each other and negatively with Plants (Table 3) (Seeney et al., 2019). Although Temp (R2 = 0.19) and Rip (0.21) had relatively strong simple linear regression coefficients (Table 1), they were not retained in the final model, suggesting that most of their power to predict caddisfly species richness was due to their covariance with Shed (Quinn and Keough, 2002). Houghton and DeWalt (2021) similarly determined three distinct temperature gradients corresponding to intact upstream habitat, stream gradient, and river size that each significantly affected caddisfly species assemblages and functional feeding group biomass of the northcentral US. They hypothesized that temperature was actually less important in affecting stream organisms than the variables with which it co-varies. Conversely, most of the variables retained by our final model had simple linear regression coefficients ≤ 0.05, suggesting that they had low ability to independently predict caddisfly species richness, but their ability was unique among variables and not due to correlation (Quinn and Keough, 2002).
The variables retained in the final model generally had expected associations with caddisfly species richness (Table 5). Longitude (Long) affects caddisflies of the northcentral US as the naturally arid environments and high level of habitat degradation in the western states of the region decrease species richness (McNeely, 2003; Houghton, 2021; Houghton et al., 2022). While elevation (Elev) differences are clearly important to montane assemblages, even short elevation gradients can influence invertebrate communities (Namayandeh et al., 2018). Depth of soil to bedrock (Bed) and percent of organic matter in soil (OM) both increase over successional time and may relate to glacial history, which is known for affecting stonefly species richness in the northcentral US (Cao et al., 2013; Molles and Sher, 2018). A high run-off value (Run) typically associates with low stream permanence, thus possibly limiting species to those with short or diapausing life cycles (DeWalt et al., 2005; Santhi et al., 2008). A high dew point (DP) increases species richness as it reflects consistently warm temperatures throughout the sampling night (Wright et al., 2013).
While eight variables collectively accounted for significant (46%) variation in caddisfly species richness, and natural variables such as Elev, OM, and Run appeared particularly important for affecting species richness in the absence of disturbance, the single most important variable appeared to be the percentage of intact upstream natural habitat (Shed), which by itself accounted for 41% of the total variation in the dataset, and positively associated with richness (Tables 1, 5). In general, high Shed values associated with high relative coverage of forests and wetlands (Figure 7), reflecting the fairly undisturbed Upper Midwest forested ecoregion of northern Michigan, Minnesota, and Wisconsin (Omernik and Griffith, 2014). Conversely, the Temperate Plains prairie ecoregion was highly disturbed; thus, grassland was not an abundant land cover type of undisturbed watersheds.
Agriculture was the dominant land use disturbance throughout the region (Figure 7), with row crops and pasture encompassing the majority of highly disturbed areas, especially in the southern portion of our study region. Similarly, the percentage of non-native upstream vegetation (Plants), including agricultural cultivars, associated negatively with caddisfly species richness. Intensive agriculture probably has the most extensive impact of any human land use on aquatic ecosystems, with effects including stream channelization, draining of wetlands, modification or loss of the surrounding floodplain, removal of riparian canopy cover with subsequent loss of coarse allochthonous input, and increased inputs of pesticides, sediment, and fine organic matter (Zweig and Rabeni, 2001; Brinson and Malvárez, 2002; Allan, 2004; Paulsen et al., 2008; Pearson et al., 2016; Hughes and Vadas, 2021). Collectively, these effects decrease the taxonomic richness of aquatic taxa (Allan, 2004; Hawkins and Yuan, 2016; Houghton and DeWalt, 2021).
Ultimately, our results suggested that landscape-level habitat disturbance is the most important driver of caddisfly species richness and that natural variables have comparatively less importance. Moreover, they indicated that merely protecting the riparian zone of a river is insufficient to protect aquatic biota, as the variable Rip did not add significance to the overall model. These results reinforce the idea of “the valley rules the stream” (Hynes, 1975). That is, river systems are ultimately reflections of the surrounding landscape, and conservation measures must be undertaken on a larger scale than merely protecting a single stream reach or riparian zone (Le Gall et al., 2021; Green et al., 2022).
The continuing worldwide mass extinction of species is clear and well-documented (Pimm et al., 2014; Ceballos et al., 2017; Tilman et al., 2017). The scale of biotic decline, however, may actually be considerably underestimated. Ceballos et al. (2017) coined the term ‘biological annihilation’ to describe mass extirpations of species from particular habitats. Such extirpations are likely occurring at a rate at least an order of magnitude greater than the rate of complete species extinctions, yet receive comparatively little attention. The loss of a species locally can have significant detrimental effects on its former ecosystem (Flynn et al., 2009; Brodie et al., 2021), as well as be a harbinger of future extinction, even among species that are apparently secure (Ceballos et al., 2017).
Unfortunately, our results indicated many such local extirpations — a biological annihilation — of caddisflies throughout large portions of the northcentral United States. While these results are not particularly surprising based on smaller-scale studies of aquatic insects within the region (DeWalt et al., 2005; Houghton and Holzenthal, 2010), they are nonetheless alarming. If our predictions are correct, then not only have caddisfly extirpations been substantial, but they cover such vast areas of the region — for example, almost the entire prairie ecoregion — that recolonization of species will be difficult even if ecosystem restoration occurs due to natural lag time and the low vagility of caddisflies (Peterson et al., 1999; Meals et al., 2010; Brakel et al., 2015).
Regardless of the number of variables added, overall R2 values were always <0.50, indicating that over half of the variation in caddisfly species richness could not be explained by any of our models. We suspect that much of the unaccounted variation is from subtle differences in the emergence phenologies, flight periodicities, and adult behavior of species at specific locations. The abundance of common species can vary unpredictably from week to week, even within the peak sampling season and under similar weather conditions (Houghton, 2015). The presence or absence of rare species may similarly vary. It is not known definitively if ultraviolet light trapping is an exhaustive technique for sampling caddisflies, if it attracts all species equally, or if species are less attracted at certain points during their adult life (Myers and Resh, 1999; Nakano and Tanida, 1999). Variation in channel sinuosity, benthic substrates, nutrient input, water physicochemistry, or stream velocity, among other local variables, probably also affected species richness, as did a site’s glacial history (Sangunett, 2005; Marzin et al., 2012; Cao et al., 2013. Macedo et al., 2014; Herlihy et al., 2020; Houghton and DeWalt, 2021). Such data, however, were not available in the StreamCat database. In addition, the 24-year sampling period, which was necessary to obtain a large number of samples during a short sampling window with similar weather conditions, could have occurred as land cover changed over time. Fortunately, land cover data were available for 2006 and 2011, meaning that the percentages of intact upstream (Shed) and riparian (Rip) habitat were assessed within 11 years of caddisfly sampling for all streams, and ~75% of streams were assessed within 7 years. Lastly, extrapolating by nearly three orders of magnitude (770 samples to 760,047 stream segments) practically guarantees a substantial loss of precision (Quinn and Keough, 2002). There could be many regions within our study area that do not fit the predicted patterns, but are overlooked due to their small sample sizes being overwhelmed by the general trends. For example, nearly all samples from the Elkhart, Fawn, and Pigeon River systems of northeastern Indiana contained approximately double the species richness predicted by our model. A similar pattern has been observed in the stonefly assemblages of this region, possibly due to high groundwater input (DeWalt et al., 2016).
Future research should address the limitations of this study. In particular, including site-specific stream morphological and physicochemical variables would help address the question of spatial scale in affecting species richness. Perhaps future iterations of the StreamCat database could include estimations of such variables. Determining and prioritizing refuge habitats, such as those within southern Illinois, Indiana, and Ohio, would be beneficial to preserving the remaining richness of caddisflies and other aquatic insects within region where it has otherwise been lost (Cao et al., 2013; Newman et al., 2021). Finally, expanding the study to include additional areas and aquatic taxa would enhance our findings and better evaluate the severity of extirpations of aquatic organisms.
Despite the lack of precision in our models, this study nonetheless indicated abundant species extirpations and subsequent loss of the ecological services provided by caddisflies throughout a large geographic area. Caddisfly genetic diversity has almost certainly been lost permanently due to population fragmentation and isolation (MacArthur and Wilson, 2016). Based on known levels of watershed disturbance (Paulsen et al., 2008; McManamay et al., 2018; Isaak et al., 2020) and the sensitivity of other orders of aquatic insects (DeWalt et al., 2005; Cao et al., 2013), the biological annihilation of aquatic insect taxa is probably a significant problem throughout much of the US and elsewhere.
The raw data supporting the conclusions of this article will be made available by the authors, without undue reservation.
Conceptualization (DH), obtaining funding (DH and RD), sampling (DH and RD), specimen identification (DH and RD), data analysis (DH), manuscript preparation (DH), manuscript editing (DH and RD). Both authors contributed to the article and approved the submitted version.
Primary funding for this research came from a US Environmental Protection Agency Science to Achieve Results Fellowship and Minnesota Natural Heritage and Nongame Research Program grants to DH, and the US Department of Interior (INT RD X-1-R-1) and National Science Foundation (DEB 09-18805 ARRA and DBI 14-58285) grants to RD. Further support came from the Hillsdale College (HC) biology department, grants from the Huron Mountain Wildlife Foundation, several HC LAUREATES grants to DH and affiliated students, and a HC Faculty Summer Leave grant.
We appreciate the efforts of all who have collected, sorted, and identified caddisflies from this large region over the last 24 years, including Benjamin Albers, Geoffrey Archibald, Doug Bidlack, Mike Birmingham, Roger Blahnik, Dean Blinn, Chris Bowyer, Kelsey Brakel, Kiralyn Brakel, Abrial Cocelli, Henrey Deese, Mikayla Dove, Lily Erickson, David Etnier, Christine Fenendael, Erin Flaherty, Erin Furmaga, Mark Galatowitsch, Hannah Goble, Kim Ha, Bob Haack, Ralph Holzenthal, Todd Hubbard, Robert Kintz, Kyler Kuzio, Ryan Lardner, Travis Ling, Faith Linton, Brooklyn Little, Caitlin Lowry, Connie Loruss, Jeremy Luce, Emily Malcolm, Christina Manna, Bilyana McLeod, Bridget O’Leary, Joel Parker, Sally Petrella, Megan Phelps, Beth Potwardowski, Angie Pytel, Joseph Ritzer, David Ruiter, Sarah Salow, Logan Shoup, Karen Schultz, Mary Clare Smith, Erich Steger, Peter Thistleton, Shelby Tone, Sydney Tone, Eleanor Valle, Daniel Votel, Jeff Van Zant, Lydia Wassink, Molly Williams, Daniel Wright, Mia Young, Noah Youtz, Jennifer Zaspel, and Jessica Zeglin. Permits to collect in the State Parks of Michigan and Minnesota were provided by Alicia Selden (MIDNR) and Ed Quinn (MNDNR) respectively. Sampling of Sleeping Bear Dunes National Park was conducted under permit SLBE-2014-SCI-0002. Permission to sample in the Huron Mountains of Michigan was provided by the Huron Mountain Wildlife Foundation. Permission to sample at the Black River Ranch of Michigan was provided by the Black River Ranch Board of Directors. Permission to sample at Sarah Jane’s Natural Area of Michigan was provided by John Bagley and Andrew Bacon of the Michigan Nature Association. Collecting from the Indiana Dunes National Lakeshore was granted under permit INDU-2013-SCI-007, and from the Saint Croix National Scenic Riverway under SACN-2013-SCI-003 and SACN-2016-SCI-001. Google Earth base maps were used following permission guidelines (https://www.google.com/permissions/geoguidelines/attr-guide/). We greatly appreciate the assistance of Marc Weber and Christopher Heckel with R coding and data extraction, and Philip Hogan with Figure 5. The valuable comments of Angie Pytel and Bob Haack improved earlier versions of the manuscript. This is paper #37 of the G.H. Gordon BioStation Research Series.
The authors declare that the research was conducted in the absence of any commercial or financial relationships that could be construed as a potential conflict of interest.
All claims expressed in this article are solely those of the authors and do not necessarily represent those of their affiliated organizations, or those of the publisher, the editors and the reviewers. Any product that may be evaluated in this article, or claim that may be made by its manufacturer, is not guaranteed or endorsed by the publisher.
Allan J. D. (2004). Landscapes and riverscapes: the influence of land use on stream ecosystems. Annu. Rev. Ecol. Evol. Systemat. 35, 257–284. doi: 10.1146/annurev.ecolsys.35.120202.110122
Baranov V., Jourdan J., Pilotto F., Wagner R., Haase P. (2020). Complex and nonlinear climate-driven changes in freshwater insect communities over 42 years. Conserv. Biol. 1, 1–11. doi: 10.1111/cobi.13477
Barbour M. T., Gerritsen J., Snyder B. D., Stribling J. B. (1999). “Rapid bioassessment protocols for use in streams and rivers,” in periphyton, benthic macroinvertebrates, and fish, 2nd edition (Washington, DC: Office of Water, US Environmental Protection Agency). EPA 841-B-99-002.
Barton K. (2015). MuMIn: multi-model inference. R package version 1.15.1 (Vienna: R Project for Statistical Computing).
Blinn D. W., Ruiter D. E. (2013). Tolerance values and effects of selected environmental determinants on caddisfly (Trichoptera) distribution in northwest and north central Washington, USA. Western North Am. Nat. 73, 270–294. doi: 10.3398/064.073.0302
Bojková J., Komprdová K., Soldán T., Zahrádková S. (2012). Species loss of stoneflies (Plecoptera) in the Czech Republic during the 20th century. Freshw. Biol. 57, 2550–2567. doi: 10.1111/fwb.12027
Brakel K., Wassink L., Houghton D. C. (2015). Nocturnal flight periodicity of the caddisflies (Trichoptera) in forest and meadow habitats of a first order Michigan stream. Great Lakes Entomol. 48, 34–44.
Brasil L. S., Luiza-Andrade A., Calváo L. B., Dias-Silva K., Faria A. P. J., Shimano Y., et al. (2020). Aquatic insects and their environmental predictors: a scientometric study focused on environmental monitoring in lotic environmental (sic). Environ. Monit. Assess. 192, 194. doi: 10.1007/s10661-020-8147-z
Brinson M. M., Malvárez A. I. (2002). Temperate freshwater wetlands: types, status, and threats. Environ. Conserv. 29, 115–133. doi: 10.1017/S0376892902000085
Brodie J. F., Williams S., Garner B. (2021). The decline of mammal functional and evolutionary diversity worldwide. Proc. Natl. Acad. Sci. 118, e1921849118. doi: 10.1073/pnas.1921849118
Cao Y., DeWalt R. E., Robinson J. L., Tweddale T., Hinz L., Pessino M. (2013). Using Maxent to model the historic distributions of stonefly species in Illinois streams: the effects of regularization and threshold selections. Ecol. Model. 259, 30–39. doi: 10.1016/j.ecolmodel.2013.03.012
Ceballos G., Ehrlich P. R., Dirzo R. (2017). Biological annihilation via the ongoing sixth mass extinction signaled by vertebrate population losses and declines. Proc. Natl. Acad. Sci. 114, E6089–E6096. doi: 10.1073/pnas.1704949114
Colwell R. K. (1996). “Biota,” in The Biodiversity Database Manager (Sunderland, MA: Sinauer Associates, Ltd.).
Datry T., Bonada N., Heino J. (2016). Towards understanding the organization of metacommunities in highly dynamic ecological systems. Oikos 125, 149–159. doi: 10.1111/oik.02922
DeWalt R. E., Favret C., Webb D. W. (2005). Just how imperiled are aquatic insects? A case study of stoneflies (Plecoptera) in Illinois. Ann. Entomol. Soc. America 98, 941–950. doi: 10.1603/0013-8746(2005)098[0941:JHIAAI]2.0.CO;2
DeWalt R., Grubbs S., Armitage B., Baumann R., Clark S., Bolton M. (2016). Atlas of ohio aquatic insects: volume II, plecoptera. Biodiversity Data J. 4, e10723. doi: 10.3897/BDJ.4.e10723
Didham R. K., Basset Y., Collins C. M., Leather S. R., Littlewood N. A., Menz M. H. M., et al. (2020). Interpreting insect declines: seven challenges and a way forward. Insect Conserv. Diversity 13, 103–114. doi: 10.1111/icad.12408
Dodds W. K., Gido K., Whiles M. R., Daniels M. D., Grudzinski B. P. (2015). The stream biome gradient concept: factors controlling lotic systems across broad biogeographic scales. Freshw. Sci. 34, 1–19. doi: 10.1086/679756
Dohet A. (2002). “Are caddisflies an ideal group for the assessment of water quality in streams?,” in Proceedings of the 10th International Symposium on Trichoptera (Keltern: Nova Supplementa Entomologica), 507–520.
Dohet A., Hlúábiková D., Wetzel C. E., L’Hoste L., Iffly J. F., Hoffmann L., et al. (2014). Influence of thermal regime and land use on benthic invertebrate communities inhabiting headwater streams exposed to contrasted shading. Sci. Total Environ. 505, 1112–1126. doi: 10.1016/j.scitotenv.2014.10.077
Dugdale S. J., Hannah D. M., Malcolm I. A. (2020). An evaluation of different forest cover geospatial data for riparian shading and river temperature modelling. River Res. Appl. 36, 709–723. doi: 10.1002/rra.3598
Ebersole J. L., Liss W. J., Frissell C. A. (2003). Cold water patches in warm streams: physicochemical characteristics and the influence of shading. J. Am. Water Resour. Assoc. 39, 355–368. doi: 10.1111/j.1752-1688.2003.tb04390.x
Feio M. J., Hughes R. M., Serra S. R. Q., Nichols S. J., Kefford B. J., Lintermans M., et al. (2022). Fish and macroinvertebrate assemblages reveal extensive degradation of the world’s rivers. Global Change Biol. 29, 355–374. doi: 10.1111/gcb.16439
Flynn D. B. F., Gogol-Prokurat M., Nogeire T., Molinari N., Richers B. Y., Lin B. B., et al. (2009). Loss of functional diversity under land use intensification across multiple taxa. Ecol. Lett. 12, 22–33. doi: 10.1111/j.1461-0248.2008.01255.x
Green N. S., Li S., Maul J. D., Overmyer J. P. (2022). Natural and anthropogenic factors and their interactions drive stream community integrity in a North American river basin at a large spatial scale. Sci. Total Environ. 835, 155344. doi: 10.1016/j.scitotenv.2022.155344
Greenop A., Woodcock B. A., Outhwaite C. L., Carvell C., Pywell R. F., Mancini F., et al. (2021). Patterns of invertebrate functional diversity highlight the vulnerability of ecosystem services over a 45-year period. Curr. Biol. 31, 4627–4634. doi: 10.1016/j.cub.2021.07.080
Hallmann C. A., Sorg M., Jongejans E., Siepel H., Hofland N., Schwan H., et al. (2017). More than 75 percent decline over 27 years in total flying insect biomass in protected areas. PloS One 12, e0185809. doi: 10.1371/journal.pone.0185809
Hawkins C. P., Yuan L. L. (2016). Multitaxon distribution models reveal severe alteration in the regional biodiversity of freshwater invertebrates. Freshw. Sci. 35, 1365–1376. doi: 10.1086/688848
Herlihy A. T., Sifneos J. C., Hughes R. M., Peck D. V., Mitchell R. M. (2020). The relation of lotic fish and benthic macroinvertebrate condition indices to environmental factors across the conterminous USA. Ecol. Appl. 112, 105958. doi: 10.1016/j.ecolind.2019.105958
Hill R. A., Weber M. A., Leibowitz S. G., Olsen A. R., Thornbrugh D. J. (2016). The stream catchment (StreamCat) dataset: a database of watershed metrics for the conterminous United States. J. Am. Water Resour. Assoc. 52, 120–128. doi: 10.1111/1752-1688.12372
Houghton D. C. (2004). Biodiversity of Minnesota caddisflies (Insecta: Trichoptera): delineation and characterization of regions. Environ. Monit. Assess. 95, 153–181. doi: 10.1023/B:EMAS.0000029890.07995.90
Houghton D. C. (2012). Biological diversity of Minnesota caddisflies. ZooKeys Special Issues 189, 1–389. doi: 10.1023/B:EMAS.0000029890.07995.90
Houghton D. C. (2015). A 5-year study of the adult flight periodicity of 27 caddisfly (Trichoptera) species in forest and meadow habitats of a first-order Lower Michigan stream. Environ. Entomol. 44, 1472–1487. doi: 10.1093/ee/nvv138
Houghton D. C. (2018). When to sample adult caddisflies: data from a five-year study of a first-order Michigan (USA) stream. J. Freshw. Ecol. 33, 211–221. doi: 10.1080/02705060.2018.1431968
Houghton D. C. (2021). Assessment of stream conditions and anthropogenic disturbance of the northcentral United States. J. Freshw. Ecol. 36, 1–12. doi: 10.1080/02705060.2020.1861119
Houghton D. C., DeWalt R. E. (2021). If a tree falls in the forest: terrestrial habitat loss predicts caddisfly (Insecta: Trichoptera) assemblages and functional feeding group biomass throughout rivers of the northcentral United States. Landscape Ecol. 36, 3061–3078. doi: 10.1007/s10980-021-01298-4
Houghton D. C., DeWalt R. E., Hubbard T., Schmude K. L., Dimick J. J., Holzenthal R. W., et al. (2022). Checklist of the caddisflies (Insecta: Trichoptera) of the Upper Midwest region of the United States. ZooKeys 1111, 287–300. doi: 10.3897/zookeys.1111.72345
Houghton D. C., Holzenthal R. W. (2010). Historical and contemporary biological diversity of Minnesota caddisflies: a case study of landscape-level species loss and trophic composition shift. J. North Am. Benthological Soc. 29, 480–495. doi: 10.1899/09-029.1
Hughes R. M., Vadas R. L. Jr. (2021). Agricultural effects on streams and rivers: a western USA focus. Water 13 (14), 1901. doi: 10.3390/w13141901
Hynes H. B. N. (1975). The stream and its valley. Edgardo Baldi Memorial Lecture. Verhandlungen Der Internationalen Vereinigung Für Theoretische Und Angewandte Limnologie 19, 1–15. doi: 10.1080/03680770.1974.11896033
Isaak D. J., Luce C. H., Horan D. L., Chandler G. L., Wollrab S. B., Dubois W. B., et al. (2020). Thermal regimes of perennial rivers and streams in the western United States. J. Am. Water Resour. Assoc. 56, 842–867 doi: 10.1111/1752-1688.12864
Karaouzas C. T., Vourka A., Gritzalis K., Skoulikis N. T. (2019). Stream invertebrate communities are primarily shaped by hydrological factors and ultimately fine-tuned by local habitat conditions. Sci. Total Environ. 655, 290–299. doi: 10.1016/j.scitotenv.2019.02.134
Kobayashi S., Amano K., Najanishi S. (2013). Riffle topography and water flow support high invertebrate biomass in a gravel-bed river. Freshw. Sci. 32, 706–718. doi: 10.1899/12-080.1
Le Gall M., Martin Palt M., Jochem Kail J., Hering D., Piffady J. (2021). Woody riparian buffers have indirect effects on macroinvertebrate assemblages of French rivers, but land use effects are much stronger. J. Appl. Ecol. 59, 526–536. doi: 10.1111/1365-2664.14071
Lister B. C., Garcia A. (2018). Climate-driven declines in arthropod abundance restructure a rainforest food web. Proc. Natl. Acad. Sci. 115, E10397–E10406. doi: 10.1073/pnas.1722477115
MacArthur R. D., Wilson E. O. (2016). The theory of island biogeography (Princeton: Princeton University Press).
Macedo D. R., Hughes R. M., Ligeiro R., Ferreira W. R., Castro M. A., Junqueira N. T., et al. (2014). The relative influence of catchment and site variables on fish and macroinvertebrate richness in cerrado biome streams. Landscape Ecol. 29, 1001–1016. doi: 10.1007/s10980-014-0036-9
Marzin A., Verdonschot P. F. M., Pont D. (2012). The relative influence of catchment, riparian corridor, and reach-scale anthropogenic pressures on fish and macroinvertebrate assemblages in French rivers. Hydrobiologia 704, 375–388. doi: 10.1007/s10750-012-1254-2
McManamay R. A., Troia M. J., DeRolph C. R., Olivero Sheldon A., Barnett A. R., Kao S. C., et al. (2018). A stream classification system to explore the physical habitat diversity and anthropogenic impacts in riverscapes of the eastern United States. PloS One 13, e0198439. doi: 10.1371/journal.pone.0198439
McNeely J. A. (2003). Biodiversity in arid regions: values and perceptions. J. Arid Environments 54, 61–70. doi: 10.1006/jare.2001.0890
Meals D. W., Dressing S. A., Davenport T. E. (2010). Lag time in water quality response to best management practices: a review. J. Environ. Qual. 39, 85–96. doi: 10.2134/jeq2009.0108
Molles M., Sher A. (2018). Ecology: concepts and applications, 8th edition (New York, NY: McGraw-Hill Education).
Morse J. C., Frandsen P. B., Graf W., Thomas J. A. (2019). Diversity and ecosystem services of Trichoptera. Insects 10, 125. doi: 10.3390/2Finsects10050125
Moulton S. R., Stewart K. W. (1996). Caddisflies (Trichoptera) of the interior highlands of North America. Memoirs Am. Entomol. Institute 56, 1–313.
Myers M. J., Resh V. H. (1999). “Use of pan traps to collect adult Trichoptera in high desert spring habitats of California, USA,” in Proceedings of the 9th International Symposium on Trichoptera. Eds. Malicky H., Chantaramongkol P. (Chiang Mai: Faculty of Science, Chiang Mai University), 259–267.
Nakano A., Tanida K. (1999). “Species richness of Trichoptera in mountain streams in Japan: some practical and statistical tests to reveal the diversity in mother community,” in Proceedings of the 9th International Symposium on Trichoptera. Eds. Malicky H., Chantaramongkol P. (Chiang Mai: Faculty of Science, Chiang Mai University), 271–283.
Namayandeh A., Beresford D. V., Somers K. M., Dillon P. J. (2018). Difference in benthic invertebrate communities of headwater streams can be detected using a short elevation gradient. Int. Aquat. Res. 10, 153–164. doi: 10.1007/s40071-018-0197-2
Newman E. A., DeWalt R. E., Grubbs S. A. (2021). Plecoptera (Insecta) diversity in Indiana: a watershed-based analysis. Diversity 13, 672. doi: 10.3390/d13120672
Omernik J. M., Griffith G. E. (2014). Ecoregions of the conterminous United States: evolution of a hierarchical spatial framework. Environ. Manage. 54, 1249–1266. doi: 10.1007/s00267-014-0364-1
Patrick C. J., McGarvey D. J., Larson J. H., Cross W. F., Allen D. C., Benke A. C., et al. (2019). Precipitation and temperature drive continental-scale patterns in stream invertebrate production. Sci. Adv. 5, eaav2348. doi: 10.1126/sciadv.aav2348
Paulsen S. G., Mayio A., Peck D. V., Stoddard J. L., Tarquinio E., Holdsworth S. M., et al. (2008). Condition of stream ecosystems in the U.S.: an overview of the first national assessment. J. North Am. Benthological Soc. 27, 812–821. doi: 10.1899/08-098.1
Pearson C. E., Ormerod S. J., Symondson W. O. C., Vaughan I. P. (2016). Resolving large-scale pressures on species and ecosystems: propensity modelling identifies agricultural effects on streams. J. Appl. Ecol. 53, 408–417. doi: 10.1111/1365-2664.12586
Pereira R., Rodrigues G. G., Calor A. R., Vasconcelos S. D. (2020). Field assessment of the efficiency of two sampling techniques for adult caddisflies (Insecta: Trichoptera). Int. J. Trop. Insect Sci. 41, 903–908. doi: 10.1007/s42690-020-00255-z
Peterson I., Winterbottom J. H., Orton S., Friberg N., Hildrew A. G., Spiers D. C., et al. (1999). Emergence and lateral dispersal of adult Plecoptera and Trichoptera from Broadstone Stream, U.K. Freshw. Biol. 42, 401–416. doi: 10.1046/j.1365-2427.1999.00466.x
Piliére A., Schipper A. M., Breure T. M., Posthuma L., de Zwart D., Dyer S. D., et al. (2014). Unraveling the relationships between freshwater invertebrate assemblages and interacting environmental factors. Freshw. Sci. 33, 1148–1158. doi: 10.1086/677898
Pimm S. L., Jenkins C. N., Abell R., Brooks T. M., Gittleman J. L., Joppa L. N., et al. (2014). The biodiversity of species and their rates of extinction, distribution, and protection. Science 344, 1246752. doi: 10.1126/science.1246752
Quinn G. P., Keough M. J. (2002). Experimental Design and Data Analysis for Biologists (New York: Cambridge University Press).
RStudio Team (2022). RStudio: Integrated Development for R (Boston, MA: RStudio, PBC). Available at: http://www.rstudio.com/.
Sánchez-Bayo F., Wyckhuys K. A. G. (2019). Worldwide decline of the entomofauna: a review of its drivers. Biol. Conserv. 232, 8–27. doi: 10.1016/j.biocon.2019.01.020
Sangunett B. M. (2005). Reference Conditions for Streams in the Grand Prairie Natural Division of Illinois. M. S. Thesis (Urbana, IL: University of Illinois at Urbana-Champaign).
Santhi C., Allen P. M., Muttiah R. S., Arnold J. G., Tuppad P. (2008). Regional estimation of base flow for the conterminous United States by hydrologic landscape regions. J. Hydrol. 351, 139–153. doi: 10.1016/j.jhydrol.2007.12.018
Seeney A., Pattinson Z., Willby N. J., Boon P. J., Bull C. D. (2019). Stream invertebrate diversity reduces with invasion of riverbanks by non-native plants. Freshw. Biol. 64, 485–496. doi: 10.1111/fwb.13236
Sode A., Wiberg-Larson P. (1993). Dispersal of adult Trichoptera at a Danish forest brook. Freshw. Biol. 30, 439–446. doi: 10.1111/j.1365-2427.1993.tb00827.x
Sommerhauser M, Koch P, Robert B, Schumacher H (1999). Caddisflies as indicators for the classification of riparian systems along lowland streams. In: Malicky H, Chantaramongkol P (eds) Proceedings of the 9th International Symposium on Trichoptera; Jan 5–10 1998; Chiang Mai: Faculty of Science, Chiang Mai University, Thailand. p. 337–348
South E. J., DeWalt R. E., Cao Y. (2019). Relative importance of Conservation Reserve Programs to aquatic insect biodiversity in an agricultural watershed in the Midwest, USA. Hydrobiologia 829, 323–340. doi: 10.1007/s10750-018-3842-2
Stepanian P. M., Entrekin S. A., Wainwright C. E., Mirkovic D., Tank J. L., Kelly J. F. (2020). Declines in an abundant aquatic insect, the burrowing mayfly, across major North American waterways. Proc. Natl. Acad. Sci. U.S.A. 117, 2987–2992. doi: 10.1073/pnas.1913598117
Strahler A. N. (1957). Quantitative analysis of watershed geo-morphology. Trans. Am. Geophys. Union 38, 913–920. doi: 10.1029/TR038i006p00913
Tilman D., Clark M., Williams D. R., Kimmel K., Polasky S., Packer C. (2017). Future threats to biodiversity and pathways to their prevention. Nature 546, 73–81. doi: 10.1038/nature22900
Uhler J., Redlich S., Zhang J., Hothorn T., Tobisch C., Ewald J., et al. (2021). Relationship of insect biomass and richness with land use along a climate gradient. Nat. Commun. 12, 5946. doi: 10.1038/s41467-021-26181-3
van Klink R., Bowler D. E., Gongalsky K. B., Swengel A. G., Chase J. M. (2020). Meta-analysis reveals declines in terrestrial but increases in freshwater insect abundances. Science 368, 417–420. doi: 10.1126/science.aax9931
Wright D. R., Pytel A. J., Houghton D. C. (2013). Nocturnal flight periodicity of the caddisflies (Insecta: Trichoptera) in a large Michigan river. J. Freshw. Ecol. 28, 463–476. doi: 10.1080/02705060.2013.780187
Zhang Y., Xiaobo J., Jianing L., Chang Q., Gao X., Ding S. (2019). The relative importance of spatial scale variables for explaining macroinvertebrate richness in different aquatic ecological function regions. Water 11, 1550. doi: 10.3390/w11081550
Keywords: caddisflies (Trichoptera), species richness (alpha diversity), extirpation, upper midwest, species loss and extinctions
Citation: Houghton DC and DeWalt RE (2023) The caddis aren’t alright: modeling Trichoptera richness in streams of the northcentral United States reveals substantial species losses. Front. Ecol. Evol. 11:1163922. doi: 10.3389/fevo.2023.1163922
Received: 11 February 2023; Accepted: 24 July 2023;
Published: 09 August 2023.
Edited by:
Changku Kang, Seoul National University, Republic of KoreaReviewed by:
John Morse, Clemson University, United StatesCopyright © 2023 Houghton and DeWalt. This is an open-access article distributed under the terms of the Creative Commons Attribution License (CC BY). The use, distribution or reproduction in other forums is permitted, provided the original author(s) and the copyright owner(s) are credited and that the original publication in this journal is cited, in accordance with accepted academic practice. No use, distribution or reproduction is permitted which does not comply with these terms.
*Correspondence: David C. Houghton, dhoughton@hillsdale.edu
Disclaimer: All claims expressed in this article are solely those of the authors and do not necessarily represent those of their affiliated organizations, or those of the publisher, the editors and the reviewers. Any product that may be evaluated in this article or claim that may be made by its manufacturer is not guaranteed or endorsed by the publisher.
Research integrity at Frontiers

Learn more about the work of our research integrity team to safeguard the quality of each article we publish.