 Zimeng Song1
 Bing Chen
- 1School of Life Sciences, Institutes of Life Science and Green Development, Hebei University, Baoding, China
- 2Bureau of Forestry Pest Control and Quarantine of Yunnan Province, Kunming, China
- 3Key Laboratory of Zoological Systematics and Evolution, Institute of Zoology, Chinese Academy of Sciences, Beijing, China
Introduction: The genetic structure of species is shaped by natural (e.g., terrain, climate) and non-natural (e.g., human activities) factors. Geographical isolation and natural barriers are important causes of genetic structure formation of species. Here, we explored this issue in bamboo grasshopper, Ceracris kiangsu, which is an important pest that feeds on bamboo in East and Southeastern Asia.
Methods: Based on 186 newly sequenced and 286 previously sequenced mitochondrial COI fragments, and 8 nuclear microsatellite loci, we examined the genetic diversity and population genetic structure of C. kiangsu.
Results: The degree of genetic differentiation among populations was also high, and Mantel test showed that it was significantly correlated with geographical distance. Principal coordinate analysis and STRUCTURE results revealed two genetically different groups, a South China (S-China) Group and a Southeast Asia (SE-Asia) Group. Climate variables partly explained the population genetic structure. The demographic history and ABC showed that the S-China Group experienced population expansion, whereas the SE-Asia Group was consistently stable.
Discussion: Our study demonstrates an obvious population structure maintained in this migratory insect and reveals the potential effect of past climatic change, geographical isolation, and ecological factors on the evolution of their genetic structure.
1. Introduction
The genetic structure of a species is shaped by several natural and non-natural factors. Geological processes and recent human disturbances play a widespread role in driving the extensive population genetic structure of most existing species (Avise, 2000; Heller et al., 2015). Climate change, especially Holocene climate warming, has greatly changed biodiversity. Species had variable responses to Holocene climate fluctuations, thus altering their genetic structure, population expansion, and regional adaptation (e.g., Song et al., 2016, 2020; Liu et al., 2020).
Geographical isolation and natural barriers are also known to have had important influences on the formation of the genetic structure of species. For example, three divergent lineages of the strider Metrocoris esakii could have evolved from geographical isolation (Ye et al., 2020). However, some species are highly migratory, and populations are expanding with frequent seasonal outbreaks. The wide dispersal and frequent outbreaks may overcome the limitations of natural isolation and barriers. A couple of studies found that the gene flow in outbreak populations moderately increases, resulting in serious homogenization (Chapuis et al., 2009, 2010). However, how the migratory capacity and outbreak nature of a species evolutionarily shape genetic structure remains controversial (Tao et al., 2012).
Assessing how ecological differences among contemporary populations affect the geographic structure of intraspecific genetic variation is of great significance for pest management and predicting the response of populations to climate change (Thomas, 1999; Chen et al., 2017, 2018). Here, we attempted to resolve this issue with the bamboo grasshopper, Ceracris kiangsu.
Ceracris kiangsu is an insect species that belongs to Orthoptera. It mainly feeds on bamboo leaves, and thus is an important bamboo forest pest (Xuan et al., 2009). Although the spectrum of plants on which they feed is very narrow, these grasshoppers possess a powerful flight capacity and are able to fly 7.8 km per day. Therefore, their populations have frequently expanded to new regions and crossed country borders. This insect is now thriving in East Asia and Southeast Asia, including China, Laos, and Vietnam. Just between 2014 and 2020, the bamboo grasshopper has had successive outbreaks in Laos, Vietnam, and many places in China (Fan et al., 2014). Thus, the bamboo grasshopper provides a good model to investigate the effects of dispersal and population outbreaks on the evolution of genetic structure among populations.
The wide-range dispersal of the bamboo grasshopper had caused a large amount of bamboo death in bamboo forests. However, because of their high flight capacity and migratory nature, chemical sprays presented limited control of this pest. Moreover, it is difficult to predict the occurrence and dispersal of the grasshopper populations for effective prevention and control because of our limited knowledge of the population structure, ancestral source, and dispersal route of the bamboo grasshopper. Previous studies found that the bamboo grasshoppers are monophyletic with low population differentiation and genetic diversity, and have no significant correlation with geographical distance (Fan et al., 2014; Liu et al., 2016). Microsatellite data showed that historical genetic exchange was frequent, and most of the genetic variation among individuals was within populations (Liu et al., 2016). However, these studies only involved limited sampling of the species’ distribution. They investigated populations from 13 provinces in southern China; however, this species has a wide distribution and frequent population outbreaks outside of China, such as in the China–Indochina Peninsula. Specific population genetic structure and phylogeography of C. kiangsu may be shaped by the complex environments in their wide distribution range in eastern and southeast Asia. Furthermore, the origin and migration paths of the bamboo grasshopper also remain unknown.
Here, we attempted to resolve these issues by expanding the sampling sites to include the full distribution range of this species and using different genetic markers. The main objective of this research was to examine: (1) the genetic structure of the bamboo grasshopper, (2) the historical dynamics of population size, and (3) the driving forces of the genetic evolution of the bamboo grasshopper. The findings will elucidate the role of migration in shaping the genetic structure of a highly bamboo grasshopper, facilitate our understanding of the origin of this pest and help to predict their outbreaks.
2. Materials and methods
2.1. Sampling and DNA extractions
In this study, 192 specimens from 10 geographic populations were collected. These 10 geographical populations were collected from 7 provinces in China, as well as Laos and Vietnam, with large-scale random sampling. Although there were two geographic populations in Yunnan Province, China, the results showed that they were not all sibling (Supplementary Table S1 in Supplementary material for specimen information and Figure 1). All specimens were stored in absolute ethanol and stored at −20°C. The whole genome DNA of the hind foot femoral joint muscle of the bamboo grasshopper was extracted by the “salting out method” (Sunnucks and Hales, 1996). The concentration and purity of the genomic DNA were detected with an ultra-micro spectrophotometer (Thermo Scientific Nano Drop 2000c, USA). Then, the DNA was diluted to 50–100 ng/μL and stored in a freezer at −20°C.
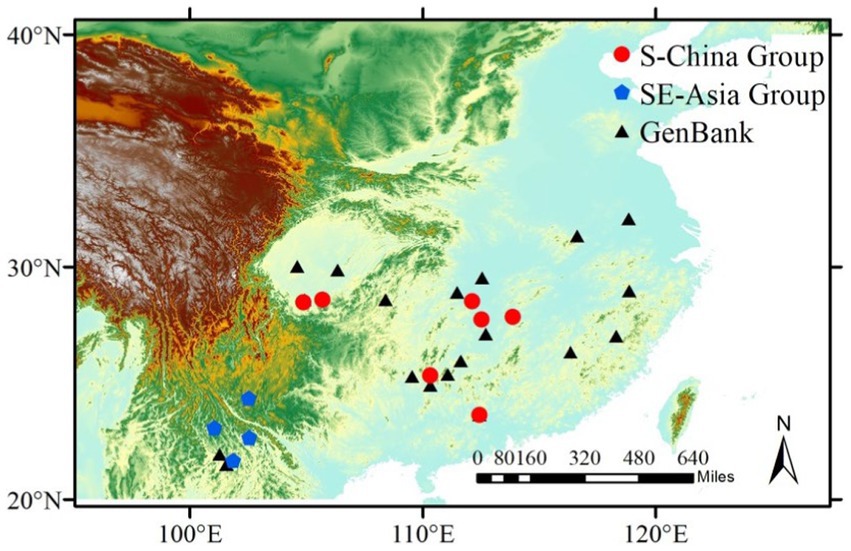
Figure 1. Sampling locations of the bamboo grasshopper. Localities of GenBank samples (black triangles) are derived from information for mitochondrial sequences used in the National Center for Biotechnology Information (NCBI) (Supplementary Table S2). S-China Group (red circles) represents samples obtained in this study and belonging to the cluster S-China Group in population structure (also see Figure 4). SE-Asia Group (blue pentagons) represents samples obtained in this study and belonging to the cluster SE-Asia Group in population structure.
2.2. PCR amplification and sequencing
The primers of the mitochondrial cytochrome oxidase subunit I (COI) gene were: 5′-TYTCAACAAAYCAYAARGATATTGG-3′ and 5′-TAAACTTCWGGRTGWCCAAARAATCA-3′ (Pan et al., 2006). PCR of mitochondrial mtDNA COI gene sequences was carried out on a ProFlex PCR instrument (Thermo Fisher Scientific, USA). The total reaction system was 15 μL, which included 1 μL genomic DNA, 0.6 μL upstream primer (10 μM), 0.6 μL downstream primer (10 μM), 7.5 μL Taq MasterMix (with 0.05 U/μL Taq DNA Polymerase, 2× Taq PCR Buffer, 400 μM dNTP mix, and 3 mM MgCl2) (CW Biotechnology Co., Beijing, China), and 5.3 μL sterilized double distilled water. The PCR procedure was as follows: pre-denaturation at 94°C for 2 min; denaturation at 94°C for 30 s, annealing at 54°C for 30 s, and extension at 72°C for 30 s for a total of 35 cycles; and final extension at 72°C for 2 min. The sequences were spliced using SeqMan ver. 7.1.0 software (DNAStar, Inc., USA). The amplified mtDNA COI gene sequences were routinely sequenced, and sequence identity was checked using Basic Local Alignment Search Tool (BLAST) on the National Center for Biotechnology Information (NCBI) website.1
In microsatellite loci analysis, we screened the 12 pairs of previously reported microsatellite sequence primers (Xuan et al., 2009), and selected the 8 pairs with strong specificity (Supplementary Table S2). The total reaction system for microsatellite labeling was 15 μL, which included 0.9 μL genomic DNA, 0.3 μL upstream primer with M13 (10 μM), 1.2 μL downstream primer (10 μM), 1.2 μL with FAM green fluorescent M13 primer (10 μM), 8 μL Es Taq Master Mix (with 0.05 U/μL Es Taq DNA Polymerase, 2 × Taq PCR Buffer, 400 μM dNTP mix, and 3 mM MgCl2), and 3.4 μL sterilized double distilled water. The PCR procedure was as follows: pre-denaturation at 94°C for 3 min; denaturation at 94°C for 30 s, annealing for 30 s (different primers have different annealing temperatures, see Supplementary Table S3 for details), and extension at 72°C for 30 s for a total of 35 cycles; denaturation at 94°C for 30 s, annealing at 53°C for 45 s, and extension at 72°C for 45 s for a total of 10 cycles; and final extension at 72°C for 10 min. The microsatellite primer products were sequenced by capillary electrophoresis (Sangon Biotech Co., China).
2.3. Mitochondrial COI analysis
Sequences of the 187 captured specimens (GenBank: OP341003-OP341189) and 286 GenBank sequences were obtained for genetic diversity statistics analysis (Supplementary Tables S1, S3). A nuclear mitochondrial pseudogene was discovered and eliminated it in the subsequent analysis. Haplotype diversity (Hd), nucleotide diversity (π), and the mean number of pairwise differences were calculated, not considering gaps, to estimate DNA polymorphism using DnaSP ver. 5.10.01 (Librado and Rozas, 2009). Analysis of molecular variance (AMOVA) was performed using Arlequin ver. 3.5 (Excoffier and Lischer, 2010) with 10,000 permutations based on populations and groups. A TCS network was constructed with the software Pop ART ver. 1.7 (Leigh and Bryant, 2015). Signatures of population demographic changes were tested for specimens in this study. First, Tajima’s D and Fu’s Fs statistics were calculated by Arlequin ver. 3.5, with the deviation from neutrality determined from 10,000 coalescent simulations. Second, mismatch distributions of pairwise sequences were calculated using DnaSP software.
We constructed a haplotype phylogenetic tree in BEAST ver. 1. 10.4 (Suchard et al., 2018). The substitution model was selected using IQtree ver. 2.1.3 (Minh et al., 2020). Samples were drawn every 10,000 steps for 500 million steps under an uncorrelated lognormal relaxed clock model (Drummond and Rambaut, 2007) with a burn-in of 20%. Ceracris nigricornis and C. versicolor (GenBank accession numbers: JX840317.1, NC_025285.1) were selected as outgroups of C. kiangsu because they are phylogenetically sister species. Ceracris nigricornis differentiated from its sister species C. kiangsu 43.04 million years ago (Mya), and C. versicolor separated from C. kiangsu and C. nigricornis 44.81 Mya (Gao et al., 2018). The substitution rate was set to 1.77% per million years (Papadopoulou et al., 2010). All other parameters used were default values. To generate a tree with maximum credibility and 95% highest posterior density (HPD), trees were summarized by TreeAnnotator ver. 2.5.1 (Bouckaert et al., 2014). The resulting tree was visualized using FigTree ver. 1.4.2 (Rambaut, 2018).
To estimate the pattern of population size changes through time, Bayesian skyline plots (BSPs) implemented in BEAST were constructed. The outgroup taxa, which were for haplotype phylogenetic construction, were excluded from the time dating analysis. We ran BSP analyses separately for each group using the same data and settings as for the dating analyses with ‘GTR + I + G’ and ‘HKY + I’ as the substitution models selected by IQtree. The piecewise-linear skyline model and 10 groups were selected for Bayesian skyline coalescent tree priors (Drummond et al., 2005). All other parameters used were default values. Using effective sample size (ESS > 200) as an indicator, demographic plots were evaluated in Tracer ver. 1.5 (Rambaut et al., 2018) with a burn-in of 10%.
2.4. Microsatellite genotyping and statistical data analysis
2.4.1. Genetic diversity analysis
According to population and locus order, GenALEX ver. 6.503 (Peakall and Smouse, 2006) was used to convert data into format files required by analysis software in Excel 2010. GENEPOP ver. 4.7 (Rousset, 2008) detects Hardy–Weinberg equilibrium and the p value of each population. Genetic diversity of geographical populations and loci, such as the number of alleles (Na), number of effective alleles (Ne), observed heterozygosity (Ho), expected heterozygosity (He), inbreeding coefficient (FIS), and polymorphism information content (PIC), were calculated with POPGENE ver. 1.3.1 (Yeh et al., 1999). POPGENE calculated the population FIS, population differentiation coefficient (FST), and gene flow [Nm = (1 − FST/4 FST)] of 8 microsatellite loci, and calculated the FST matrix among various populations of the bamboo grasshopper.
We estimated the geographical distance based on the longitude and latitude data of the sampling site and conducted a Mantel test based on GenALEX to infer the relationship between Slatkin’s linearized FST and geographical distance; this allowed us to determine whether the observed genetic differentiation pattern conformed to the isolation by distance model. Principal coordinate analysis (PCoA) was carried out to show the genetic distance among C. kiangsu populations by GenALEX (Belkhir et al., 2004; Peakall and Smouse, 2006).
2.4.2. Structure analysis
The population structure of the 10 populations was constructed by Bayesian clustering analysis of STRUCTURE ver. 2.3.4 (Porras-Hurtado et al., 2013). We used the mixed ancestral model without any population information to analyze and determine the number of groups; each K value was calculated 10 times, with 1,000,000 Markov chain Monte Carlo iterations and a burn-in of 100,000. Subsequently, the optimal value of group number K was determined with the online analysis website “structure harvest”.2 The software CLUMPP ver. 1.1 (Jakobsson and Rosenberg, 2007) was used to conduct model averaging of individual ancestry coefficients across 10 independent runs. Next, clusters were visualized using DISTRUCT ver. 1.1 (Rosenberg, 2004). According to the results of the STRUCTURE, we determined the genetic structure of the populations. Additionally, using Arlequin, based only on the variation of three levels among various groups, AMOVA was performed among various groups, within each group, and among individuals within each population for 10,000 permutations.
2.4.3. Population history by approximate Bayesian computation frame modeling
In order to explore the historical differentiation and possible historical dynamics of the populations, as implemented in DIYABC ver. 2.1.0, we performed ABC to explore the population history using the method based on the SSR sequence data (Cornuet et al., 2014). Based on the Bayesian clustering results, 10 populations are divided into two groups, namely, the southern group of China is N1, and the southeast group is N2. We analyzed its historical model (Figure 2B). We built a scenario to simulate the dynamics of population structure. All STRUCTURE clusters are considered as different groups, and 1,000,000 simulation data sets were run for the scenario. We analyzed the SSR dataset by using DIYABC v2.1.0 (Cornuet et al., 2014). In the model, it was the bifurcation time between the ancestral populations, and N1 + N2 was the effective population size of the common ancestor of the species.
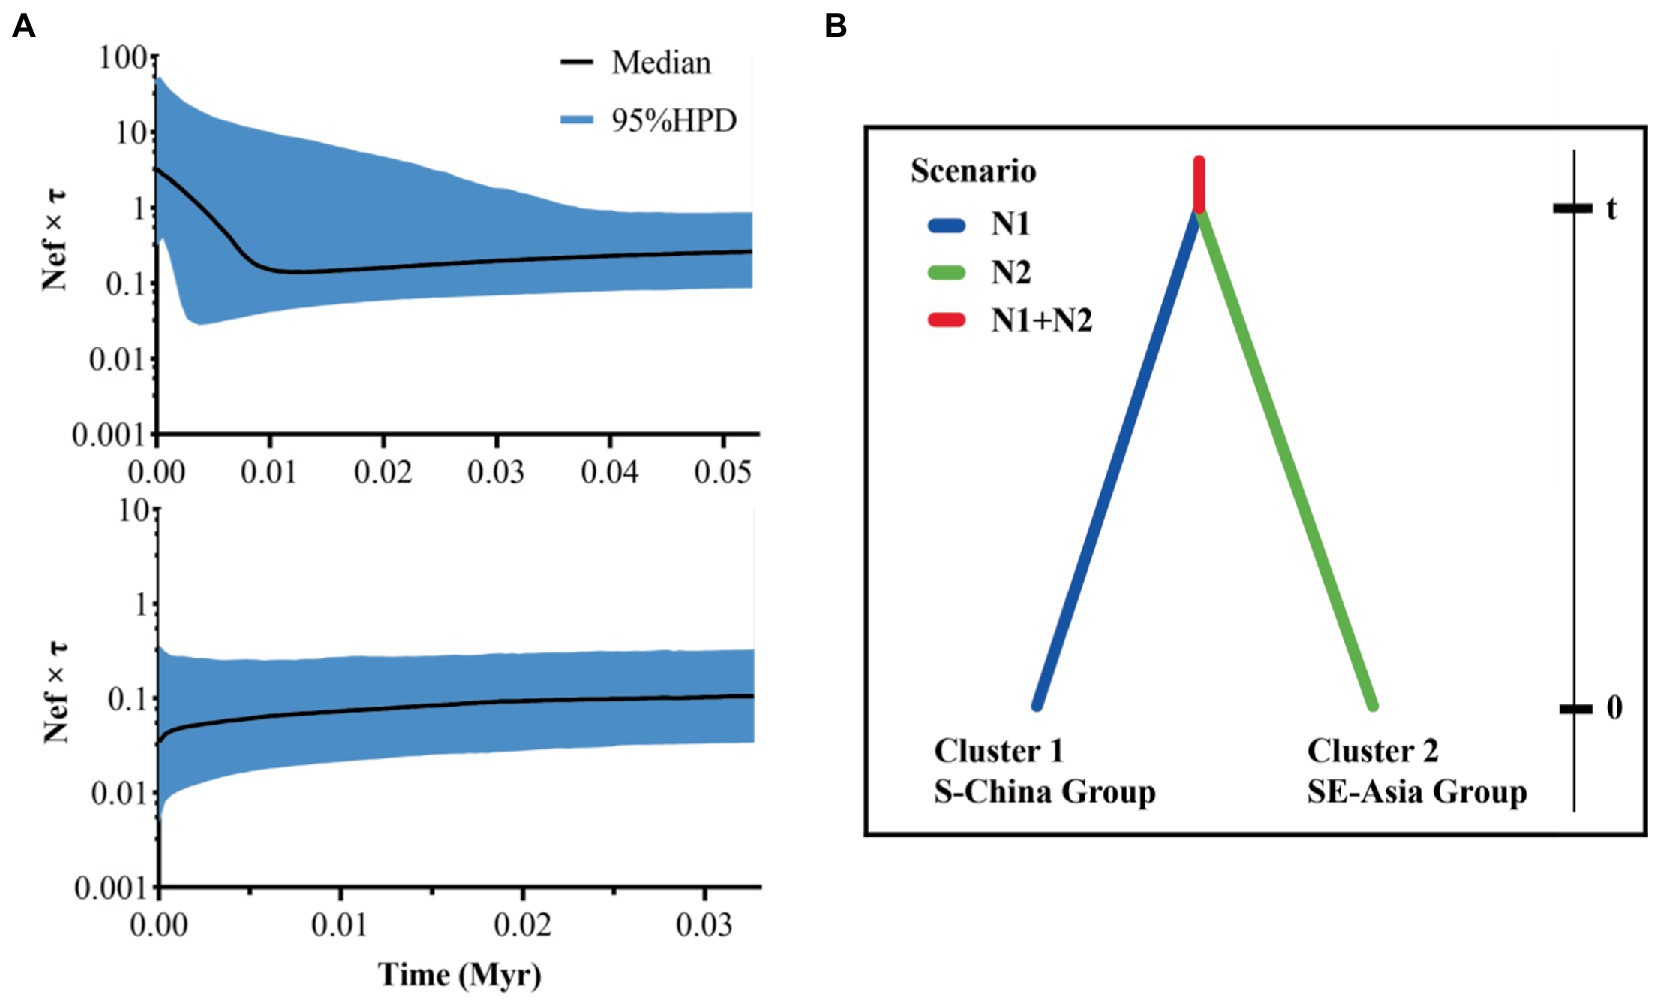
Figure 2. Bayesian skyline plots (A) and divergent models (B) based on existing assumptions. For Bayesian skyline plots (A), above is about the S-China Group, and below is about the SE-Asia Group; middle lines represent median estimates of the effective population size (Nef) multiplied by the generation time (τ) in years, and shaded areas represent 95% highest posterior densities (95% HPD); Nef × τ is presented on a logarithmic scale. For divergent models (B), t is divergence time of N1 and N2; N1 and N2 are effective population sizes of clusters 1–2 of C. kiangsu, respectively.
2.5. Niche comparison
To quantify the niche comparisons between two groups identified by the genetic structure, 19 climatic variables (BIO1–19) at 10 sampling point records were extracted. Furthermore, we looked for differences in the S-China Group and SE-Asia Group. ArcGIS ver 10.2 software and climate layers downloaded from the global climate data3 were used to obtain the historical climate factor data.
Additionally, we used a multivariate approach of redundancy analysis (RDA) to estimate the extent to which the differences in microsatellite genotypes are explained by climate and geography and their collinear parts (spatial autocorrelation climate change). RDA is a constrained linear ranking method combining multiple linear regression and PCA (principal component analysis). In order to explain the genetic structure, we added two values of group variables: S-China Group and SE-Asia Group. Climate and group variables were classified as environmental conditions. Convert longitude and latitude coordinates into principal components of neighborhood matrix (PCNM) using the function PCNM in vegan R package (Ter Braak, 1986; R Core Team, 2014). In order to avoid high risk, we exclude variables with variance expansion coefficient (VIF) greater than 10. When all VIF values were lower than 10, three PCNM vectors and four climate variables remained including three temperature-related (BIO2, mean monthly temperature range; BIO10, mean temperature of warmest quarter; and two precipitation-related (BIO16, precipitation of wettest quarter; BIO19, precipitation of coldest quarter) variables. Both full (climate and geography) and partial (climate) models of RDA were analyzed in the R package. The collinear ratio is calculated by subtracting the independent influence of climate and geography from the total variance explained in the complete RDA model (Cao et al., 2019).
3. Results
3.1. Genetic diversity
3.1.1. Mitochondrial DNA
We first examined genetic variability by sequencing a 567-bp fragment of the mtDNA COI gene in 473 bamboo grasshopper individuals that were sampled from 30 geographic populations in 14 provinces. A total of 122 haplotypes were identified. Genetic diversity indices, including Hd and π, are shown in Table 1. Average Hd and π were 0.744 ± 0.0191 and 0.1064 ± 0.00123, respectively. The highest genetic diversity (Hd = 0.983 ± 0.028, π = 0.04215 ± 0.01679) was detected in the northeast population, Anhui (Table 1). In contrast, the genetic diversity was lowest in three of the southwest populations, i.e., Yunnan, Laos, and Vietnam.
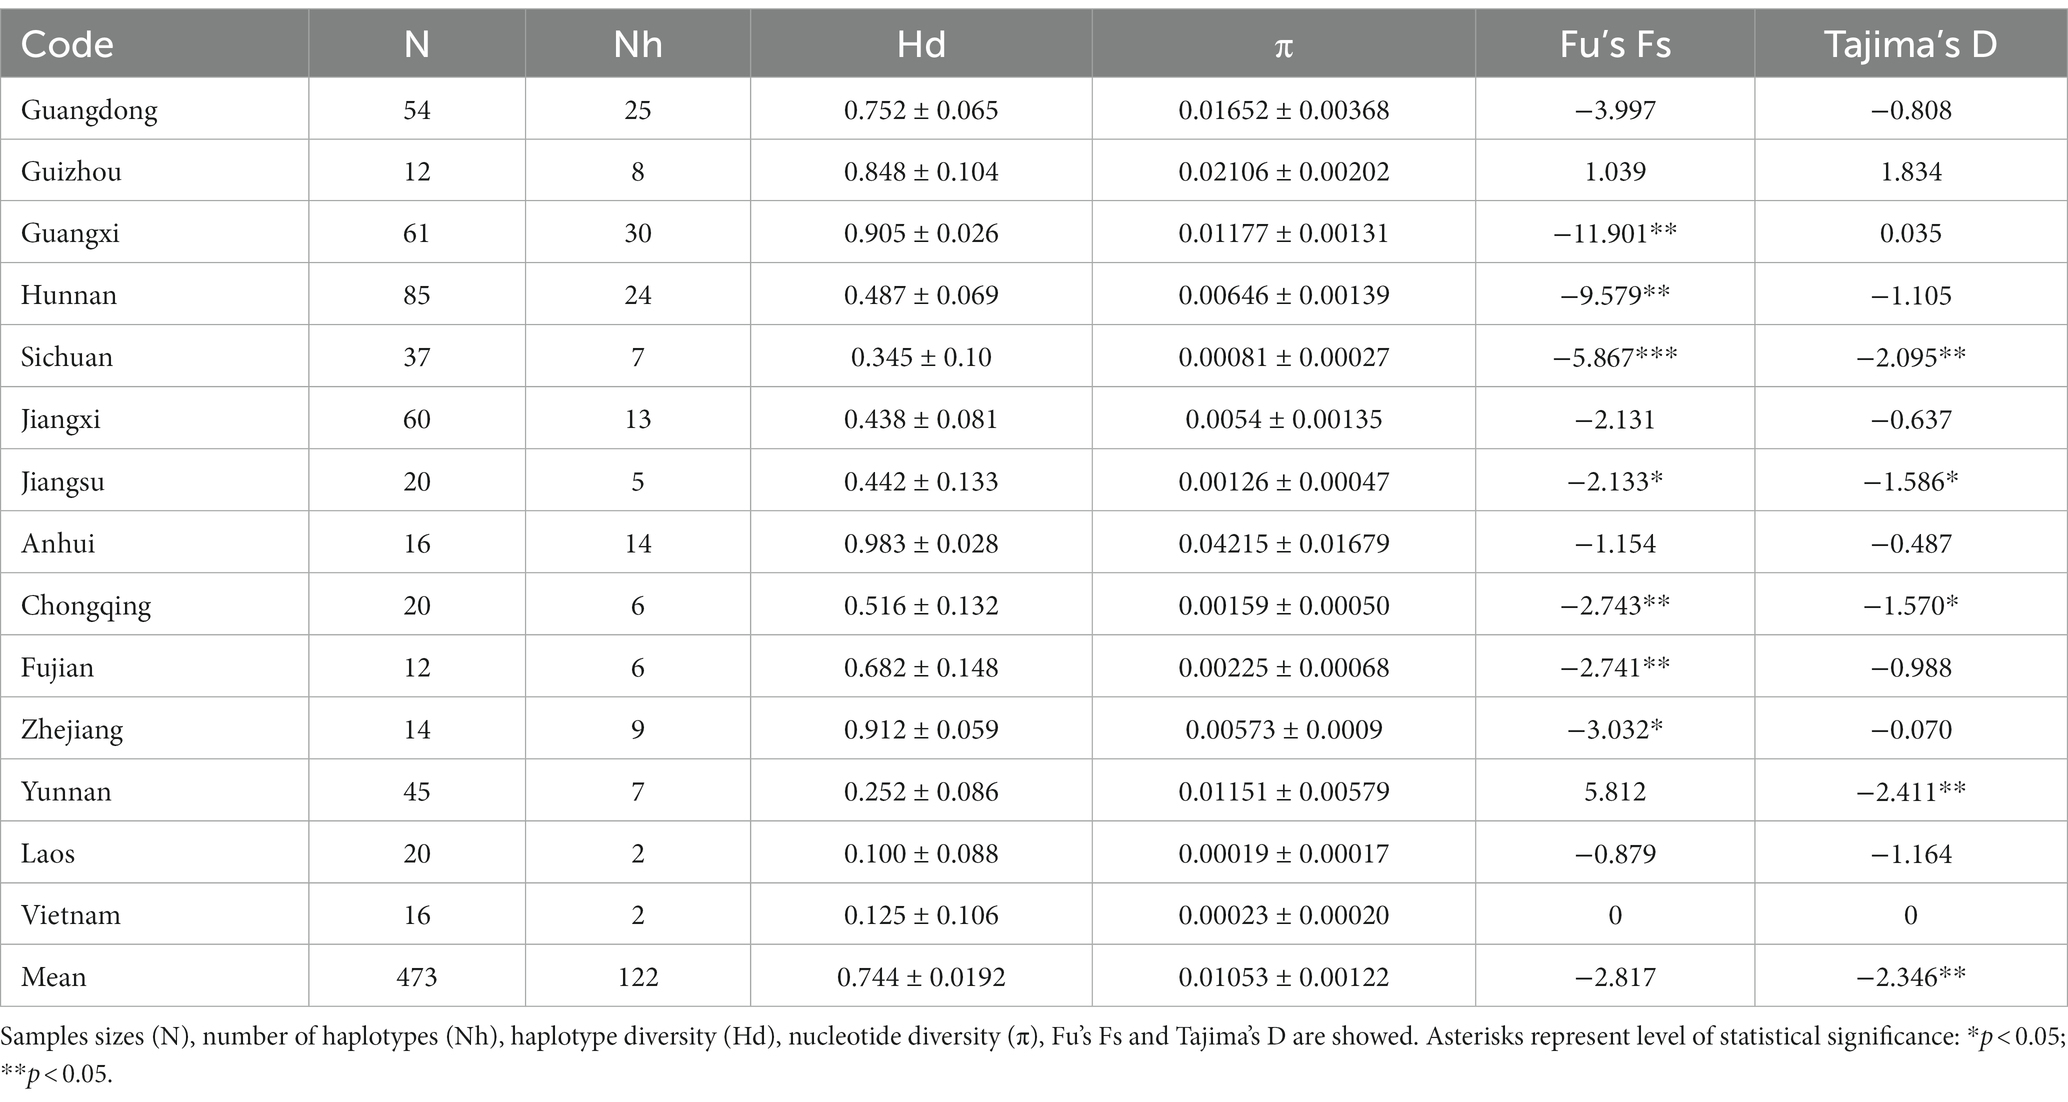
Table 1. Summary of genetic diversity based on mitochondrial DNA (mtDNA) in the bamboo grasshopper (C. kiangsu).
3.1.2. Microsatellite DNA
We also analyzed genetic variation by genotyping 192 individuals collected from 10 geographic populations using eight microsatellite loci. These microsatellite loci showed significant deviation from Hardy–Weinberg equilibrium (Chi-Square test, p < 0.05). These loci were also highly polymorphic, with PIC values ranging from 0.471 to 0.864 (Supplementary Table S4). Thus, these microsatellite loci could provide rich genetic variation information and be used as effective genetic markers for population genetic diversity analysis.
We evaluated the genetic diversity of populations using six different parameters. The Na among populations ranged from 4.750 to 17.375, the Ne from 3.700 to 9.089, and the PIC values from 0.563 to 0.853, which all revealed a diverse degree of polymorphism across the 10 populations (Table 2). The average HO ranged from 0.331 to 0.750, with the lowest in the southwest population, Laos, and the highest in the southeast population, Guangdong. HO was generally lower than He in all populations, indicating insufficient heterozygosity. FIS, the proportion of variance in the subpopulation contained in an individual, ranged from 0.046 (Guangdong) to 0.525 (Laos). The results illustrated that the four southwest populations, i.e., Yuxi, Puer, Laos, and Vietnam, had low genetic diversity and might have undergone frequent inbreeding, especially in Laos.
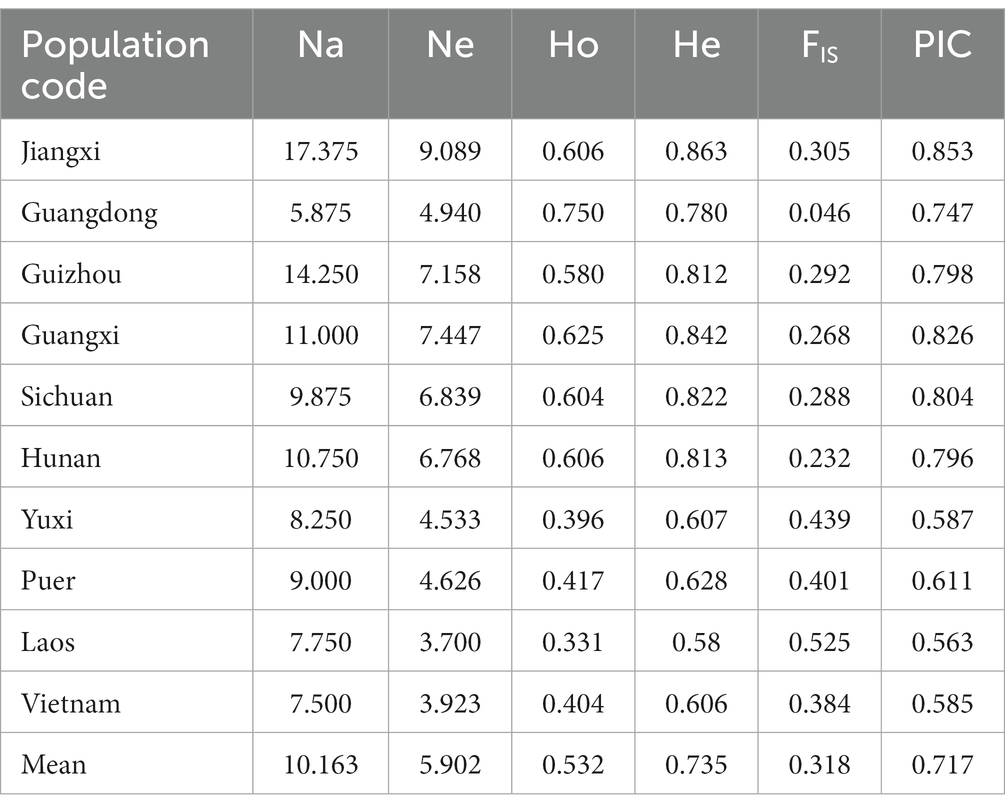
Table 2. Genetic diversity on microsatellite data in the bamboo grasshopper.
3.2. Phylogenetic analysis and TCS network
We reconstructed the phylogenetic tree using Bayesian Inference based on 128 haplotypes from the 473 mitochondrial COI gene sequences with gaps considered. The results showed that all haplotypes were split into two groups: a small-group branch including four haplotypes, Hap 54 (Yunnan), Hap 91, Hap 92 (Guangdong), and Hap 128 (Anhui), and a large-group branch including all the other haplotypes (Supplementary Figure S1). The differentiation time of different haplotypes was 31.95 Mya (HPD: 21.63–41.76 Mya), which was estimated by comparison with the two outgroups, i.e., Hap29 from its sister species C. nigricornis and Hap30 from C. versicolor.
We also performed haplotype network analysis based on 122 haplotypes with gaps excluded from analysis. The TCS network presented a star pattern, in which the most common haplotype (Hap 1) was located in the center, and other haplotypes were generally connected to it in a star-like pattern (Figure 3). This pattern was consistent with the phylogenetic analysis (Supplementary Figure S1). Hap 1 was distributed in all populations except for the four southwest populations (Yuxi, Puer, Laos, and Vietnam). However, the second most common haplotype (Hap 3) was concentrated and only shared among the four southwest populations and the neighboring Guangxi population; it did not exist in other populations. The two southern neighboring populations, i.e., the Guangxi and Guangdong populations, had the highest number of haplotypes, with 30 and 25 haplotypes, respectively. In addition, the Guangdong population possessed the most shared haplotypes (7) and the Guangxi population harbored the most unique haplotypes (24).
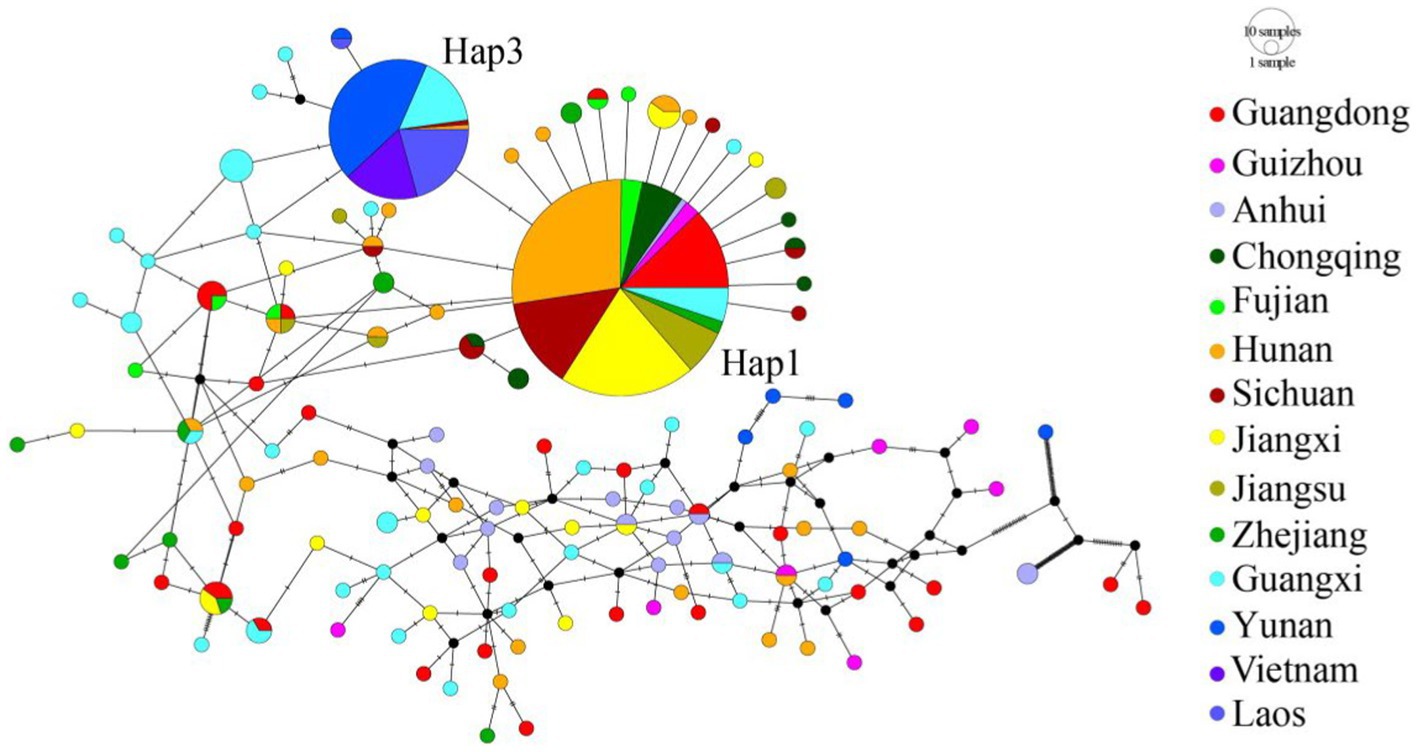
Figure 3. TCS haplotype networks for the mtDNA COI. Each line segment between haplotypes represents a single mutation. Black circles represent extinct or unsampled haplotypes. Size of the circles is scaled approximately to haplotype frequencies. Different colors represent different geographic populations. Population codes were given in Supplementary Tables S1, S2.
3.3. Genetic differentiation
To study genetic differentiation between populations based on the microsatellite data, we calculated FST values and gene flow (Nm) for population pairs. The degree of genetic differentiation between the six northeast populations, i.e., Jiangxi, Guangdong, Guizhou, Guangxi, Sichuan, and Hunan, was not significant, and most FST values were less than 0.05. The results demonstrated low genetic differentiation, and thus possible frequent gene exchange between these northeast population pairs (Table 3). The results of genetic differentiation between the four southwest populations, i.e., Yuxi, Puer, Laos, and Vietnam, also revealed low genetic differentiation.
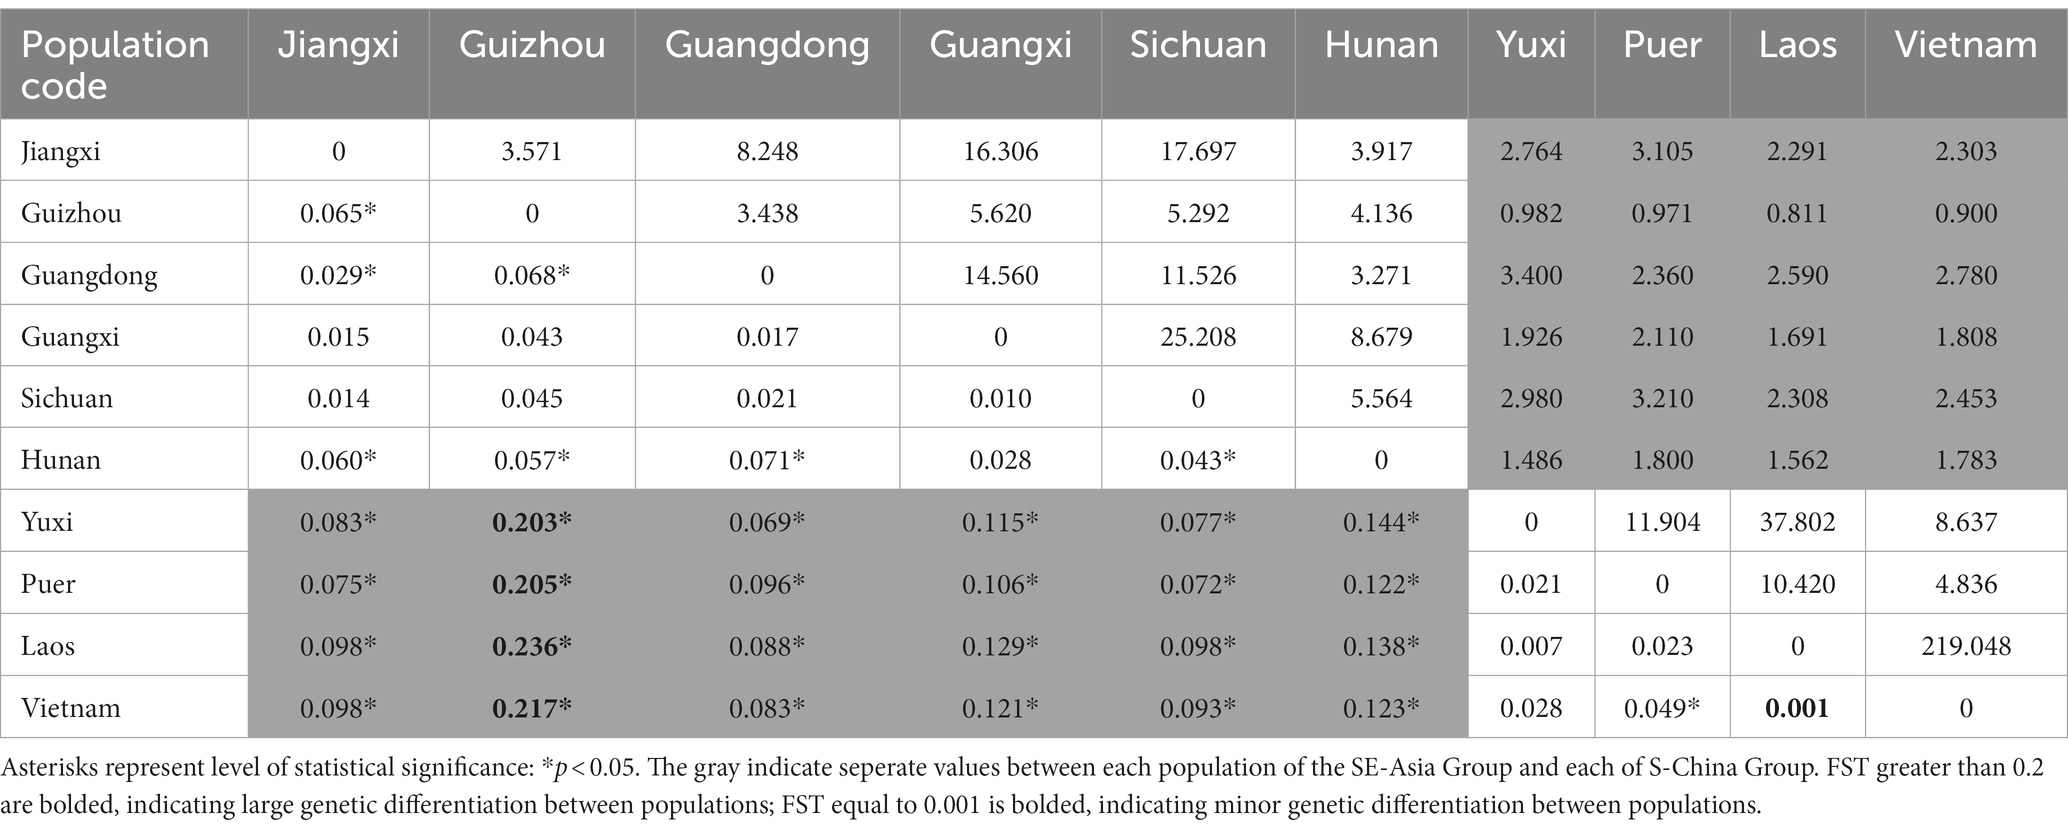
Table 3. Coefficient matrix representing genetic differentiation (FST, lower left) and gene flow (Nm, upper right) in the ten bamboo grasshopper populations.
In contrast, there was a great degree of genetic differentiation between the population pairs of the six northeast populations and the four southwest populations (FST > 0.05, p < 0.05). FST values varied from 0.001 (Laos–Vietnam) to 0.236 (Guizhou–Laos, p < 0.05). Nm varied from 0.811 (Guizhou–Laos) to 219.048 (Laos–Vietnam). Moreover, the genetic differentiation between Guizhou and the four southeast populations was the largest (FST > 0.15, p < 0.05). The results indicated that there was much less gene exchange between Guizhou, the west central region, and the four southeast populations; however, there was frequent gene exchange between the two neighboring Southeast Asia regions, Laos and Vietnam.
3.4. Population genetic structure
3.4.1. Microsatellite DNA
We then analyzed population genetic variation by PCoA using allele frequencies of the eight microsatellite markers. PCoA 1 explained 24.23% genetic variance and divided the 10 populations into two groups: the Southern China (S-China) Group, which included the six northeast populations, namely Jiangxi, Guizhou, Guangdong, Guangxi, Sichuan, and Hunan, and the Southeast Asia (SE-Asia) Group, which included the four southeast populations, namely Yuxi, Puer, Laos, and Vietnam (Figure 4A). This clustering pattern was consistent with the genetic differentiation results; that is, the genetic differentiation was low within the S-China Group and SE-Asia Group, but was large between the two groups.
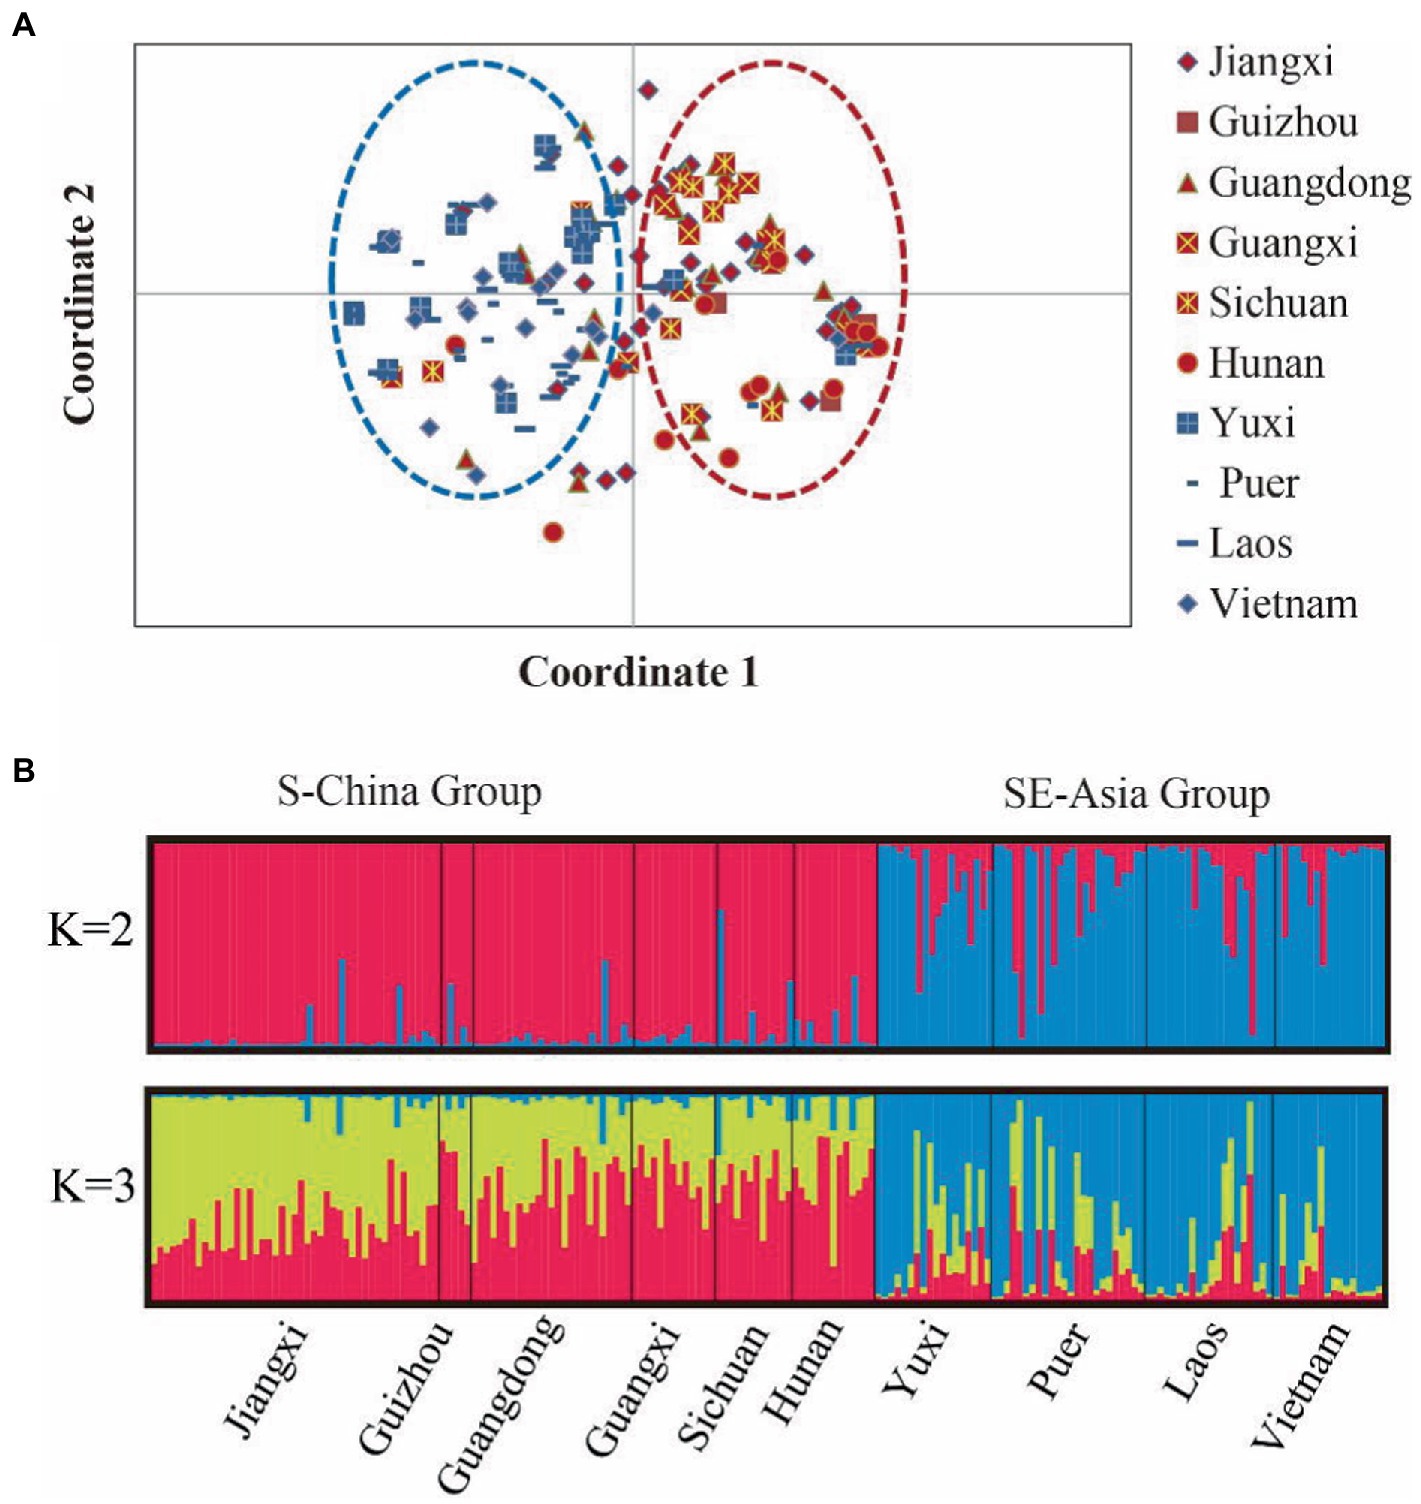
Figure 4. The genetic structure within 10 populations of the bamboo grasshopper. (A) Principal coordinates analysis of the 10 populations. Population codes are listed in Supplementary Table S1. (B) Bayesian assignment proportions for K = 2 and K = 3 clusters determined in STRUCTURE software.
We next analyzed the genetic structure of these 10 populations using Bayesian cluster analysis performed in STRUCTURE 2.3.4 (Figure 4B). The mean LnP (D) values slowly increased starting from K = 2, likely representing the most appropriate number of major clusters. The maximum ΔK was reached at K = 2 (Supplementary Figure S2). Consistent with PCoA, two clusters were identified among the samples, and the individuals in each cluster were similar to those in the corresponding PCoA. This further confirmed the accuracy of population genetic structure.
We also assessed population diversity and structure using AMOVA and F-statistics estimates based on microsatellite data. The global AMOVA indicated that the majority of genetic variance was partitioned within individuals (92.92%), and the remaining genetic variation (7.08%) could be explained by the variation among populations (Supplementary Table S5). The hierarchical AMOVA revealed a similar population structure (overall FST = 0.031; p < 0.001), with 7.17% of the genetic variation distributed between two groups (FCT = 0.072; p < 0.01) and less than 3% distributed among populations within the two groups (FSC = 0.100; p < 0.001). The remaining 90% of the genetic variation was found within populations. By comparing AMOVA results, we found that most of the variation was within populations, and the rest existed between the two groups.
3.4.2. Mitochondrial DNA
We then analyzed the population genetic variation based on mitochondrial DNA data. The global AMOVA indicated that greater genetic variance was partitioned within individuals (80.81%), and the remaining genetic variation (19.19%) could be explained by the variation among populations (Supplementary Table S5). The hierarchical AMOVA of the bamboo grasshopper showed similar population structure (overall FST = 0.245; p < 0.000), with 9.61% of the genetic variation distributed between two groups (FCT = 0.096; p < 0.05). Nearly 15% of the genetic variation was distributed among populations within the 2 groups (FSC = 0.0164; p < 0.001). The remaining 75% of the genetic variation was found within populations. These results indicated significant genetic differences within the populations and shallow differentiation among populations.
There were some similarities and differences between mitochondrial DNA and microsatellite results. Similarly, most of the differences were concentrated within the populations. However, the microsatellite results showed that, except for the large differences within individuals, differences were concentrated among groups; alternatively, the mitochondrial results revealed that a greater degree of difference existed among populations.
3.5. Demographic history
We analyzed the population expansion history. The populations had significantly negative Tajima’s D and Fu’s Fs values (Table 1), indicating population size expansion during the bamboo grasshopper’s evolutionary history. The unimodal mismatch distribution was strongly biased toward low divergence values, which demonstrated a recent demographic expansion from a small number of ancestors or a range expansion with high levels of migration between neighboring demes (Figure 2). The BSP of effective population size changed with time and remained stable for a long period, followed by a sharp rise 10 thousand years ago (Kya) in the S-China Group (Figure 2A). In contrast, the SE-Asia Group showed no population expansion in the Holocene (from 11.7 Kya to present) (Figure 2A). The BSP results indicated that the recently expanded ancestors of the bamboo grasshopper may have originated from the S-China Group.
Based on the detection of two clusters (N1 and N2) by STRUCTURE analysis (Figure 2B), ABC demographic analysis found that the population size of N1 was about 5.5 times that of N2. The population size relationship was similar to the result of effective population size estimation of mitochondrial COI gene (N1 > N2). The divergence of the ancestral lineage forming clusters N1 and N2 occurred about 865 generations ago (97.5% HPD: 230–5,210, Table 4). The generation time of the bamboo grasshopper was calculated based on their sexual maturity time of about 8 months (Liu et al., 2018). The results showed that the divergence between N1 and N2 clusters and the ancestral lineage occurred at about 1.30kya (97.5% HPD: 0.35–7.82 kya). The ABC framework demographic analysis shows that the divergence estimated by SSR was shorter than that estimated by mtDNA gene.
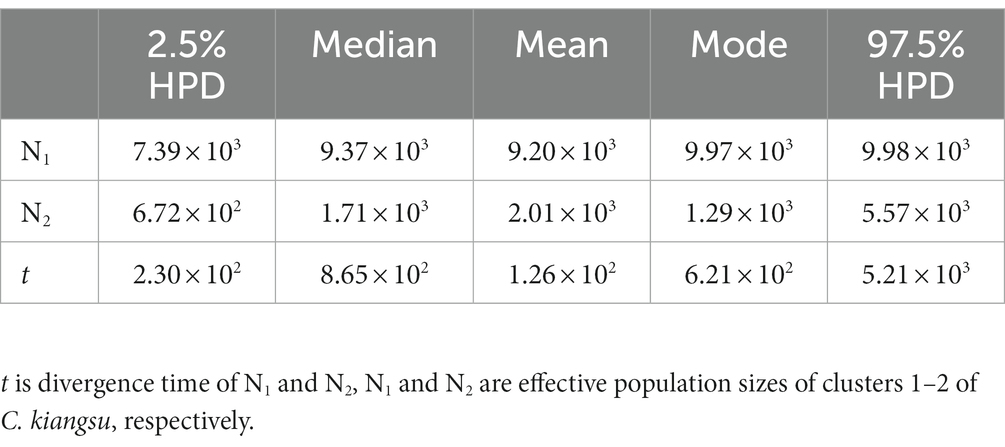
Table 4. Posterior median, mean, mode, and range of 97.5% highest probability distribution (HPD) in lineage (cluster) merging model for C. kiangsu (time is in generations).
3.6. Correlation with climatic variables
We tested the correlation between genetic differentiation and geographical isolation in this bamboo grasshopper. Mantel test revealed that there was a significant positive correlation between genetic differentiation (FST) and geographical distance (r = 0.515, p < 0.001) (Figure 5C). However, four data points obviously deviated from the regression line. These data represented the differentiation between Guizhou and the four populations of SE-Asia Group (Figure 5C). After excluding these four data points, we then conducted correlation analysis again and found a stronger positive correlation (r = 0.607, p < 0.001). Geographical distance may not have been the main driving force of genetic differentiation between Guizhou and the SE-Asia Group populations.
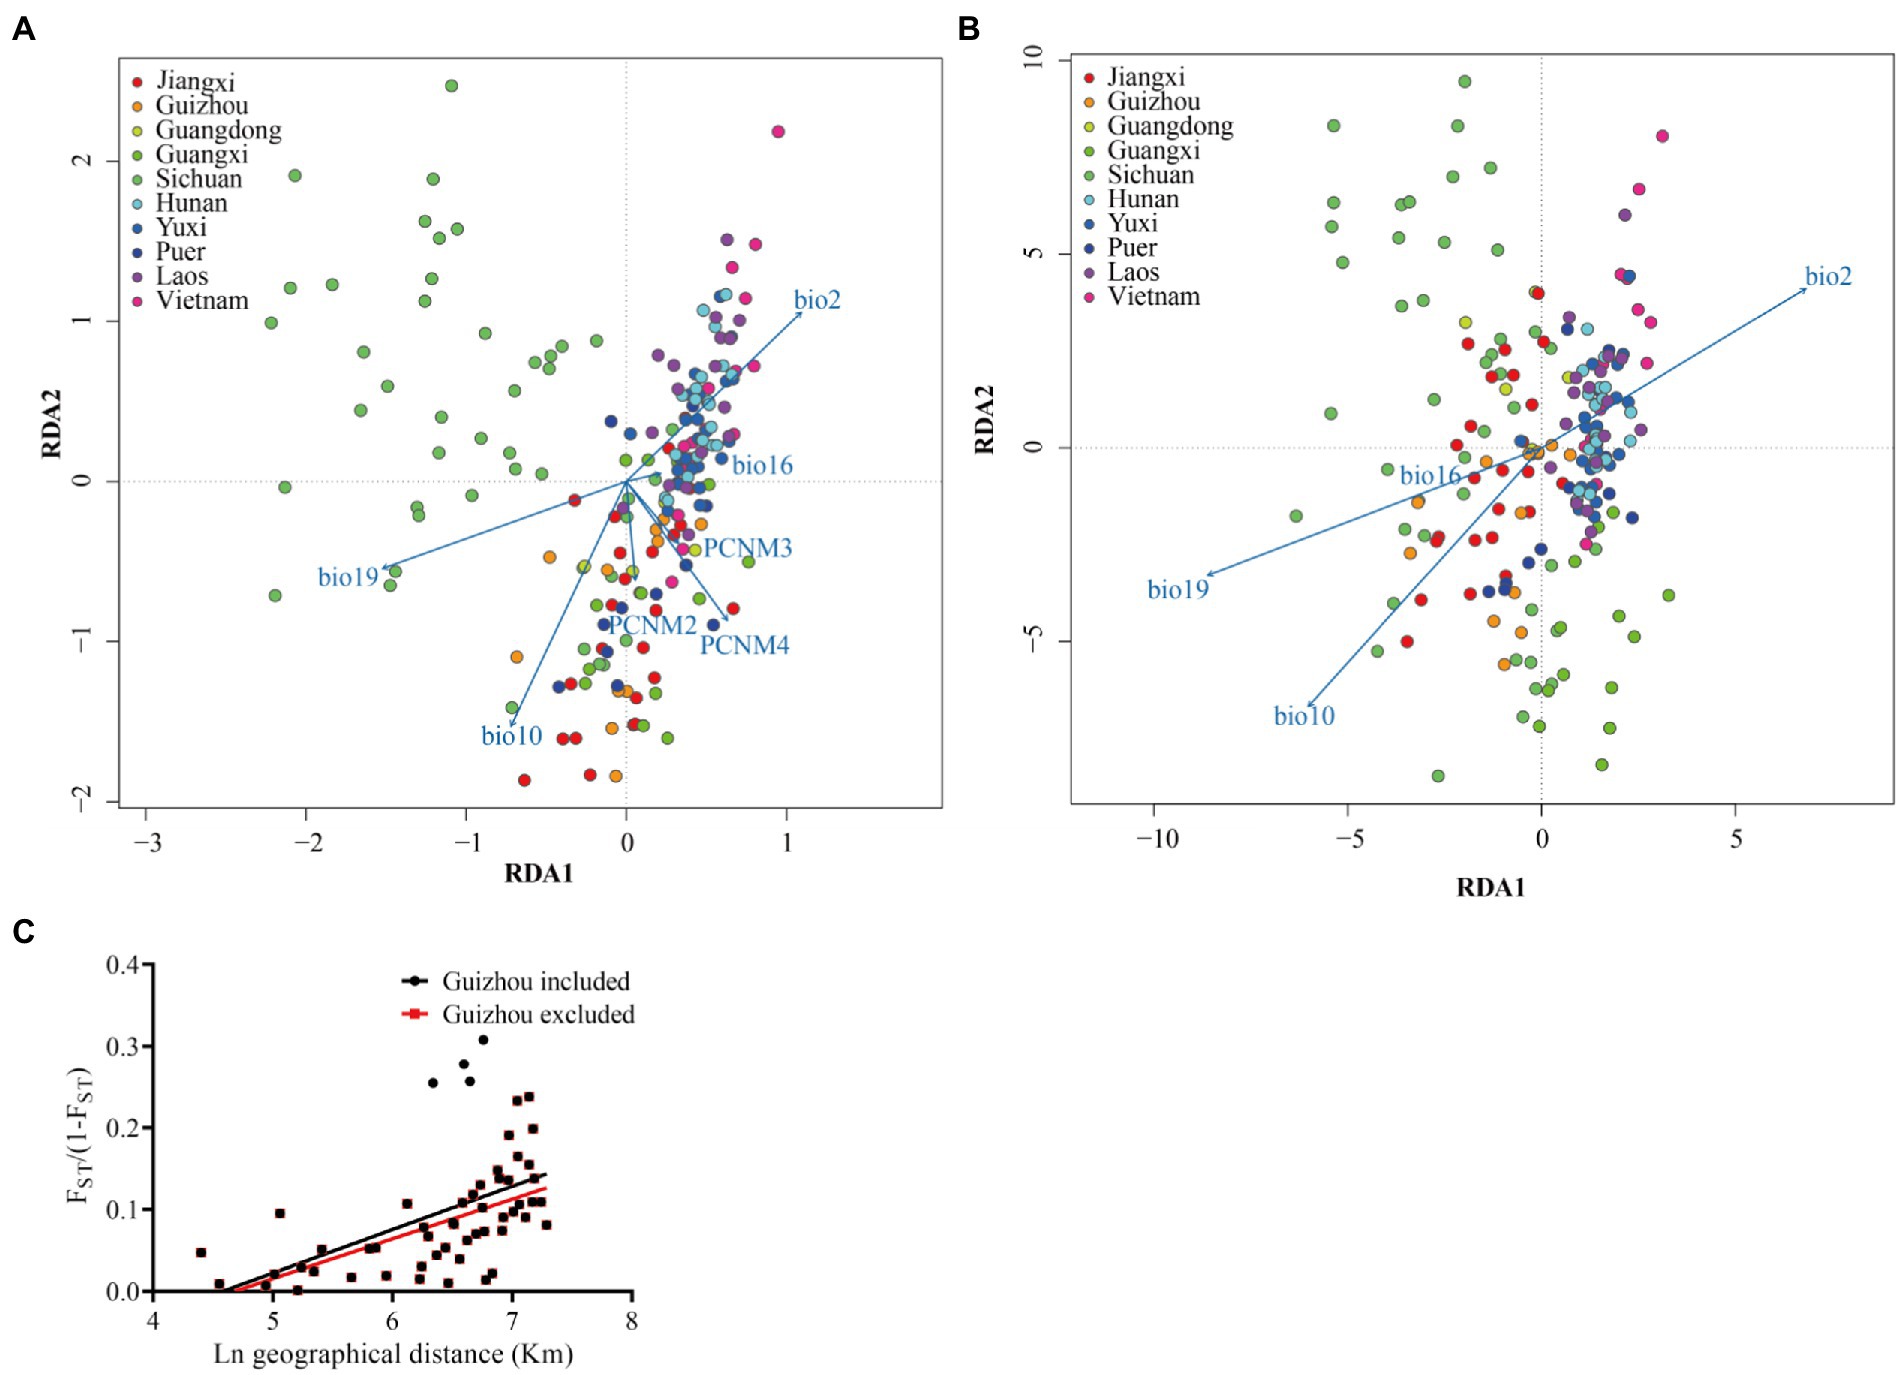
Figure 5. The correlation analysis of genetic variability and geographic and climatic variables in the bamboo grasshopper. (A) RDA analysis on genetic variance explained by the environmental effects of climate. A full RDA model was run by considering environmental and geographic effects simultaneously (A), and a partial RDA model was run by constraining geographic effects to analyze the correlation of environmental variables (B). Individuals from the same population are indicated by circles with the same color. PCNM2-4, geographic variables; BIO2, mean monthly temperature range; BIO10, mean temperature of warmest quarter; BIO16, precipitation of wettest quarter, and BIO19, precipitation of coldest quarter. Correlations of each variable are indicated by an arrow. Long arrows indicate a high correlation between the variable and genetic distance. (C) Correlation between geographic distance and genetic differentiation (as measured by FST) among 10 geographic populations based on Mental test. Black line represents linear correlation analysis of all samples (r = 0.515, p < 0.001). The red four points indicate all samples excluding between Guizhou and four populations in SE-Asia Group (r = 0.607, p < 0.001).
We then tested the correlation effects of 19 climate variables and geography (mostly geographical position of latitude and longitude) on the genetic differentiation among the populations based on RDA. The influence of geography, climate and their interaction explained 19.7% of the total genetic variation. For the explained genetic variation, the independent effects of climatic conditions and geography accounted for 86.24 and 3.19%, respectively. When both climatic and geographical impacts are considered in the RDA analysis, three climatic variables (BIO2, mean monthly temperature range; BIO10, mean temperature of warmest quarter; BIO19, precipitation of coldest quarter), and one geographical variable (PCNM4) are highly correlated with genetic distance (Figure 5A). When geographical variables are limited in RDA analysis, mean monthly temperature range (BIO2), mean temperature of warmest quarter (BIO10), and precipitation of coldest quarter (BIO19) are highly correlated with genetic distance (Figure 5B).
4. Discussion
The distribution range of a species is limited by many factors that, during evolutionary history, shape the genetic structure of the species. Here, we reported the potential genetic effects of some ecological, geographic, and climatic factors in a grasshopper species possessing a powerful long-distance migratory capacity. We used the mtDNA COI gene and microsatellite markers to explore the phylogenetic relationship and genetic variation (genetic diversity and genetic structure) among samples of the bamboo grasshopper from their wide distribution range. Mitochondrial data showed that the bamboo grasshopper was monophyletic, but had higher genetic diversity and more haplotypes than in previous studies (Ma et al., 2012; Pfeiler et al., 2017; Liu et al., 2019). Microsatellite data confirmed that these samples could be divided into two groups based on PCoA, Bayesian cluster analysis, and genetic differentiation analysis. The subsequent Mental test and RDA analysis indicated that geological barriers and climatic change effectively explained the genetic variation of this species.
4.1. Genetic diversity and phylogeny
The bamboo grasshopper had high haplotype diversity and nucleotide diversity based on the mtDNA COI gene, demonstrating a high level of genetic differentiation. Other migratory grasshoppers have a high level of genetic diversity, such as Locusta migratoria (Ma et al., 2012). However, the bamboo grasshopper had more haplotypes, especially unique haplotypes, compared with other migratory insects, such as L. migratoria, Danaus plexippus, and Aedes aegypti (Ma et al., 2012; Pfeiler et al., 2017; Liu et al., 2019). Furthermore, the phylogenetic tree of haplotypes showed that most haplotypes of the bamboo grasshopper were clustered on one branch without obvious genetic structure, which was consistent with previous C. kiangsu results (Fan et al., 2014; Liu et al., 2016).
The distinct haplotype composition may be associated with the oligophagous traits of the bamboo grasshopper. There was a significant negative correlation between dietary breadth and genetic diversity at the population level. Populations with fewer mtDNA haplotypes had a wider range of food, whereas populations with higher haplotype diversity were more specialized (Singer and Parmesan, 2021). The distribution of this grasshopper largely overlaps with the distribution of bamboo (Li and Feng, 2019). The specialized host choice may promote haplotype differentiation. Furthermore, previous results have shown that oligophagous insects were phylogenetically conserved and belonged to monophyletic groups (Pekár et al., 2012; Gordon and Weirauch, 2016). Therefore, the oligophagous traits of the bamboo grasshopper may contribute to its high haplotype diversity.
4.2. Genetic differentiation and driving force
This study revealed significant genetic differentiation among populations that was positively correlated with geographical distance. Thus, the genetic variation among populations can be at least partly explained by geographical distance. Such close correlation between genetic differentiation and geographical distance has been observed in many other species, such as the whitefly Bemisia tabaci and the moths Spodoptera exigua and Cydia pomonella (Thaler et al., 2008; Díaz et al., 2015; Wang et al., 2020).
Geographic barriers could have also caused the genetic differentiation among some specific populations of the bamboo grasshoppers. There was a great degree of genetic differentiation between the Guizhou population (the west central region) and the SE-Asia Group. The terrain characteristics of Yunnan Province located between Guizhou and the SE-Asia Group include high-altitude terrain that is blocked by the famous Hengduan Mountains, and is high in the northwest and low in the southeast. This mountain barrier could also block the migration of the bamboo grasshopper and thus genetic exchange between populations in these local regions. It is not uncommon for geographic barriers to cause high genetic differentiation; for example, there is high genetic differentiation between giant pandas in the Daxiangling and Xiaoxiangling Mountains, and gene flow resistance of honeybees in valleys increases genetic differentiation (Zhu et al., 2010; Yu et al., 2019). Thus, we speculate that the genetic differentiation between Guizhou and the SE-Asia Group is affected by mountain isolation.
4.3. Distinct population structure and associated shaping factors
PCoA, STRUCTURE, and AMOVA results based on microsatellite data all supported a two-lineage structure for the 10 different geographic populations of the bamboo grasshopper. This finding is different from a previous report on this species (Liu et al., 2016). In fact, the two lineages are distinct in their genetic components and geographic origins. The S-China Group covers the six northeast populations, and the SE-Asia Group covers the four southeast populations (Figure 4B). This clustering pattern is consistent with the result of genetic differentiation, which was low within the S-China Group and SE-Asia Group, but was large between the two groups. These results indicated significant genetic differences within the populations and shallow differentiation among populations.
Interestingly, the RDA of 19 climate variables also revealed two different groups of these traits. The separation of the two groups was related to the change of difference in mean monthly temperature range (BIO2), mean temperature of warmest quarter (BIO10), and precipitation of coldest quarter (BIO19). Such climatic changes are related to the development and growth of the bamboo grasshoppers in their life cycle. Temperatures that are too high or too low damage the embryonic development of the bamboo grasshopper and reduce its hatching rate in winter (Zhao, 2009). The temperature variation and precipitation ranges are very important to the survival, development, and growth of the bamboo grasshopper. The population density was affected by ambient temperature (Liu et al., 2021). It was reported in other species that climatic variables play an important role in the formation of genetic structure (e.g., Ding et al., 2018). Climate variables affected the genetic structure of Aedes aegypti (Mendonça et al., 2014; Gao et al., 2021), Apis cerana japonica (Nagamitsu et al., 2016), and Trialeurodes vaporariorum (Ovčarenko et al., 2014). Thus, temperature and precipitation are important factors affecting genetic structure. The current geographic pattern of genetic differentiation in the bamboo grasshopper populations may be the joint effect of geographic landscapes and ecological traits.
4.4. Demographic dynamics in the Holocene
Population expansion of insects with similar distributions in Eurasia mostly occurred in the Holocene (e.g., Ye et al., 2020). According to BSP analysis, the population size expansion for C. kiangsu occurred in the Holocene after the Last Glacial Maximum (LGM, 21 Kya). Similar Holocene expansion patterns in insects have been shown for Chrysodeixis includens (Silva et al., 2020), Callosobruchus maculatus (Kebe et al., 2017), Peponapis pruinosa (Lopez-Uribe et al., 2016), and Homalictus fijiensis (Dorey et al., 2021). All haplotypes were derived from the most common haplotype (Hap1), and the demographic history also showed that the current populations resulted from expansion from a few ancestors, supporting the same ancestor hypothesis. The Guangxi population had the most shared haplotypes and unique haplotypes in the TCS network. Therefore, Guangxi may have been the refuge from which the bamboo grasshopper expanded in the Holocene. In addition, changes during glacial–interglacial cycles produced large genetic changes in species. Correspondingly, the Earth’s temperature rose sharply before and after the expansion of bamboo grasshoppers. We speculate that the population expansion was related to the rise of temperature. Similarly, many insects expanded their populations 10,000 years ago, such as Aquarius paludum (Ye et al., 2022). The population expansion during the glacial–interglacial cycles also confirms that the migration plays a significant role in shaping its current distribution pattern.
Ceracris kiangsu possesses a powerful of flight capacity, which is able to fly 7.8 km per day. Between 2014 and 2020, and the bamboo grasshopper has had successive outbreaks in Laos, Vietnam, and many places in China (Fan et al., 2014). The long-distance migratory behaviors of insects often work as a contrasting force that drives genetic differentiation, resulting in low genetic differentiation of many migratory insects, such as Chlorops oryzae, Calliptamus italicus and Plutella xylostella (Xu et al., 2019; Zhou et al., 2020; Chen et al., 2021). Frequent population outbreaks result in frequent gene exchange and a wide range of genetic homogenization among populations (Chapuis et al., 2009, 2010). The genetic variation results of microsatellite and mitochondrial COI gene showed that the population had low genetic differentiation. Therefore, we speculate that this is due to its strong migration ability.
What was the possible migration routes? Based on mtDNA data, the SE-Asia Group did not include the most extensive haplotypes (Hap1), but primarily had the divergent Hap3, which was also included in the Guangxi population. This result indicates that gene exchange between the Guangxi population and SE-Asia Group was frequent. Therefore, combining mitochondrial and microsatellite data, Guangxi was likely the refuge of C. kiangsu during the LGM, from which C. kiangsu migrated to other places and then formed the S-China Group. Therefore, we further speculate that the populations migrated from Guangxi to Yunnan, and finally to Laos and Vietnam in the SE-Asia Group (Figure 6).
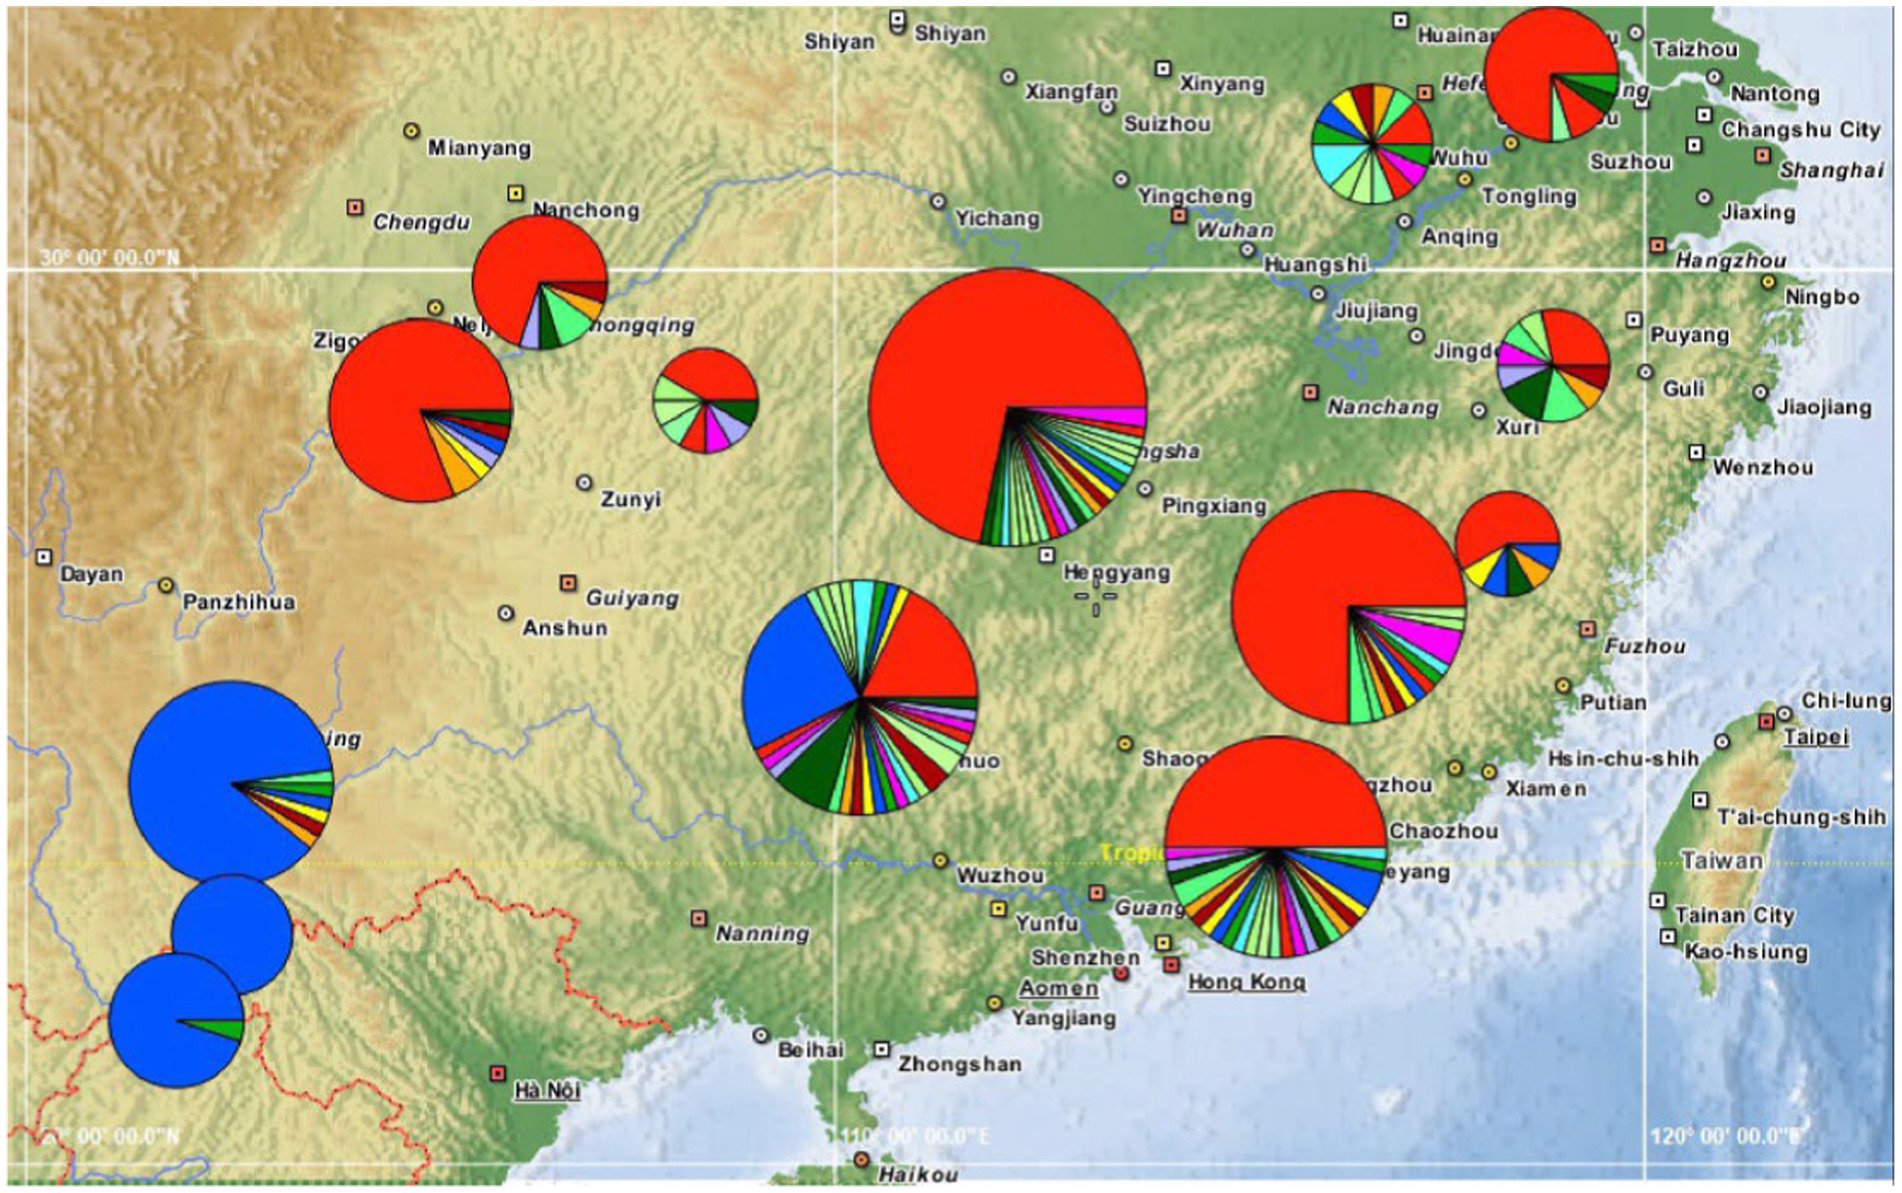
Figure 6. Phylogeography of the bamboo grasshopper. Pie charts show relative frequencies of COI haplotypes at each locality, and the colors are consistent with Figure 3.
Data availability statement
The datasets presented in this study can be found in online repositories. The names of the repository/repositories and accession number(s) can be found in the article/Supplementary material.
Author contributions
BC conceived the study. ZS, CL, and BC designed the experiments. SZ, BC, and CL collected samples. ZS conducted the experiments and analyses. ZS, CL, and BC wrote the manuscript. All authors contributed to the article and approved the submitted version.
Funding
This work was supported by National Key R&D Program of China 2022YFD1400500 and Hebei Natural Science Foundation (C2022201042) to BC.
Acknowledgments
We express our sincere gratitude to Yuyang Cheng, Shuanghui Li, and Wei Zhang for sample collection, to Xianliang Huang for his technical guidance and suggestions, and to Mallory Eckstut for editing the English text of this manuscript. The preprint entitled “New insights into the genetic structure of the outbreak-prone migratory locust” was published on Authorea Team (Song et al., 2022).
Conflict of interest
The authors declare that the research was conducted in the absence of any commercial or financial relationships that could be construed as a potential conflict of interest.
Publisher’s note
All claims expressed in this article are solely those of the authors and do not necessarily represent those of their affiliated organizations, or those of the publisher, the editors and the reviewers. Any product that may be evaluated in this article, or claim that may be made by its manufacturer, is not guaranteed or endorsed by the publisher.
Supplementary material
The Supplementary material for this article can be found online at: https://www.frontiersin.org/articles/10.3389/fevo.2023.1062857/full#supplementary-material
Footnotes
References
Avise, J. C. (2000). Phylogeography: The History and Formation of Species. Harvard University Press: Cambridge, Massachusetts.
Belkhir, K., Borsa, P., Chikhi, L., Raufaste, N., and Catch, F. (2004). “GENETIX 4.05.2., software under windows TM for the genetics of the populations” in Laboratory Genome, Populations, Interactions, CNRS UMR 5000D (Montpellier: University of Montpellier II). Available at: http://www.genetix.univ-montp2.fr/genetix/intro.htm (Accessed September 10, 2022).
Bouckaert, R., Heled, J., Kühnert, D., Vaughan, T., Wu, C. H., Xie, D., et al. (2014). BEAST 2: a software platform for Bayesian evolutionary analysis. PLoS Comput. Biol. 10:e1003537. doi: 10.1371/journal.pcbi.1003537
Cao, L. J., Gao, Y. F., Gong, Y. J., Chen, J. C., Chen, M., Hoffmann, A., et al. (2019). Population analysis reveals genetic structure of an invasive agricultural thrips pest related to invasion of greenhouses and suitable climatic space. Evol. Appl. 12, 1868–1880. doi: 10.1111/eva.12847
Chapuis, M. P., Lecoq, M., Michalakis, Y., Loiseau, A. G., and Estoup, A. (2010). Do outbreaks affect genetic population structure? A worldwide survey in Locusta migratoria, a pest plagued by microsatellite null alleles. Mol. Ecol. 17, 3640–3653. doi: 10.1111/j.1365-294X.2008.03869.x
Chapuis, M. P., Loiseau, A., Michalakis, Y., Lecoq, M., Franc, A., and Estoup, A. (2009). Outbreaks, gene flow and effective population size in the migratory locust, Locusta migratoria: a regional: cale comparative survey. Mol. Ecol. 18, 792–800. doi: 10.1111/j.1365-294X.2008.04072.x
Chen, M. Z., Cao, L. J., Li, B. Y., Chen, J. C., Gong, Y. J., Yang, Q., et al. (2021). Migration trajectories of the diamondback moth Plutella xylostella in China inferred from population genomic variation. Pest Manag. Sci. 77, 1683–1693. doi: 10.1002/ps.6188
Chen, B., Feder, M. E., and Kang, L. (2018). Evolution of heat-shock protein expression underlying adaptive responses to environmental stress. Mol. Ecol. 27, 3040–3054. doi: 10.1111/mec.14769
Chen, B., Zhang, B., Xu, L., Li, Q., Jiang, F., Yang, P., et al. (2017). Transposable element-mediated balancing selection at Hsp90 underlies embryo developmental variation. Mol. Biol. Evol. 34, 1127–1139. doi: 10.1093/molbev/msx062
Cornuet, J. M., Pudlo, P., Veyssier, J., Dehne-Garcia, A., Gautier, M., Leblois, R., et al. (2014). DIYABC v2.0: software to make approximate Bayesian computation inferences about population history using single nucleotidepolymorphism, DNA sequence and microsatellite data. Bioinformatics 30, 1187–1189. doi: 10.1093/bioinformatics/btt763
Díaz, F., Endersby, N. M., and Hoffmann, A. A. (2015). Genetic structure of the whitefly Bemisia tabaci populations in Colombia following a recent invasion. Insect Sci. 22, 483–494. doi: 10.1111/1744-7917.12129
Ding, D., Liu, G., Hou, L., Gui, W., Chen, B., and Kang, L. (2018). Genetic variation in PTPN1 contributes to metabolic adaptation to high-altitude hypoxia in Tibetan migratory locusts. Nat. Commun. 9:4991. doi: 10.1038/s41467-018-07529-8
Dorey, J. B., Groom, S. V. C., Velasco-Castrillon, A., Stevens, M. I., Lee, M. S. Y., and Schwarz, M. P. (2021). Holocene population expansion of a tropical bee coincides with early human colonization of Fiji rather than climate change. Mol. Ecol. 30, 4005–4022. doi: 10.1111/mec.16034
Drummond, A. J., and Rambaut, A. (2007). BEAST: Bayesian evolutionary analysis by sampling trees. BMC Evol. Biol. 7:214. doi: 10.1186/1471-2148-7-214
Drummond, A. J., Rambaut, A., Shapiro, B., and Pybus, O. G. (2005). Bayesian coalescent inference of past population dynamics from molecular sequences. Mol. Biol. Evol. 22, 1185–1192. doi: 10.1093/molbev/msi103
Excoffier, L., and Lischer, H. E. L. (2010). Arlequin suite ver 3.5: a new series of programs to perform population genetics analyses under Linux and windows. Mol. Ecol. Resour. 10, 564–567. doi: 10.1111/j.1755-0998.2010.02847.x
Fan, Z., Jiang, G. F., Liu, Y. X., He, Q. X., and Blanchard, B. (2014). Population explosion in the yellow-Spined bamboo locust C.kiangsu and inferences for the impact of human activity. PLoS One 9:e89873. doi: 10.1371/journal.pone.0089873
Gao, S., Chen, J. J., and Jiang, G. F. (2018). Complete mitochondrial genome of bamboo grasshopper, Ceracris fasciata, and the phylogenetic analyses and divergence time estimation of Caelifera (Orthoptera). Bull. Entomol. Res. 108, 321–336. doi: 10.1017/S0007485317000761
Gao, J., Zhang, H. D., Guo, X. X., Xing, D., Dong, Y. D., Lan, C. J., et al. (2021). Dispersal patterns and population genetic structure of Aedes albopictus (Diptera: Culicidae) in three different climatic regions of China. Parasit. Vectors 14:12. doi: 10.1186/s13071-020-04521-4
Gordon, E. R., and Weirauch, C. (2016). Efficient capture of natural history data reveals prey conservatism of cryptic termite predators. Mol. Phylogenet. Evol. 94, 65–73. doi: 10.1016/j.ympev.2015.08.015
Heller, K. G., Hemp, C., Ingrisch, S., and Liu, C. X. (2015). Acoustic communication in Phaneropterinae (Tettigonioidea)-a global review with some new data. J. Orthop. Res. 24, 7–18. doi: 10.1665/034.024.0103W
Jakobsson, M., and Rosenberg, N. A. (2007). CLUMPP: a cluster matching and permutation program for dealing with label switching and multimodality in analysis of population structure. Bioinformatics 23, 1801–1806. doi: 10.1093/bioinformatics/btm233
Kebe, K., Alvarez, N., Tuda, M., Arnqvist, G., Fox, C. W., Sembene, M., et al. (2017). Global phylogeography of the insect pest Callosobruchus maculatus (Coleoptera: Bruchinae) relates to the history of its main host, Vigna unguiculata. J. Biogeogr. 44, 2515–2526. doi: 10.1111/jbi.13052
Leigh, J. W., and Bryant, D. (2015). Pop ART: full-feature software for haplotype network construction. Methods Ecol. Evol. 6, 1110–1116. doi: 10.1111/2041-210X.12410
Li, Y. M., and Feng, P. F. (2019). Bamboo resources in China based on the ninth national forest inventory Datas. World Bamboo Rattan 17, 45–48. doi: 10.12168/sjzttx.2019.06.010
Librado, P., and Rozas, J. (2009). Dna SP v5: a software for comprehensive analysis of DNA polymorphism data. Bioinformatics 25, 1451–1452. doi: 10.1093/bioinformatics/btp187
Liu, Y. X., Jiang, G. F., Chen, J. J., and Gao, S. (2016). Genetic structure and effective population size of the bamboo locust Ceracris kiangsu. Biomed. Genet. Genom. 1, 60–68. doi: 10.15761/BGG.1000112
Liu, S. M., Liu, Y., Jelen, E., Alibadian, M., Yao, C. T., Li, X. T., et al. (2020). Regional drivers of diversification in the late quaternary in a widely distributed generalist species, the common pheasant Phasianus colchicus. J. Biogeogr. 47, 2714–2727. doi: 10.1111/jbi.13964
Liu, P., Lu, L., Jiang, J., Guo, Y., Yang, M., and Liu, Q. (2019). The expanding pattern of Aedes aegypti in southern Yunnan, China: insights from microsatellite and mitochondrial DNA markers. Parasites Vectors 12:561. doi: 10.1186/s13071-019-3818-8
Liu, H. Y., Yan, L. Y., Yang, H., Gao, S., Hong, F., Liu, N. N., et al. (2018). Estimation of lineage geographic structure of Ceracris kiangsu based on mtDNA COII gene sequence. J. Environ. Insect. 40, 413–424. [in Chinese]
Liu, D. Z., Zhao, S. Y., Yang, X. M., Wang, R., Cang, X. Z., Zhang, H. W., et al. (2021). Radar monitoring unveils migration dynamics of the yellow-spined bamboo locust (Orthoptera: Arcypteridae). Comput. Electron. Agric. 187:106306. doi: 10.1016/j.compag.2021.106306
Lopez-Uribe, M. M., Cane, J. H., Minckley, R. L., and Danforth, B. N. (2016). Crop domestication facilitated rapid geographical expansion of a specialist pollinator, the squash bee Peponapis pruinosa. Proc. Royal Soc. B Biol. Sci. 283:20160443. doi: 10.1098/rspb.2016.0443
Ma, C., Yang, P. C., Jiang, F., Chapuis, M. P., Shali, Y., Sword, G. A., et al. (2012). Mitochondrial genomes reveal the global phylogeography and dispersal routes of the migratory locust. Mol. Ecol. 21, 4344–4358. doi: 10.1111/j.1365-294X.2012.05684.x
Mendonça, B. A., Sousa, A. C., Souza, A. P., and Scarpassa, V. M. (2014). Temporal genetic structure of major dengue vector Aedes aegypti from Manaus, Amazonas, Brazil. Acta Tropica. 134, 80–88. doi: 10.1016/j.actatropica.2014.02.014
Minh, B. Q., Schmidt, H. A., Chernomor, O., Schrempf, D., Woodhams, M. D., von Haeseler, A., et al. (2020). IQ-TREE 2: new models and efficient methods for phylogenetic inference in the genomic era. Mol. Biol. Evol. 37, 1530–1534. doi: 10.1093/molbev/msaa131
Nagamitsu, T., Yasuda, M., Saito-Morooka, F., Inoue, M. N., Nishiyama, M., Goka, K., et al. (2016). Genetic structure and potential environmental determinants of local genetic diversity in Japanese honeybees (Apis cerana japonica). PLoS One 11:e0167233. doi: 10.1371/journal.pone.0167233
Ovčarenko, I., Kapantaidaki, D. E., Lindström, L., Gauthier, N., Tsagkarakou, A., Knott, K. E., et al. (2014). Agroecosystems shape population genetic structure of the greenhouse whitefly in northern and southern Europe. BMC Evol. Biol. 14:165. doi: 10.1186/s12862-014-0165-4
Pan, C. Y., Hu, J., Zhang, X., and Huang, Y. (2006). The DNA barcoding application of mtDNA COI gene in seven species of Catantopidae Orthoptera. Entomotaxonomia 28, 103–110. [in Chinese language, with English Summary]
Papadopoulou, A., Anastasiou, I., and Vogler, A. P. (2010). Revisiting the insect mitochondrial molecular clock: the mid-Aegean trench calibration. Mol. Biol. Evol. 27, 1659–1672. doi: 10.1093/molbev/msq051
Peakall, R. O. D., and Smouse, P. E. (2006). GENALEX 6: genetic analysis in excel. Population genetic software for teaching and research. Mol. Ecol. Notes 6, 288–295. doi: 10.1093/bioinformatics/bts460
Pekár, S., Coddington, J. A., and Blackledge, T. A. (2012). Evolution of stenophagy in spiders (Araneae): evidence based on the comparative analysis of spider diets. Evolution 66, 776–806. doi: 10.1111/j.1558-5646.2011.01471.x
Pfeiler, E., Nazario-Yepiz, N. O., Pérez-Gálvez, F., Chávez-Mora, C. A., Laclette, M. R., Rendón-Salinas, E., et al. (2017). Population genetics of overwintering monarch butterflies, Danaus plexippus (linnaeus), from Central Mexico inferred from mitochondrial DNA and microsatellite markers. J. Hered. 108, 163–175. doi: 10.1093/jhered/esw071
Porras-Hurtado, L., Ruiz, Y., Santos, C., Phillips, C., Carracedo, A., and Lareu, M. V. (2013). An overview of STRUCTURE: applications, parameter settings, and supporting software. Front. Genet. 4:98. doi: 10.3389/fgene.2013.00098
R Core Team (2014). R: A language and environment for statistical computing. Vienna, Austria: R Foundation for Statistical Computing. Available at: https://www.R-project.org/
Rambaut, A. (2018). FigTree v1.4.4. Institute of Evolutionary Biology, University of Edinburgh, Edinburgh. Available at: http://tree.bio.ed.ac.uk/software/figtree/
Rambaut, A., Drummond, A. J., Xie, D., Baele, G., and Suchard, M. A. (2018). Posterior summarisation in Bayesian phylogenetics using tracer 1.7. Syst. Biol. 67, 901–904. doi: 10.1093/sysbio/syy032
Rosenberg, N. A. (2004). Distruct: a program for the graphical display of population structure. Mol. Ecol. Notes 4, 137–138. doi: 10.1046/j.1471-8286.2003.00566.x
Rousset, F. (2008). GENEPOP 007: a complete reimplementation of the GENEPOP software for windows and Linux. Mol. Ecol. Resour. 8, 103–106. doi: 10.1111/j.1471-8286.2007.01931.x
Silva, C. S., Cordeiro, E. M. G., Paiva, J. B., Dourado, P. M., Carvalho, R. A., Head, G., et al. (2020). Population expansion and genomic adaptation to agricultural environments of the soybean looper, Chrysodeixis includens. Evol. Appl. 13, 2071–2085. doi: 10.1111/eva.12966
Singer, M. C., and Parmesan, C. (2021). Colonizations cause diversification of host preferences: a mechanism explaining increased generalization at range boundaries expanding under climate change. Glob. Chang. Biol. 27, 3505–3518. doi: 10.1111/gcb.15656
Song, Z. M., Ze, S. Z., Liu, C. X., and Chen, B. (2022). New insights into the genetic structure of the outbreak-prone migratory locust. Authorea Team. [Preprint]. doi: 10.22541/au.166313524.49731294/v1
Song, G., Zhang, R., DuBay, S. G., Qu, Y., Dong, L. U., Wang, W., et al. (2016). East Asian allopatry and north Eurasian sympatry in long-tailed tit lineages despite similar population dynamics during the late Pleistocene. Zool. Scr. 45, 115–126. doi: 10.1111/zsc.12148
Song, G., Zhang, R. Y., Machado-Stredel, F., Alstrom, P., Johansson, U. S., Irestedt, M., et al. (2020). Great journey of great tits (Parus major group): origin, diversification and historical demographics of a broadly distributed bird lineage. J. Biogeogr. 47, 1585–1598. doi: 10.1111/jbi.13863
Suchard, M. A., Lemey, P., Baele, G., Ayres, D. L., Drummond, A. J., and Rambaut, A. (2018). Bayesian phylogenetic and phylodynamic data integration using BEAST 1.10. Virus. Evolution 4:16. doi: 10.1093/ve/vey016
Sunnucks, P., and Hales, D. F. (1996). Numerous transposed sequences of mitochondrial cytochrome oxidase I-II in aphids of the genus Sitobion (Hemiptera: Aphididae). Mol. Biol. Evol. 13, 510–524. doi: 10.1093/oxfordjournals.molbev.a025612
Tao, J., Chen, M., Zong, S. X., and Luo, Y. Q. (2012). Genetic structure in the seabuckthorn carpenter moth (Holcocerus hippophaecolus) in China: the role of outbreak events, geographical and host factors. PLoS One 7:e30544. doi: 10.1371/journal.pone.0030544
Ter Braak, C. J. F. (1986). Canonical correspondence analysis: a new eigenvector technique for multivariate direct gradient analysis. Ecology 67, 1167–1179. doi: 10.2307/1938672
Thaler, R., Brandstätter, A., Meraner, A., Chabicovski, M., Parson, W., Zelger, R., et al. (2008). Molecular phylogeny and population structure of the codling moth (Cydia pomonella) in Central Europe: II. AFLP analysis reflects human-aided local adaptation of a global pest species. Mol. Phylogenet. Evol. 48, 838–849. doi: 10.1016/j.ympev.2008.05.027
Thomas, M. B. (1999). Ecological approaches and the development of‘truly integrated’ pest management. Proc. Natl. Acad. Sci. U. S. A. 96, 5944–5951. doi: 10.1073/pnas.96.11.5944
Wang, X. Y., Wang, M. M., Chen, C., and Wang, X. Q. (2020). Genetic variation and phylogeographic structure of Spodoptera exigua in western China based on mitochondrial DNA and microsatellite markers. PLoS One 15:e0233133. doi: 10.1371/journal.pone.0233133
Xu, Y., Mai, J. W., Yu, B. J., Hu, H. X., Yuan, L., Jashenko, R., et al. (2019). Study on the genetic differentiation of geographic populations of Calliptamus italicus (Orthoptera: Acrididae) in Sino-Kazakh border areas based on mitochondrial COI and COII genes. J. Econ. Entomol. 112, 1912–1919. doi: 10.1093/jee/toz112
Xuan, W. J., Zhang, Y. Y., Liu, N. N., Zhao, J. L., and Jiang, G. F. (2009). Isolation and characterization of polymorphic microsatellite loci in the bamboo locust Rammeacris kiangsu Orthoptera: Acrididae. Europ. J. Entomol. 106, 663–665. doi: 10.14411/eje.2009.082
Ye, Z., Chen, D., Yuan, J., Zheng, C., Yang, X., Wang, W., et al. (2020). Are population isolations and declines a threat to island endemic water striders? A lesson from demographic and niche modelling of Metrocoris esakii (Hemiptera: Gerridae). Mol. Ecol. 29, 4573–4587. doi: 10.1111/mec.15669
Ye, Z., Yuan, J., Damgaard, J., Berchi, G. M., Cianferoni, F., Pintar, M. R., et al. (2022). Climate warming since the Holocene accelerates west-east communication for the Eurasian temperate water strider species Aquarius paludum. Mol. Biol. Evol. 39:msac089. doi: 10.1093/molbev/msac089
Yeh, F. C., Yang, R. C., and Boyle, T. (1999). PopGene Version 1.31: Microsoft Window Based Freeware for Population Genetic Analysis. University of Alberta and Centre for International Forestry Research: Edmonton.
Yu, Y., Zhou, S., Zhu, X., Xu, X., Wang, W., Zha, L., et al. (2019). Genetic differentiation of Eastern honey bee (Apis cerana) populations across Qinghai-Tibet Plateau-valley landforms. Front Genet. 10:483. doi: 10.3389/fgene.2019.00483
Zhao, Q. (2009). A Study on the Biological and Embryonic Development Characteristics of the Yellow Ridged Bamboo Locust. Central South University of Forestry and Technology. [in Chinese]
Zhou, A., Tian, P., Li, Z., Li, X., Tan, X., Zhang, Z., et al. (2020). Genetic diversity and differentiation of populations of Chlorops oryzae (Diptera, Chloropidae). BMC Ecol. 20:22. doi: 10.1186/s12898-020-00293-8
Keywords: genetic structure, migration, genetic differentiation, climate, bamboo grasshopper
Citation: Song Z, Ze S, Liu C and Chen B (2023) New insights into the genetic structure of the outbreak-prone bamboo grasshoppers. Front. Ecol. Evol. 11:1062857. doi: 10.3389/fevo.2023.1062857
Edited by:
Yu-Zhou Du, Yangzhou University, ChinaReviewed by:
Shu-Jun Wei, Beijing Academy of Agricultural and Forestry Sciences, ChinaYuan Huang, Shaanxi Normal University, China
Copyright © 2023 Song, Ze, Liu and Chen. This is an open-access article distributed under the terms of the Creative Commons Attribution License (CC BY). The use, distribution or reproduction in other forums is permitted, provided the original author(s) and the copyright owner(s) are credited and that the original publication in this journal is cited, in accordance with accepted academic practice. No use, distribution or reproduction is permitted which does not comply with these terms.
*Correspondence: Bing Chen, Y2hlbmJpbmdAaGJ1LmVkdS5jbg==; Chunxiang Liu, bGl1Y3hAaW96LmFjLmNu