 Karola Anna Barta
 László Zsolt Garamszegi
 István Scheuring
 Sándor Zsebők
- 1Doctoral School of Biology, Institute of Biology, ELTE Eötvös Loránd University, Budapest, Hungary
- 2ELKH-PE Evolutionary Ecology Research Group, University of Pannonia, Veszprém, Hungary
- 3Institute of Ecology and Botany, Centre for Ecological Research, Vácrátót, Hungary
- 4Institute of Evolution, Centre for Ecological Research, Budapest, Hungary
- 5Department of Systematic Zoology, Institute of Biology, Eötvös Loránd University, Budapest, Hungary
Cultural diversity and stability of a population affect the adaptiveness and survival of individuals. Besides field studies, cultural diversity and stability have been investigated with the help of different modeling approaches in relatively simple cultures. These theoretical studies helped identify mechanisms that generate cultural diversity through increasing the proportion of new elements in the population, for example by immigration or erroneous learning. Copy-the-majority learning strategies, forms of positive frequency-dependent learning, have a rather opposite effect: while they help in maintaining cultural stability by favoring the spread of common elements, they also decrease cultural diversity. We investigated whether these basic, conflicting mechanisms are sufficient together to create a complex, polymorphic cultural system and to maintain its diversity and stability. For that we developed an individual-based model simulating song learning in birds in which the extent of immigration, the frequency of learning mistakes and the strength of positive frequency-dependent learning were included as modifiable parameters. From the model, we obtained information on the composition and temporal changes in the individual and population repertoires. A comparison with long-term field data on a European passerine bird species with moderate song complexity, the collared flycatcher (Ficedula albicollis), was also performed. Our results confirmed that certain combinations of the three investigated mechanisms were indeed able to create patterns that showed certain aspects of polymorphic cultures. Yet, several discrepancies occurred when comparing the simulation results with the field data that emphasize the implementation of other mechanisms, especially those that have a stabilizing effect. Long-term metastable states, found in the population-level cultural diversity, raise awareness to animal cultures’ possible sensitivity to external factors.
1. Introduction
Animal cultures are often characterized by their diversity and stability (Tchernichovski et al., 2017), aspects that both contribute to the adaptiveness and survival of individuals (Lewis et al., 2021). So far, both these features have been defined mostly in relevance to the population as a whole (Table 1). Cultural systems, however, have a structure building up from the level of individuals. Diversity on the individual level limits the within- and between-individual variability which then shape the diversity and stability of cultural elements in the population. This is especially relevant for complex cultures, where individuals possess many tens or even hundreds of different behavioral element types which they use with various probabilities. In such cultures, as the number of different behavioral element types increases in the individuals’ repertoire, so will the number of different values that the within- and between-individual variability can take. Theoretically, this allows for greater variance in the cultural diversity and stability of the population. For example, on a scale from highly stable but monolithic cultures to highly diverse but constantly changing ones, Tchernichovski et al. (2017) define stable polymorphic cultures, in which both individuals and the population show high cultural diversity and behavioral element types also show to be persistent over time in the population. In cultures that have evolved for communicative purposes diversity together with stability allow context-dependent communication (Byers and Kroodsma, 2009) and both individual and group-identity recognition (Hile and Striedter, 2000; Antunes et al., 2011; Schulz et al., 2011; Pollard and Blumstein, 2012). Yet, despite their importance, complex cultures remain underinvestigated and as such, in this current study we focus on how diversity and stability are being shaped in complex cultures taken as systems having different levels (Key notions applied in this paragraph and later through the paper are summarized in Table 1).
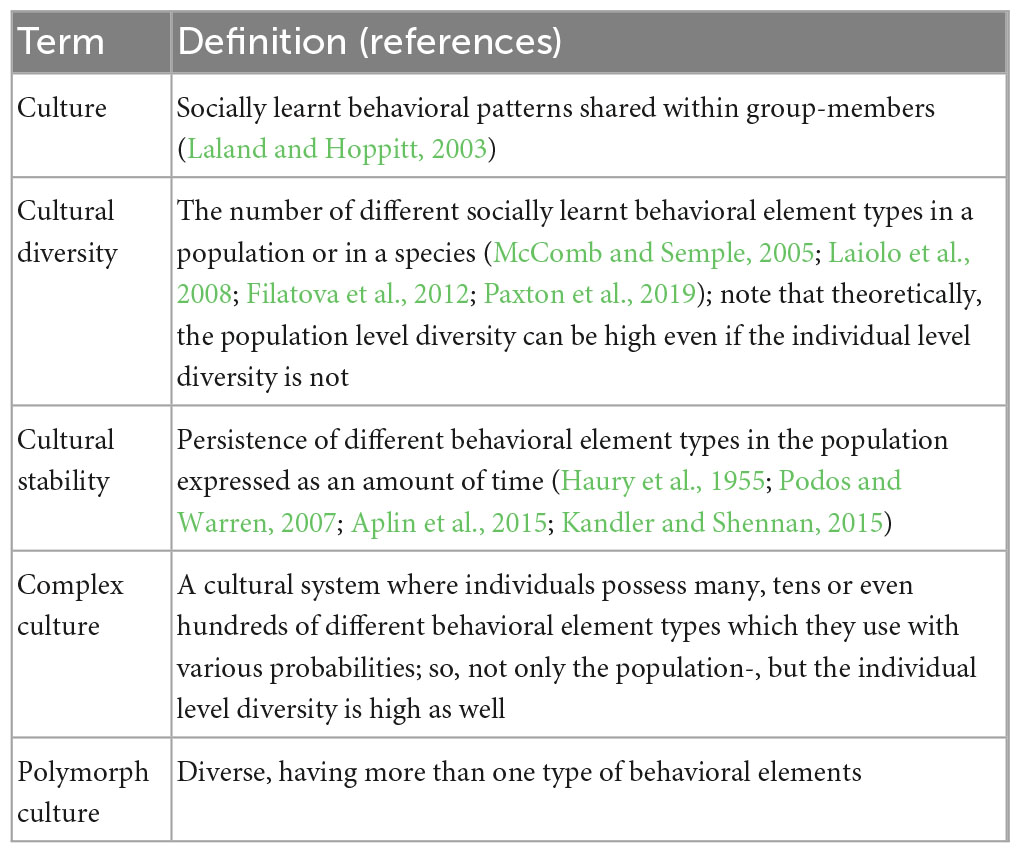
Table 1. Glossary of terms used in the text.
Complex cultures can be found typically in humans in the form of different institutions like beliefs, opinions, dressing habits, language dialects, etc. (Bogatyrev, 2016; Richerson et al., 2016), or less obviously in other species, such as the gestural signals of chimpanzees (Pan troglodytes) (Tomasello et al., 1994; Roberts et al., 2014) or the complex birdsong of numerous songbirds (Harris and Lemon, 1972; Gil and Slater, 2000; Baker and Gammon, 2006). Socially learnt birdsong–being prone to cultural changes (Catchpole and Slater, 2008)–has been widely used to study non-human culture and many times has been referred to as an analog to human culture (Salwiczek and Wickler, 2004; Tchernichovski et al., 2017). In our study we focused on complex birdsong as a model system to investigate stable polymorphic cultures, as it can show very high cultural diversity and also stability (Ince et al., 1980; Feßl and Hoi, 2000; Kipper et al., 2004; Ludwig and Jamieson, 2007; Jäckel et al., 2022).
Birdsong has been extensively incorporated into theoretical research as a model system to investigate the mechanisms affecting cultural patterns and evolution (e.g., Slater, 1986; Ellers and Slabbekoorn, 2003; Lachlan et al., 2018). Thanks to this, we know that innovations, learning mistakes—grouped together under the term cultural mutations in previous studies—immigration and special cases of social learning (e.g., those that favor rare behavioral elements) increase the cultural diversity by increasing between-individual differences (Slater, 1986; Lynch et al., 1989; Ellers and Slabbekoorn, 2003; Tchernichovski et al., 2021). Stability of a culture is disrupted by these mechanisms, but it is supported by other ones like conformism, a form of positive frequency-dependent social learning bias (Lachlan et al., 2018). In the present study, we investigated the effects of three mechanisms—learning mistakes, immigration and one form of positive frequency-dependent learning—on complex birdsong culture. Theoretical studies so far focused on model species where individuals have a rather simple song structure built from several repeating song types like the common chaffinch (Fringilla coelebs) (Goodfellow and Slater, 1986; Lynch et al., 1989; Williams and Slater, 1990; Lachlan and Slater, 2003) or the swamp sparrow (Melospiza georgiana) (Lachlan et al., 2018) but the effects of these three mechanisms have remained understudied in respect to complex cultures.
Learning mistakes are errors in copying, therefore, they result in a different learnt behavioral element than what was originally intended to be learnt. Intuitively, by increasing the possibility of learning mistakes, variety between individuals emerges. McLoughlin et al. (2018) found that when the probability of learning mistakes is low in a simulated humpback whale (Megaptera novaeangliae) population, they’ll show convergence and stability in their songs. Immigration increases diversity within a population and has been suggested to impede the stability of birdsong dialects (Marler and Tamura, 1962; Laiolo and Tella, 2007). Simulation studies also suggest that neighboring populations show greater divergence in their songs when male dispersal is low (Ellers and Slabbekoorn, 2003). Nevertheless, we have no knowledge of studies that have differentiated the effects of these two mechanisms owing to the fact that in cultures where individuals possess a small number of behavioral elements these mechanisms would have the same effect (Goodfellow and Slater, 1986; Williams and Slater, 1990; Lachlan et al., 2018). However, we argue that in complex cultures immigration has the potential to affect cultural diversity in a different manner than learning mistakes would do. When a mistake in learning is made, changes in cultural diversity stem from the change made in a single learnt unit which will first affect the within-individual variability. If the result of a learning mistake is a new variant in the population, it will have a low frequency compared to the already existing ones. Compared to this, the effect of changes made by an immigrating individual will depend on patterns of between-individual variability. The extent of the change caused by immigration can be the same as that created by a mistake in learning. Yet, it also has the potential to be greater than that: in a complex culture immigration can introduce more than one novel element at once into the population. An immigrating individual will have a large repertoire in which the novel elements can be represented multiple times and multiple immigrating individuals can also have shared element types. Thus, those novel element types will not necessarily be underrepresented compared to the already existing ones. Investigating complex cultural systems would not only allow us to investigate these two mechanisms separately, but to see their joint effect on the level of individuals and to see how this effect will then shape the cultural characteristics at the population level. Following previous studies, we did not consider learning mistakes separately from innovations, as they can have the same effect within the model frameworks (Goodfellow and Slater, 1986; Williams and Slater, 1990; Lachlan et al., 2018).
Positive frequency-dependent learning, compared to unbiased frequency-dependent learning, involves that individuals copy the more common behavioral elements at a rate disproportionately higher than the relative frequency with which they are encountered (Boyd and Richerson, 1985; Henrich and Boyd, 1998). The mechanism itself can take many forms depending on who and what the learning individual is sampling (Laland, 2004; Morgan et al., 2019). Nearly all studies of positive frequency-dependence have focused on conformist bias defined either as copying the majority of individuals or of instances (see van Leeuwen et al., 2015; Morgan et al., 2019 for a discussion about differences between the two). Conformism is known to enhance cultural stability by driving the population to convergence in their behavioral elements. Thus, on one side, it promotes the formation of common cultural elements, on the other side, it ensures the stability of frequent elements. Indeed, apart from birds (Aplin et al., 2017, 2015) conformism has been shown to shape foraging traditions in fish (Pike and Laland, 2010) and in primates (Whiten et al., 2005; van de Waal et al., 2013). Although the effect of a conformist bias wasn’t explicitly demonstrated in North Island saddlebacks (Philesturnus rufusater) even individuals with long-established song patterns altered their songs upon the arrival of new neighbors in a manner that resembles conformism (Jenkins, 1978). Lachlan et al. (2018) have shown that a conformist social learning bias explains best the cultural patterns observed in swamp sparrow songs compared to social learning biases driven by the intrinsic fitness of demonstrators or of song element types. In the same study, conformity has been shown to be able to maintain song traditions in a population for very long periods of time and that common song elements were also the most persistent ones. However, besides facilitating stability, conformism decreases diversity in favor of the more common elements (Kandler and Laland, 2009) and unless counteracted by mechanisms like cultural mutation, it can drive the culture to a stable but monolithic state (Henrich and Boyd, 1998; Lachlan et al., 2018). In our study we implemented a learning bias that resembled copy-the-majority of instances (Morgan et al., 2019) the most where individuals copy the most common behavioral element type among their tutors but irrespective of how many of the tutors possess that element type. Theoretically, this form of positive frequency-dependence should also have the potential to enforce stability at the price of diversity.
With the present study we had two principal aims. First, we investigated how the characteristics of complex cultural systems are affected by positive frequency-dependent learning, learning mistakes and immigration. We examined how the changes of the repertoire on the individual level affect cultural diversity on the population level and how those two characteristics shape the cultural stability of the system. Second, we investigated whether the three mechanisms are necessary and sufficient to create and to maintain a stable polymorphic culture represented by an empirical example. To explore the effects of positive frequency-dependent learning, learning mistakes and immigration on a complex cultural system, we built an individual-based model in which we implemented the three mechanisms as modifiable parameters. The model mimicked song learning and immigration in a population of collared flycatchers (Ficedula albicollis), a species which exhibits a stable, polymorphic song culture. Therefore, to account for our second objective we compared the simulated data with field data so, we set the model’s demography-related parameters in a way that they would match those relevant for our collared flycatcher population. Thanks to long-term individual-level song recordings, we were capable of describing individual repertoires, between-individual differences, population-level cultural characteristics and cultural stability in the song of a collared flycatcher population. We measured repertoire size and composition on the level of individuals and of the population and cultural stability based on temporal changes in the population repertoire. We did so in both the simulated and the field data. We anticipated that a certain combination of the three tested mechanisms would generate patterns in the simulated data that would correspond with the field data on both the individual and the population level and on the temporal scale as well.
2. Materials and methods
2.1. Model species and field data
The collared flycatcher is a migratory, socially monogamous, territory holding oscine species. The smallest units in their songs are called syllables and the songs, lasting a few seconds long, are built up from around 10 syllables (Garamszegi et al., 2012; Zsebők et al., 2017). Individuals, based on samples of 20 songs, use around 20–100 different syllable types with varying frequencies (Garamszegi et al., 2006; Zsebők et al., 2018b). For collared flycatchers, the number of syllables and their relative frequency in their repertoire changes throughout their life, but major changes occur between their first and second breeding season when their repertoire size significantly increases (Garamszegi et al., 2007). Taking into account not only the presence of particular syllable types but their relative frequency as well, Garamszegi et al. (2012) have shown that in the population there is a 30% compositional similarity between the individuals’ repertoire. Vaskuti et al. (2016) have described temporal changes in the song of a collared flycatcher population over a 5-year period that can be taken as a sign of cultural evolution. In a recent study it has also been shown that shortly after acquiring a new syllable type, males sang that syllable type with an extra variation in its physical structure. Due to this potential mistake in learning, variation creates an opportunity for new syllable types to appear (Vaskuti et al., 2022).
Data on collared flycatchers was acquired in a field station in the Pilis-Visegrádi Mountains, Hungary (47° 43′ N 19° 01′ E). The study area contains about 500 nest boxes where approximately 100 males breed each year. Song recordings were collected between 1999 and 2015, in the breeding season (April–May) with parabolic microphones (Telinga parabolic dish and Sennheiser ME-62 microphone with a P6 preamplifier) and digital sound recorders (Tascam DR1 and Microtrack II). The recorded songs were first visually inspected in Adobe Audition 3.0 and only those where the syllables’ spectrograms could be clearly distinguished from the background noise, were manually selected for further analysis. In the selected recordings, syllables were manually segmented and then clustered on the within- and between-individual levels by computer aided manual clustering with the Ficedula Toolbox (open source, freeware, Zsebők et al., 2018a).1 A bias in clustering performed by different observers could be eliminated by accounting for inter-observer reliability measured with the help of κ-statistics (Cohen, 1960). Both on the within-, and on the between-individual level of clustering the agreement between observers was very high, κ being 0.87 and 0.83, respectively (Zsebők et al., 2018a). After these steps, individuals could be assigned with a repertoire that was comparable within- and between individuals. Detailed methods of song recording and song analysis are described by Garamszegi et al. (2018).
Based on this dataset we could observe a relatively high variance in the frequencies of syllables within individuals. To check whether this variance is consistent in time and isn’t only due to short-term stochasticity we analyzed repeated recordings from individuals on the between-day scale (see the methods for the repeated recordings in Zsebők et al., 2017) and inspected the correlation in their use of syllable types between the first and second day of recording. Based on the data of 17 individuals, we calculated Pearson’s correlations on the relative frequency values of the syllables within-individually, then, with a meta-analytical approach (“metacor” R library, Laliberté, 2022), we calculated the mean correlation value. The overall R effect size was 0.63 (CI: 0.58–0.68), p < 0.001. To test the difference between randomized data and real data, we performed permutation tests within-individually, in which we randomized 1000 times the relative frequency data of the syllable types and calculated the Pearson’s correlation coefficients. This process resulted in 17 p-values. To evaluate the overall results, we calculated the overall p-value with the help of another meta-analytic tool, the “metap” R library (Dewey, 2022). The overall effect size was highly significant (z = 6.55, p < 0.001), indicating that the observed frequency of the syllables is not due to chance. Thus, individuals showed a relatively high consistency in their syllable usage, and it is unlikely that this variance would be due to short-term stochasticity.
For the current study we used a subset of the individual recordings obtained on the field (Supplementary Table 1). We selected recordings that contained at least 150 syllables, and for these we always chose the first 150 syllables recorded, which in our study represented the individual syllable production vector. These vectors were representations of the birds’ realized repertoires that could be observed. To avoid within-year repetition of individuals, we used only 1 recording/individual/year from the dataset. These recordings were selected with the help of birds’ ring numbers. Additionally, for those recordings for which ring number wasn’t available, we set up a spatial (>300 m) or a temporal (>5 days) distance criteria to be met between the recordings. As each male collared flycatcher is territorial and sings for approx. 3–4 days until it pairs up (Pärt, 1994), it is very unlikely that the same bird would sing at two relatively distant locations or across a time interval that’s greater than 5 days. We allowed between-year repetition of individuals, but none were found among those with a ring number. With the above-mentioned sampling limitation, we were able to collect 10 individual recordings/year for 11 different years from a 15-year long period between 2000 and 2015. After this refinement, individual syllable production vectors consisted of 48.6 ± 13.9 unique syllable types on average (with a range being between 19 and 80) and young individuals had a repertoire size of 37.8 ± 9.88 unique syllable types (N = 30). There were on average 311 ± 29.5 different syllable types in the sample in a year and in total there were 1,273 different syllables in the population. The average age of ringed individuals in the sample was 1.9 ± 1.1 years and the proportion of juveniles (individuals in their first breeding season) was 0.39.
2.2. The simulation model
To resemble field circumstances the simulated population consisted of 100 males as only males sing in collared flycatchers. The number of different syllable types in the population calculated from our sub-sample underestimates the actual diversity. Therefore, we set the number of available syllable types in the simulations, Ns, to 2000 as we assume this to be approximately similar to the total number of syllables the focal population of collared flycatchers might produce. Each individual in the model possessed a syllable production vector with a length of 150 syllables. Corresponding with field data each simulation began with young individuals’ production vector being filled up with 30 different syllable types randomly chosen from the 2000 long set. Production vectors of individuals were always filled up, so in this case at the beginning of each simulation they consisted of the 30 different syllable types being repeated 5 times. This way syllable types were represented uniformly within individuals but later repetition of syllable types within the syllable production vector allowed them to gain different frequencies. Thus, not only the repertoire size, but the rate at which different syllable types occur in it, could be recorded.
In the model, we implemented learning in a manner that resembled a strategy called copy-the-majority of instances (Morgan et al., 2019) as certain variants can be overrepresented in birds’ song due to being performed more frequently. To simplify our model, individuals could learn in their first year only. We set the number of learning occasions to 20 for each young individual. For each learning occasion/tutee, one tutor was assigned randomly from the population. We imagined that in nature most of the time birds listen to one conspecific at a time and they sample the song production of that individual which implies copying the majority of instances based on their frequency within that song production. The tutee chose one syllable from the repertoire of its tutor with probability , where fi is the relative frequency of syllable type i in the tutor’s repertoire and α ≥ 1 is the strength of positive frequency-dependence. Thus, the larger the α parameter the higher the probability of choosing a common syllable type. The chosen syllable was introduced into the tutee’s syllable production vector by replacing another syllable at a randomly chosen position within that vector (hence, the newly introduced syllable could be the same type as the substituted one). During learning, mistakes could occur with a probability of μl. For the current study we considered that when birds make a mistake in song learning, it is much more likely that they will acquire a syllable type that’s closely similar to the one intended to be learnt and not one that sounds completely different. We mimicked this similarity between syllable types by numbering them on a scale from 1 to 2000. When a mistake was made in the learning of syllable type j, one of its neighbors, either the syllable type j+1 or j−1, was learned. The two ends of the neighboring syllable scale were closed, thus syllable types 1 and 2000 became neighbors to each other.
In each year individuals could die with a given probability depending on their age. Individuals could live up to 8 years and mortality rates were assigned to each age-category in a way that the age-structure of the population would resemble the field data (Supplementary Table 2). The remaining population was always filled up to maintain the constant population size of 100 individuals and the new individuals were always juveniles. By default, we considered them to originate from our focal population therefore, syllables in their 150 long production vectors were sampled randomly from the syllable pool of the population. Note, that as opposed to the beginning of the simulations we didn’t restrict the subsequent generations of young birds to necessarily possess 30 different syllable types. They could own more or even less than that. We considered it more important to always represent the current state of cultural diversity in the population.
With probability μi, new individuals in the population could be immigrants. We considered immigrants to come from distinct populations. We assumed that these populations show similar aspects of diversity as our focal population, so their repertoire composition (frequency distribution of syllable types) was similar yet, the set of syllables that they used was different to a certain extent. As we had no information about the repertoire of different populations, we set the proportion of different syllable types between the focal and non-focal populations to 0.5 (choosing another similarity parameter only rescales the μi where the same effect of immigration is experienced). The set of similar syllable types between those two populations was randomly chosen each year. This way, the production vector of immigrants consisted of 150 syllables randomly selected from the non-focal population’s set of syllables taking into account the syllable types’ relative frequency.
To account for our first objective, the effects of the parameters on cultural diversity and stability, we investigated three different values for each of the three relevant parameters that were based on values from previous similar studies (Goodfellow and Slater, 1986; Henrich and Boyd, 1998; Lachlan and Slater, 2003; Bentley et al., 2004; Kandler and Laland, 2009; Lachlan et al., 2018): the strength of positive frequency-dependence, α = {1, 1.1, 1.2}, the rate of learning mistakes, μl = {0, 0.1, 0.2} and the rate of immigration, μi = {0, 0.02, 0.04}. As in previous studies the rate of immigration has been investigated together with learning mistakes under the term “cultural mutation,” we didn’t have reference values for this mechanism. For μl and μi the value 0 was included to explore the situation when either one of these mechanisms wasn’t taking place and α = 1 studies the case when a syllable is chosen according to its frequency in the tutor’s repertoire. We investigated all 27 combinations of these parameters. To take into account the variance in the outcome of the simulations, each combination was run 10 times independently of each other (altogether 27 × 10 simulations). The individuals’ and consequently the population’s song repertoire was randomly assigned in the beginning of each simulation thus the emerging patterns could be attributed to the mechanisms’ effects only. Simulations ran for 8,000 cycles to make sure that the population’s repertoire has reached a size stable in time. In the simulations, cycles corresponded with years. The simulation code was written in Python 3.6.6 (van Rossum and Drake, 2009) and can be found at https://github.com/karolaannabarta/modelling_complex_birdsong_culture_Flycatcher.git.
For comparability reasons we sampled the simulated population the same way we sampled the field recordings. Therefore, in each year 10 individuals were selected, and their production vector was collected.
2.3. Measures of cultural diversity and stability
To account for the effects of the three investigated mechanisms on cultural systems we specified measures that would characterize the diversity and stability of the culture. We started to build up from the individual level and through the between-individual variability arrive at the population level diversity. We measured stability on the population level. Altogether we used eight different measures: (i) individual repertoire size, (ii) individual repertoire composition, (iii) repertoire differences in the presence/absence (P/A) of syllable types between-individuals, (iv) repertoire differences in the relative frequency (RF) of syllable types between-individuals, (v) population repertoire size, (vi) population repertoire composition, (vii) P/A differences in the population repertoire through time and (viii) RF differences in the population repertoire through time. These measures were collected for the field- and for the simulated data as well and they were always based on the 10 individuals selected from the population in a given year to make these two datasets comparable.
In previous studies, cultural diversity has been measured as the number of different behavioral element types (repertoire size) in a population. Here, we began the characterization of cultural systems from the individual level so as a first step we measured the individual repertoire size (i). However, repertoire size is a rather simplistic choice to depict diversity in a complex culture since the same number of unique song elements can cover highly different song organization in different individuals (Garamszegi et al., 2005). Therefore, we also used the relative frequency of syllable types as a measure of diversity. The syllable types of a repertoire could be sorted in descending order based on their relative frequency and we fitted a curve on the relationship between the ordered syllables and their relative frequency (with “ggplot2”s smoothed conditional means using the “loess” method, Cleveland et al., 2017) to visualize the repertoire composition of individuals.
(ii) Following up on the previous line of thought, we characterized between-individual differences also in two ways: in their difference between syllable types constituting the individual repertoire (P/A differences) (iii) and in their difference between the relative frequencies of different syllable types (RF differences) (iv). RF differences between-individuals were calculated with the help of the Bray-Curtis dissimilarity index (Bray and Curtis, 1957) using the “vegdist()” function from the “vegan” R package (Oksanen et al., 2022). P/A differences were calculated the same way by performing presence/absence standardization on the data before calculating the index with the help of the function’s “binary” option. Both measures were calculated pair-wise between all individuals within the same year.
The next level in our cultural system was the population. We characterized diversity on the population level by measuring the population repertoire size (v) and composition (vi) in a similar way as we did on the individual level. Population level cultural characteristics were all based on the joint production vectors of the sample of 10 individuals.
Thanks to the availability of long-term field data, we also quantified cultural stability as the extent and accumulation rate of cultural changes in the studied flycatcher population. We did this with the help of two measures: P/A (vii) and RF (viii) differences within the population through time. P/A differences show changes in the syllable types in the population repertoire while RF differences show how the relative frequency of these are changing. Differences were measured in a similar way to between-individual differences between all years on a 15 year-long period. On the acquired points we fitted a curve with “ggplot2”s “loess” method (Cleveland et al., 2017) which served with information on how rapidly changes are accumulating within the population repertoire. The length of the period during which these measures were assessed was based on the availability of the field data and thus, they were collected from the final 15 years of the simulations.
For the other measures (i–vi) simulated data were collected in the final 10 years of each simulation. Individual level measures were collected on each individual in each of the last 10 years of each simulation and population level measures were collected for each of the last 10 years of each simulation. As we observed an unexpected temporal pattern in the population repertoire size of the simulated data during data analysis, we collected this measure throughout the whole simulation.
2.4. Statistical analyses
2.4.1. Effects of the model parameters on cultural diversity and stability
We investigated the parameters’ effects on the measures of cultural diversity and stability depending on the characteristics of the given measure. In the case of the fitted curves of the individual and population repertoire compositions, we compared the curves to each other visually. Similar to repertoire compositions, we fitted curves on the P/A and RF changes in the population repertoire through time and assessed them visually. The individual and population repertoire sizes and the between-individual differences were described by the mean and the 95% confidence interval of the sample.
To test whether the effects of learning mistakes and immigration are indeed distinguishable in complex cultures we ran two sets of simulations where we fixed the strength of positive frequency-dependence and added either learning mistakes or immigration to the model. The values of the latter two parameters were set so that the average number of incoming syllables would be the same in both sets of simulations. These were {α, μl, μi} = {1.1, 0.2, 0} and {α, μl, μi} = {1.1, 0, 0.053}, respectively.
2.4.2. Sensitivity to the fixed parameters
There were several parameters fixed in our model because they were either intended to match field data or to represent values that were biologically the most meaningful. We assumed that none of these parameters would affect the final state of the cultural diversity and stability qualitatively, only the amount of time needed to reach those final states would be sensitive to these parameters. Nevertheless, to test the sensitivity of our simulated results to the chosen fixed parameters of our model we ran simulations with differing values of those parameters. We tested the effect of population size, Np = {50, 100, 200}; the total number of syllables, Ns = {1500, 2000, 2500}; the number of learning occasions for young birds, Nl = {10, 20, 40} and the proportion of different syllable types in the focal and non-focal populations, pd = {0.5, 1}. As for the modifiable parameters we fixed their values at {α, μl, μi} = {1.1, 0.1, 0.03}, where the system wouldn’t fall into a monolithic state. To save computational time we ran these simulations only for 4,000 cycles. We collected the measures of cultural diversity and stability for these simulations and compared them visually.
2.4.3. Comparison of simulation results with field data
To account for the parameter-combination(s) that would describe the song culture of the studied collared flycatcher population the best, we both inspected differences between the simulated and field data visually and also performed an Approximate Bayesian Computation (ABC) (see Beaumont, 2010; Sunnåker et al., 2013 for a review) to estimate the posterior parameter distributions of our model.
For the ABC analysis we wanted to cover an extended parameter space to encompass multiple potentially suitable parameter combinations. The prior distributions of all three parameters were set as uniform distributions with the limits α = {1, 2}, μl = {0, 1} and μi = {0, 0.4}. We ran 100,000 simulations with the randomly sampled parameter combinations with each combination being represented only once in our observations.
The ABC requires a set of summary statistics based on which the simulated data will be compared to the empirical data. To describe the eight measures, we derived 14 variables to use as summary statistics from each simulation. For the individual repertoire sizes we calculated their mean (summary statistic 1). In the case of the individual repertoire compositions, we treated the distribution of syllable type frequencies as segmented (or piecewise linear) relationships (Muggeo, 2008). First, we fitted linear models on the repertoire compositions by taking the log-transformed values of the relative frequency of syllable types as the response variable and the log-transformed values of the ordered syllables as the explanatory variable. Then we used the R package “segmented” (Muggeo, 2008) that fits regression models on segmented relationships by splitting the previously fitted linear regression into two or more separate models. In the case of different parameter-combinations the curves of the repertoire compositions showed different segmentation patterns, so we did not set the number and position of the breakpoints for the segmented models beforehand. By sorting the syllables in the repertoires in a descending order based on their relative frequency, the first segment of each segmented model represented the frequency distribution of the commonest syllables. Thus, we extracted the intercept and slope of the first segment and the first breakpoint of the segmented model (summary statistics 2–4). In the case of several parameter-combinations (e.g., when the system fell into a monolithic state) either the linear or the segmented model couldn’t be fitted. Consequently, the given summary statistics were not recorded for these simulations. As these cases deviated highly from the empirical data, we did not expect them to considerably alter the parameter estimates. We also calculated the mean of the P/A and RF between-individual differences (summary statistics 5–6).
Similarly to individual repertoires, we quantified the population level measures of cultural diversity: the mean population repertoire size (summary statistic 7) and the intercept (summary statistic 8), slope (summary statistic 9) and breakpoint (summary statistic 10) of the population repertoire compositions. Lastly, for each simulation we fit a linear model on the differences within the population repertoire through time. We obtained the intercept (summary statistics 11–12) and the slope (summary statistic 13–14) for both the linear models fitted on the P/A (summary statistics 11–12) and on the RF (summary statistics 13–14) changes in the population repertoire.
To account for possible redundancies between our summary statistics we performed a Principal Component Analysis (PCA) on them (Bazin et al., 2010; Beaumont, 2010). Because PCA requires datasets without missing values, we had to fill the gaps in our data where particular summary statistics couldn’t be calculated. We used the R package “missMDA” (Josse and Husson, 2016) that allows PCA on incomplete datasets by imputing missing values based on a principal component method which assigns the missing values based on the similarities between observations and the relationships between variables. The package also allows for visual investigation of uncertainty on the imputed dataset. In our dataset there were 81 missing values distributed among 26 simulations and 6 summary statistics whose uncertainty was low (Supplementary Figure 1B). We performed PCA on the imputed and scaled summary statistics. The resulting dimensions were projected on the field data as well.
Approximate Bayesian Computation was carried out by using the R package “abc” (Csilléry et al., 2012). We selected the first 5 PCA dimensions as they covered 96.75% of the variance. We set the tolerance value ε to 0.005. In ABC, ε sets the proportion of accepted posterior samples. During ABC multivariate parameter values θi are sampled from their prior distribution, and their resulting summary statistics S(yi) are compared to the empirical data S(y0). For the comparison, we used the “rejection” method which computes differences between S(yi) and S(y0) as the Euclidean distance between values. Finally, a proportion of ε samples are selected where the distance is the smallest. The accepted θi’s will be taken as a sample used to compute the posterior parameter distribution (Csilléry et al., 2012).
For data handling we used R version 4.0.2 (R Core Team, 2020) together with the “tidyverse” package (Wickham et al., 2019). Figures were made with the help of package “ggplot2” (Wickham, 2016).
3. Results
3.1. Effects of the model parameters
Under the investigated parameter values, the repertoire size of individuals ranged between the values 1 and 143 in the simulated populations. A decrease in the strength of positive frequency-dependence, α, led to an increased individual repertoire size (Figure 1). An increase in both the μi and the μl increased the size of the individual repertoires.
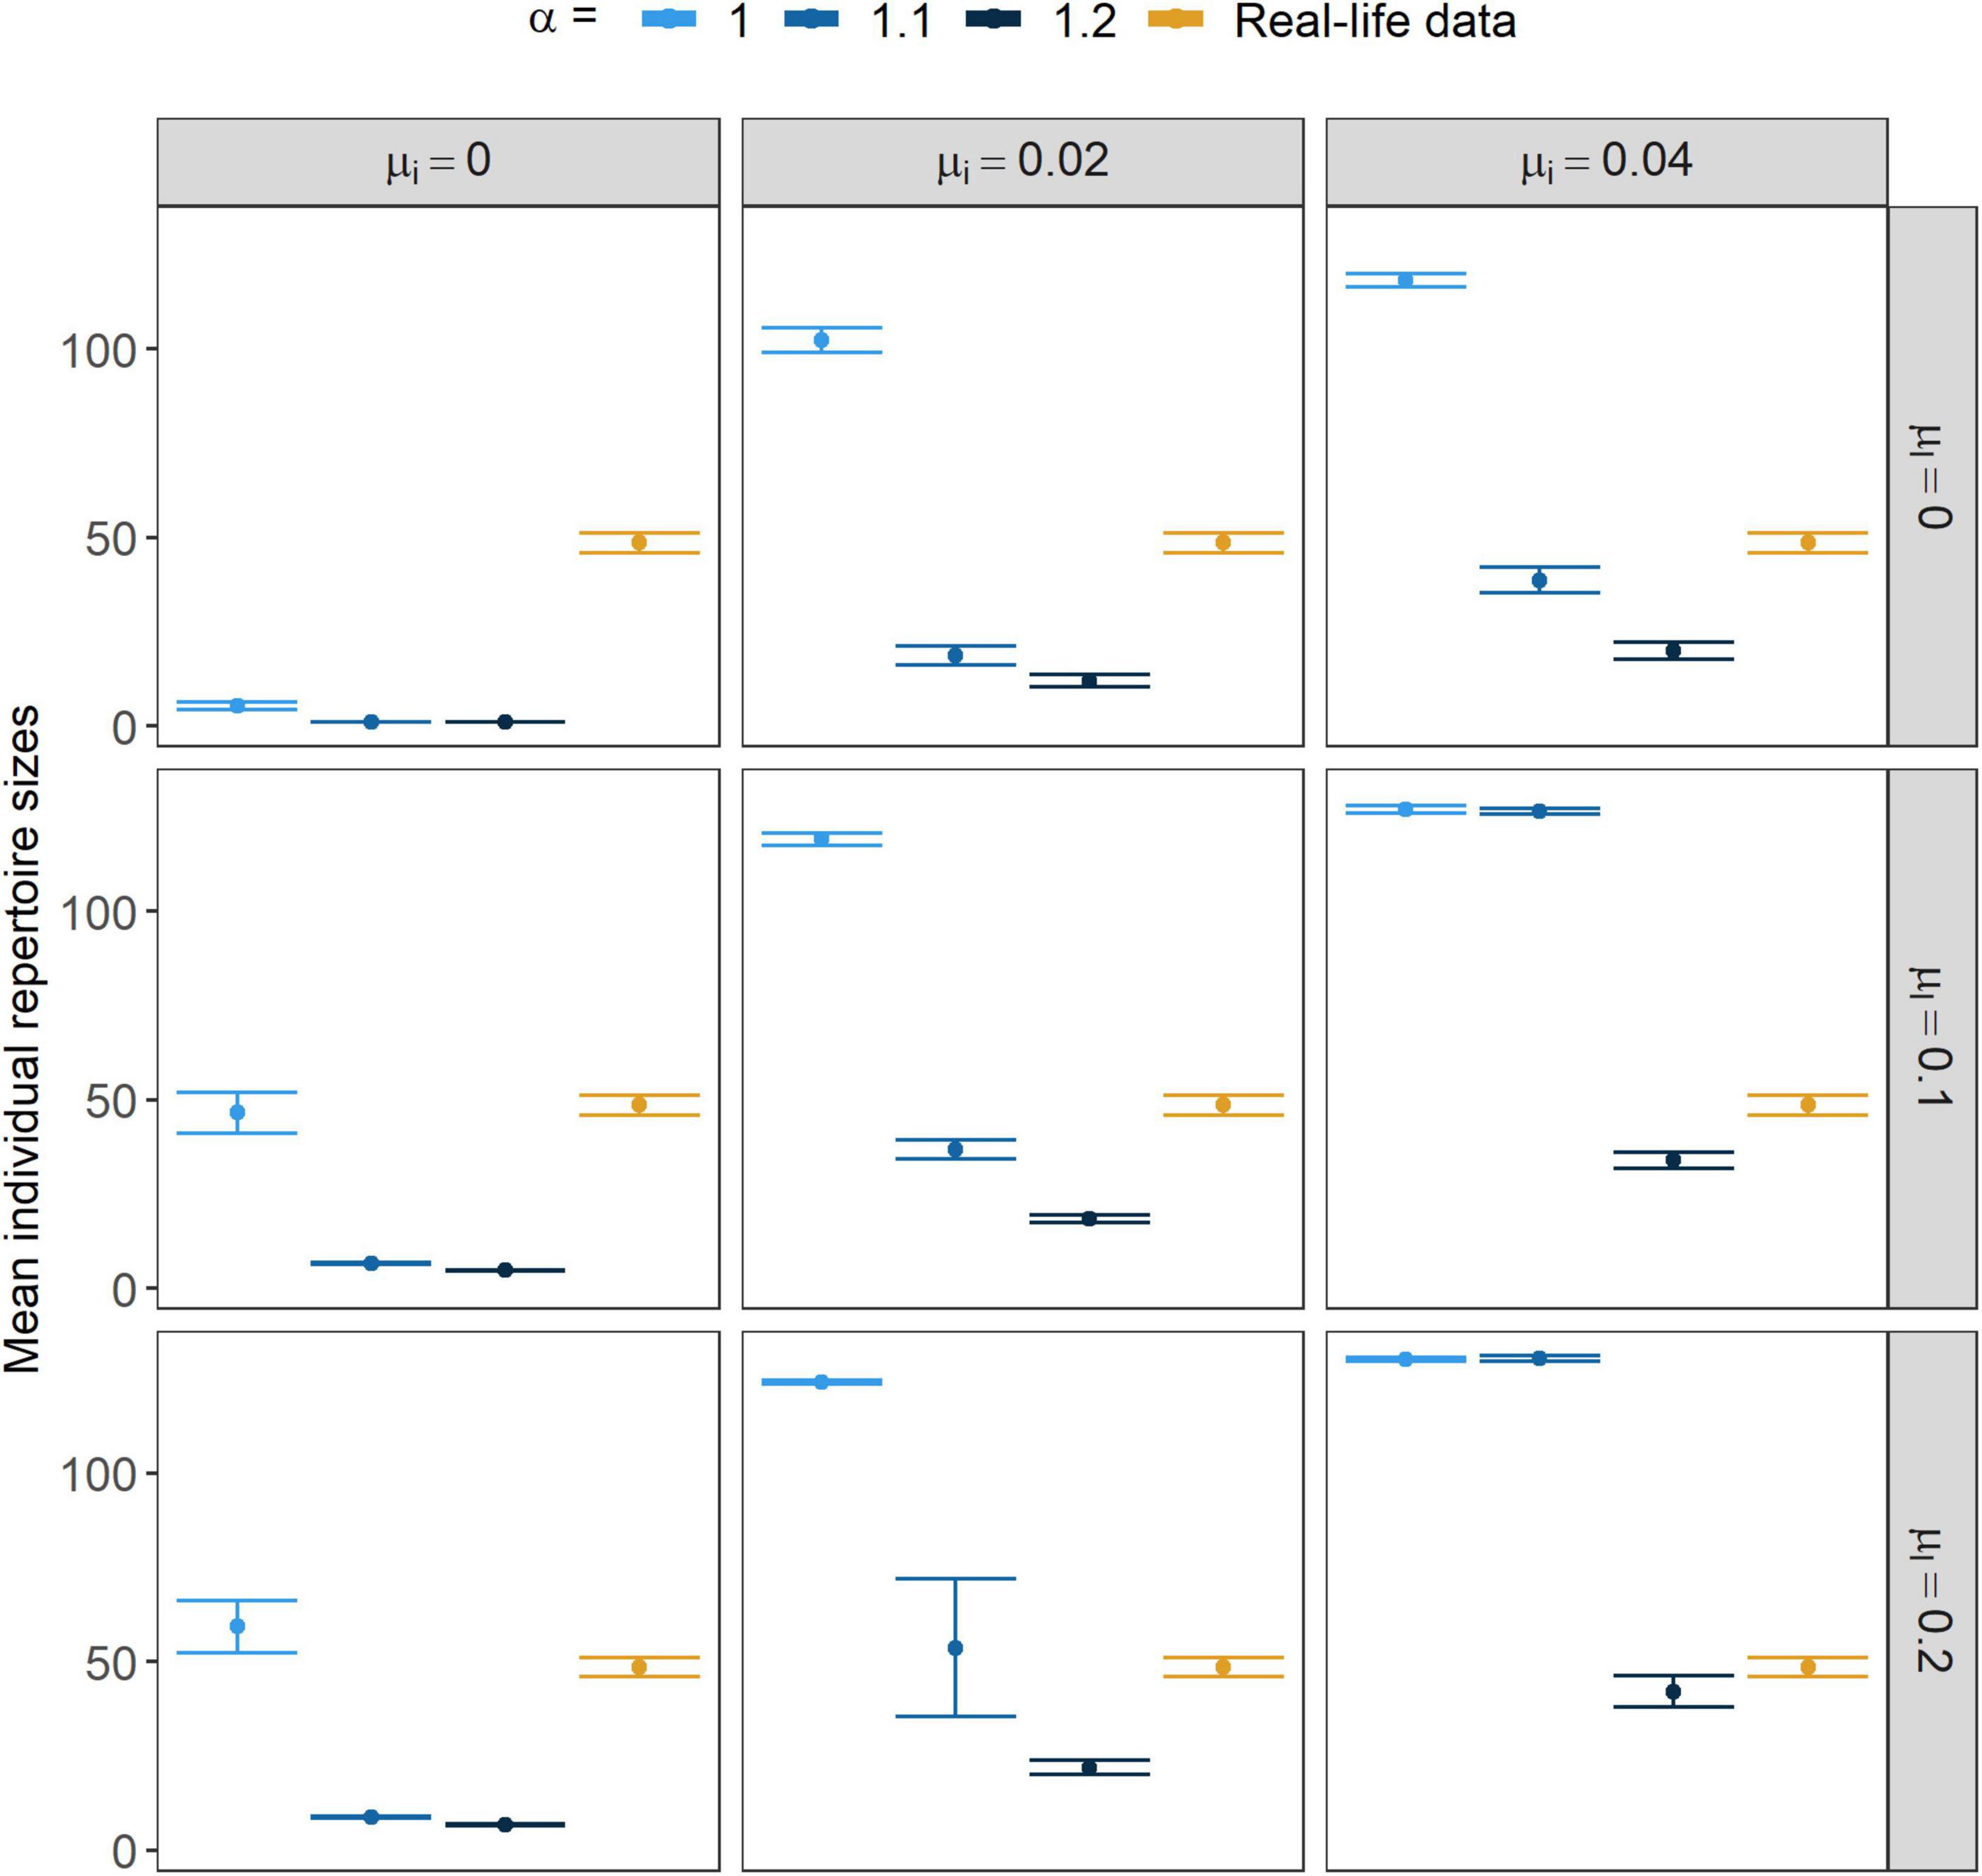
Figure 1. Size of the individual repertoires. Points show the mean of the individual repertoire sizes while error bars stand for their 95% CI. α marks the strength of conformism, while μl and μi stand for the rates of learning mistakes and immigration, respectively.
When looking at the individual repertoire compositions, at higher α values individuals showed a repertoire distribution dominated by one common syllable type while the others remained very rare in the individuals’ repertoire (Figure 2). On the contrary, increasing both μi and μl parameters would lead the individual repertoire distribution to be less steep, but only when α was sufficiently small. With positive frequency-dependence being too strong, not even the mutual presence of μi and μl could significantly affect the repertoire distributions (Figure 2).
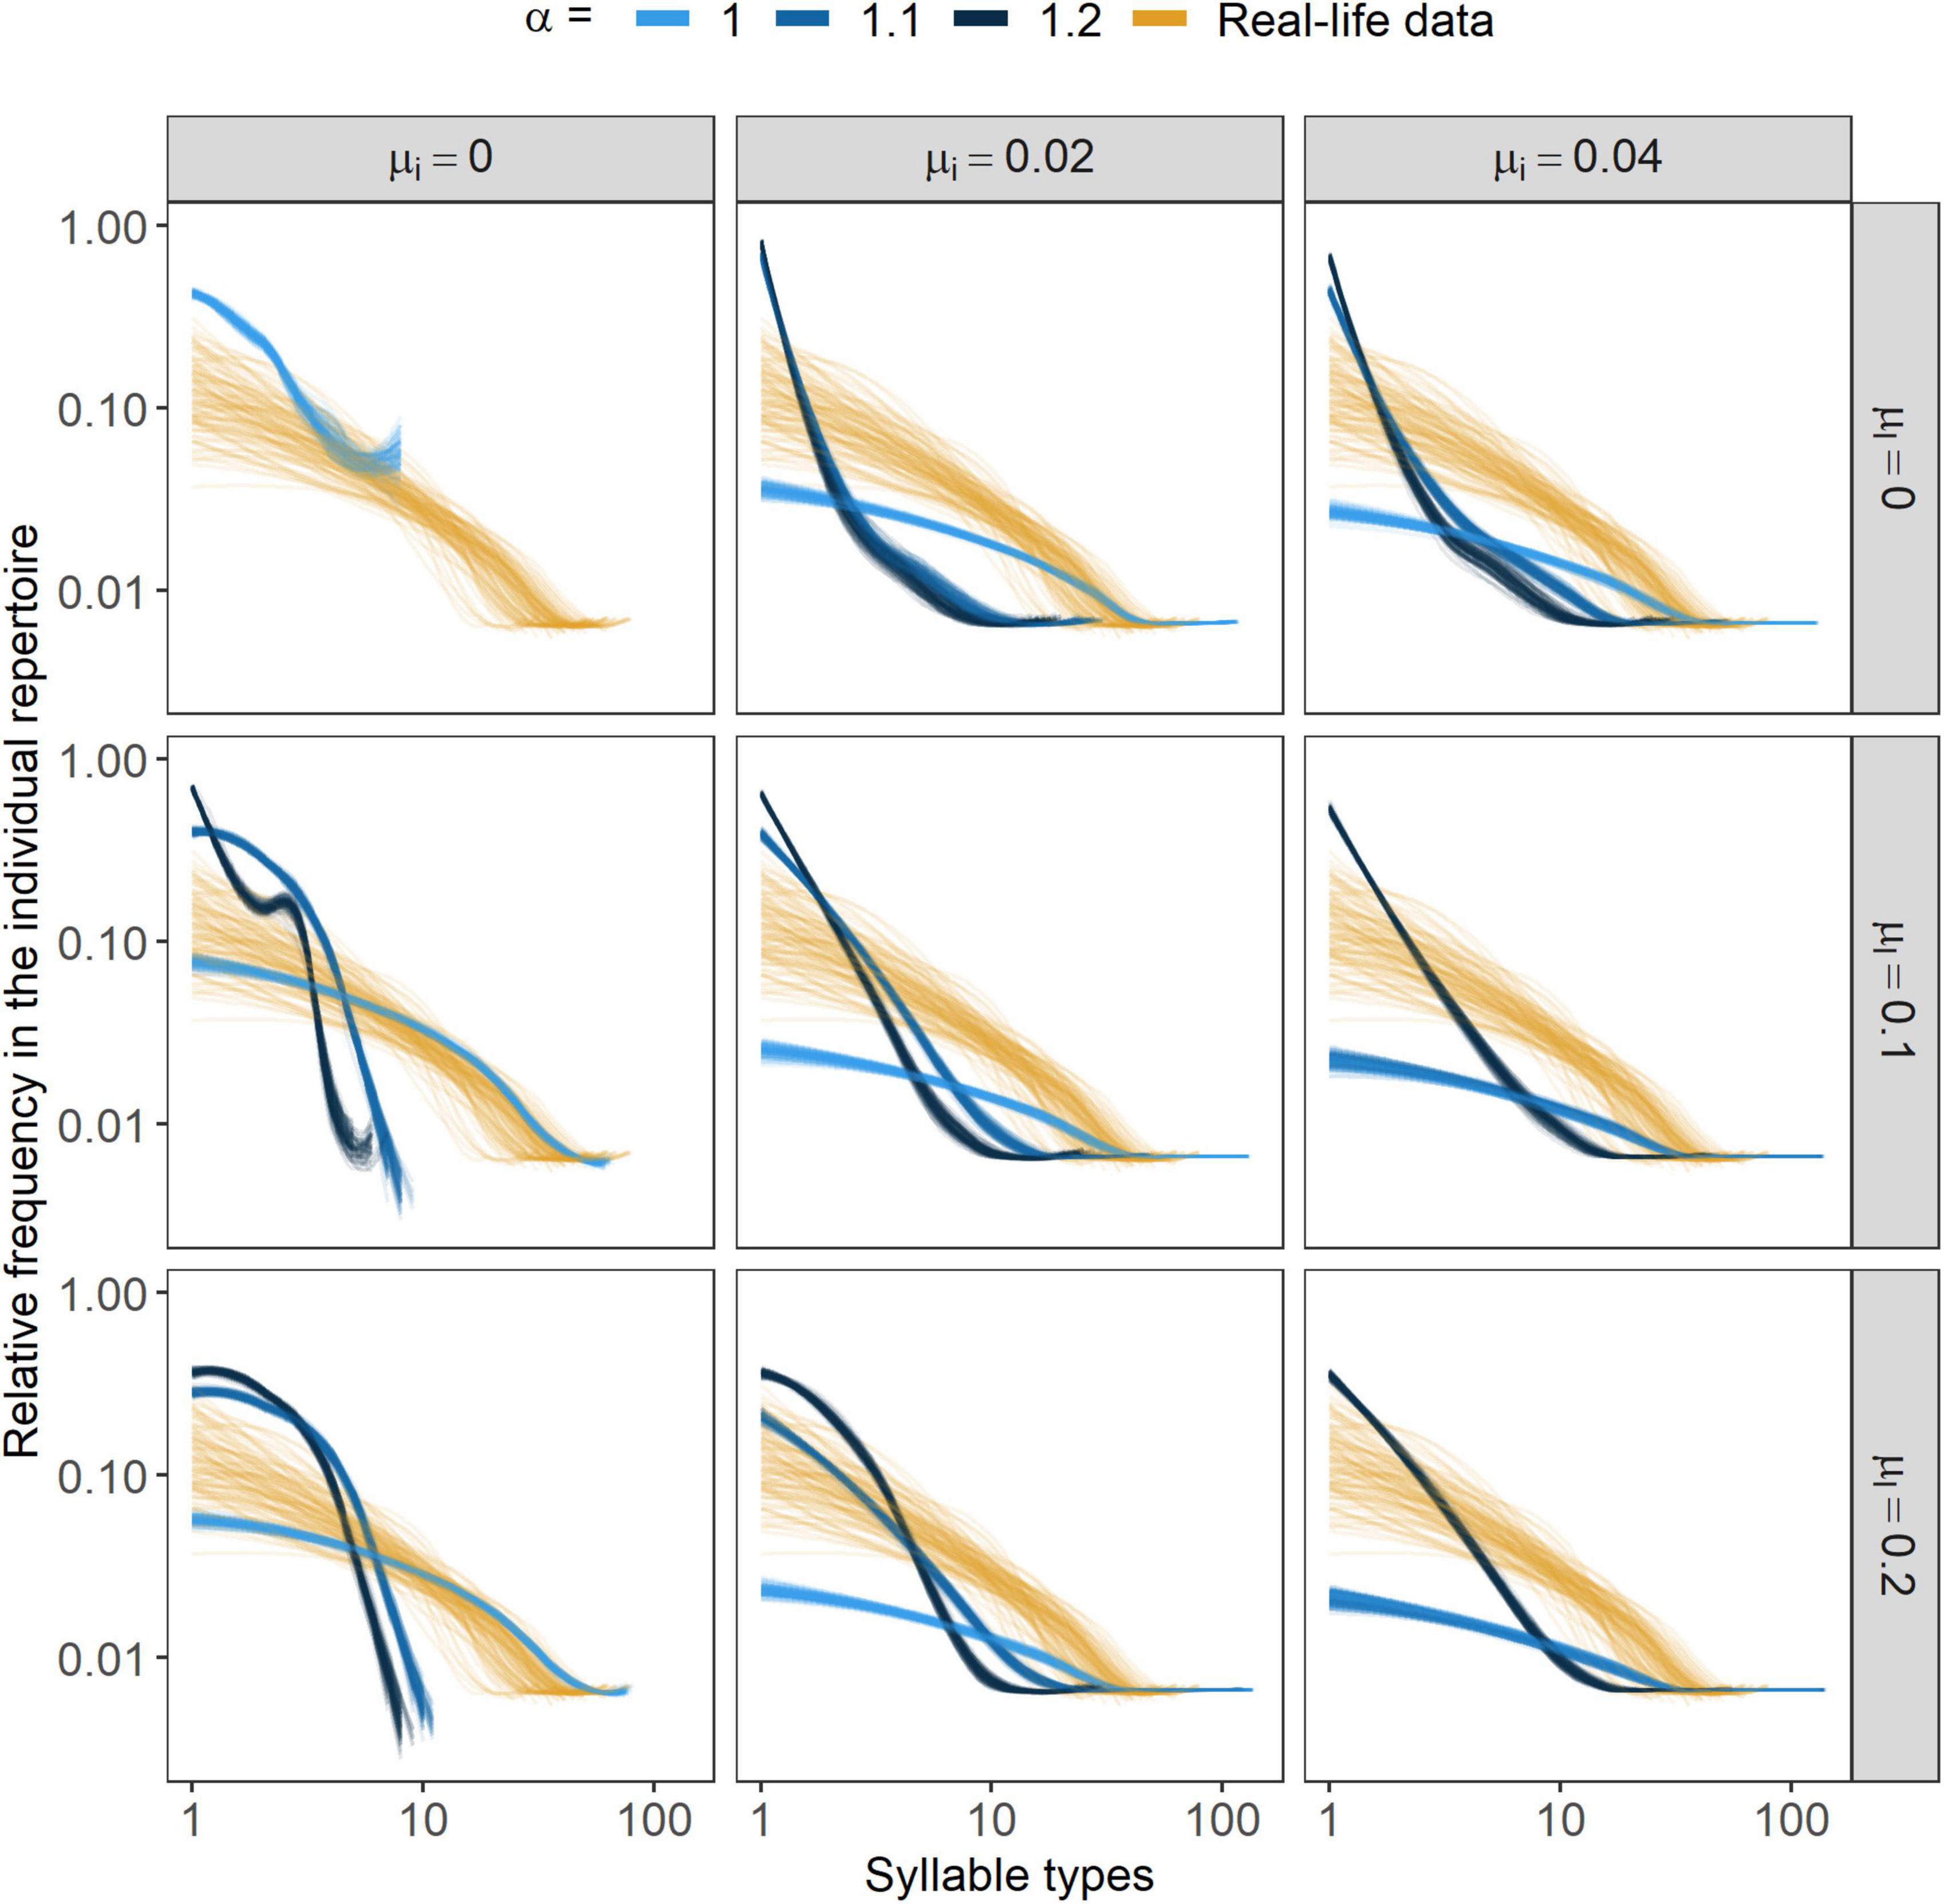
Figure 2. Syllable type frequency distributions in the individual repertoire. Lines represent smoothed conditional means (fitted with the “loess” method, Cleveland et al., 2017) of the frequency distributions of individual repertoires from the final 10 years of each simulation. In each parameter- combination 10 independent simulations were run and in each of those 10 individuals were selected in each year of the final 10 years. α marks the strength of conformism, while μl and μi stand for the rates of learning mistakes and immigration, respectively. In the case of the parameter- combinations {α, μl, μi} = {1.1, 0, 0} and {α, μl, μi} = {1.2, 0, 0}, curves for the repertoire distributions could not be fit as there was solely one syllable type in the individuals’ repertoire.
Higher α values also caused both the P/A and the RF differences between individuals to decrease (Figures 3, 4, respectively); however, RF differences showed a greater decline. With higher rates of immigration and learning mistakes both measures grew higher.
Figure 3. Presence/absence (P/A) difference between individual repertoires within years. Points show the mean value while error bars stand for their 95% CI. α marks the strength of conformism, while μl and μi stand for the rates of learning mistakes and immigration, respectively.
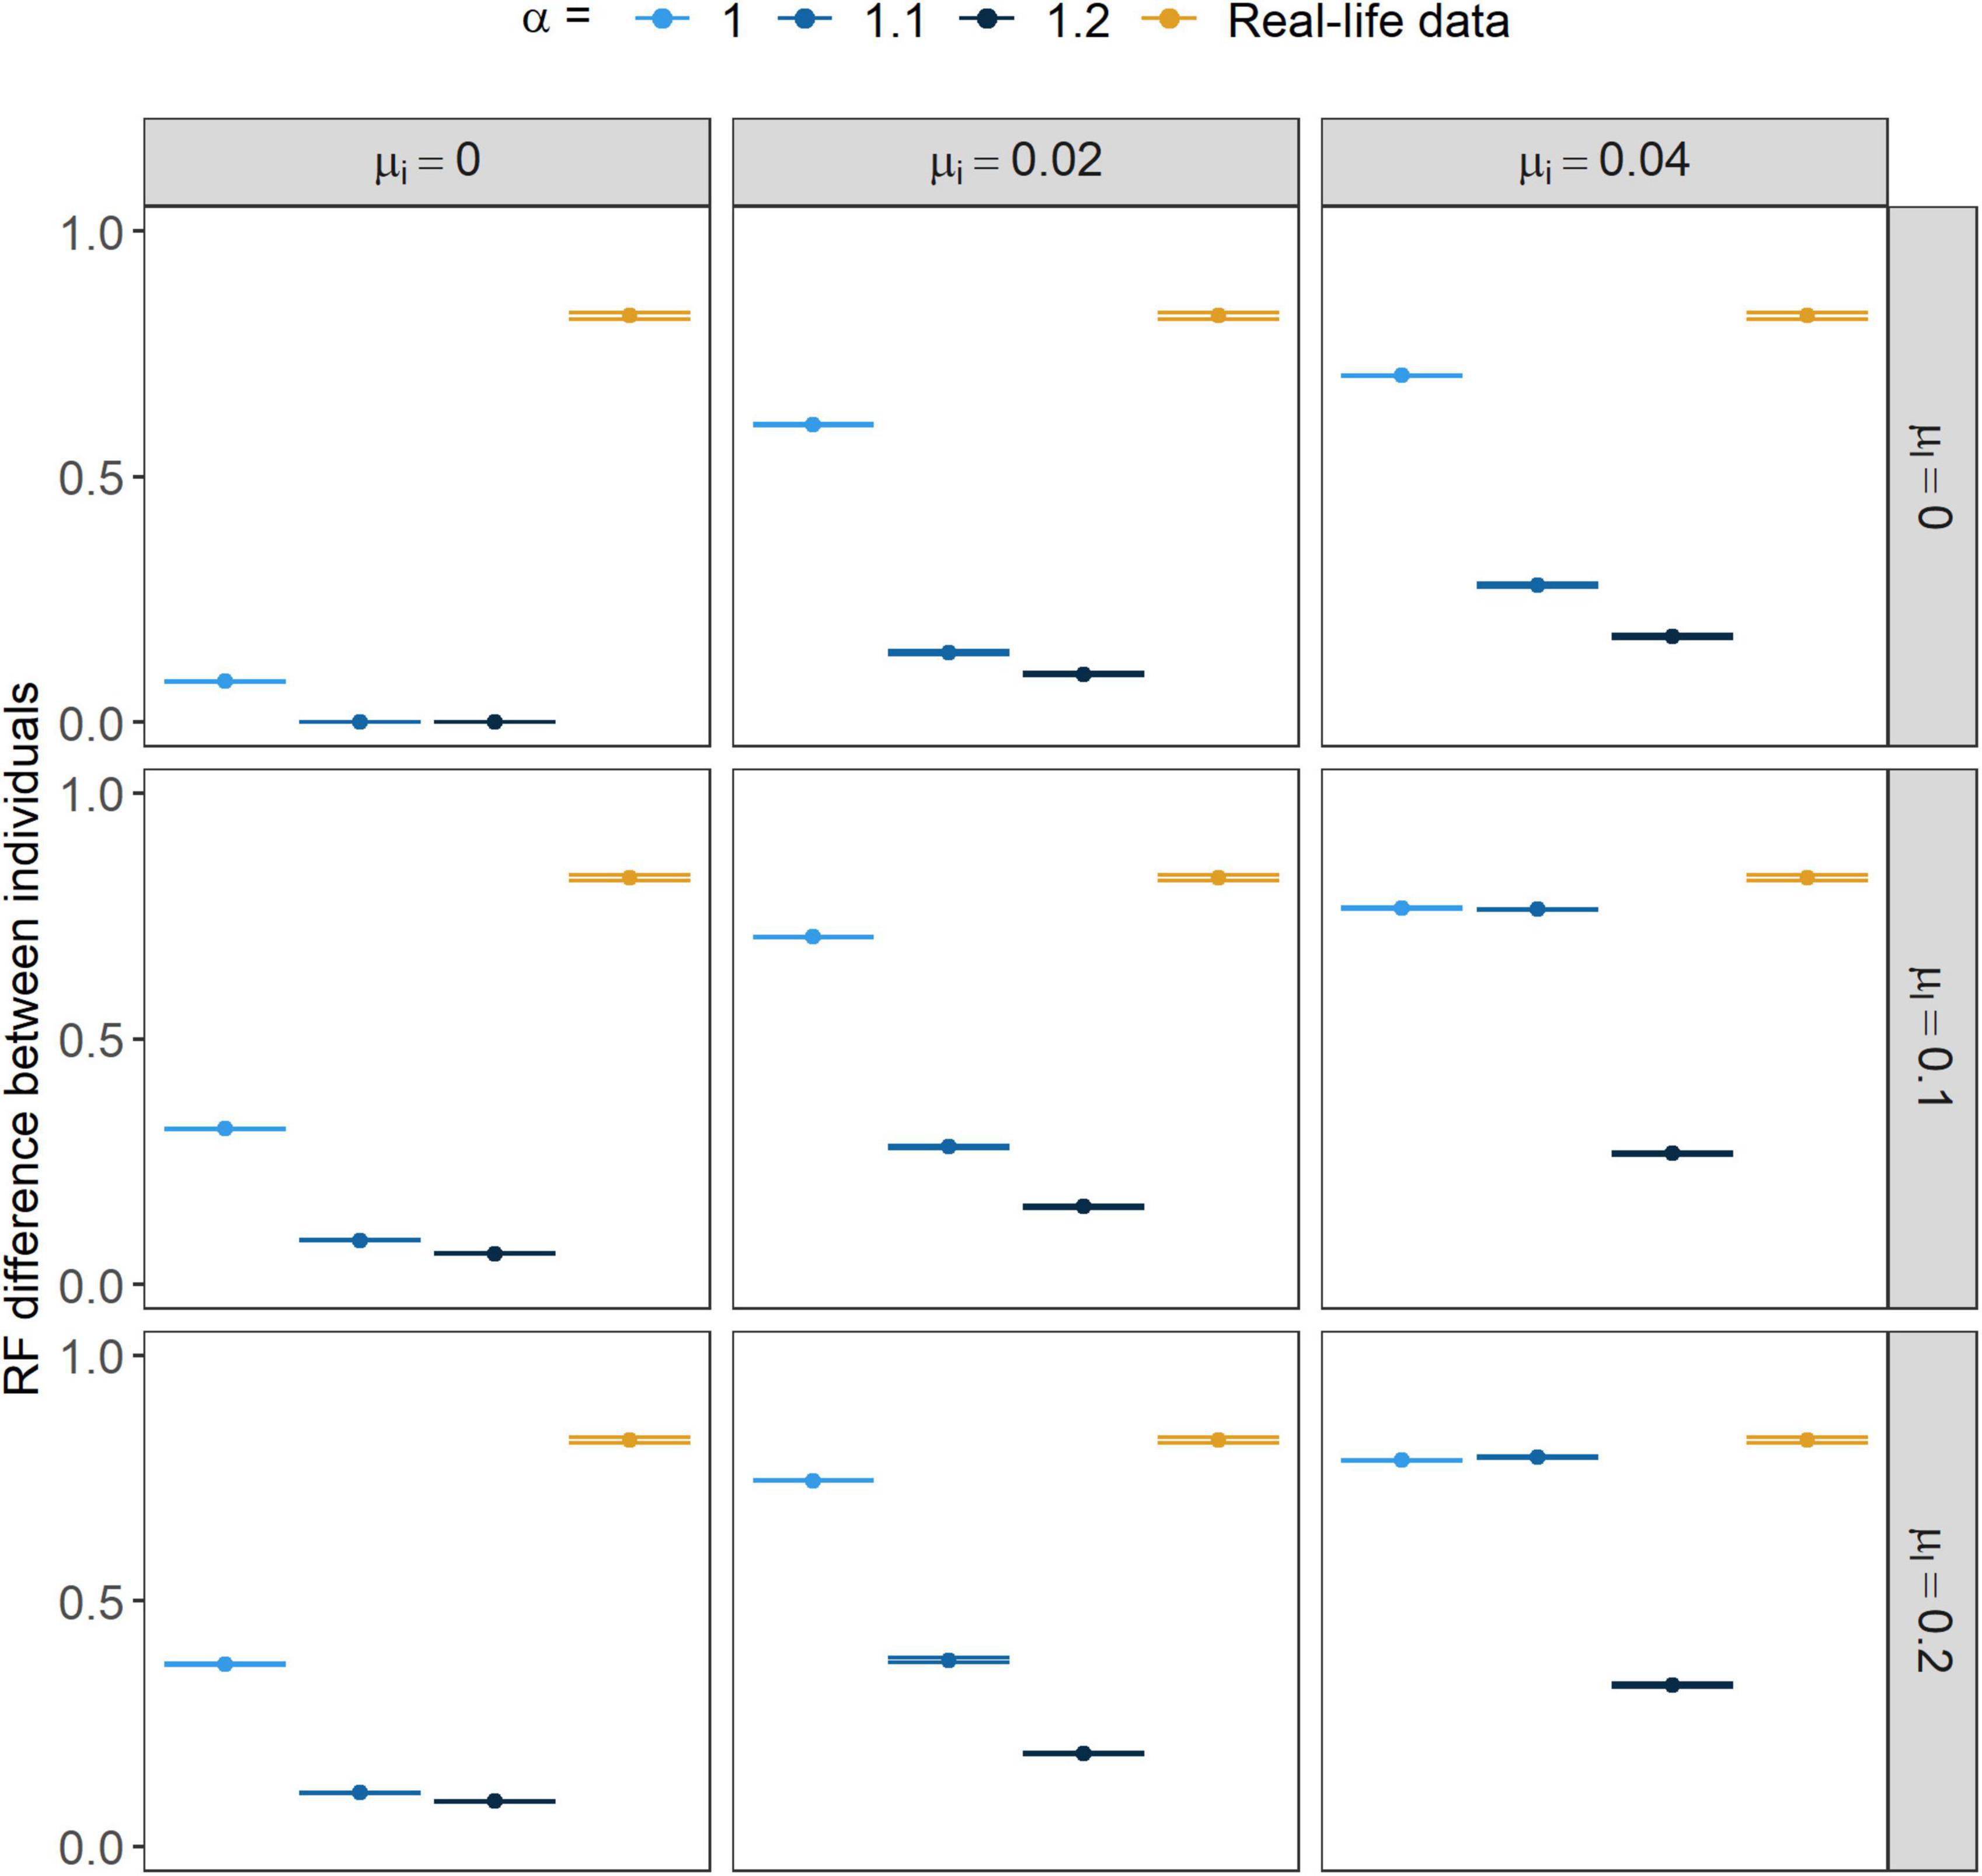
Figure 4. Relative frequency (RF) difference between individual repertoires within years. Points show the mean value while error bars stand for their 95% CI. α marks the strength of conformism, while μl and μi stand for the rates of learning mistakes and immigration, respectively.
In the last 10 years of the simulations, the average population repertoire size ranged between 1 and 741 different syllable types, however, without immigration it did not grow greater than 200 syllable types. It was negatively affected by the strength of positive frequency-dependence and positively affected by the rate of immigration and that of learning mistakes (Figure 5). When looking at the changes in the population repertoire size on a longer timescale (Figure 5) we could observe an interesting pattern. At the beginning of the simulations, it had a general pattern that was independent of the parameter-settings. The size of the repertoire was 280.625 ± 4.130 (N = 270) as a result of the random assignment of individual repertoires. This state immediately increased after the simulation-start and approached, or in some cases even reached, a size with 800 different syllable types. However, in a relatively short time the population repertoire size started to steeply decrease, after which it reached a stationary state (Figure 5). In the case of several parameter combinations, it seemed that the population’s repertoire size had reached and remained in a metastable state, which collapsed to a less diverse state after a time. The timing of this transition seemed to be dependent on the parameters. At higher positive frequency-dependence values, transitions occurred sooner but with higher values of immigration or learning mistakes they got delayed or did not take place at all within the time interval we have studied (Figure 5).
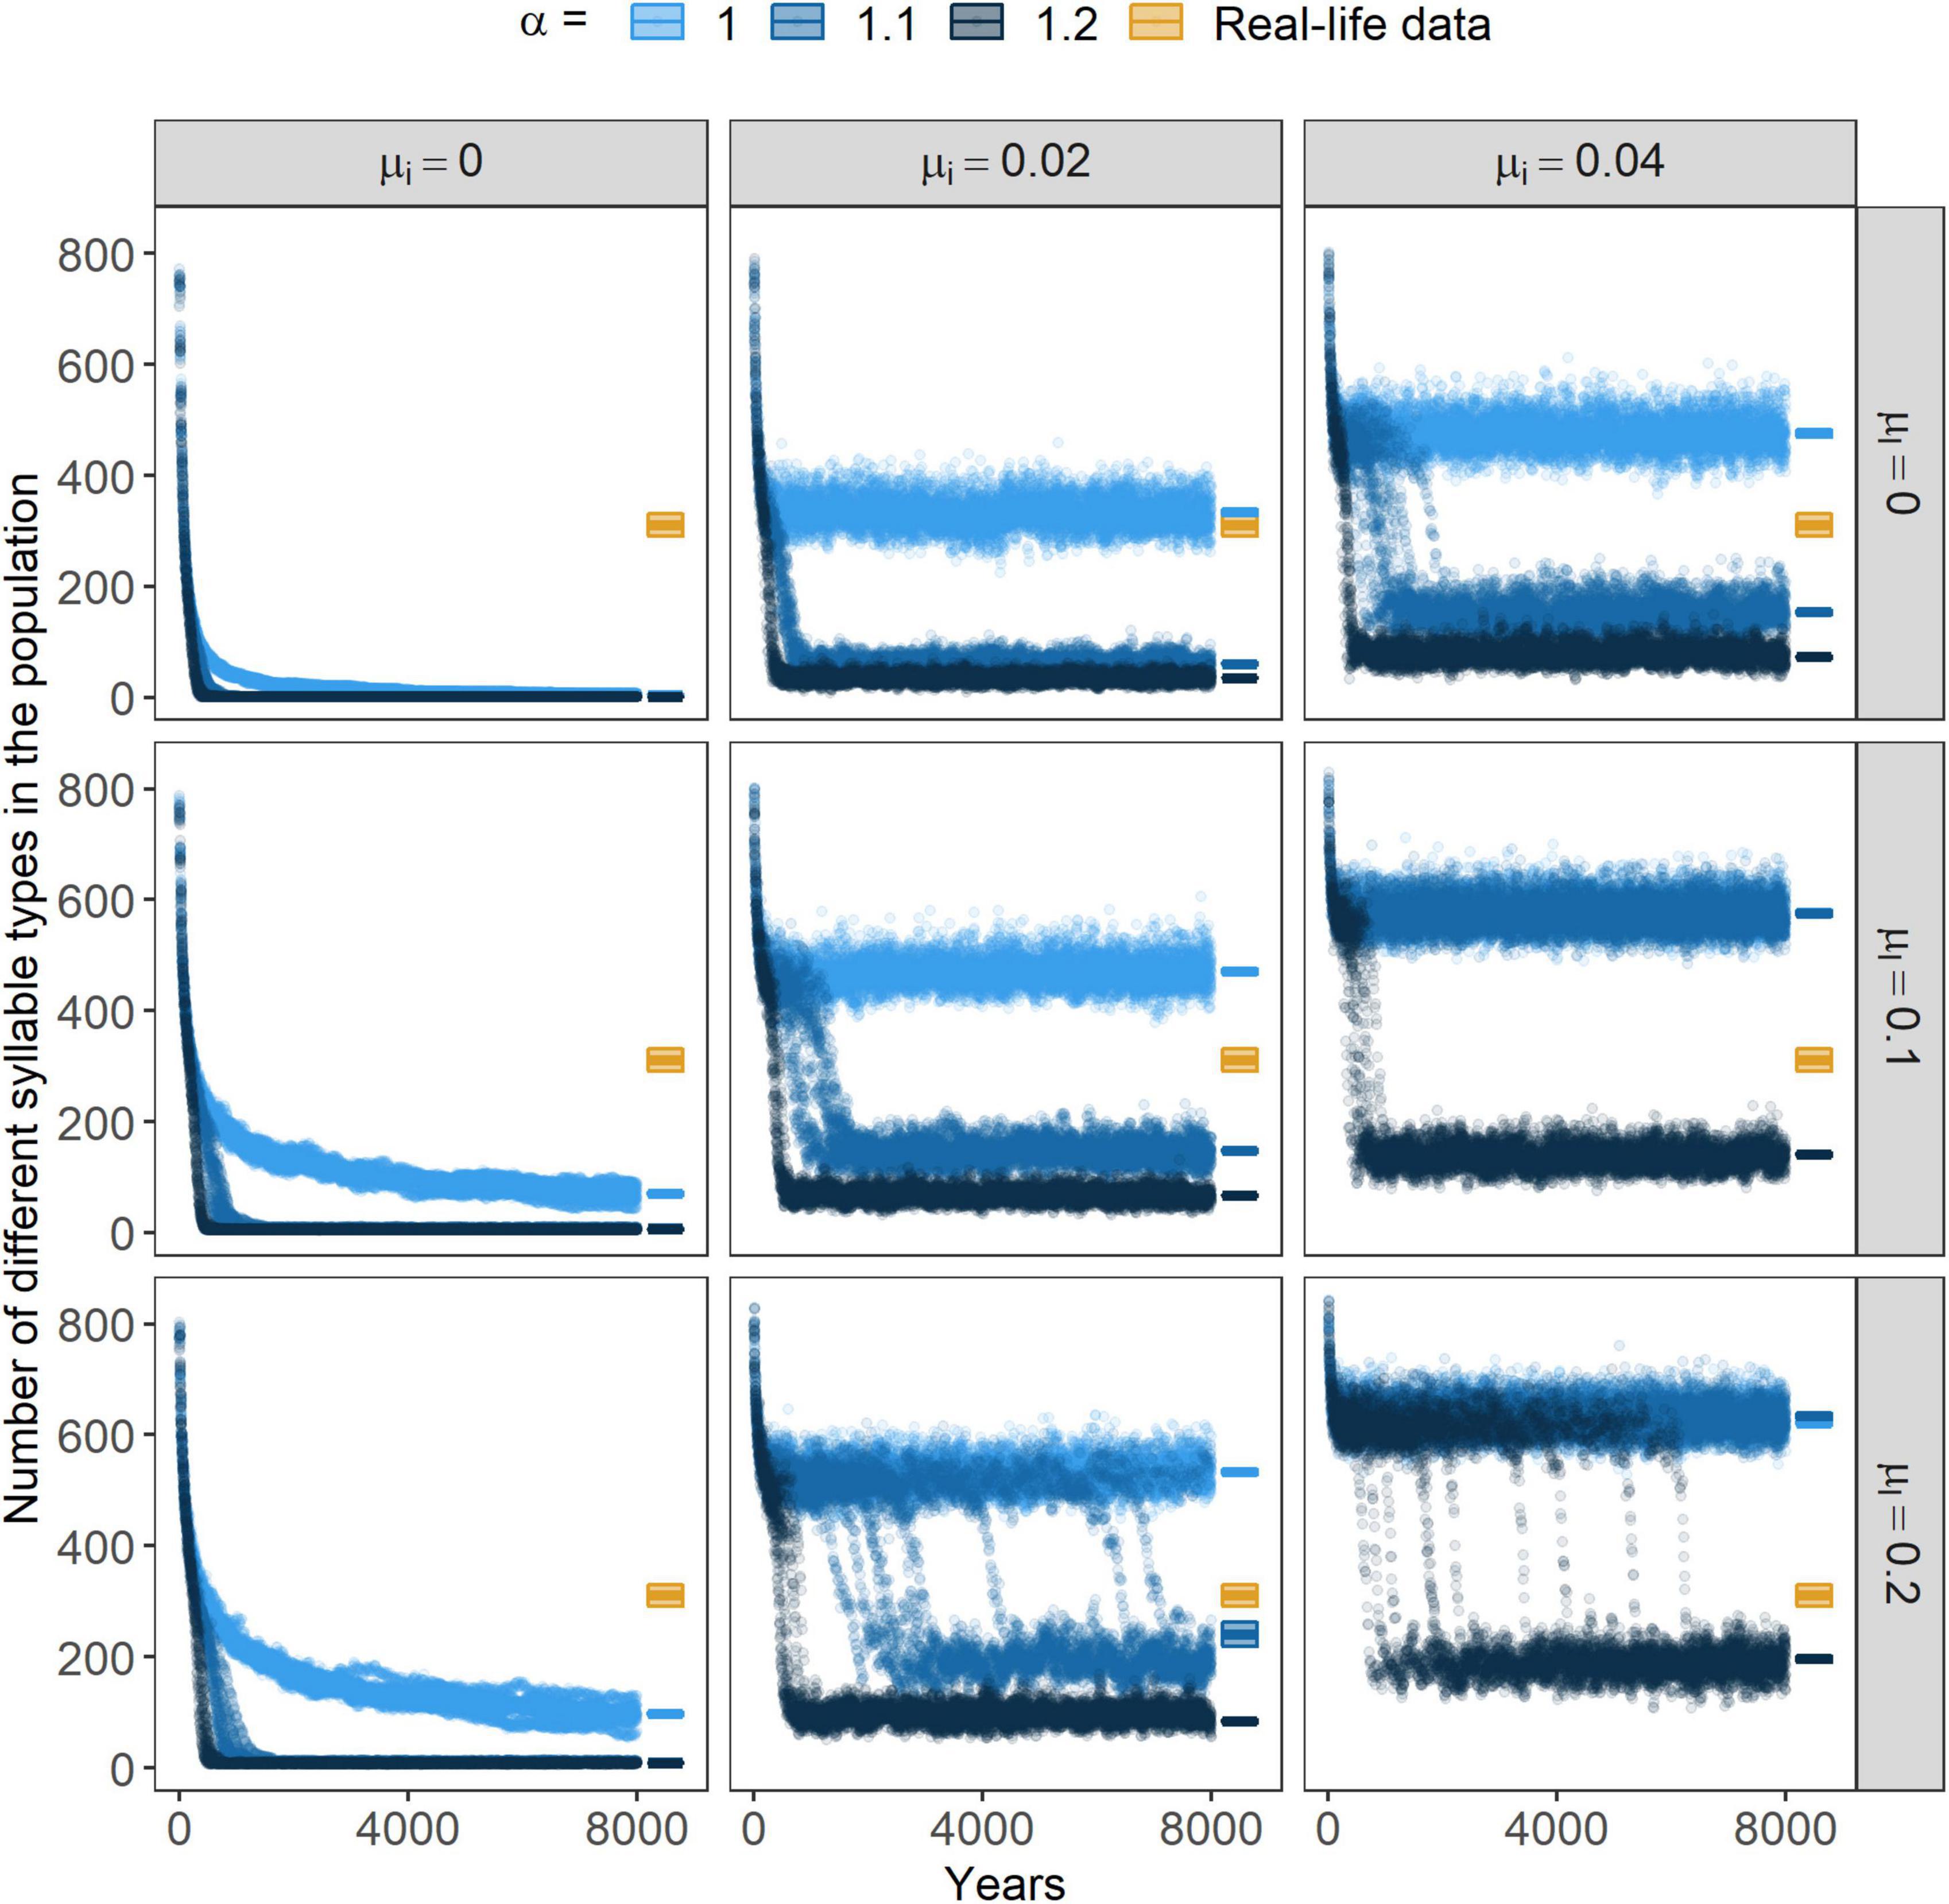
Figure 5. Size of the population repertoire. Points represent the simulated populations’ repertoire size through the years. For each parameter-combination, results from the 10 independent simulations are shown for every 10 years. On the right side of the graphs, boxplots show the mean repertoire size and their 95% CI of the field data and from the final 10 years of the simulated data. α marks the strength of conformism, while μl and μi stand for the rates of learning mistakes and immigration, respectively.
Regarding the composition of the population repertoire, the patterns created by the three parameters were similar to those observed on the individual level (Figure 6).
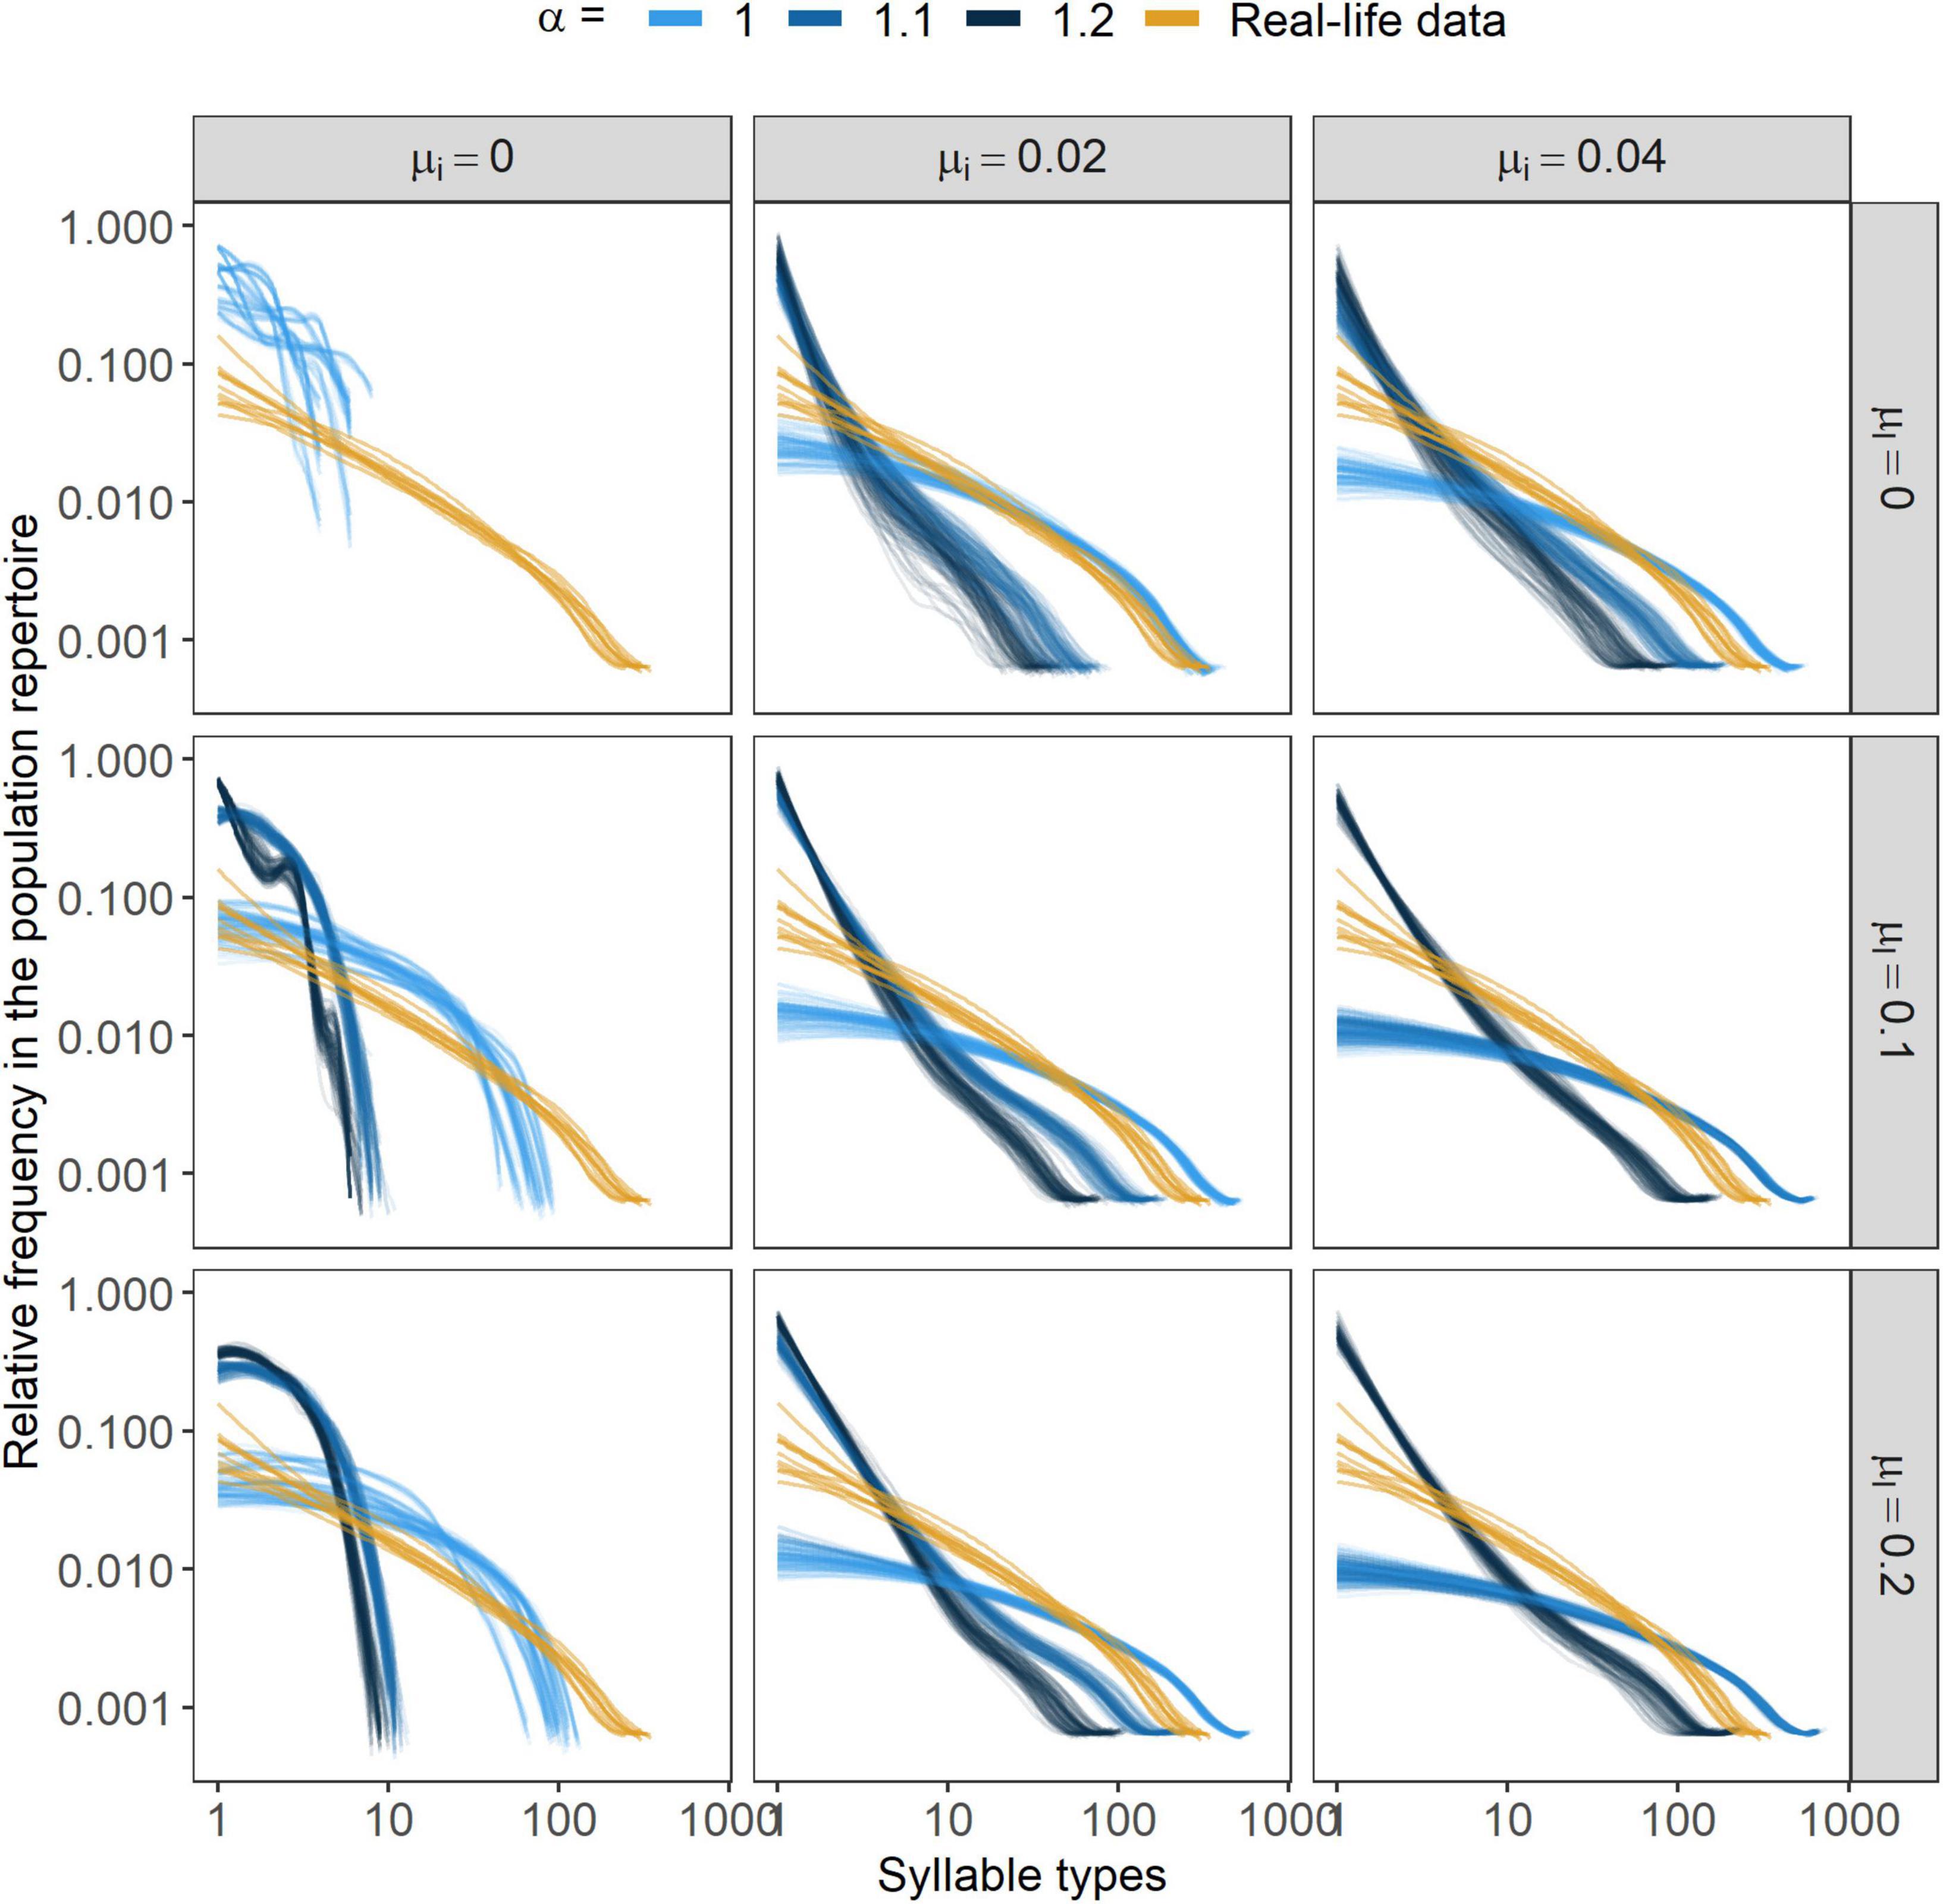
Figure 6. Syllable type frequency distributions in the population. Lines represent smoothed conditional means (fitted with the “loess” method, Cleveland et al., 2017) of the frequency distribution of the population repertoire in a given year. Simulation results are displayed from the 10 final years for each independent simulation. α marks the strength of conformism, while μl and μi stand for the rates of learning mistakes and immigration, respectively. In the case of the parameter-combinations {α, μl, μi} = {1.1, 0, 0} and {α, μl, μi} = {1.2, 0, 0}, curves for the repertoire distributions could not be fit as there was solely one syllable type in the population.
By increasing the strength of positive frequency-dependence, the P/A differences within the population repertoire increased (Figure 7) yet, with higher α values RF changes were smaller (Figure 8). In concordance with our predictions, by increasing the other two parameters, μi and μl, both the P/A and the RF changes in the population repertoire increased. The rate of learning mistakes had little or no effect on the two measures, its presence initiated only a small amount of change in the population’s repertoire and this change did not seem to grow larger by further increasing the rate of learning mistakes (Supplementary Figure 2). However, immigration seemed to have a great impact on both of these variables. At μi > 0, changes in the population’s repertoire seemed to emerge and the differences grew even greater with time. Still, by further increasing the rate of immigration seemed to have no effect on the differences within the population repertoire. Nevertheless, with μi being greater than zero cultural differences within the population repertoire were consistently growing. Without immigration, changes in the population repertoire were very low.
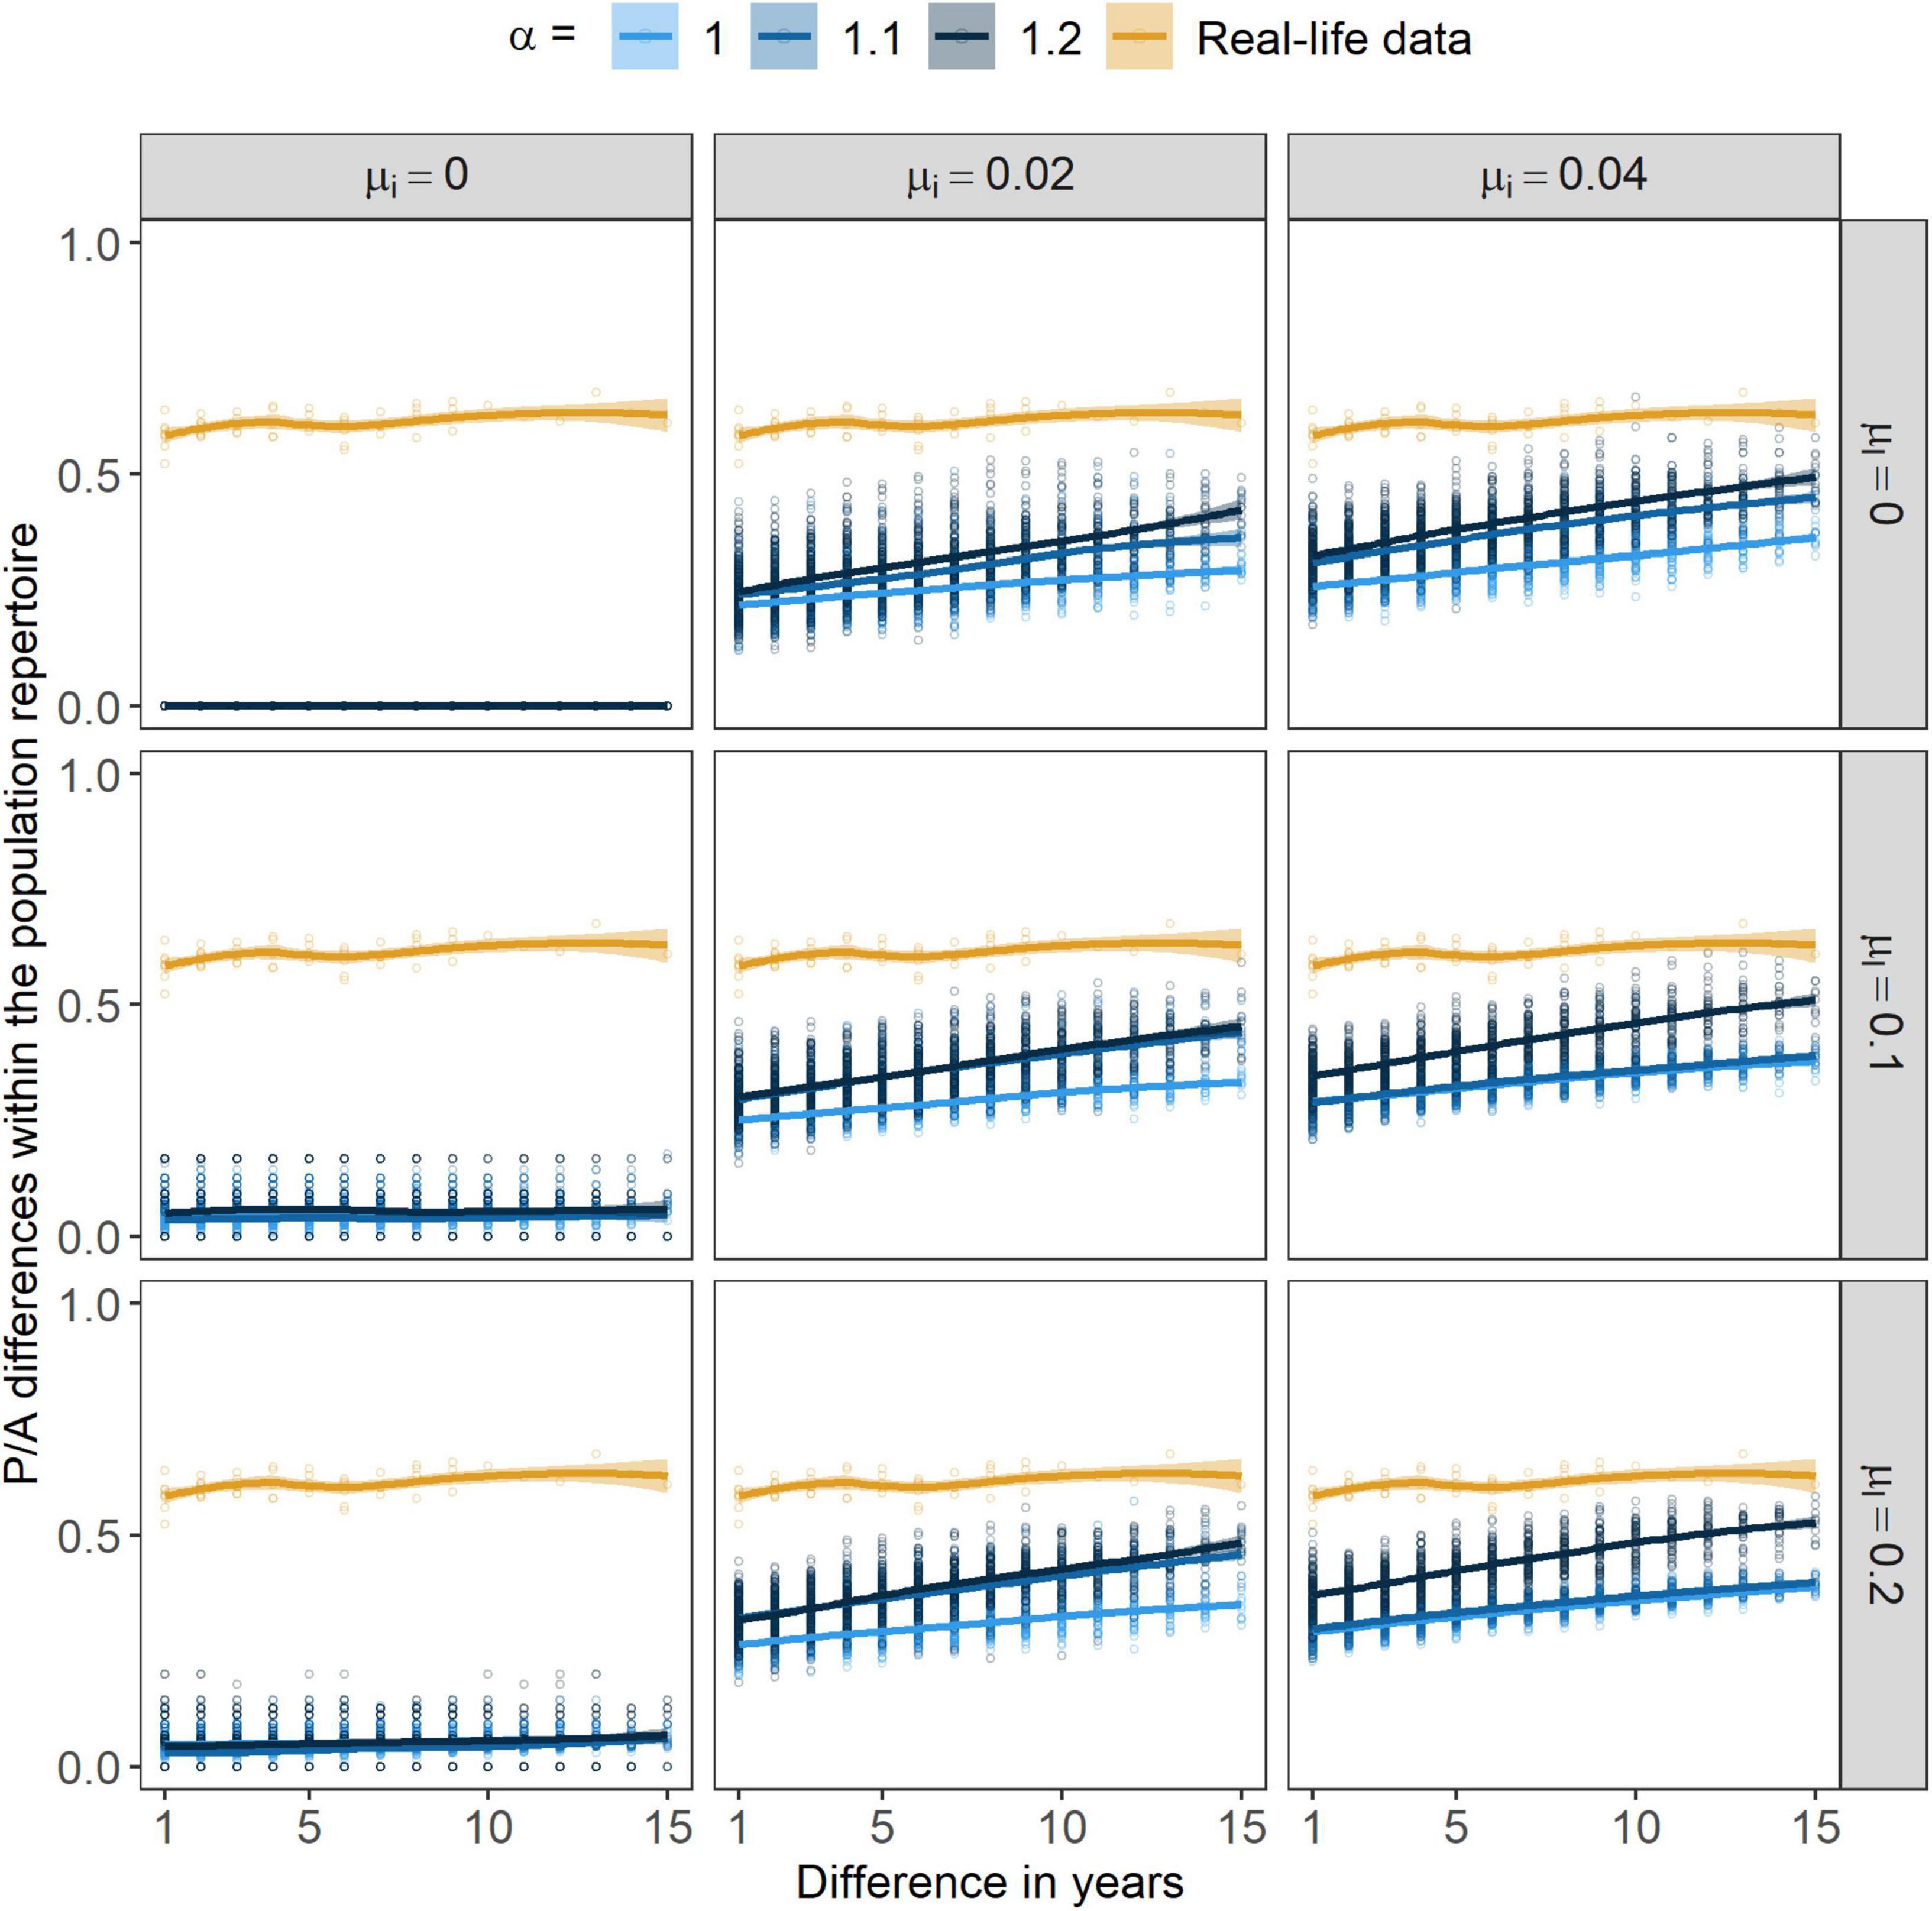
Figure 7. Presence/absence (P/A) differences within the population repertoire through years. Points are showing the actual values related to populations from the independent simulations/field. Lines stand for the smoothed conditional means of these values (with “loess” method, Cleveland et al., 2017) with a 95% CI indicated by the ribbon bar around them. α marks the strength of conformism, while μl and μi stand for the rates of learning mistakes and immigration, respectively.
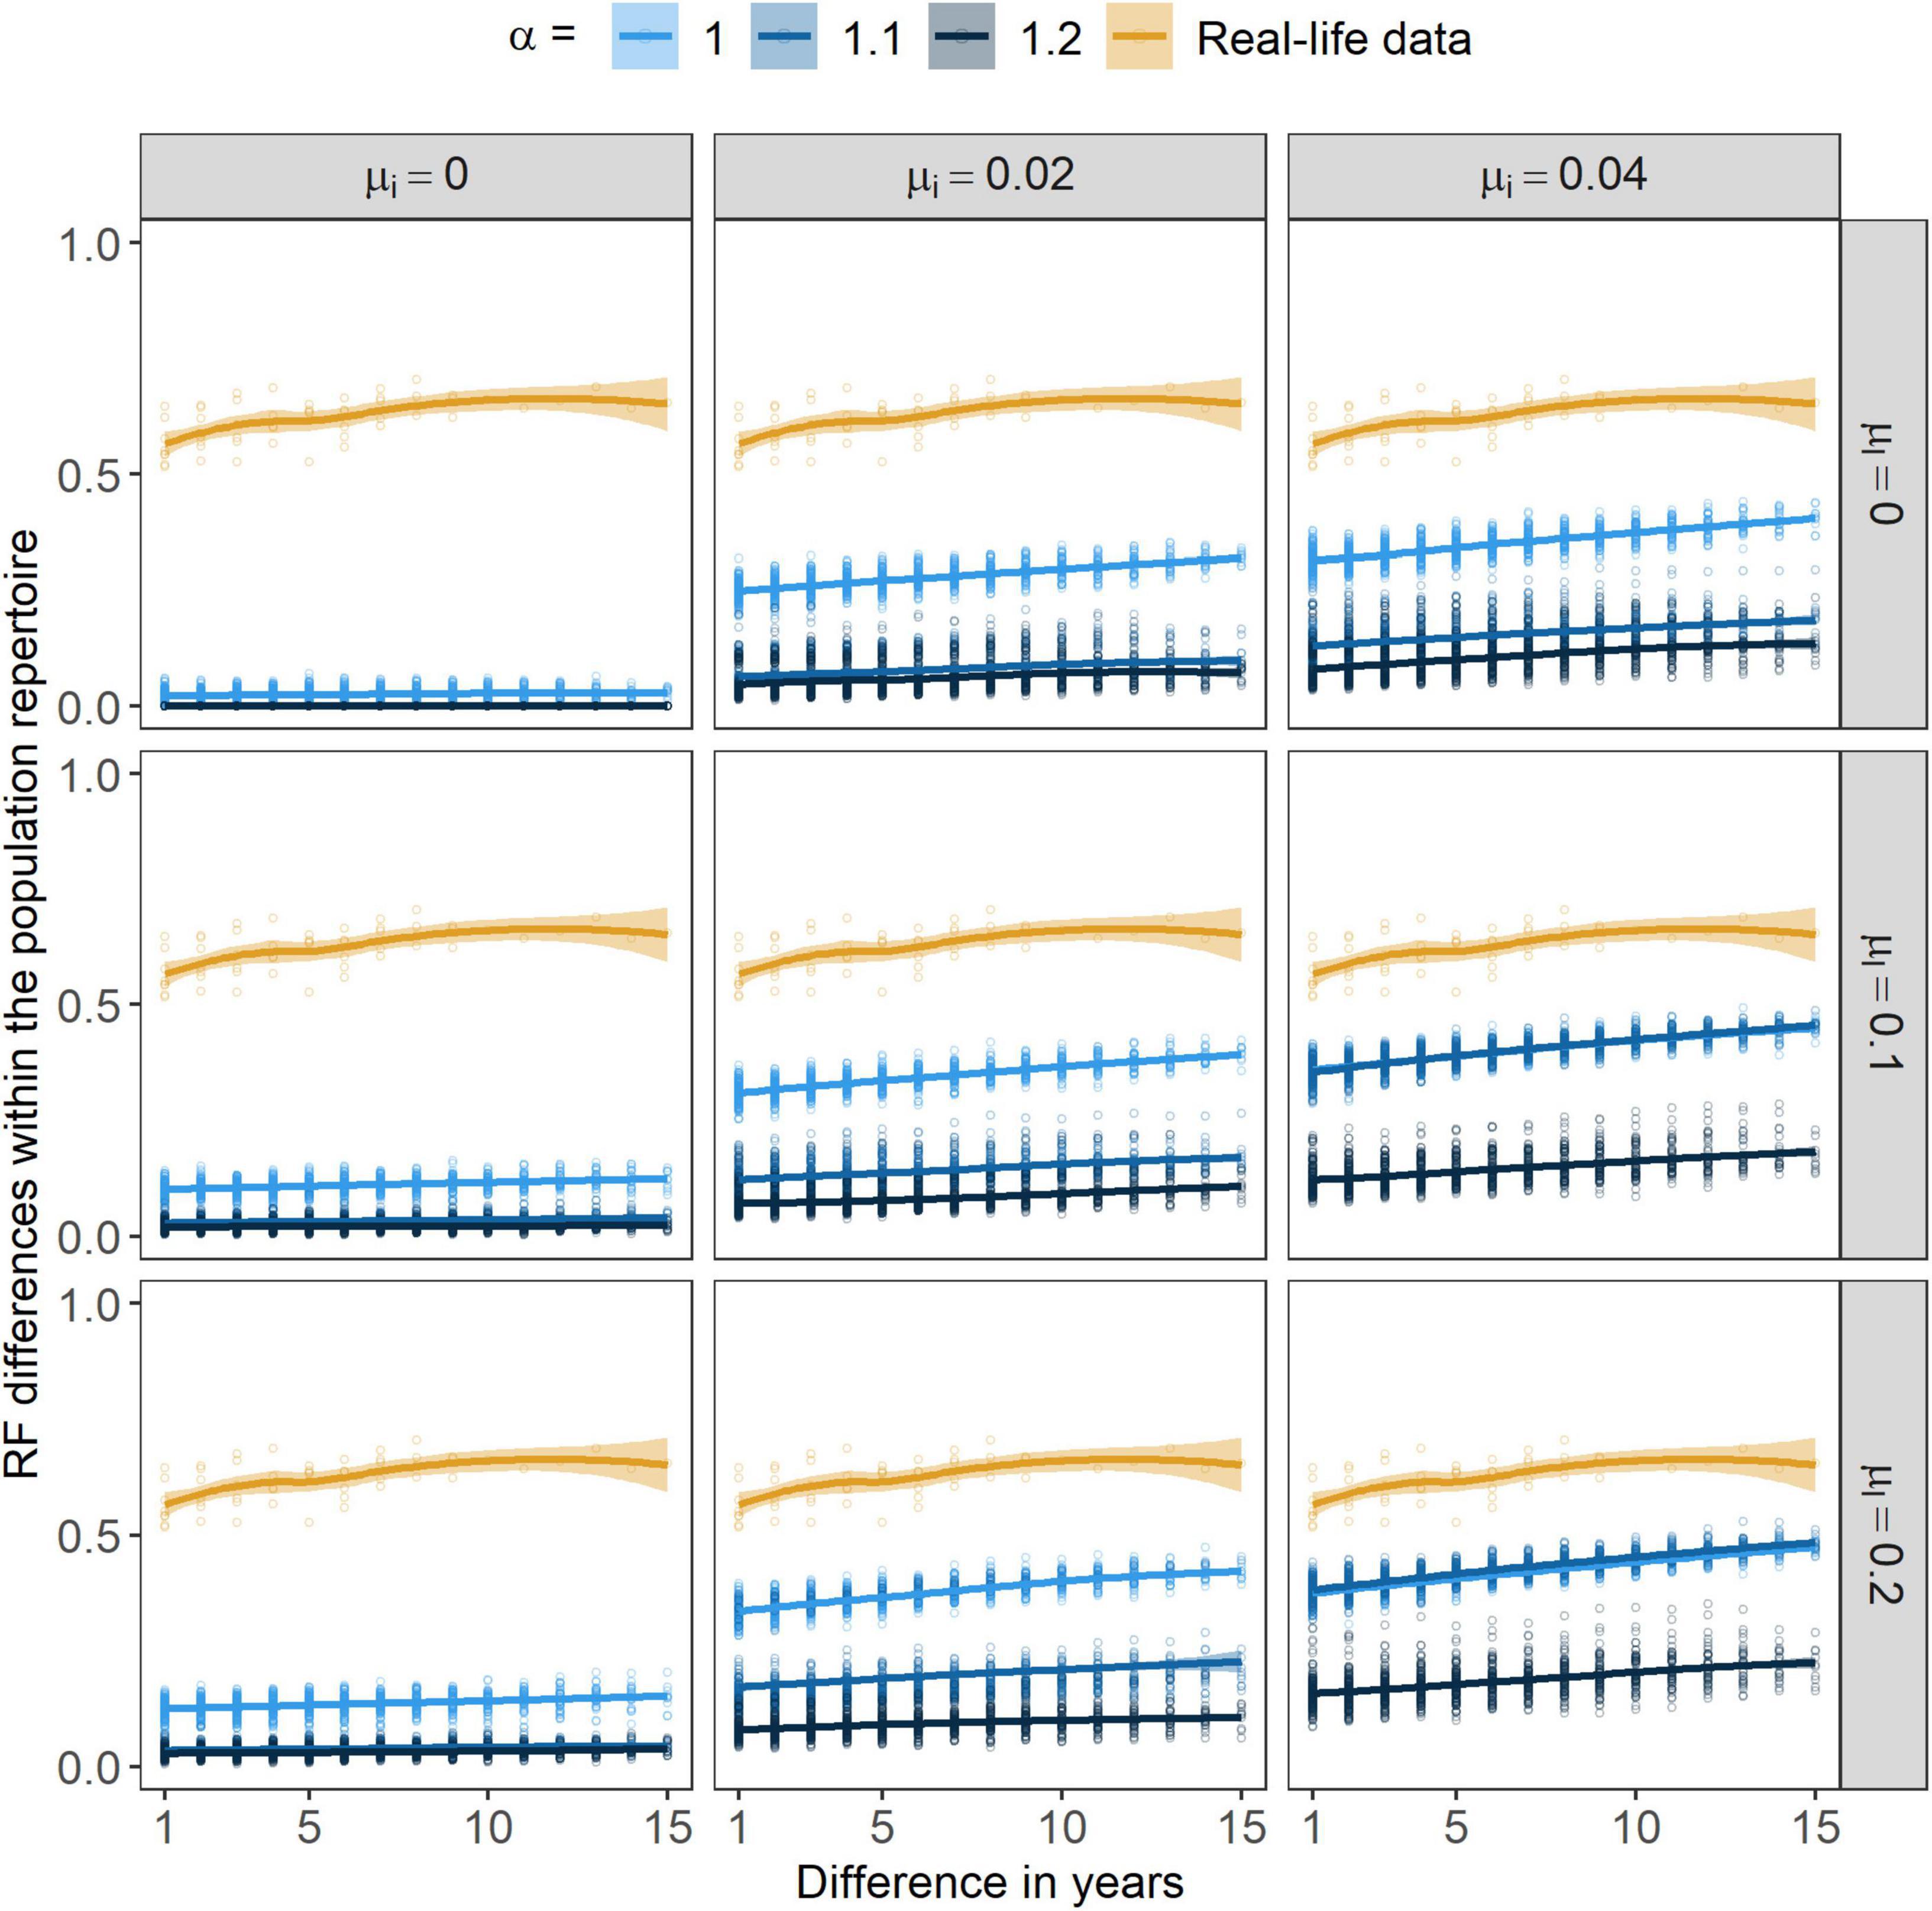
Figure 8. Relative frequency (RF) differences within the population repertoire through years. Points are showing the actual values related to populations from the independent simulations/field. Lines stand for the smoothed conditional means of these values (with “loess” method, Cleveland et al., 2017) with a 95% CI indicated by the ribbon bar around them. α marks the strength of conformism, while μl and μi stand for the rates of learning mistakes and immigration, respectively.
Our results indicated that learning mistakes and immigration are affecting complex cultural systems differently from one another. When we separated their effect but made sure that they would cause the same number of incoming syllables into the population we could see that their effect was indeed distinguishable (Supplementary Figure 3.). Immigration caused higher diversity both on the individual and population levels and more evenly distributed repertoire compositions. Variance between individuals was higher both when measured with P/A standardization or in the composition of repertoires. Also, both the P/A and the RF changes in the population repertoire were higher when immigration was the diversity-creating mechanism.
3.2. Sensitivity to the fixed parameters
Results from the simulations where we tested the effects of the otherwise fixed parameters provided various outcomes. The number of available syllable types in the simulations, Ns only had an effect on the population repertoire size (Supplementary Figure 4E). However, looking at the long-term temporal patterns it was visible that under all three values of Ns the system was in a metastable state and the difference in the population repertoire sizes was caused by the difference in the timing of the transient states. Within the two stationary states, the repertoire sizes of the population showed no difference regarding the Ns. The moderate difference in the RF differences within the population repertoire through time could also be due to the difference in the population repertoire sizes (Supplementary Figure 4). Compared to this, the Np, the Nl and the pd altered the individual repertoires, the P/A and RF differences between those, the cultural diversity of the population, the presence of metastable states in the population repertoire size and the cultural stability. Higher population sizes led to higher cultural diversity at both the individual and the population levels. Having more individuals in a population also contributed to avoiding metastable states and to having smaller RF differences but higher instability in the presence or absence of syllable types through time in the population repertoire (Supplementary Figure 5). To test whether the seemingly stable state of the population repertoire size is actually stable when the size of the population is high, we initialized the system from a low diversity state where individuals had a starting production vector made out of 10 different syllable types only (compared to the original 30). Results showed that when the initial population’s repertoire size is low, metastable states are avoided and after an increase in diversity the population repertoire falls into a low diversity stable state. Based on the observed initial increase in the population repertoire size we further increased the number of individuals in the population. If population size was high enough the low diversity stable states could be escaped (Supplementary Figure 6). Higher number of learning occasions led to lower cultural diversity at both the individual and the population levels. By providing more opportunity for individuals to learn, repertoire sizes decreased, and their compositional distributions became more skewed and both the P/A and RF differences between the individual repertoires decreased. The P/A differences within the population repertoire became greater indicating less stability in the types of the different syllables but the RF differences decreased (Supplementary Figure 7). As expected, increasing the pd created larger and more evenly distributed repertoires in both the individual and population levels and both the P/A and RF between-individual differences were greater. Interestingly it did not affect the P/A differences within the population repertoire, but it did increase the RF differences (Supplementary Figure 8). In any case, it is important to note that changes in these parameters modify the characteristics of the system only quantitatively not qualitatively. So, our general conclusions are not sensitive to these exact values, and we carried out the quantitative comparison of empirical and simulated data with them being fixed in the model.
3.3. Comparison of simulation results with field data
When comparing our simulation results with the field data only visually, we found that several different parameter-combinations resulted in a close fit between the two. However, results were inconsistent regarding the fit in the case of the different types of our measured variables. The same parameter-combination that resulted in a close fit on the individual level characteristics did not yield a close fit on the population level and vice versa. For example, while the parameter combinations {α, μl, μi} = {1, 0.1, 0.0} yielded results closely matching the field data in the case of the size and composition of the individual level repertoire (Figures 1, 2), the population level repertoire characteristics (Figures 5, 6) were met with the parameter combination {α, μl, μi} = {1, 0, 0.01}. Compared to this, the P/A and RF differences between individuals were closest when sufficiently high values of μl and μi were paired with low values of α (Figures 3, 4). and while the P/A differences in the population repertoire could only approximate the field data when positive frequency-dependence was low (Figure 7), RF differences didn’t even get close to the real-life situation (Figure 8).
To make our visual inquiry more accurate we explored the posterior distributions of the parameter values that would best describe a stable polymorphic culture represented by the empirical data. Posterior distributions of the parameters α and μl were relatively broad in a sense that they covered a large part of the prior distributions. The mean estimated value by the ABC for α was 1.52 (CI: 1.024–1.967) for μl it was 0.185 (CI: 0.003–0.467) while for μi it was 0.284 (CI: 0.009–0.396). When looking at the cultural measures resulting from simulations run with the mean posterior value for each parameter, we could see that the simulated data notably deviated from the field data (Figure 9).
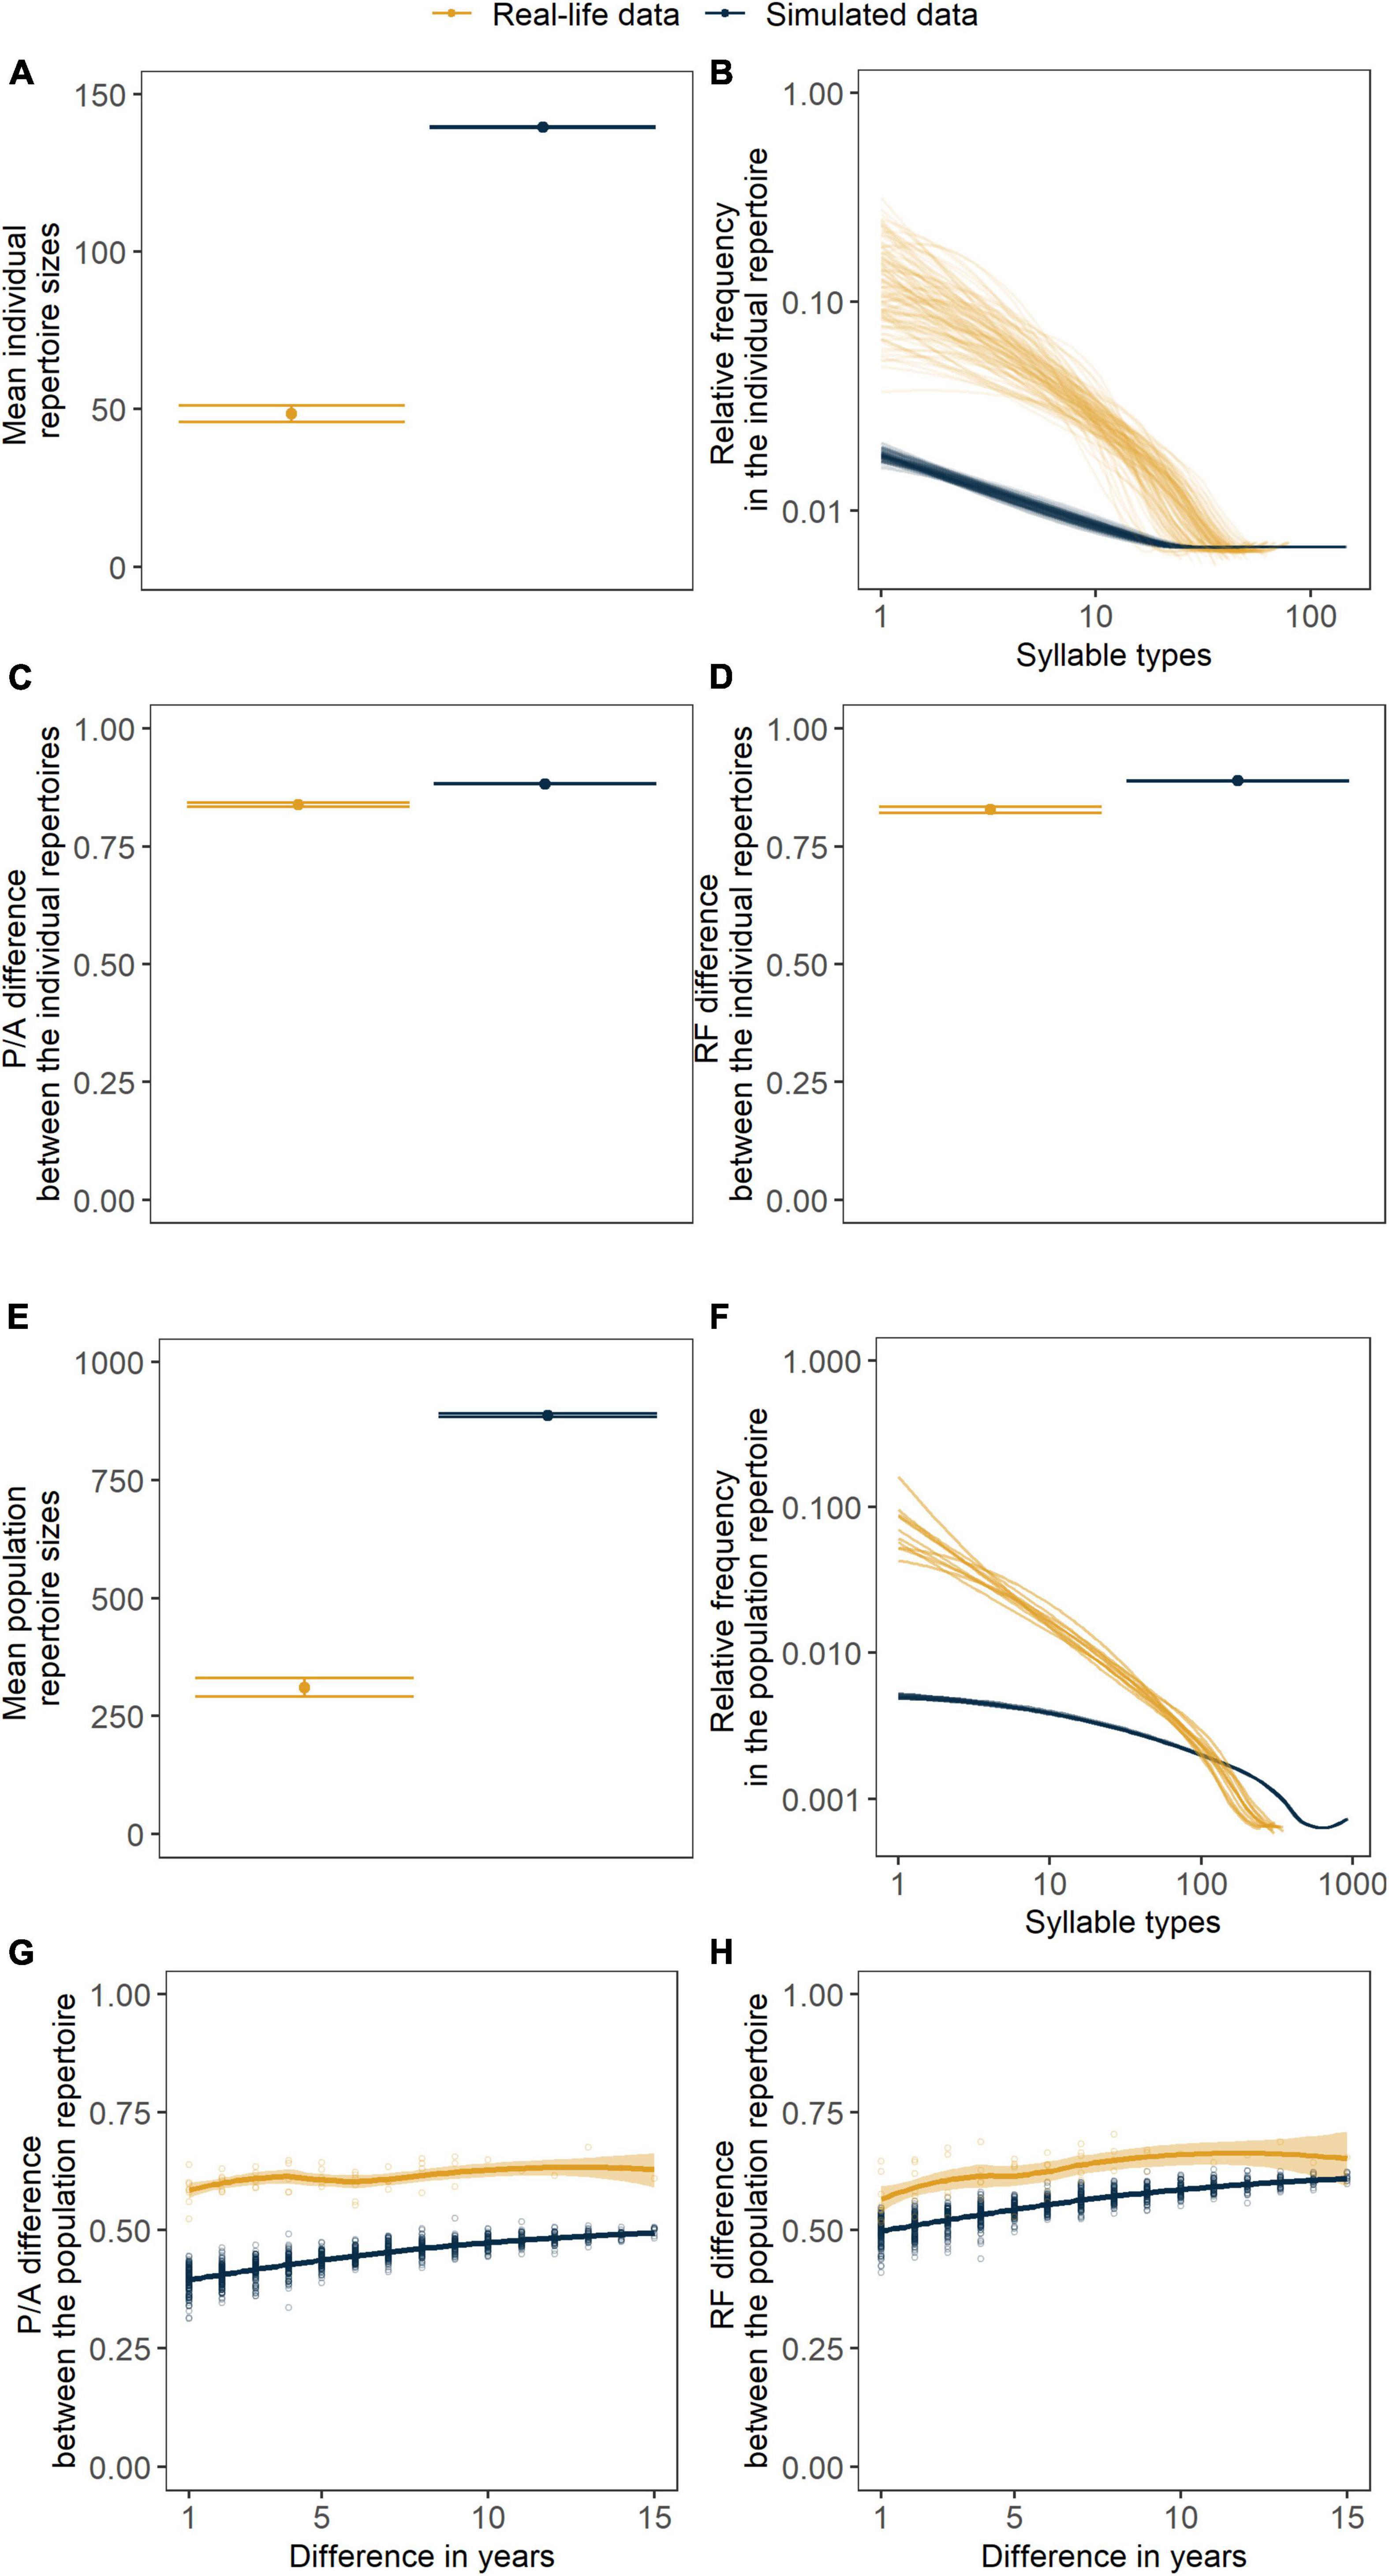
Figure 9. Results from 10 independent simulations (dark blue) run with the mean posterior distribution of each parameter {α, μl, μi} = {1.52383, 0.18578, 0.284037}and the field data (yellow) represented by the measures of cultural diversity and stability: (A) individual repertoire size, (B) individual repertoire composition, (C) presence/absence (P/A) difference between individual repertoires within years, (D) relative frequency (RF) difference between individual repertoires within years, (E) population repertoire size, (F) population repertoire composition, (G) presence/absence (P/A) difference within the repertoire of the population as a function of time passed, (H) relative frequency (RF) difference within the repertoire of the population as a function of time passed. Points are showing the mean of 10 independent simulations (A,C,D), the independent values for each simulation (E) or the results of each of the pairwise comparisons between years within a simulation (G,H). Error bars represent the 95% CI in all cases. Lines represent smoothed conditional means (fitted with the “loess” method, Cleveland et al., 2017) of the frequency distributions of repertoires (B,F) or of the between-year pairwise dissimilarities through time (G,H). Thin lines are responsible for connecting the values related to the same population (e.g., one independent simulation) while thicker lines stand for the smoothed conditional means of these independent populations (with “loess” method, Cleveland et al., 2017) with a 95% CI indicated by the ribbon bar around them (F).
4. Discussion
With the current study we had two major aims. We wanted to see (1) how positive frequency-dependent learning together with learning mistakes and immigration affect a complex cultural system and (2) whether these three mechanisms can form a culture similar to a song culture of an actual collared flycatcher population. Our results showed that the investigated mechanisms had the expected effects on the cultural diversity of both the individual and the population level. While learning mistakes and immigration increased diversity on both the individual and the population levels, a stronger positive frequency-dependence led to the impoverishment of the two. Depending on the rate of immigration, temporal changes in the population repertoire were very low or ever-growing on the inspected timescale. According to our results certain combinations of these rather simple mechanisms were capable of generating crucial aspects of a complex, polymorphic cultural system yet they seemed to be limited in their ability to reproduce all the characteristics of collared flycatchers’ song culture.
One of our aims was to investigate the combined effects of the three investigated mechanisms on cultural diversity and stability focusing on the connections between the individual and population levels of cultural systems. The individual effects of the three investigated mechanisms were the ones expected. Learning mistakes and immigration, suspected to increase diversity, were not always able to compensate for the effect of positive frequency-dependence in the studied range. According to our results, a stronger positive frequency-dependence contributed to preserving the common syllable type(s) in the population which led to highly stable, non-complex cultures predicted and discussed by previous studies (Henrich and Boyd, 1998; Tchernichovski et al., 2017). However, even when individuals had a low number of syllable types in their repertoires due to strong positive frequency-dependent learning, they could show high variability between themselves in the syllable types they possessed. With increasing rate of learning mistakes and immigration diversity on the individual level increased and so did the differences between them. However, the latter seemed to converge to a value substantially lower than 1 which could be addressed to positive-frequency dependence keeping a minimum number of similar syllable types with similar frequencies in the individuals’ repertoire. When immigration was present in the model, both P/A and RF changes in the population repertoire were growing, yet P/A changes were higher with increasing strength of positive frequency-dependence indicating higher cultural instability in the persistence of different syllable types. This could happen due to a stronger positive frequency-dependent bias stabilizing fewer syllable types in the population and allowing more opportunity for the drift of rare ones. By raising the rate of learning mistakes and immigration, other cultural element types appeared yet remained rare, and P/A differences in the population repertoire through the years showed that they were constantly shifting. When learning mistakes and immigration did counterbalance positive frequency-dependent learning, they drove the repertoire of the population to a highly diverse state where the relative frequency of the elements approached a steady, less skewed distribution. Interestingly, when diversity was higher syllable types showed to be steadier in the population and it was their frequency that changed more throughout the investigated years. Indeed, high rates of learning mistakes have been proposed to prevent song elements from stabilization in the song of zebra finches (Taeniopygia guttata) (Lachlan et al., 2016). Constant shift in the behavioral elements of a population is one symptom of an unstable culture described previously by Tchernichovski et al. (2017) and observed in the continuously changing songs of humpback whales (Garland et al., 2011) that also show signs of stochasticity and could serve as a culturally less diverse analog for our simulated cultural system.
Inspecting the measures of cultural diversity and stability, we observed a strong relationship between the individual and population levels of the cultural system irrespective of parameter settings. Correlations between the summary statistics used to describe the measures of cultural diversity and stability were confirmed by the PCA as well (Supplementary Figure 1). With higher number of syllable types in the individual and population repertoires we found more evenly distributed repertoire compositions indicated by higher values for the breakpoint and for the slope of the segmented model fitted on the repertoire compositions. The mean P/A and RF differences between individuals were also strongly positively correlated with each other and with the individual repertoire size. Changes in the syllable types in the population repertoire and the rate at which RF changes in the population repertoire were accumulating (slope of the fitted lines) were higher when the population repertoire distribution was more skewed. Compared to this the rate at which P/A changes were accumulating in the population repertoire was negatively correlated to all of the previously mentioned summary statistics meaning that with increasing diversity on the individual and population levels the accumulation of P/A changes in the population repertoire was slower. Our results lead to testable predictions, namely that factors affecting the population repertoire should also influence individual repertoires. Small, isolated populations, for example, might be predicted to have lower population level cultural diversity but also lower diversity on the within and between individual levels which could be tested on relevant empirical data.
In the simulations, the size of the population repertoire showed to be in a metastable state in certain combinations of the parameters. Transitions from the culturally more diverse state to the less diverse state occurred stochastically but only after hundreds or even thousands of years and only when highly diverse metastable states were present as a result of immigration (see Figure 6). The resulting patterns can be seen as a sign of the system’s dynamical complexity and are similar to those found in population-genetic model systems where positive frequency-dependent sexual selection impedes polymorphism even when selection for diversity and migration are high (Cotto and Servedio, 2017). If a complex system is in a metastable state and thus, it is able to dwindle on its own, then this could mean a potential sensitivity to external disturbances as well. Such external disturbances for animal cultures can be unpredictable and extreme climatic variations due to climate change, habitat loss or urban noise. The latter two have been connected to loss of cultural diversity through population decline not only in birds (Laiolo and Tella, 2007; Paxton et al., 2019) but in cetaceans (Whitehead et al., 2004) and humans as well (Krauss, 1992). If a communication system that is dependent on cultural diversity collapses, this may lead to inefficient mating; thus, impairs the survival of the species (Laiolo et al., 2008; Crates et al., 2021). This loss of cultural diversity can lead to the loss of species diversity. As biodiversity loss is one of the major ecological challenges of today’s world (Brondízio et al., 2019), it would not only be interesting but also urgent to further investigate the potential sensitivity of complex cultural systems to anthropogenic perturbations.
Results of our sensitivity analysis corroborate the effect of population size on the stability of a system. The presence or absence of metastable states was affected by the size of the population, greater population size led to a more diverse culture with repertoire compositions distributed more evenly on both the individual and population levels and with seemingly more resilience to stochasticity. Cotto and Servedio (2017) have shown that when a system is initialized from a less diverse state the initially most common element becomes fixed in the population. However, with sufficiently large populations we were able to escape the low diversity stable state (Supplementary Figure 6). The presence of metastable states was also affected by the number of learning occasions. Not surprisingly, when individuals were provided with more opportunity to learn, cultural diversity was lower as the transitions to the less diverse stationary state became more probable. More opportunities to learn enforces the effect of positive frequency-dependence, which is against diversity. Positive frequency-dependence outnumbers the effect of immigration, stabilizing and advancing the common syllable types and causing the effect of learning mistakes and immigration to create a constant shift in the rare elements. That is why with more opportunities to learn P/A changes in the population repertoire could be higher while RF changes were lower.
A system as that of the song culture of collared flycatchers could not be reproduced in all its characteristics with the mechanisms implemented in our model. Using ABC to estimate the strength of positive frequency-dependence, the rate of learning mistakes and of immigration resulted in relatively broad posterior distributions for the parameters with mean values not accurately returning the desired individual and population level cultural characteristics. Also, irrespective of the correlation between the individual and population level characteristics, they gave close matches with the field data at different parameter-combinations. Our results indicate that the patterns observed in the field data cannot be met solely by our three investigated mechanisms and that it is probable that other constraining ones also influence the collared flycatcher’s song. As a first alternative learning mechanism comes conformism in the form of copying the majority of individuals. In our model we implemented a learning strategy that is closest to copy-the-majority of instances implied by Morgan et al. (2019). They have shown that the two strategies, copy-the-majority of instances or individuals, can lead to different outcomes in terms of what the most common behavior type in the population will be. However, we would not expect different results from the strategy of copying the majority of individuals as here we were not interested in the type of behaviors present in individual or population level repertoires only in their number and relative frequency. Yet, neither Morgan et al. (2019) nor other studies combined copy-the-majority of instances as a learning strategy with complex cultures. It hasn’t been investigated yet, but we would expect that there would be no difference in the resulting cultural patterns if copy-the-majority of individuals would be used as the learning strategy only the dynamics of reaching those final states would differ.
Compared to this, other learning biases represent better options for balancing diversity and stability. Regarding our empirical data, Vaskuti et al. (2016) suggest that changes in the frequency of different syllable types could be a result of females shifting their preference of what syllable types or syllable sequences they find sexy. As a result of the females’ preference, learning individuals would also assess their choice of learned elements. A strong bias in social learning based on the syllables’ intrinsic attractiveness has been shown in the house finch (Haemorhous mexicanus) (Youngblood and Lahti, 2022) but has been ruled out in the case of swamp sparrows (Lachlan et al., 2018) implying that songbirds can show very different social learning strategies. Other stabilizing factors could be balanced imitation (Tchernichovski et al., 2021) or syllable matching between neighboring individuals (Krebs et al., 1981). During balanced imitation individuals continuously assess their choice of syllables to copy between common and rare song elements thus maintaining diversity and stability at the same time. This way both monolithic and strongly drifting cultures are avoided on the population level (Tchernichovski et al., 2021). Syllable matching between neighbors has the same potential. Intuitively, it increases within-individual diversity and decreases variance between individuals. While it is present in many other territorial songbird species having not only small (Krebs et al., 1981), but large repertoires as well (Yuan and Price, 2011), syllable matching hasn’t been documented in collared flycatchers. However, the studied collared flycatcher population shows relatively high values of between-individual differences and in their case it is more probable that neighboring individuals are trying to avoid matching each other’s song (Garamszegi et al., 2012). It would be interesting to test the effects of these learning mechanisms on complex systems by also including territoriality in those models. Another possible explanation for our simulation results not corresponding to the field data could be that collared flycatchers do not learn syllables independently of each other. This explanation is confirmed by the fact that in their songs collared flycatchers organize the syllables in a non-random way (Zsebők et al., 2021) with occasional repetitions of longer syllable sequences. If there are intrinsic rules that are in charge for organizing syllable types within a sequence that would also generate a diversity-creating pressure. Learning syllable sequences, as a process, would not only be more time-efficient but it would also contribute to counterbalancing the strong stabilizing effect of positive frequency-dependence by ensuring the transmission of other syllable types than the most common ones. And lastly, results from our sensitivity analysis show that population size and the number of learning occasions also affect both the diversity and the stability of the system. Their inclusion as modifiable parameters into cultural evolutionary models could generate different outcomes in the measured cultural characteristics and in the resulting posterior parameter distributions.
In the current study we implemented a model with which we investigated the effect of learning mistakes and immigration separately. In our model immigration could be interpreted as the rate at which not individuals, but novel cultural elements migrated into the population. This latter solution represented not only species where exchange of behavioral elements between populations is limited to immigrating individuals carrying those elements but also those cultural systems where this information exchange between populations can occur when populations have the opportunity to interact and that does not require individuals to switch between populations. For example, the feeding season of humpback whales represents such an opportunity (Zandberg et al., 2021) and wintering sites could have the same potential for migratory species. Looking at the patterns resulting from the simulated data and how these fit to the field data, we could see that the effects of learning mistakes and immigration were distinguishable at the level of values investigated. On the population-level we received the closest fit between the two when not learning mistakes, but immigration was involved in the model. It was the presence of learning mistakes that drove the individual-level repertoire composition closer to the field data; however, without immigration the simulated population showed to be in a static system, where only very little change occurred in the syllable types and in their frequency. When we separated the effect of immigration and learning mistakes by setting either of them as the only source of novel syllables it was obvious that they were affecting complex cultural systems differently. Immigration caused higher diversity and more change in the population repertoire. However, this could be addressed mainly to our methods of implementing learning mistakes and immigration into the model. Nonetheless, based on immigration’s effect on the stability of complex cultures we propose that it should be investigated separately from other mechanisms of cultural mutation, especially when the model species manifests complex culture and/or high rates in the immigration of cultural elements.
In this study, we defined stability on the population level, measured as the difference (in the presence/absence or in the relative frequency of syllable types) in the population repertoire between years. However, the notion of stability, just like diversity, could be applied on the individual level as well, changes in behavioral element types or changes in their frequency could be measured not only between- but even within individuals. And even going further than that, one could ask whether stability has to necessarily include the persistence of certain behavioral element types in the inspected unit? It could also delineate the persistence of repertoire sizes and/or compositions. Cultural diversity has already been noted as an important term for conservation biology which has many dimensions to itself but as one that lacks clear definition (Brakes et al., 2019). We think the culture-studying community would greatly benefit from a clear definition of cultural stability as well.
To our knowledge, this study is the first one investigating cultural diversity together with stability in complex birdsong cultures and based on our results, we propose a combination of simple mechanisms that determine the diversity and stability in these. Our results confirm that several aspects of complex cultures are reproducible by certain combinations of the three investigated mechanisms—positive frequency-dependent social learning, learning mistakes and immigration. The observed metastability in the cultural diversity of the population raises the attention to the potential sensitivity of animal cultures to external effects and we suggest further research on the conservation of complex cultures. The same parameter-combinations did not lead to closely fitting results between the simulated and field data in the case of all our measured variables. Matching results on the individual level required different parameter-combinations than those on the population level or in the case of between-individual or temporal within-population cultural changes. These discrepancies not only tell us that there are probably other mechanisms contributing to the development and maintenance of natural stable polymorph cultures, but that the dimensions of cultural structure (within- and between-individual, and population level characteristics) are worth being investigated side-by-side.
Data availability statement
The original contributions presented in this study are included in the article/Supplementary material, further inquiries can be directed to the corresponding author.
Author contributions
KB was in charge of implementing the algorithm for the simulations, filtering the data obtained in the field, visualizing and analyzing the results, and writing the manuscript. SZ and IS provided constant supervision and advice. LG provided consultation throughout the whole research project and revised the manuscript. All authors collaborated on the basic concept and research questions. All authors contributed to the article and approved the submitted version.
Funding
This work was supported by the Hungarian National Research, Development and Innovation Office (NKFIH, PD-115730, K-139992). Funding for open access publication was received from the Centre for Ecological Research, Hungary (AB4804/21). KB was supported by the ÚNKP-21-3 New National Excellence Program of the Ministry for Innovation and Technology, Hungary from the source of the National Research, Development and Innovation Fund. IS was supported by the Hungarian National Research, Development and Innovation Office (K-128289).
Acknowledgments
We would like to thank the Evolutionary Ecology Research Group of the Centre for Ecological Research, Hungary and the Behavioral Ecology Group of the Eötvös Loránd University, Hungary for collecting and providing the field data for this research. Special thanks go to Mónika Jablonszky, Kata Krenhardt, and Gergely Nagy for their help and encouragement on and off the field sites. KB would also like to appreciate the advice and encouragement provided by Csenge Veronika Horváth throughout the whole creative process. We are also grateful to the Pilis Park Forestry for providing the environment for field observations. On behalf of the “Flycatcher song analysis” project we are grateful for the possibility to use ELKH Cloud (see Héder et al., 2022; https://science-cloud.hu/) which helped us achieve the results published in this manuscript.
Conflict of interest
The authors declare that the research was conducted in the absence of any commercial or financial relationships that could be construed as a potential conflict of interest.
Publisher’s note
All claims expressed in this article are solely those of the authors and do not necessarily represent those of their affiliated organizations, or those of the publisher, the editors and the reviewers. Any product that may be evaluated in this article, or claim that may be made by its manufacturer, is not guaranteed or endorsed by the publisher.
Supplementary material
The Supplementary Material for this article can be found online at: https://www.frontiersin.org/articles/10.3389/fevo.2023.1040550/full#supplementary-material
Footnotes
References
Antunes, R., Schulz, T., Gero, S., Whitehead, H., Gordon, J., and Rendell, L. (2011). Individually distinctive acoustic features in sperm whale codas. Anim. Behav. 81, 723–730. doi: 10.1016/j.anbehav.2010.12.019
Aplin, L. M., Farine, D. R., Morand-Ferron, J., Cockburn, A., Thornton, A., and Sheldon, B. C. (2015). Experimentally induced innovations lead to persistent culture via conformity in wild birds. Nature 518, 538–541. doi: 10.1038/nature13998
Aplin, L. M., Sheldon, B. C., and McElreath, R. (2017). Conformity does not perpetuate suboptimal traditions in a wild population of songbirds. Proc. Natl. Acad. Sci. U S A. 114, 7830–7837. doi: 10.1073/pnas.1621067114
Baker, M. C., and Gammon, D. E. (2006). Persistence and change of vocal signals in natural populations of chickadees: annual sampling of the gargle call over eight seasons. Behaviour 143, 1473–1509. doi: 10.1163/156853906779366991
Bazin, E., Dawson, K. J., and Beaumont, M. A. (2010). Likelihood-free inference of population structure and local adaptation in a Bayesian hierarchical model. Genetics 185, 587–602. doi: 10.1534/genetics.109.112391
Beaumont, M. A. (2010). ‘Approximate Bayesian computation in evolution and ecology’. Ann. Rev. Ecol. Evol. Systematics 41, 379–406. doi: 10.1146/annurev-ecolsys-102209-144621
Bentley, R. A., Hahn, M. W., and Shennan, S. J. (2004). Random drift and culture change. Proc. R. Soc. Biol. Sci. 271, 1443–1450. doi: 10.1098/rspb.2004.2746
Bogatyrev, P. (2016). The Functions of Folk Costume in Moravian Slovakia, Approaches to Semiotics. Berlin: De Gruyter Mouton.
Boyd, R., and Richerson, P. J. (1985). Culture and the Evolutionary Process. Chicago, IL: The University of Chicago Press.
Brakes, P., Dall, S. R., Aplin, L. M., Bearhop, S., Carroll, E. L., Ciucci, P., et al. (2019). Animal cultures matter for conservation. Science 363, 1032–1034.
Bray, J. R., and Curtis, J. T. (1957). An ordination of the upland forest communities of southern Wisconsin. Ecol. Monographs 27, 326–349.
Brondízio, E. S., Settele, J., Díaz, S., and Ngo, H. T. (eds) (2019). IPBES (2019): Global Assessment Report on Biodiversity and Ecosystem Services of the Intergovernmental Science-Policy Platform on Biodiversity and Ecosystem Services. Bonn: IPBES secretariat.
Byers, B. E., and Kroodsma, D. E. (2009). Female mate choice and songbird song repertoires. Anim. Behav. 77, 13–22. doi: 10.1016/j.anbehav.2008.10.003
Catchpole, C. K., and Slater, P. J. B. (2008). Bird Song. Cambridge: Cambridge University Press. doi: 10.1017/CBO9780511754791
Cleveland, W. S., Grosse, E., and Shyu, W. M. (2017). “Local regression models,” in Statistical Models in S. ed. T. J. Hastie (New York, NY: Routledge). doi: 10.1201/9780203738535
Cohen, J. (1960). ‘A coefficient of agreement for nominal scales’. Educ. Psychol. Measurement 20, 37–46. doi: 10.1177/001316446002000104
Cotto, O., and Servedio, M. R. (2017). The roles of sexual and viability selection in the evolution of incomplete reproductive isolation: from allopatry to sympatry. Am. Nat. 190, 680–693. doi: 10.1086/693855
Crates, R., Langmore, N., Ranjard, L., Stojanovic, D., Rayner, L., Ingwersen, D., et al. (2021). Loss of vocal culture and fitness costs in a critically endangered songbird. Proc. R. Soc. Biol. Sci. 288:20210225. doi: 10.1098/rspb.2021.0225
Csilléry, K., François, O., and Blum, M. G. B. (2012). ‘abc: an R package for approximate Bayesian computation (ABC): R package: abc’. Methods Ecol. Evol. 3, 475–479. doi: 10.1111/j.2041-210X.2011.00179.x
Ellers, J., and Slabbekoorn, H. (2003). Song divergence and male dispersal among bird populations: a spatially explicit model testing the role of vocal learning. Anim. Behav. 65, 671–681. doi: 10.1006/anbe.2003.2081
Feßl, B., and Hoi, H. (2000). Song complexity and song structure in the Moustached Warbler Acrocephalus melanopogon. J. Avian Biol. 31, 144–150. doi: 10.1034/j.1600-048X.2000.310206.x
Filatova, O. A., Deecke, V. B., Ford, J. K. B., Matkin, C. O., Barrett-Lennard, L. G., Guzeev, M. A., et al. (2012). Call diversity in the North Pacific killer whale populations: implications for dialect evolution and population history. Anim. Behav. 83, 595–603. doi: 10.1016/j.anbehav.2011.12.013
Garamszegi, L. Z., Balsby, T. J. S., Bell, B. D., Borowiec, M., Byers, B. E., Draganoiu, T., et al. (2005). Estimating the complexity of bird song by using capture-recapture approaches from community ecology. Behav. Ecol. Sociobiol. 57, 305–317. doi: 10.1007/s00265-004-0866-6
Garamszegi, L. Z., Merino, S., Török, J., Eens, M., and Martínez, J. (2006). Indicators of physiological stress and the elaboration of sexual traits in the collared flycatcher. Behav. Ecol. 17, 399–404. doi: 10.1093/beheco/arj042
Garamszegi, L. Z., Török, J., Hegyi, G., Szöllõsi, E., Rosivall, B., and Eens, M. (2007). Age-Dependent expression of song in the collared flycatcher, Ficedula albicollis. Ethology 113, 246–256. doi: 10.1111/j.1439-0310.2007.01337.x
Garamszegi, L. Z., Zagalska-Neubauer, M., Canal, D., Blázi, G., Laczi, M., Nagy, G., et al. (2018). MHC-mediated sexual selection on birdsong: generic polymorphism, particular alleles and acoustic signals. Mol. Ecol. 27, 2620–2633. doi: 10.1111/mec.14703
Garamszegi, L. Z., Zsebők, S., and Török, J. (2012). The relationship between syllable repertoire similarity and pairing success in a passerine bird species with complex song. J. Theoretical Biol. 295, 68–76. doi: 10.1016/j.jtbi.2011.11.011
Garland, E. C., Goldizen, A. W., Rekdahl, M. L., Constantine, R., Garrigue, C., Hauser, N. D., et al. (2011). Dynamic horizontal cultural transmission of humpback whale song at the ocean basin scale. Curr. Biol. 21, 687–691. doi: 10.1016/j.cub.2011.03.019
Gil, D., and Slater, P. J. B. (2000). Multiple song repertoire characteristics in the willow warbler (Phylloscopus trochilus). Behav. Ecol. Sociobiol. 47, 319–326.
Goodfellow, D. J., and Slater, P. J. B. (1986). A model of bird song dialects. Anim. Behav. 34, 1579–1580. doi: 10.1016/S0003-3472(86)80233-0
Harris, M. A., and Lemon, R. E. (1972). Songs of song sparrows (Melospiza melodia): individual variation and dialects. Canadian J. Zool. 50, 301–309. doi: 10.1139/z72-041
Haury, E. W., Rands, R. L., Spaulding, A. C., Taylor, W. W., Thompson, R. H., Wauchope, R., et al. (1955). An archaeological approach to the study of cultural stability. Memoirs Soc. Am. Archaeol. 11, 32–57. doi: 10.1017/S0081130000001453
Héder, M., Rigó, E., Medgyesi, D., Lovas, R., Tenczer, S., Török, F., et al. (2022). The Past, Present and Future of the ELKH Cloud. Inform. Társadalom 22:128. doi: 10.22503/inftars.xxii.2022.2.8
Henrich, J., and Boyd, R. (1998). The evolution of conformist transmission and the emergence of between-group differences. Evol. Hum. Behav. 19, 215–241. doi: 10.1016/S1090-5138(98)00018-X
Hile, A. G., and Striedter, G. F. (2000). Call convergence within groups of female budgerigars (Melopsittacus undulatus). Ethology 106, 1105–1114. doi: 10.1046/j.1439-0310.2000.00637.x
Ince, S. A., Slater, P. J. B., and Weismann, C. (1980). Changes with time in the songs of a population of chaffinches. Condor 82:285. doi: 10.2307/1367393
Jäckel, D., Mortega, K. G., Brockmeyer, U., Lehmann, G. U. C., and Voigt-Heucke, S. L. (2022). Unravelling the stability of nightingale song over time and space using open, citizen science and shared data. Front. Ecol. Evol. 10:778610. doi: 10.3389/fevo.2022.778610
Jenkins, P. F. (1978). Cultural transmission of song patterns and dialect development in a free-living bird population. Anim. Behav. 26, 50–78. doi: 10.1016/0003-3472(78)90007-6
Josse, J., and Husson, F. (2016). missMDA: A package for handling missing values in multivariate data analysis. J. Statistical Software 70, 1–31. doi: 10.18637/jss.v070.i01
Kandler, A., and Laland, K. N. (2009). An investigation of the relationship between innovation and cultural diversity. Theoretical Population Biol. 76, 59–67. doi: 10.1016/j.tpb.2009.04.004
Kandler, A., and Shennan, S. (2015). A generative inference framework for analysing patterns of cultural change in sparse population data with evidence for fashion trends in LBK culture. J. R. Soc. Interface 12:20150905. doi: 10.1098/rsif.2015.0905
Kipper, S., Mundry, R., Hultsch, H., and Todt, D. (2004). ‘Long-term persistence of song performance rules in nightingales (Luscinia megarhynchos): a longitudinal field study on repertoire size and composition’. Behaviour 141, 371–390. doi: 10.1163/156853904322981914
Krebs, J. R., Ashcroft, R., and Orsdol, K. V. (1981). ‘Song matching in the great tit Parus major L.’. Anim. Behav. 29, 918–923. doi: 10.1016/S0003-3472(81)80029-2
Lachlan, R. F., Ratmann, O., and Nowicki, S. (2018). Cultural conformity generates extremely stable traditions in bird song. Nat. Commun. 9:2417. doi: 10.1038/s41467-018-04728-1
Lachlan, R. F., and Slater, P. J. B. (2003). Song learning by chaffinches: how accurate, and from where? Anim. Behav. 65, 957–969. doi: 10.1006/anbe.2003.2091
Lachlan, R. F., van Heijningen, C. A. A., ter Haar, S. M., and ten Cate, C. (2016). Zebra finch song phonology and syntactical structure across populations and continents-a computational comparison. Front. Psychol. 7:980. doi: 10.3389/fpsyg.2016.00980
Laiolo, P., and Tella, J. L. (2007). Erosion of animal cultures in fragmented landscapes. Front. Ecol. Environ. 5, 68–72. doi: 10.1890/1540-929520075[68:EOACIF]2.0.CO;2
Laiolo, P., Vögeli, M., Serrano, D., and Tella, J. L. (2008). Song diversity predicts the viability of fragmented bird populations. PLoS One 3:e1822. doi: 10.1371/journal.pone.0001822
Laland, K. N. (2004). Social learning strategies. Anim. Learn. Behav. 32, 4–14. doi: 10.3758/BF03196002
Laland, K. N., and Hoppitt, W. (2003). Do animals have culture? Evol. Anthropol. Issues News Rev. 12, 150–159.
Lewis, R. N., Williams, L. J., and Gilman, R. T. (2021). The uses and implications of avian vocalizations for conservation planning. Conservation Biol. 35, 50–63. doi: 10.1111/cobi.13465
Ludwig, K., and Jamieson, I. G. (2007). Phrase types, repertoire size and repertoire overlap in the South Island saddleback (Philesturnus carunculatus carunculatus). Notornis 54, 201–213.
Lynch, A., Plunkett, G. M., Baker, A. J., and Jenkins, P. F. (1989). A model of cultural evolution of chaffinch song derived with the meme concept. Am. Nat. 133, 634–653. doi: 10.1086/284942
Marler, P., and Tamura, M. (1962). Song “Dialects” in three populations of white-crowned sparrows. Condor 64, 368–377. doi: 10.2307/1365545
McComb, K., and Semple, S. (2005). Coevolution of vocal communication and sociality in primates. Biol. Lett. 1, 381–385. doi: 10.1098/rsbl.2005.0366
McLoughlin, M., Lamoni, L., Garland, E. C., Ingram, S., Kirke, A., Noad, M. J., et al. (2018). Using agent-based models to understand the role of individuals in the song evolution of humpback whales (Megaptera novaeangliae). Music Sci. 1:205920431875702.
Morgan, T. J., Acerbi, A., and Van Leeuwen, E. J. (2019). Copy-the-majority of instances or individuals? two approaches to the majority and their consequences for conformist decision-making. PLoS One 14:e0210748. doi: 10.1371/journal.pone.0210748
Muggeo, V. M. R. (2008). Segmented: an R package to fit regression models with broken-line relationships. R News 8, 20–25.
Oksanen, J., Blanchet, F. G., Friendly, M., Kindt, R., Legendre, P., McGlinn, D., et al. (2022). vegan: Community Ecology Package. R Package Version 2.5-7.
Pärt, T. (1994). Male philopatry confers a mating advantage in the migratory collared flycatcher, Ficedula albicollis. Anim. Behav. 48, 401–409. doi: 10.1006/anbe.1994.1254
Paxton, K. L., Sebastián-González, E., Hite, J. M., Crampton, L. H., Kuhn, D., and Hart, P. J. (2019). Loss of cultural song diversity and the convergence of songs in a declining Hawaiian forest bird community. R. Soc. Open Sci. 6:190719. doi: 10.1098/rsos.190719
Pike, T. W., and Laland, K. N. (2010). Conformist learning in nine-spined sticklebacks’ foraging decisions. Biol. Lett. 6, 466–468. doi: 10.1098/rsbl.2009.1014
Podos, J., and Warren, P. S. (2007). The evolution of geographic variation in birdsong. Adv. Study Behav. 37, 403–458. doi: 10.1016/S0065-3454(07)37009-5
Pollard, K. A., and Blumstein, D. T. (2012). Evolving communicative complexity: insights from rodents and beyond. Philos. Trans. R. Soc. Biol. Sci. 367, 1869–1878. doi: 10.1098/rstb.2011.0221
R Core Team (2020). R: A Language and Environment for Statistical Computing. Vienna: R Foundation for Statistical Computing.
Richerson, P., Baldini, R., Bell, A. V., Demps, K., Frost, K., Hillis, V., et al. (2016). Cultural group selection plays an essential role in explaining human cooperation: a sketch of the evidence. Behav. Brain Sci. 39:e30. doi: 10.1017/S0140525X1400106X
Roberts, A. I., Roberts, S. G. B., and Vick, S.-J. (2014). The repertoire and intentionality of gestural communication in wild chimpanzees. Anim. Cogn. 17, 317–336. doi: 10.1007/s10071-013-0664-5
Salwiczek, L. H., and Wickler, W. (2004). Birdsong: an evolutionary parallel to human language. Semiotica 151, 163–182. doi: 10.1515/semi.2004.066
Schulz, T. M., Whitehead, H., Gero, S., and Rendell, L. (2011). Individual vocal production in a sperm whale (Physeter macrocephalus) social unit. Mar. Mammal Sci. 27, 149–166. doi: 10.1111/j.1748-7692.2010.00399.x
Slater, P. J. B. (1986). The cultural transmission of bird song. Trends Ecol. Evol. 1, 94–97. doi: 10.1016/0169-5347(86)90032-7
Sunnåker, M., Busetto, A., Numminen, E., Corander, J., Foll, M., and Dessimoz, C. (2013). ‘Approximate Bayesian Computation’. PLoS Comp. Biol. 9:e1002803. doi: 10.1371/journal.pcbi.1002803
Tchernichovski, O., Eisenberg-Edidin, S., and Jarvis, E. D. (2021). Balanced imitation sustains song culture in zebra finches. Nat. Commun. 12:2562. doi: 10.1038/s41467-021-22852-3
Tchernichovski, O., Feher, O., Fimiarz, D., and Conley, D. (2017). How social learning adds up to a culture: from birdsong to human public opinion. J. Exp. Biol. 220, 124–132. doi: 10.1242/jeb.142786
Tomasello, M., Call, J., Nagell, K., Olguin, R., and Carpenter, M. (1994). The learning and use of gestural signals by young chimpanzees: a trans-generational study. Primates 35, 137–154. doi: 10.1007/BF02382050
van de Waal, E., Borgeaud, C., and Whiten, A. (2013). Potent social learning and conformity shape a wild primate’s foraging decisions. Science 340, 483–485. doi: 10.1126/science.1232769
van Leeuwen, E. J. C., Kendal, R. L., Tennie, C., and Haun, D. B. M. (2015). Conformity and its look-a-likes. Anim. Behav. 110, e1–e4. doi: 10.1016/j.anbehav.2015.07.030
Vaskuti, É., Zsebők, S., and Garamszegi, L. (2022). Tutoring new song elements to male birds in the wild: Lessons learnt from playback tests with the collared flycatcher. Ornis Fenn. 99, 52–59. doi: 10.51812/of.120666
Vaskuti, É, Zsebők, S., Herczeg, G., Blázi, G., Laczi, M., Nagy, G., et al. (2016). A kulturális evolúció nyomai az örvös légykapó (Ficedula albicollis) énekében. Állattani Közlemények 101, 25–41. doi: 10.20331/AllKoz.2016.101.1-2.25
Whitehead, H., Rendell, L., Osborne, R. W., and Würsig, B. (2004). Culture and conservation of non-humans with reference to whales and dolphins: review and new directions. Biol. Conservation 120, 427–437. doi: 10.1016/j.biocon.2004.03.017
Whiten, A., Horner, V., and de Waal, F. B. M. (2005). Conformity to cultural norms of tool use in chimpanzees. Nature 437, 737–740. doi: 10.1038/nature04047
Wickham, H., Averick, M., Bryan, J., Chang, W., McGowan, L., François, R., et al. (2019). Welcome to the tidyverse. J. Open Source Software 4:1686. doi: 10.21105/joss.01686
Williams, J. M., and Slater, P. J. B. (1990). Modelling bird song dialects: the influence of repertoire size and numbers of neighbours. J. Theoretical Biol. 145, 487–496. doi: 10.1016/S0022-5193(05)80483-7
Youngblood, M., and Lahti, D. C. (2022). ‘Content bias in the cultural evolution of house finch song’. Anim. Behav. 185, 37–48. doi: 10.1016/j.anbehav.2021.12.012
Yuan, D., and Price, J. J. (2011). ‘Song-type sharing and matching in a bird with very large song repertoires, the tropical mockingbird’. Behaviour 148, 673–689. doi: 10.1163/000579511X573908
Zandberg, L., Lachlan, R. F., Lamoni, L., and Garland, E. C. (2021). Global cultural evolutionary model of humpback whale song. Philos. Trans. R. Soc. Biol. Sci. 376:20200242. doi: 10.1098/rstb.2020.0242
Zsebők, S., Blázi, G., Laczi, M., Nagy, G., Vaskuti, É, and Garamszegi, L. Z. (2018a). “Ficedula”: an open-source MATLAB toolbox for cutting, segmenting and computer-aided clustering of bird song. J. Ornithol. 159, 1105–1111. doi: 10.1007/s10336-018-1581-9
Zsebők, S., Herczeg, G., Blázi, G., Laczi, M., Nagy, G., Török, J., et al. (2018b). Minimum spanning tree as a new, robust repertoire size comparison method: simulation and test on birdsong. Behav. Ecol. Sociobiol. 72:48. doi: 10.1007/s00265-018-2467-9
Zsebők, S., Herczeg, G., Blázi, G., Laczi, M., Nagy, G., Szász, E., et al. (2017). Short- and long-term repeatability and pseudo-repeatability of bird song: sensitivity of signals to varying environments. Behav. Ecol. Sociobiol. 71:154. doi: 10.1007/s00265-017-2379-0
Keywords: complex birdsong, diversity, stability, conformism, polymorph culture, temporal change, behavior, simulation
Citation: Barta KA, Garamszegi LZ, Scheuring I and Zsebők S (2023) Effects of positive frequency-dependent learning, learning mistakes, and immigration on complex cultures–Validation on the song of collared flycatcher (Ficedula albicollis) by individual-based modeling. Front. Ecol. Evol. 11:1040550. doi: 10.3389/fevo.2023.1040550
Received: 09 September 2022; Accepted: 23 May 2023;
Published: 09 June 2023.
Edited by:
Susanne Shultz, The University of Manchester, United KingdomReviewed by:
Robert Lachlan, University of London, United KingdomMarianne Sarfati, Royal Holloway, University of London, United Kingdom, in collaboration with reviewer RL
R. Tucker Gilman, The University of Manchester, United Kingdom
Copyright © 2023 Barta, Garamszegi, Scheuring and Zsebők. This is an open-access article distributed under the terms of the Creative Commons Attribution License (CC BY). The use, distribution or reproduction in other forums is permitted, provided the original author(s) and the copyright owner(s) are credited and that the original publication in this journal is cited, in accordance with accepted academic practice. No use, distribution or reproduction is permitted which does not comply with these terms.
*Correspondence: István Scheuring, c2NoZXVyaW5nLmlzdHZhbkBlY29scmVzLmh1
†These authors have contributed equally to this work and share last authorship