 Huanchun Huang
 Xuan Liu
 Lijian Ren
95% of researchers rate our articles as excellent or good
Learn more about the work of our research integrity team to safeguard the quality of each article we publish.
Find out more
ORIGINAL RESEARCH article
Front. Ecol. Evol. , 22 August 2022
Sec. Environmental Informatics and Remote Sensing
Volume 10 - 2022 | https://doi.org/10.3389/fevo.2022.973365
This article is part of the Research Topic Meta-Scenario Computation for Social-Geographical Sustainability View all 60 articles
The emotional health of urban residents is increasingly threatened by high temperatures due to global heating. However, how high temperature affects residents’ emotional health remains unknown. Therefore, this study investigated the spatiotemporal pattern of temperature’s impact on residents’ irritability using data from summer high-temperature measurement and emotional health survey in Beijing, combined with remote sensing images and statistical yearbooks. In detail, this study formulated a multiscale geographically weighted regression (MGWR) model, to study the differentiated and spatial influence of high-temperature factors on emotion. Results show: From 09:00 to 20:00, irritability level rose first then gradually dropped, with a pattern of “aggregation-fragmentation-aggregation.” Irritability is very sensitive to intercept and building density (BD). Other variables all have spatial heterogeneity [except for fraction vegetation coverage (FVC) or road network density (RND) as they are global variables], including normalized difference vegetation index (NDVI), water surface rate (WSR), floor area ratio (FAR), and Modified Normalized Difference Water Index (MNDWI) (sorted from the smallest to the largest in scale). Irritability is negatively correlated with NDVI, WSR, and RND, while positively correlated with intercept, MNDWI, FVC, FAR, and BD. Influence on irritability: WSR < NDVI < BD < MNDWI < RND < intercept < FVC < FAR.
Global heating and continued urbanization have aggravated the urban heat island (UHI) effect and created health challenges to the public. Oxford English Dictionary recently added a new phrase “global heating.” According to the Oxford Monitor Corpus, the term “global heating” appeared nearly 15 times more frequently in the first half of 2021 than in the first half of 2018 (Simpson and Weiner, 1993). This word strengthens passive and mild terms such as “climate change” and “global warming” to express the seriousness of climate change caused by human activities and the urgency of solving such problem (World Meteorological Organization [WMO], 2021). In 2020, China’s urbanization level has reached 63.89%, and more natural landscapes have been replaced by impervious surfaces, and highly concentrated human activities have been changing the urban thermal environment (Yang et al., 2019; Yin et al., 2022). This phenomenon occurs in nearly every urban area, no matter whether the city is small or large, or located in warm or cold climates. UHI effect, in turn, endangers residents’ survival and wellbeing. UHI, in addition, is a major trigger of psychological issues like pain, anxiety, and fear (Fritze et al., 2008; Hayes and Poland, 2018).
The research on the influence of urban thermal environment on human health mainly focuses on physiological aspects, discussing the relationship between high temperature and heat-related diseases and mortality (Nitschke et al., 2011; Guo et al., 2018; Thompson et al., 2018; Yin et al., 2018), and paying less attention to emotional health. Studies have shown that there is a significant relationship between high temperature and mental illness. For example, according to a research in Australia, the number of patients hospitalized for mental illness increased by 7% during the heat waves (Hansen et al., 2008). A study of data during four heatwaves in Jinan also found that the number of daily medical visits for mental illness increased significantly during the heatwaves (Liu et al., 2012). Further, a study on the relationship between the daily average temperature and the hospitalization rate of mental disorders in Shanghai from 2008 to 2015 found that when the temperature reached 24.6°C and above, there was a significant positive correlation between the increase in temperature and the increase in the number of hospitalizations for schizophrenia. When the temperature was above 33.1°C, the risk of hospitalization for mental disorders was 1.266 times that of the mean (Peng et al., 2017). However, the analysis of the influence of thermal environment on the emotional health of the general population and its specific influencing factors is still lacking. Therefore, under the background of global heating, it is urgent to pay attention to the emotional health of residents in rapidly urbanized areas, carry out risk assessment of thermal environment on human emotional health, and explore the mechanism of urban thermal environment on emotional health.
The continuous rise of temperature, which concerns people’ emotional health, is one of the major influences of UHI (Manning and Clayton, 2018). Compared to the comfortable temperature of 23°C, with every 1°C increase in temperature, the predictable psychological stress rises by 0.2% (Ding et al., 2016). And people may experience repression, rage, and pain when the temperature is too high (Vanos et al., 2012). Burke et al. (2018) discovered that the higher the monthly average temperature is, the more suppressed words are used on Twitter. In addition, climate change has exacerbated the social inequality faced by heat-vulnerable population, especially the middle-aged and elderly (McMichael, 2017) as they are more likely to develop mental health problems following natural disasters (Parker et al., 2016). When body temperature rises, the temperature of the central nervous system and brain rises as well, triggering the hypothalamus’s selective cooling system to lower the brain temperature. However, for the middle-aged and elderly population, their physical functions and cooling system are not strong enough, thus being widely considered sensitive to extremely high temperature (Hames et al., 2016). To be more specific, heat-vulnerable population includes infants, children, and middle-aged and elderly people (Bielby, 2019). But, due to the insufficient cognitive ability of infants and children, they are not included in this study. Hence, based on Erikson Stages of Psychosocial Development (40–65 years old as Middle Adulthood), this study was targeted at middle-aged and elderly at and over 40 years old. Furthermore, our research team discovered that the negative emotions induced by thermal environment are mostly distress, irritability, nervousness, and hostility, with irritability the most obvious, thus this study decided on the negative emotion of irritability (Huang et al., 2020a).
The urban thermal environment is a complex physical phenomenon, and the influencing factors mainly include spatial structure features, land-use and land-cover change (LUCC), landscape pattern, artificial heat release, and wind environment (Yao et al., 2019; Yue et al., 2019; Xu et al., 2021). Research shows UHI is positively correlated with road network density (RND), while negatively correlated with fraction vegetation coverage (FVC) (Estoque et al., 2017). Moreover, water bodies are another identified source of reduced thermal load, at least during the day, due to a high thermic inertia (Liu and Weng, 2008). The cooling capacity of urban wetland is positively correlated with the wetland’s area, shape, and degree, yet negatively correlated with the height and density of nearby buildings (Xue et al., 2019). Additionally, land surface temperature (LST) and near-surface temperature are two important parameters for studying the urban thermal field. Some scholars used temperature data to analyze the pattern characteristics of urban temperature field. For example, Shen et al. (2017) studied the spatiotemporal distribution of UHI in the center of Shanghai city based on hourly temperature. Heat island intensity and temperature differ in spatiotemporal pattern, maybe because the “thermal hysteresis” of the large heat capacity of the underlying urban surface makes the change of heat island intensity lag behind that of temperature (Mao et al., 2021). Temperature is mainly influenced by each or the combination of LUCC indicators and human factors (Ren et al., 2005). Therefore, FAR, BD, RND, and other related indicators reflecting different human activities, as well as FVC, NDVI, WSR, MNDWI, and other LUCC-related indicators were selected in this study.
With the rapid development of urban thermal environment research, spatial non-stationarity becomes a new trend in studies on land surface index. Geographically weighted regression (GWR) algorithm is limited to a single optimal bandwidth and usually reflects the “average” of the optimal bandwidth of each process (Oshan et al., 2019). It is not suitable for changes in the urban thermal field, as different processes involve different spatial scales. In recent years, the development of MGWR (Fotheringham et al., 2017) has broken the limits. However, MGWR is still insufficient in estimating local parameters. In 2019, Yu et al. (2020) broke the limits of the MGWR model so that it can be widely used in empirical research. Shen et al. (2020) discussed how the MGWR model influences second-hand house price, and proved that it is helpful to studies on spatial variation; Chen and Deng (2021) and Li et al. (2021) used MGWR to analyze how urban landscape and form influence thermal environment.
This manuscript takes the Sixth Ring Road area of Beijing as the research object, and aims to study the spatial distribution characteristics and mechanism of the impact of urban thermal environment on residents’ emotional health. Using Landsat remote sensing images, meteorological stations, and emotional health data to establish a theoretical relationship model between temperature and irritability; combined with ArcGIS, MATLAB, SPSS and other data analysis platforms to analyze the temporal and spatial effects of hourly temperature on irritability in summer from 09:00 to 20:00; based on the MGWR model to explore the spatial differentiation of residents’ irritability affected by different thermal environmental factors. It provides a basis for optimizing the layout of urban green space, improving the urban thermal environment, and reducing the risk of emotional health.
The list of acronyms in this paper is shown in Table 1.
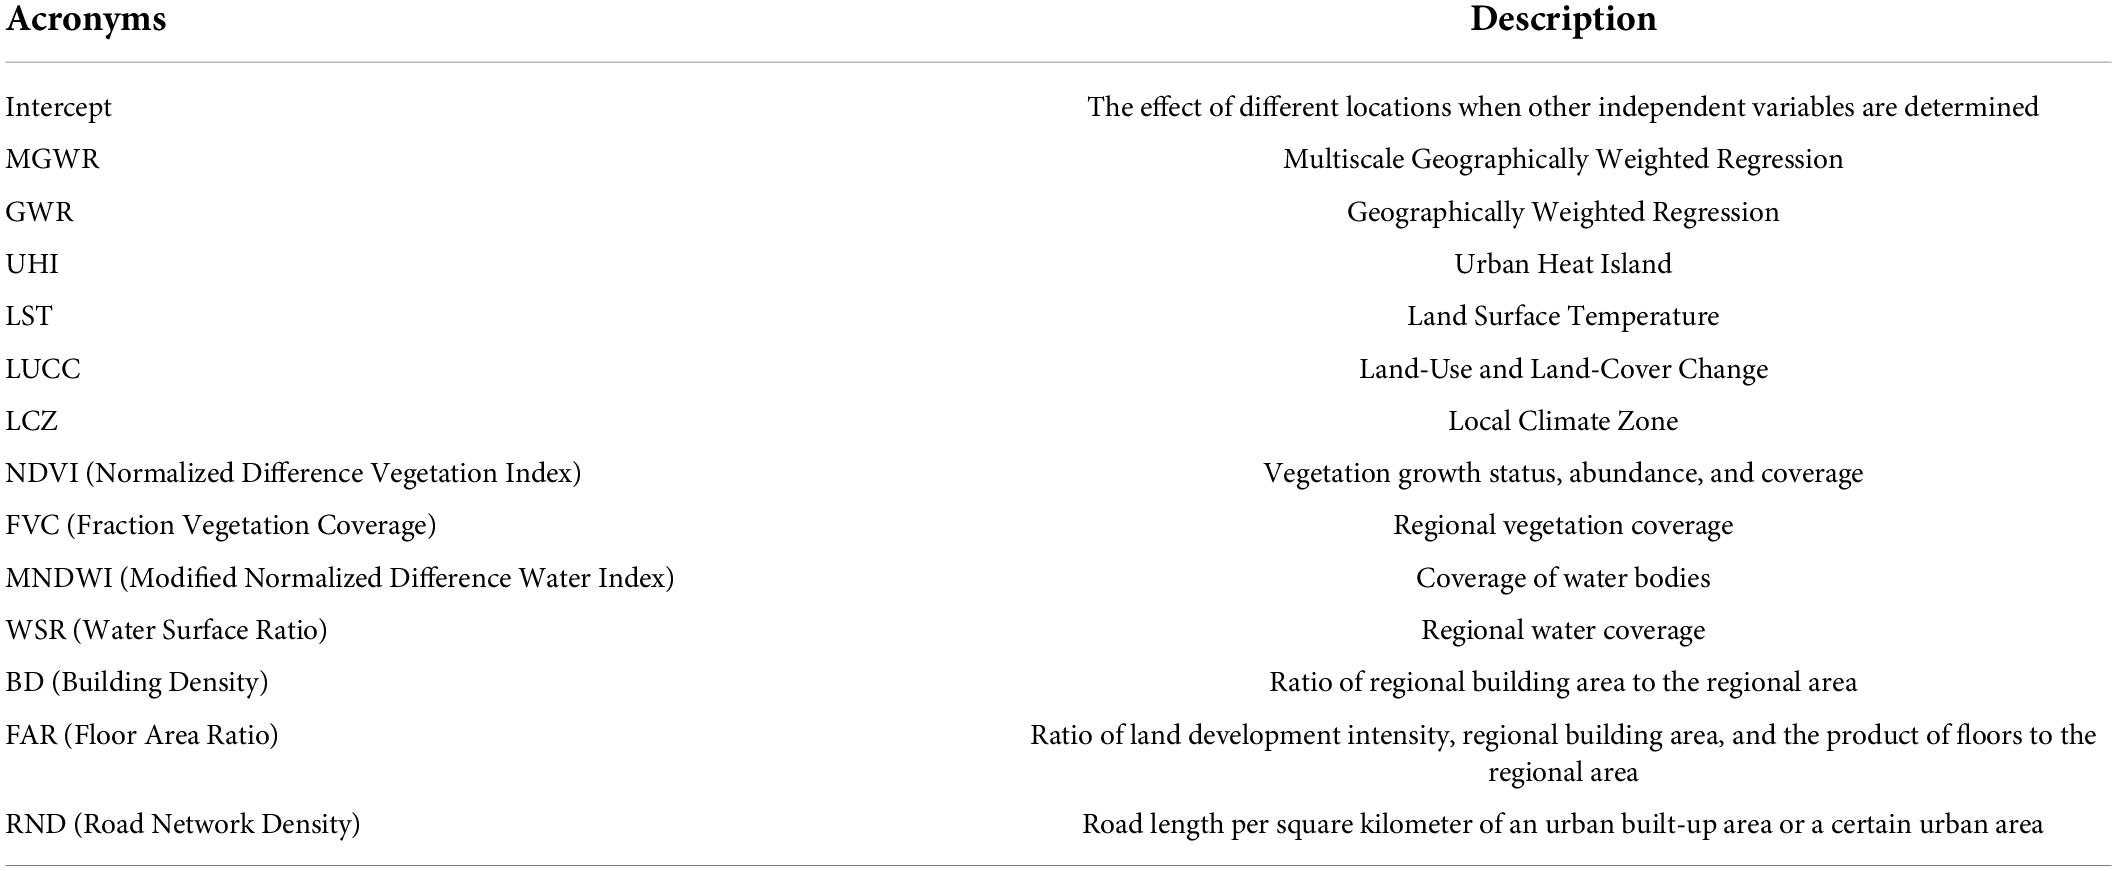
Table 1. List of acronyms.
Beijing (39°24–41°36′ N, 115°42′–117°24′ E) is located in the northern part of North China Plain, adjacent to Bohai Bay, neighboring Liaodong Peninsula in the north and Shandong Peninsula in the south, belonging to a typical semi-humid continental monsoon climate in the north temperate zone. At the end of 2021, the permanent population of Beijing reached 21.886 million. The highly concentrated urbanized buildings, rapidly expanding special underlying surfaces, and frequent and intensive human activities in Beijing deteriorated the urban thermal environment and led to frequent heat waves. During 2011–2021, the average maximum temperature was more than 31°C, and the maximum temperature more than 35°C, seriously affecting the thermal comfort of residents. This study took the most densely populated area–the area within the Sixth Ring Road (Dongcheng District, Xicheng District, Chaoyang District, Haidian District, Fengtai District, Shijingshan District, etc.) as the study area, covering a total area of 2,257.01 km2 (Figure 1).
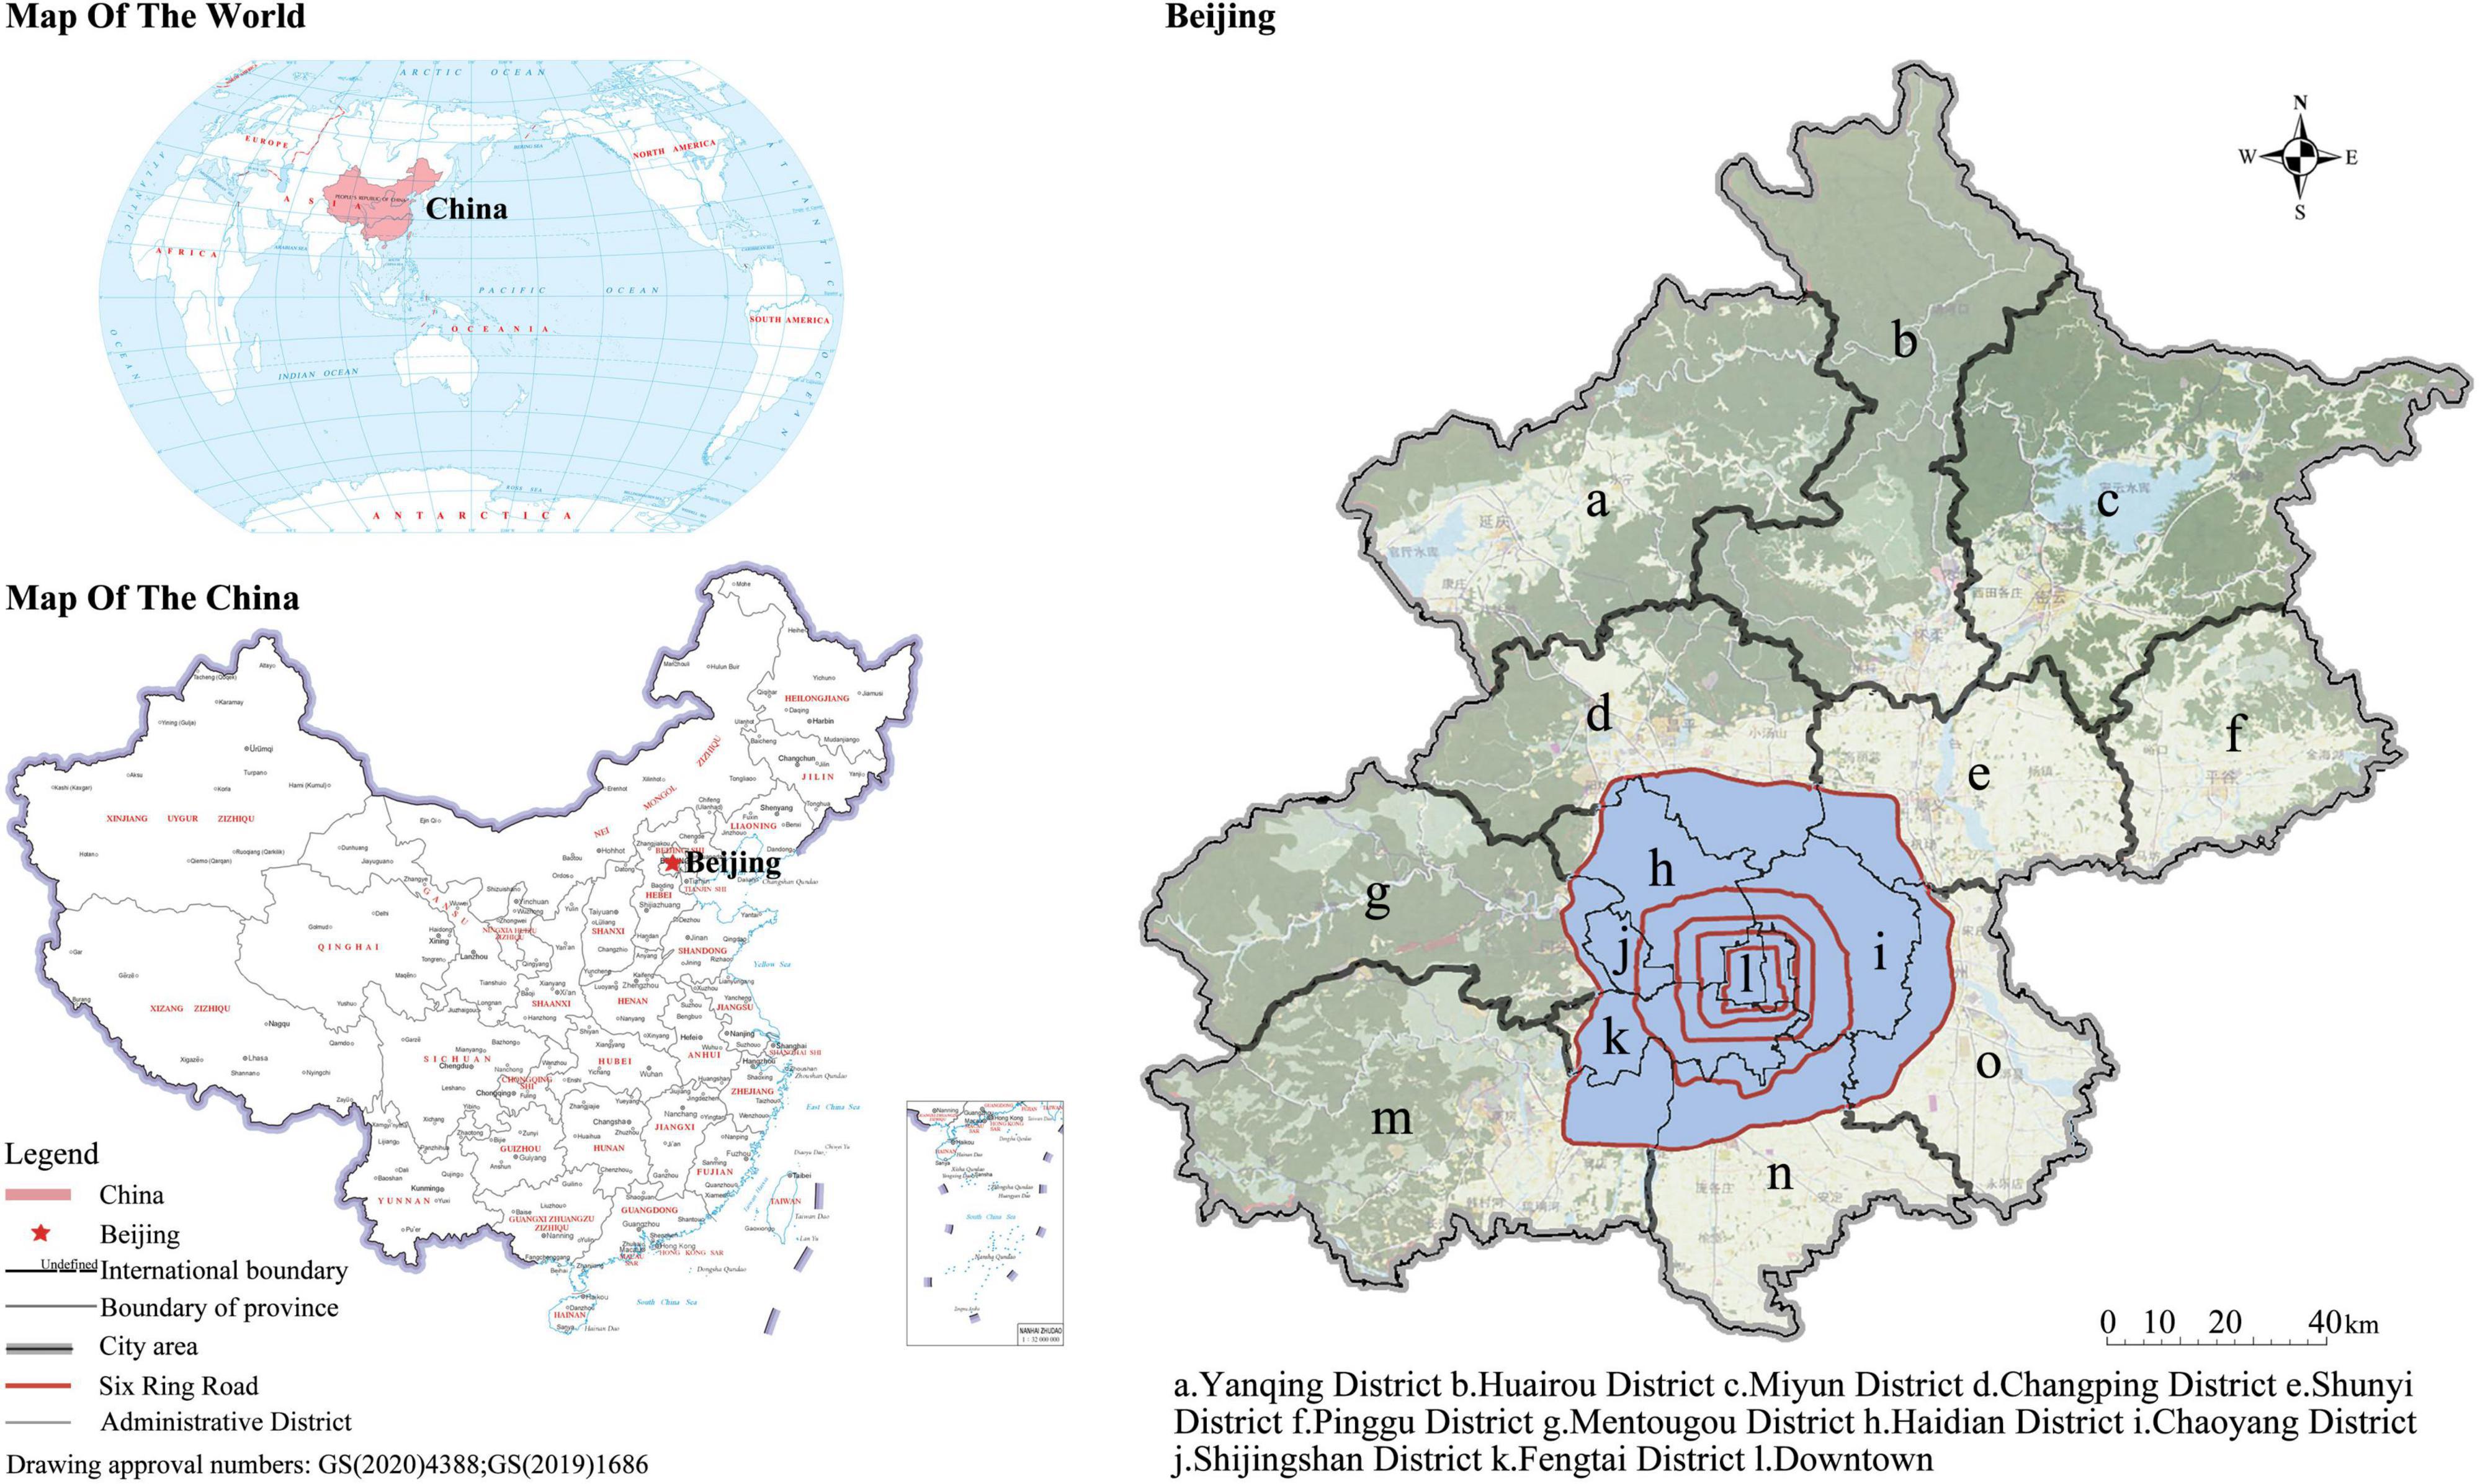
Figure 1. Overview of study areas. The map is the official map approved by the China’s Ministry of Natural Resources and Beijing Municipal Planning Bureau.
The data applied in this study include remote sensing images, meteorological data, and field survey questionnaires. The remote sensing image data is obtained by using the Landsat 8 satellite image provided by the United States Geological Survey (USGS) through the atmospheric correction method. The imaging time was 10:30 in August 2015, with a spatial resolution of 30 m, no precipitation on the imaging day, wind speed lower than 2 m/s, and no cloud coverage. So, the remote sensing images are high-quality, suitable for LST retrieval.
The temperature data was obtained from both fixed and hand-held weather stations. 380 fixed weather stations in different urban functional areas of Beijing, with little interference from the surrounding hard pavements, buildings, and artificial facilities, to guarantee scientific and reliable results. Meteorological data from the fixed weather stations was cleaned, to eliminate interference from cloud and rain and abnormal value, and eventually 183 meteorological stations were selected. The mobile weather station is aligned with the survey site. Combined with remote sensing satellite images, field investigation and related literature review, and according to the environmental characteristics and usage needs of local climate cells, 17 places were selected for microclimate measurement and emotional questionnaire survey.
The survey dates are July-August, the summer with the highest temperature in Beijing, to meet the high temperature requirements for the study. The experiment lasted for 14 days, and the daily maximum temperature was above 33°C. The survey was conducted from 08:00 to 17:00 every day, and the samples were distributed evenly in each time period. There was no rain or high winds for 1-2 days before the experiment. A small WS-30 handheld weather station 1.5m above the ground was used to collect temperature data. The equipment accuracy is ±0.3°C for temperature, ±3% for humidity, and ±0.3m/s for wind speed. After the data was stable, it was automatically recorded every 1min. The samples cover high temperature, medium temperature and low temperature areas in the urban area, and the temperature range is 23°–50°. The Positive and Negative Activation Scale (PANAS) for Chinese people was used in the questionnaire (Huang et al., 2003; Bao et al., 2020). Blank, incomplete and invalid questionnaires under the age of 40 were excluded, and 931 valid questionnaires were obtained. Moreover, in order to minimize the error of data analysis due to the influence of previous activities or unexpected events experienced by the subjects, this study initially screened the research subjects while ensuring the randomness of sampling, excluding those who are in indoor environment, going out of the car, doing outdoor strenuous exercise, or staying under shade for a long time.
The flow chart of the research method is shown in Figure 2.
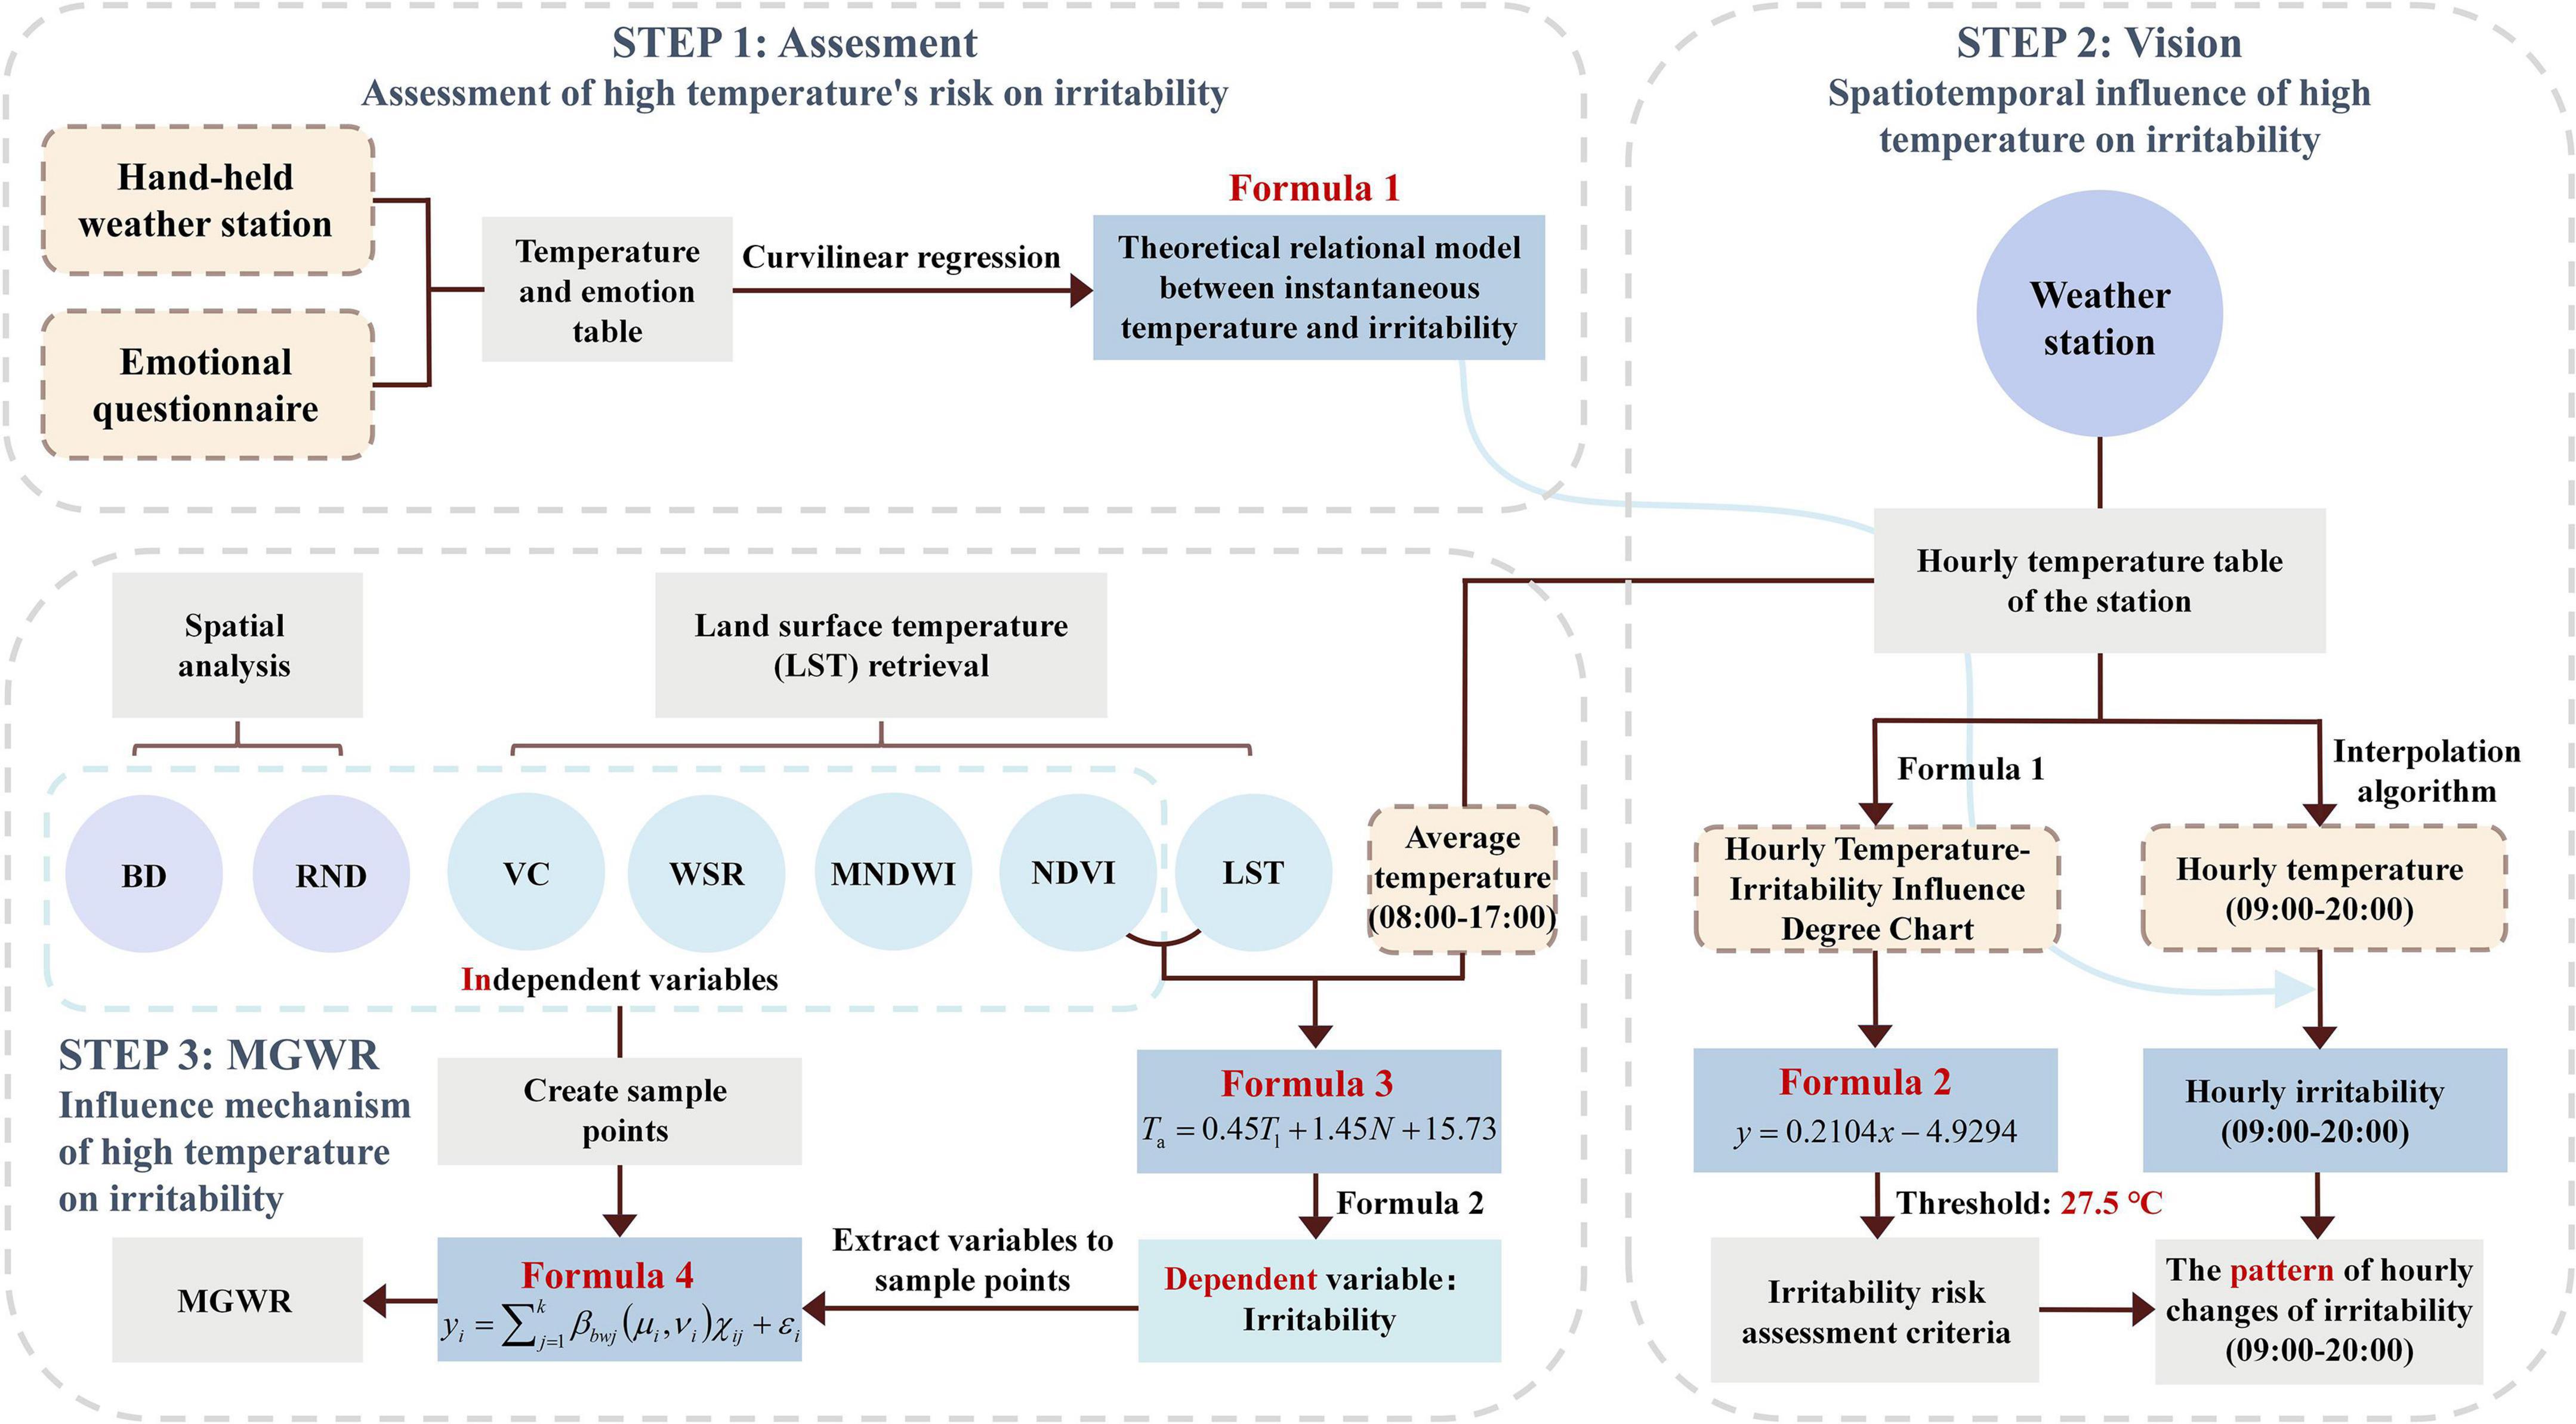
Figure 2. Analytical framework.
First, according to the time and temperature data recorded by the handheld weather station and the time and emotion data collected by the questionnaire, matched temperature data with emotional data to set up a survey table of temperature and emotion. Multiple reviews ensure the correctness of the data. Temperature data collected from the hand-held weather stations was analyzed by plotting on the GraphPad platform (see Figure 3). Results show that the sample data covers 25.1–50.5°C with an excellent overall spatial distribution. The upper quartile is 42.9°C, median quartile 39.7°C, and lower quartile 35.2°C. Samples are concentrated during 35.2–42.9°C, enough to represent summer days above 35°C. A fundamental descriptive analysis suggests that the samples can be used to study urban heat’s spatiotemporal effects on residents’ irritability. Thereafter, based on the survey table of temperature and emotion, the influence degree index of irritability in each temperature range was obtained by cross-table analysis of SPSS. Next, smooth the data and standardize the impact index according to the maximum value.
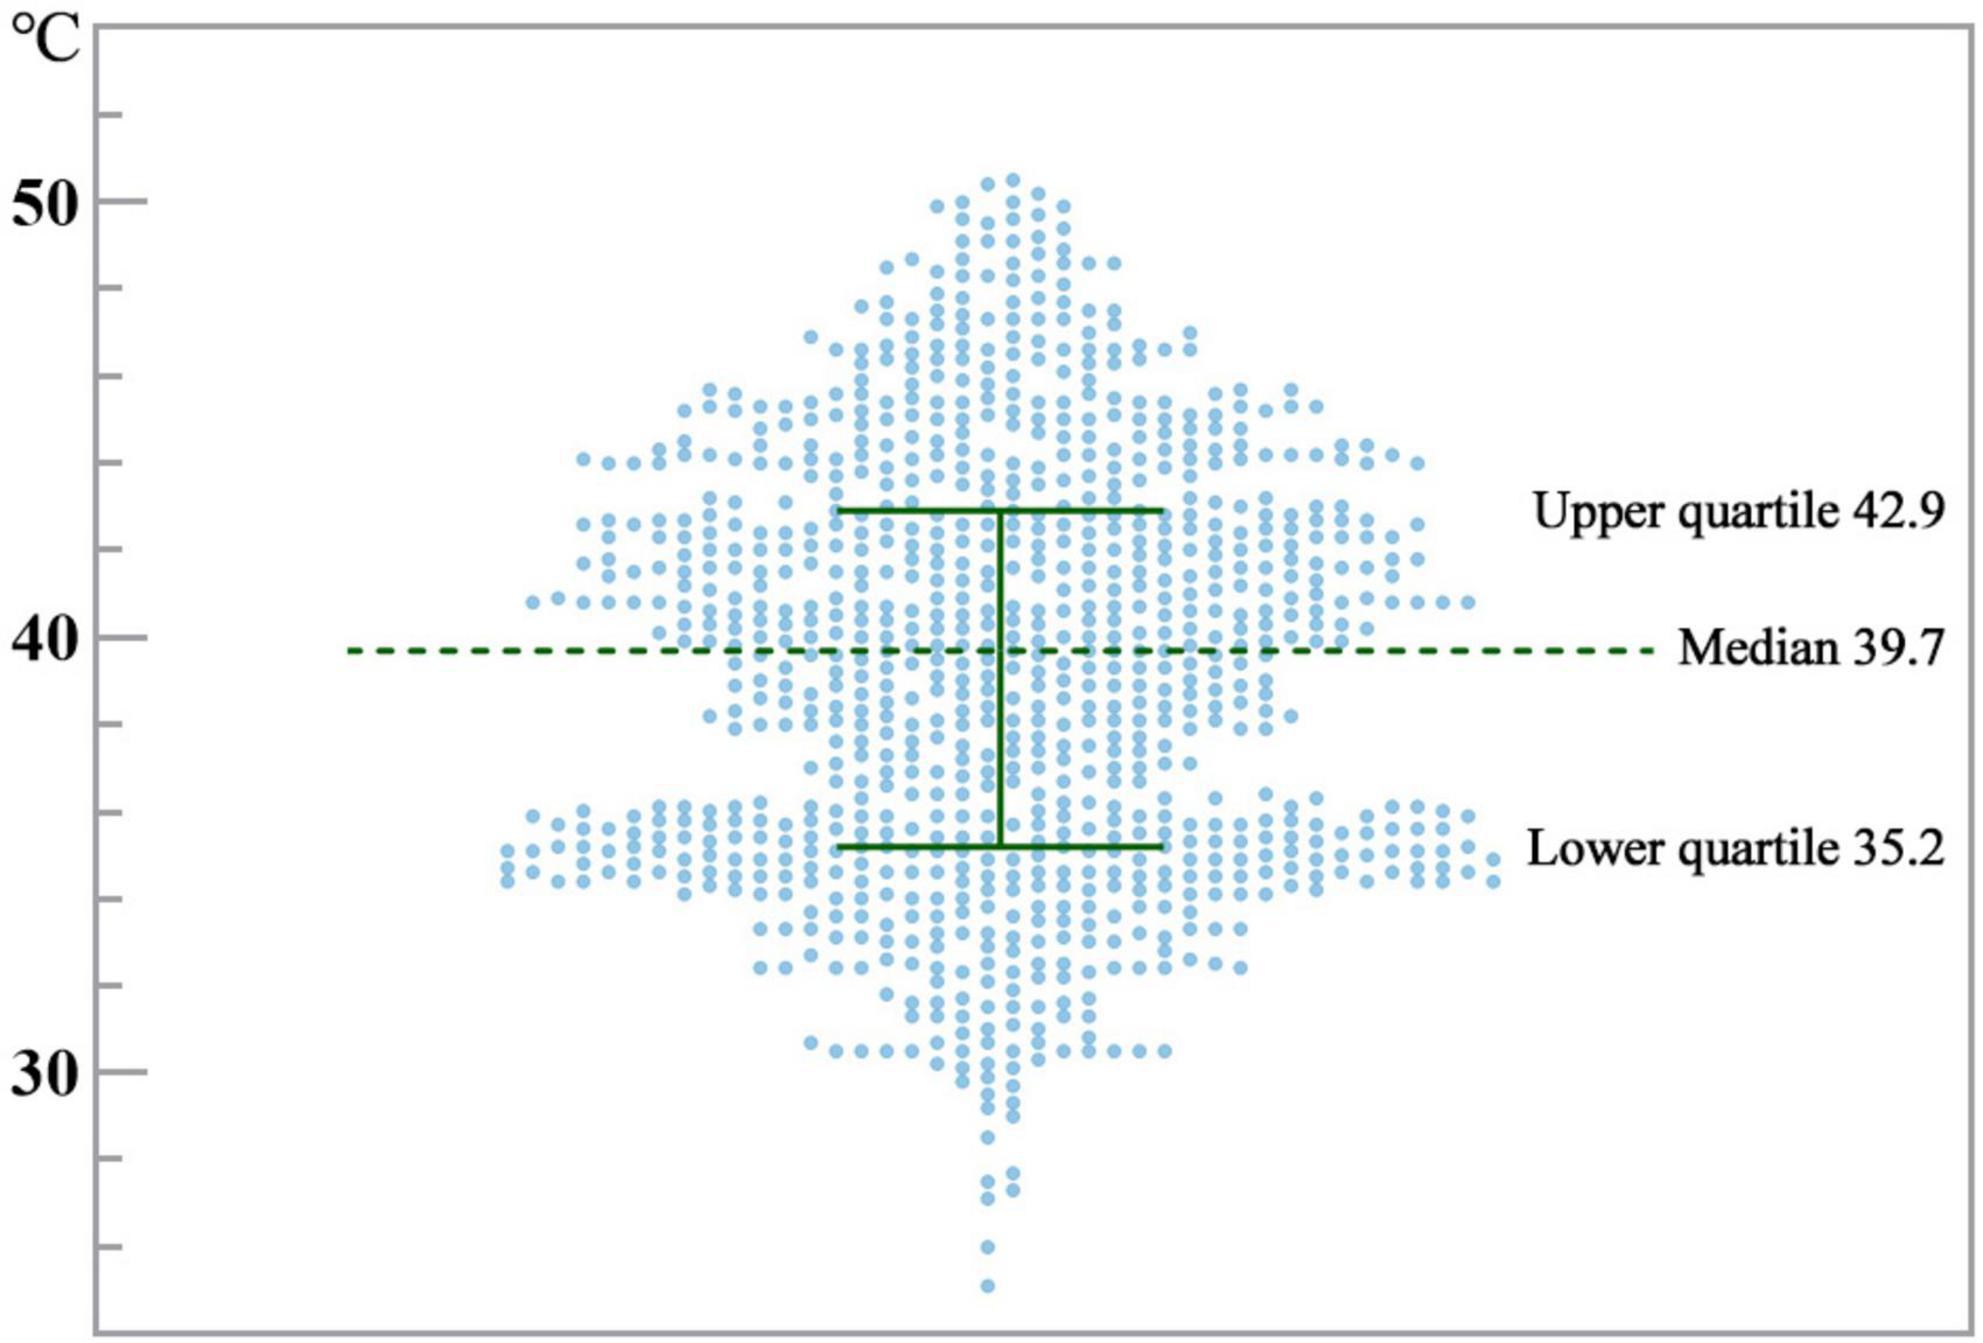
Figure 3. Sample temperature distribution.
The curve fitting toolbox Cftool of MATLAB software was used to analyze various curve regressions on questionnaire and temperature data, to establish a theoretical relational model between instantaneous temperature and irritability, and selected the most fitted equation as the practical relational model in this study (see Figure 4). The formula is as follows:
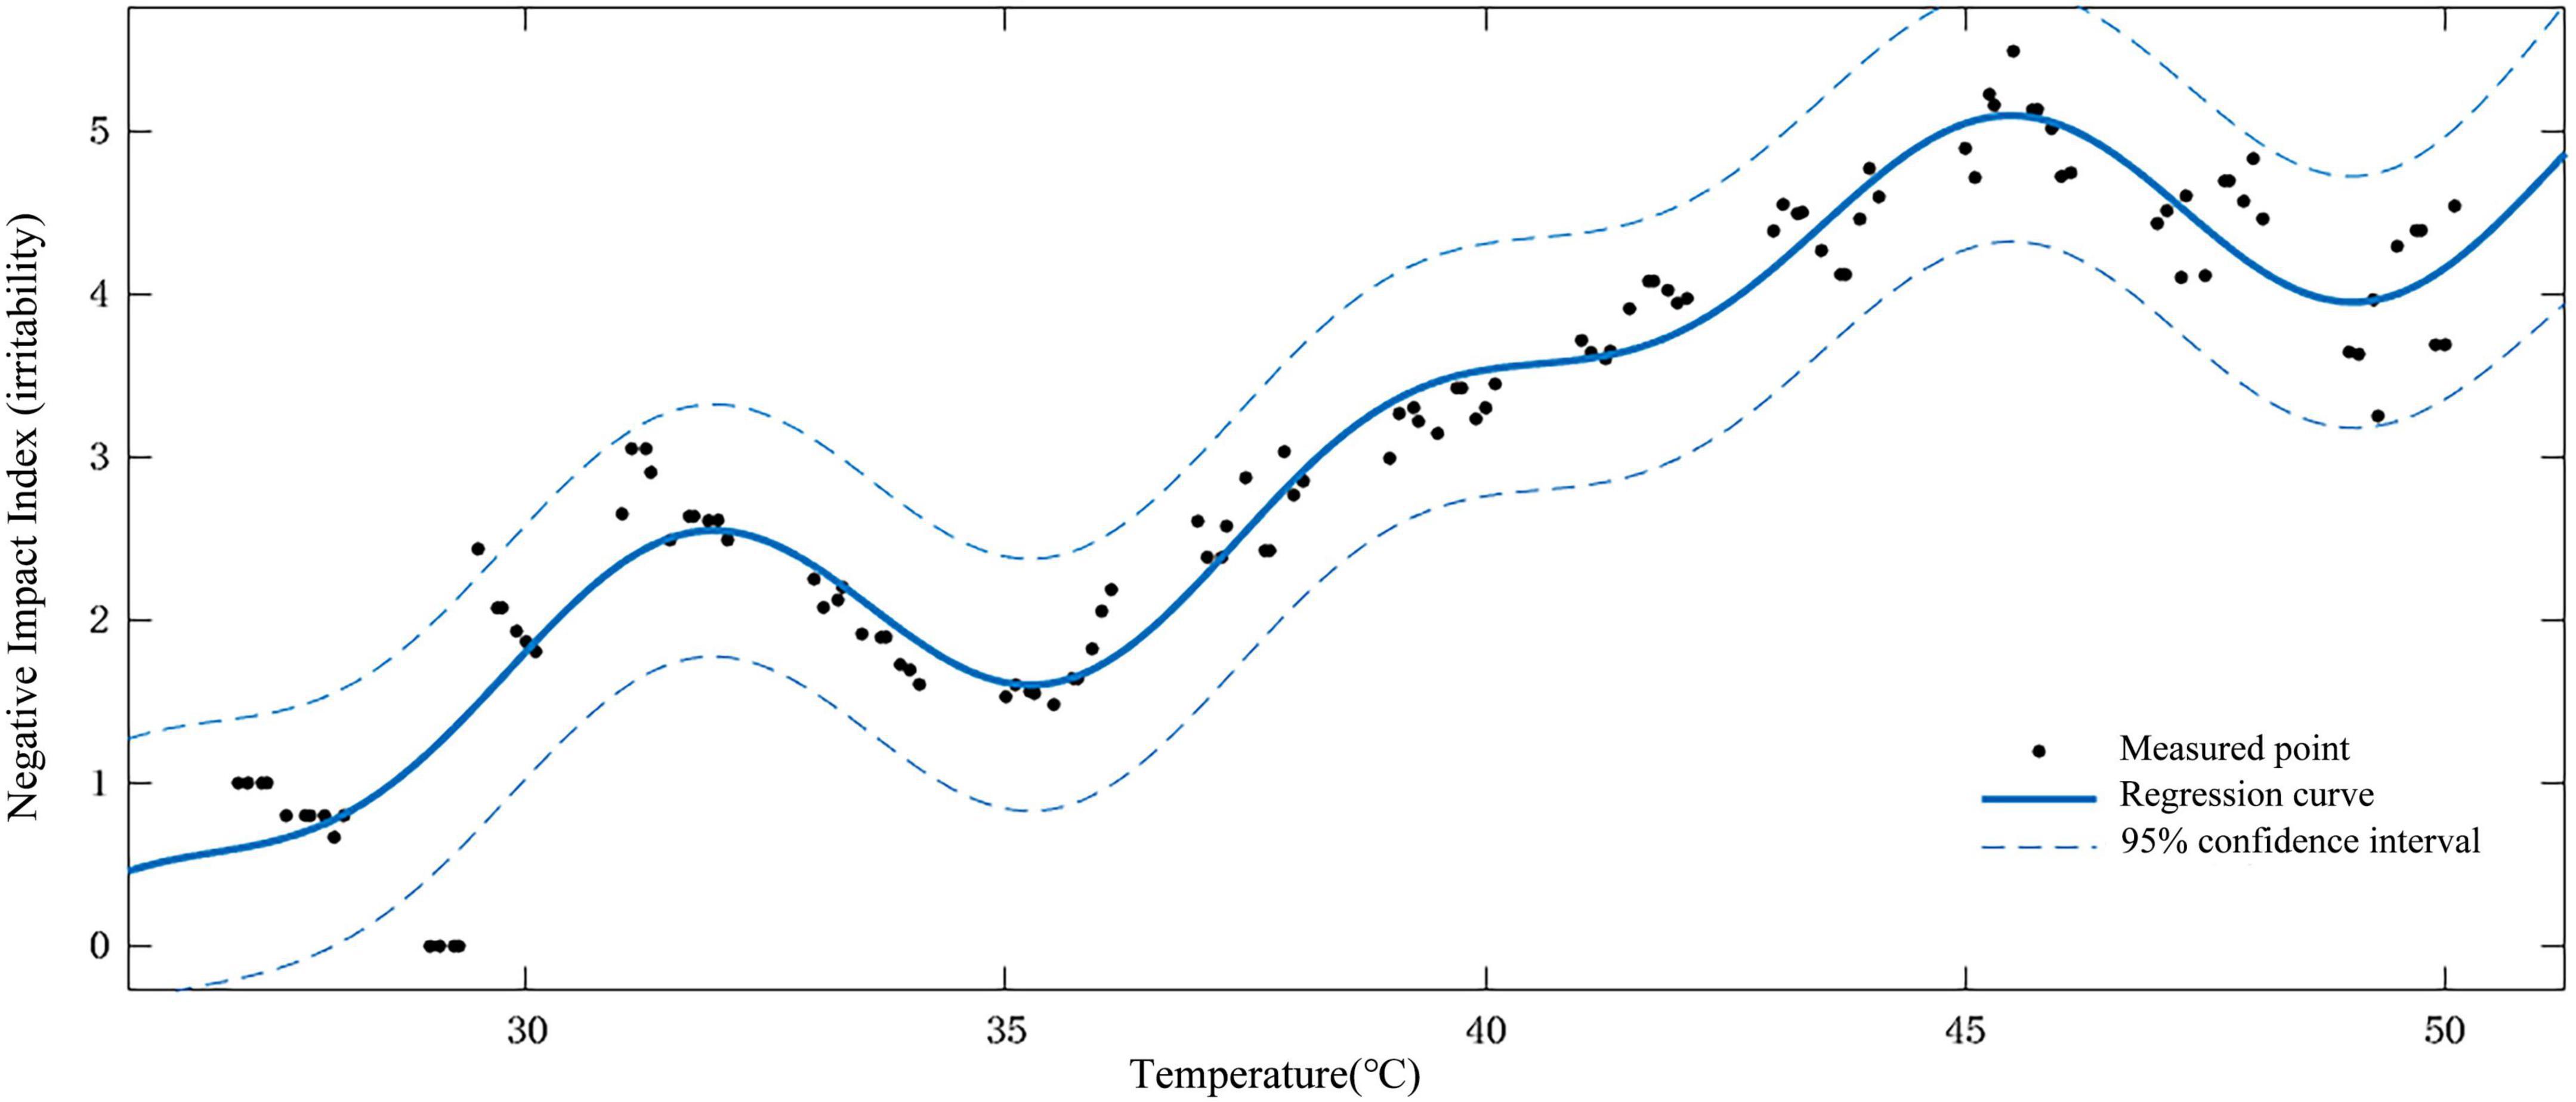
Figure 4. Relational model between instantaneous temperature and irritability.
where Ni is the irritability value, t is the instantaneous temperature. SSE: 15.85, R2 = 0.93.
The fixed meteorological stations recorded the temperature every 30 min. 09:00–20:00 is the period when residents are intensively exposed to the outdoor environment, and when high temperature significantly influences their emotions. Therefore, the temperature data from 09:00 to 20:00 was extracted to form an hourly temperature table. Since the temperature field is a spatial variable that changes continuously, and the temperature captured by stations is an accurate value of a fixed point, in order to obtain both smooth and accurate interpolation results, this study used the spline function method to interpolate the stations, and attained the hourly temperature from 09:00 to 20:00. Then, hourly temperature was put into Eq. 1 to get hourly irritability value.
Finally, based on human body’s reaction to high temperature (Li et al., 2017), the correlation curve between instantaneous temperature and irritability, and with the daily average temperature from 8:00 to 17:00 in the hourly temperature field data of the fixed meteorological station as the average temperature in the typical period, the relationship curve between the average temperature in the typical period and the irritability was established (Figure 5) (Formula 2), providing basic conditions for carrying out urban climate health risk assessment. The average daily temperature of 27.5°C calculated from the observation data of Beijing Meteorological Station was taken as the threshold temperature for the influence of high temperature on Irritability, and the impact of high temperature on Irritability was divided into ten grades (Table 2) as the standard for evaluating the risk of human Irritability (Denissen et al., 2008; Qi et al., 2015; Noelke et al., 2016).
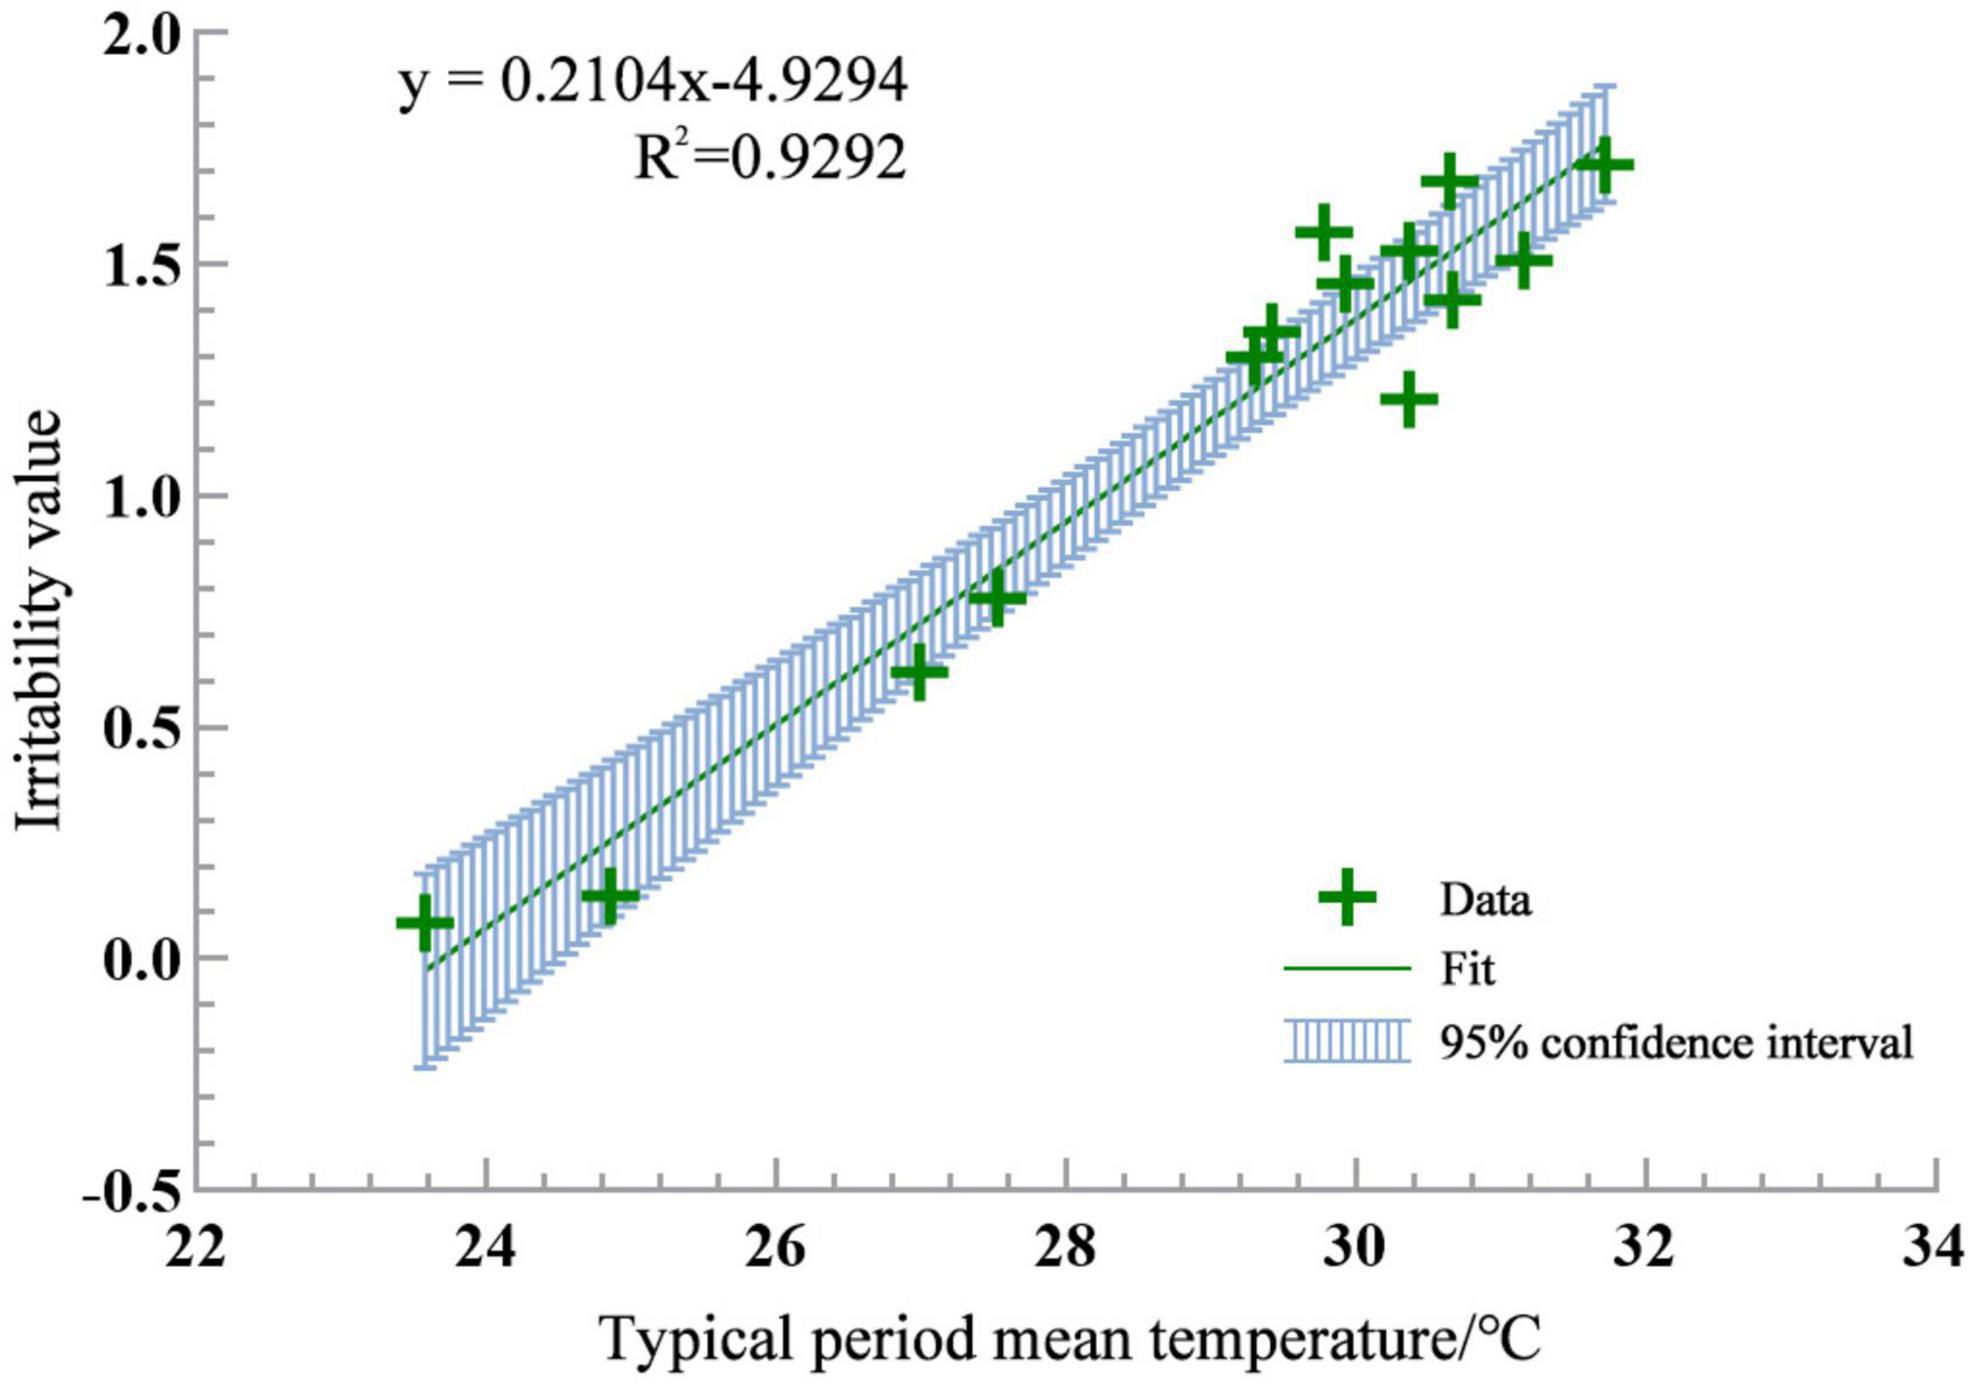
Figure 5. Relational model between average temperature and average irritability value in typical periods.
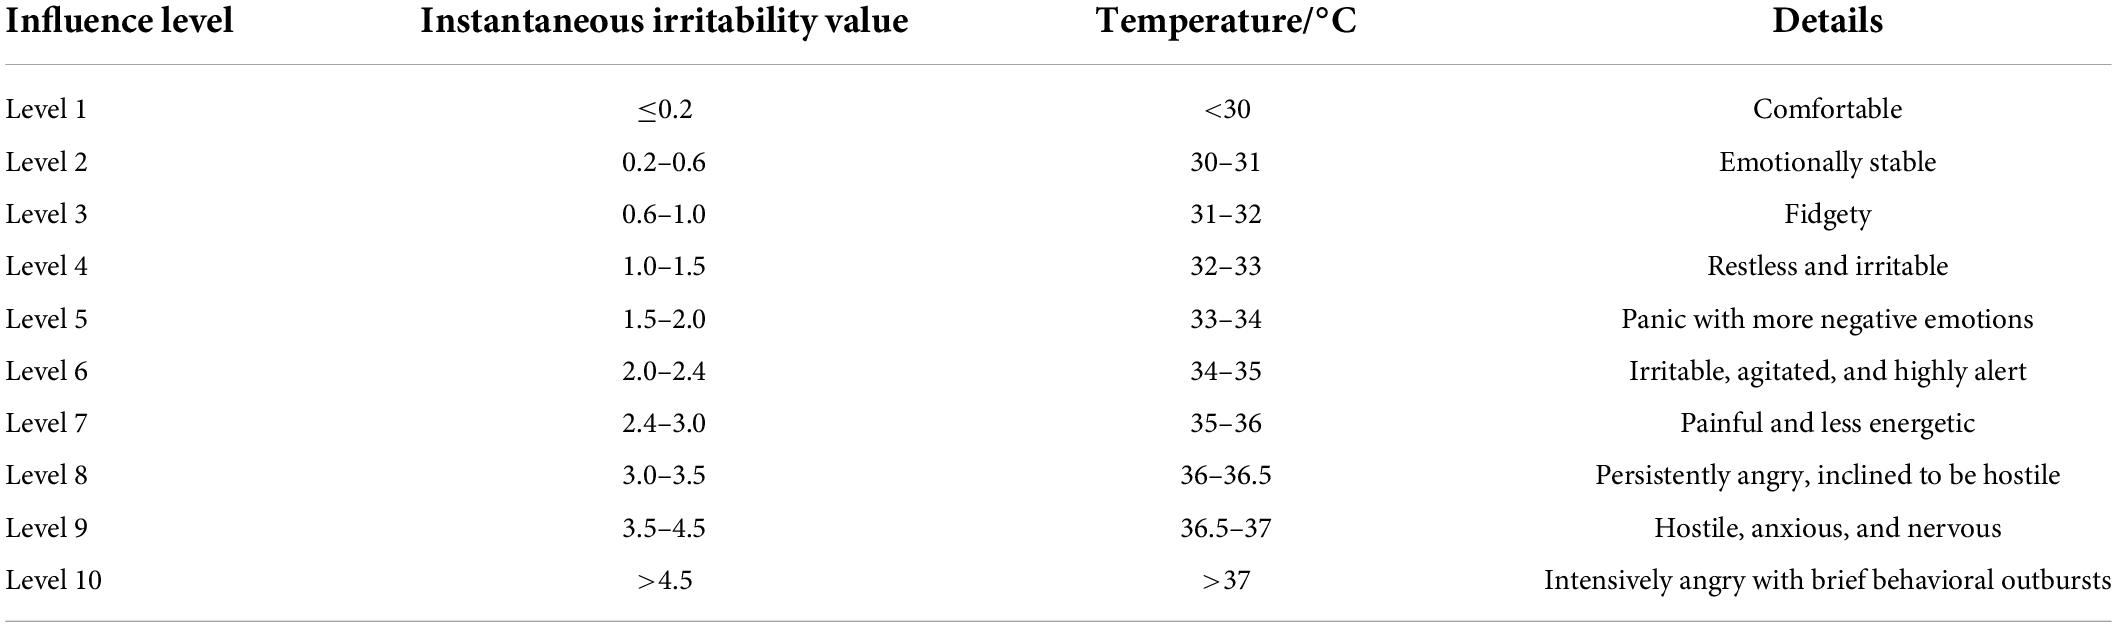
Table 2. Standard of evaluating risk of irritability.
where γ is the average irritability value, and is the average temperature in the typical period. R2 = 0.93, with good goodness of fit.
First, based on the Landsat8 satellite image, LST was retrieved. This manuscript used the atmospheric correction method, with the influence of the atmosphere on the surface radiation excluded from the total amount of thermal radiation received by the satellite sensor, to obtain the surface brightness temperature value, and then the surface brightness temperature was converted into the corresponding LST (Yue and Liu, 2018).
The summer temperature field data measured by fixed meteorological stations were collected to form the hourly temperature data table of the station. The average hourly temperature from 8:00 to 17:00 every day was taken as the average temperature in typical periods, and regression analysis was performed on LST, NDVI, and the average temperature in typical periods, to formulate the linear regression equation of them (Eq. 3):
where Ta is the typical period average temperature, Tl is the land surface temperature (LST), and Nis the NDVI. R2 = 0.58.
Second, in order to obtain the average irritability value (dependent variable), the inversion of Beijing’s 2015 summer LST and NDVI are substituted into Formula 3 to obtain the average temperature in the corresponding typical period, and then the average temperature in the typical period is substituted into Formula 2 to obtain the corresponding average irritability value.
Further, via the ENVI software, the Landsat8 remote sensing images were preprocessed by radiometric calibration, atmospheric correction, and geometric correction, and NDVI (Tan et al., 2004) and MNDWI (Xu, 2006) were calculated, to exclude the parts where NDVI and MNDWI < 0, and obtain FVC and WSR. All the land-use indicators in the study area were counted, to attain BD, FAR, and RND to get the independent variables. Then, all factors were projected uniformly to ensure data consistency. Finally, the MGWR model was constructed. In the study area, based on the 1 km grid scale, 2,000 sample points were created, and variables were extracted to the sample points; 1,577 valid sample data were obtained after removing outliers. Independent variables, dependent variable, and intercept were imported to MGWR, and the quadratic kernel function of classical GWR and AICc was still utilized as the standard for choosing the kernel function and bandwidth. As a result, valid parameters: 1,577, covariates: 8, and iterations: 74. When the difference in parameter estimation of subsequent iterations converges to the specified threshold, the iteration is terminated, and the convergence threshold is 1.0e–05. The model formula is as follows (Formula 4):
where yi is the average irritability value of sample point i, βbwj denotes the regression coefficients of different variables j at different bandwidth levels, xij is the observed value of variable j at location i, (μi,νi) denotes the geographical coordinates of variable i, and εi is the stochastic error term.
According to the risk evaluation standard of irritability, the spatial pattern of the impact of high temperature on irritability in the Sixth Ring Road area of Beijing in the summer of 2015 was evaluated (Figure 6).
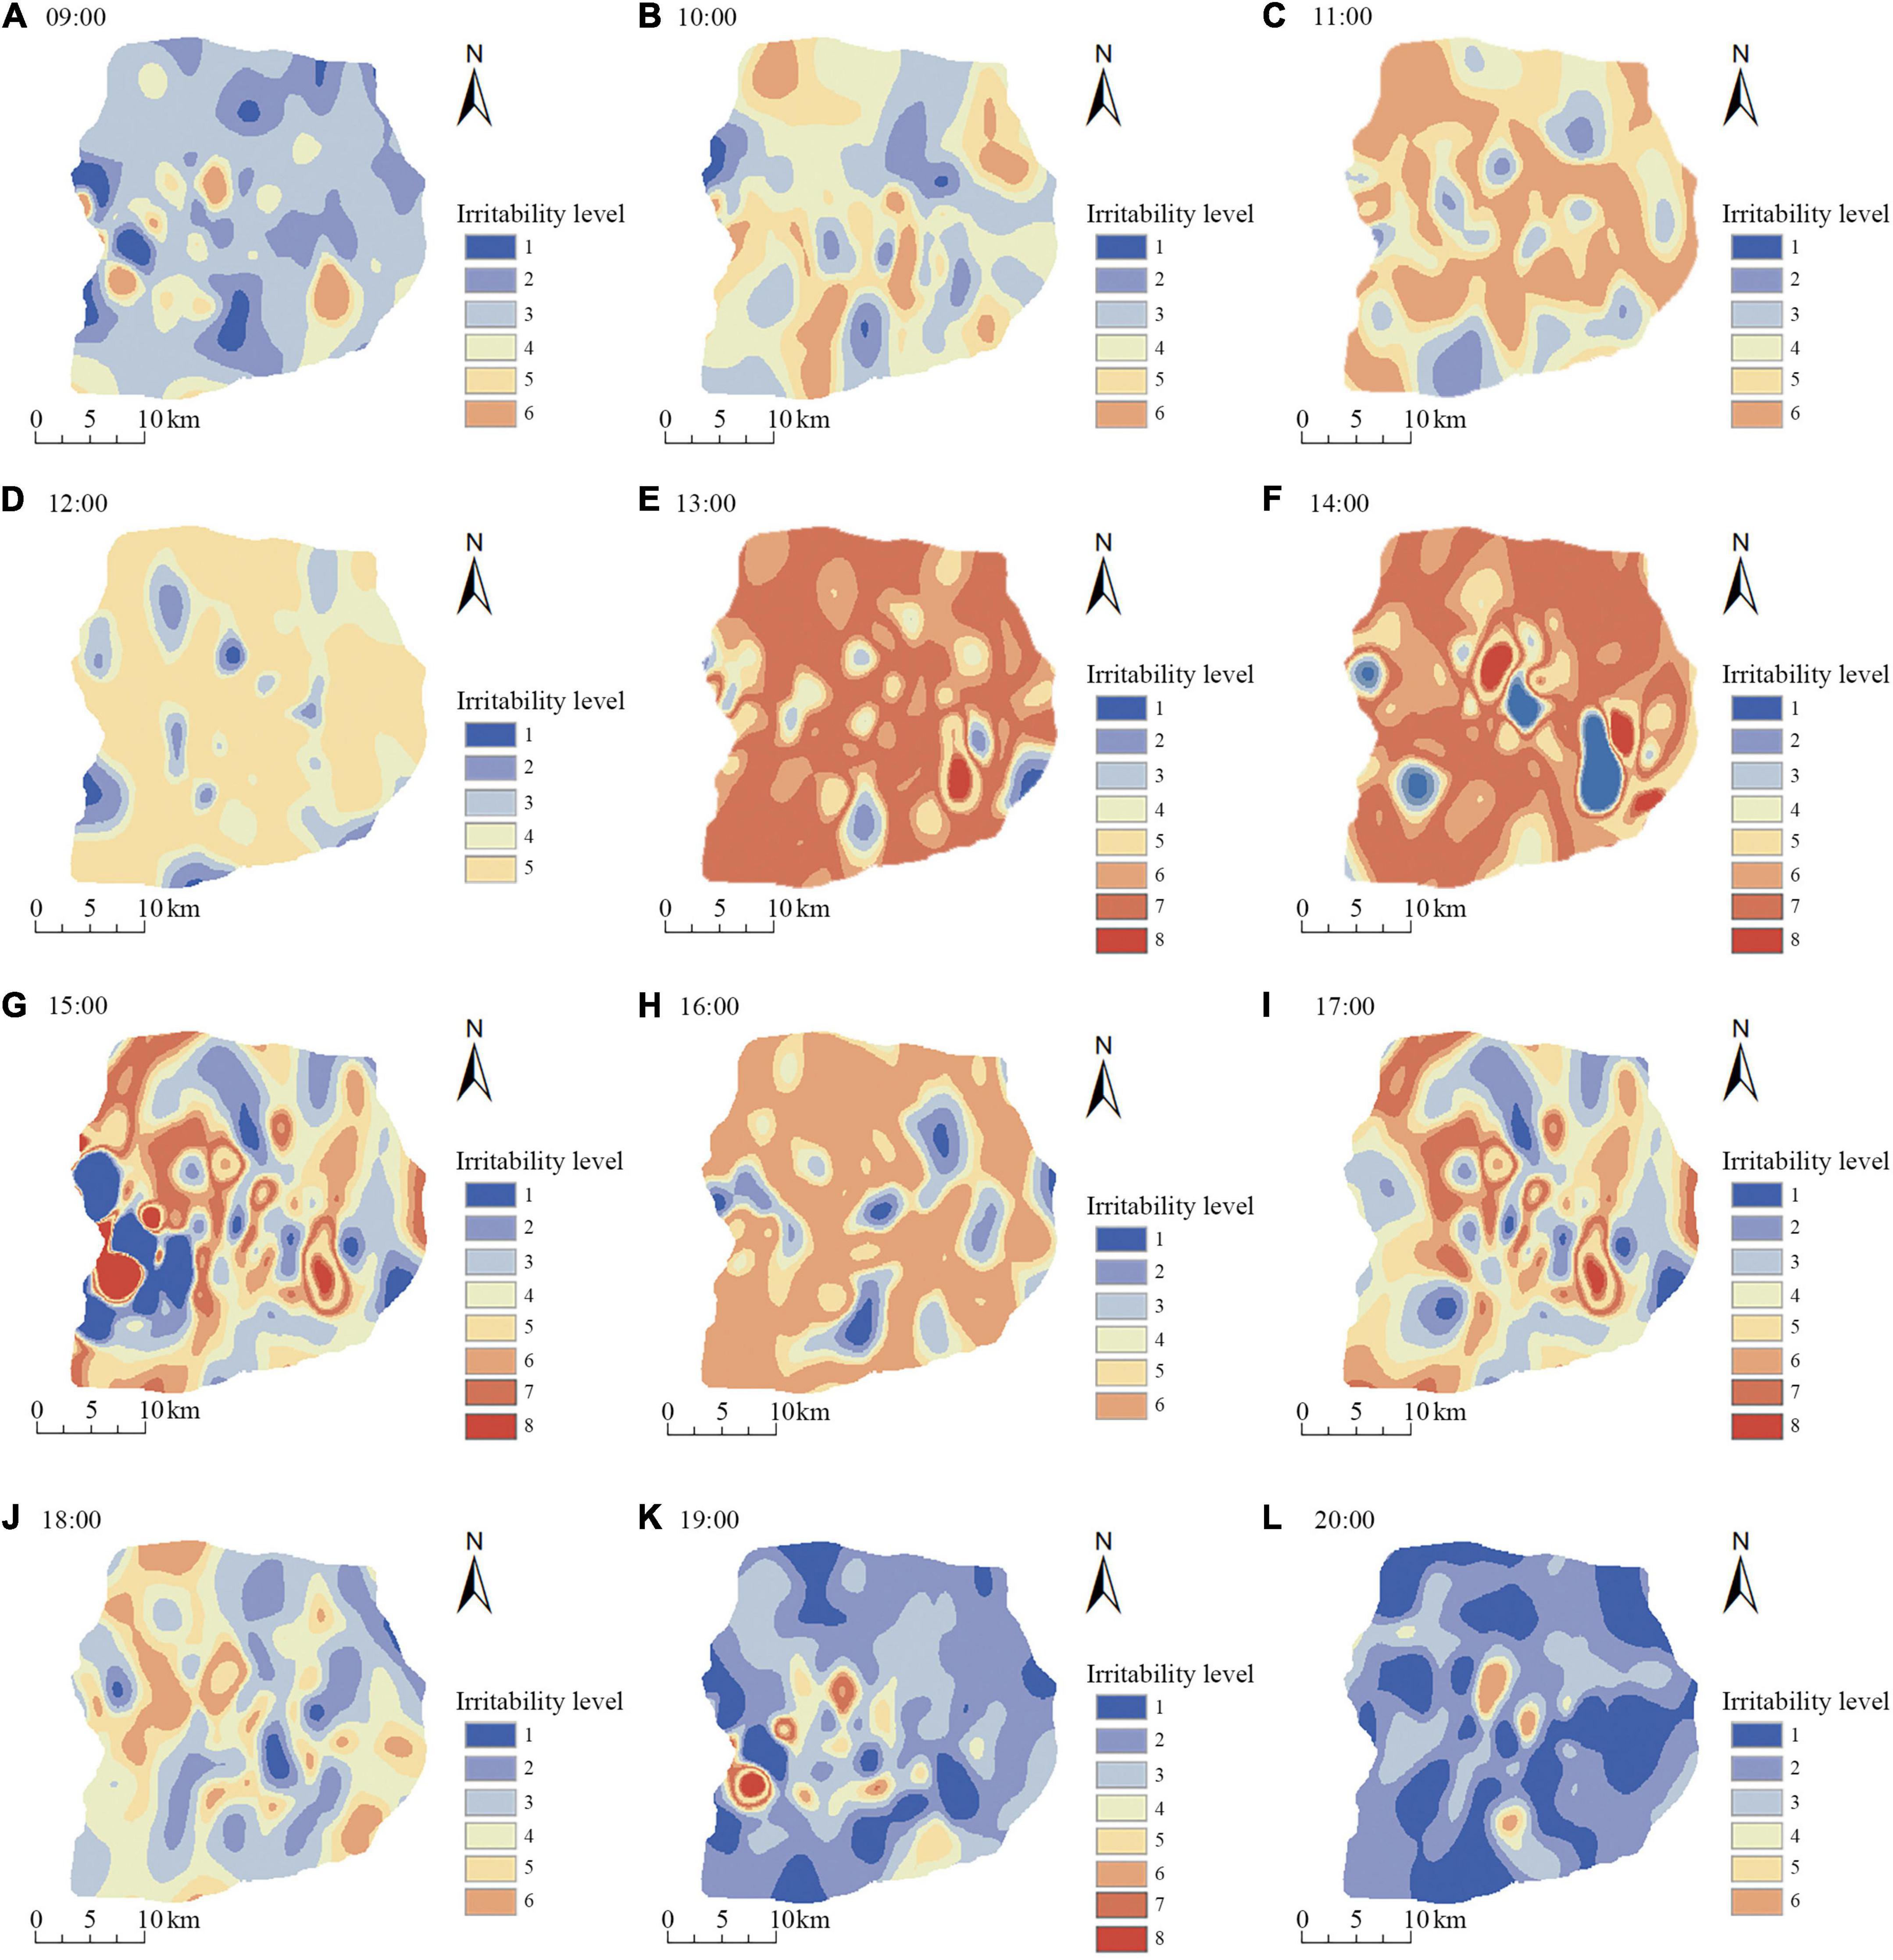
Figure 6. Evolution of spatiotemporal pattern of urban heat island (UHI)’s influence on irritability from 09:00 to 20:00.
During 09:00–20:00, the irritability level first increased then decreased. From 09:00 to 15:00, irritability rocketed; from 15:00 to 20:00, irritability declined slowly. Irritability peaked at Level 8 at 15:00. The influence pattern showed a trend of “aggregation-fragmentation-aggregation”.
During 09:00–12:00 (A–C), water supply for plant transpiration decreased, drastically heating up the green area (Gill et al., 2007). High-level patches shifted from being scattered to a large matrix. After that, the temperature in urban and suburban areas continued to rise, temperature difference between urban areas and suburbs dwindled, urban cooling slowed down, a large number of artificial heat sources gathered in the city center, and the irritability level increased toward the city center.
12:00–17:00 (D–I) is the high-temperature period. The temperature gradually rose, irritability rose to Level 8, and high temperature’s influence on irritability became highly fragmented. After 14 o’clock, the increment of land surface heat storage dwindled, and at 15 o’clock, the heat continued to spread, and the cooling rate of green space and water bodies accelerated. Large parks, especially Beijing Olympic Park, the Old Summer Palace, Fragrant Hills Park, and Century Forest Park, as well as large water systems in the north and south of the Sixth Ring Road cooled the surrounding areas by releasing latent heat and reducing the energy available for sensible heat (Peng et al., 2012), forming up large Level 1–3 patches, covering an area of about 579.88 km2. At 16 o’clock, the cooling effect of the wedge-shaped green space around the city was the most obvious, and the irritability level decreased toward the city center along with the wedge-shaped green space.
During 17:00–20:00 (J–L), the temperature dropped, wind speed increased, and the intensity of human activities gradually decreased. Low-impact areas spread from the outskirts to the city center. The main reason is that the lower atmospheric layer of the city was under low pressure, while that of the suburbs under high pressure, pushing cold air flows into the city. At the same time, on the urban boundary layer, the cooling capacity was mainly attributed to the increased roughness of green surface which improved convection efficiency (Gunawardena et al., 2017).
Results of correlation test using SPSS software show that (see Table 3): Except for MNDWI, all the other variables are significantly correlated with irritability at 0.01 level (two-tailed); The most significantly correlated one is NDVI—correlation coefficient around 0.5, followed by FVC and FAR—correlation coefficient above 0.4; FVC and NDVI are significantly negatively correlated with irritability, able to alleviate irritability; FAR, BD, and RND are significantly positively correlated with irritability—correlation coefficient above 0.3, indicating that the thermal environment effect of artificial surface is the main reason for intensified irritability. The correlation between MNDWI and irritability is not significant. Previous studies showed that MNDWI is negatively correlated with heat island in spring, summer, and autumn, and significantly negatively correlated in summer, indicating that increasing WSR alleviates heat island in summer (Chen and Deng, 2021).

Table 3. The correlation of thermal environmental factors influences irritability.
In this study, the precision results of classical GWR and MGWR models were compared. According to Table 4, the goodness of fit R2 of MGWR is 0.879, higher than that of GWR, and the AICc is lower than that of GWR. Hence compared with classical GWR, MGWR produces more precise results. In addition, the number of effective parameters and the sum of residual squares of MGWR are both smaller than those of GWR, indicating that MGWR produces a more precise regression result with fewer parameters. In terms of the regression coefficient, all variables of MGWR are significant. Meanwhile, GWR cannot reflect the different functions of variables, resulting in a lot of noise and errors in the regression coefficient, causing instability (only intercept is the significant variable). Therefore, MGWR is superior to GWR in this study, more suitable for analyzing spatial heterogeneity of the thermal environment.
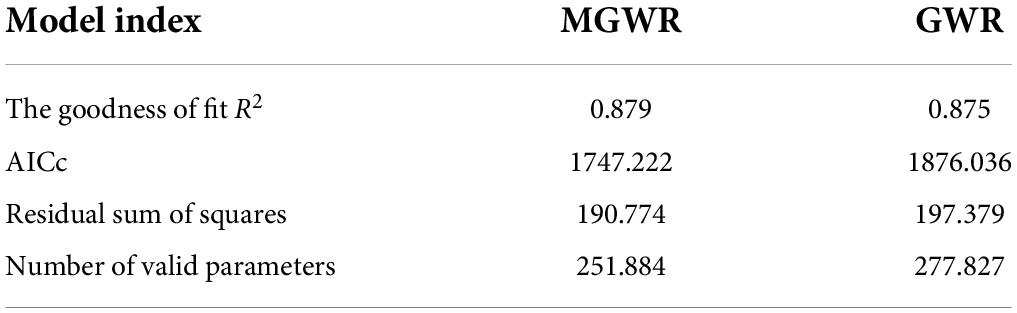
Table 4. Comparison of regression model results.
Results of model processing (see Table 5) show that classical GWR can only reflect the mean value of the function of each variable, while MGWR can directly reflect the different functions of each variable. The best-fitting bandwidth of each variable is (sorted from the largest to the smallest) VC, RND, MNDWI, FAR, WSR, NDVI, BD, and intercept. The bandwidths of different variables are significantly different:
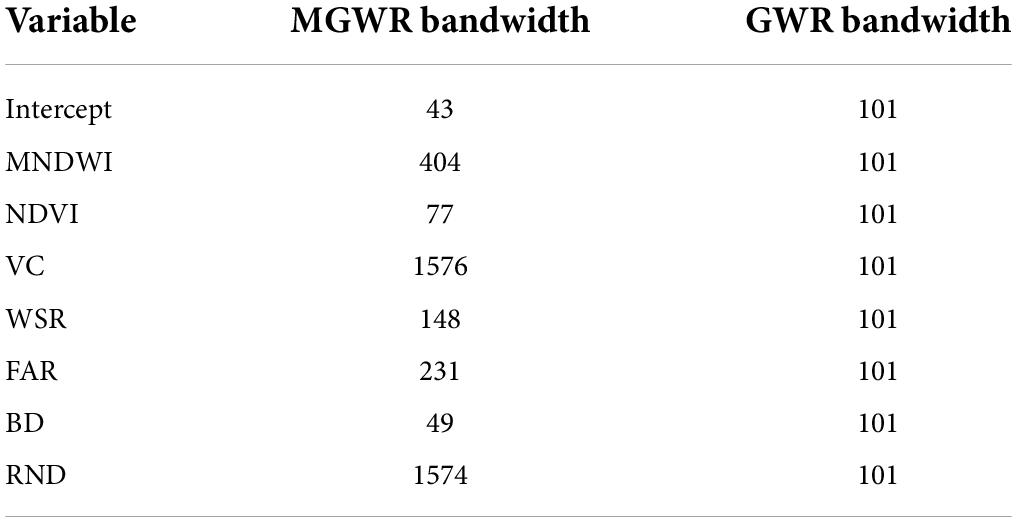
Table 5. Comparison of bandwidth of classical geographically weighted regression (GWR) and multiscale geographically weighted regression (MGWR).
1. Intercept, BD, and NDVI are close in bandwidth: 43, 49, and 77, respectively, far smaller than other variables, accounting for about 2.9, 2.9, and 4.9% of the total sample size, and covering 78, 78, and 130.7 km2 of the study area, close to the street scale. When exceeding the function range, the regression coefficient alters dramatically. It proves that the thermal environment is very sensitive to the growth of vegetation and the distribution of buildings on streets, so it is more effective to control the BD than to improve the cooling effect of greening (Han et al., 2016);
2. WSR and FAR are basically the same in bandwidth:148 and 231. This study selected a scale similar to the community scale in China’s administrative division—different communities have large spatial heterogeneity between WSR and land development intensity. The function scale of MNDWI is 404, accounting for 25.6% of the total sample size, with great spatial heterogeneity. After exceeding the function range, the fitting effect changes considerably.
3. The bandwidths of FVC and RND are close to the total sample size, almost equal to that of global variables—stable in spatial influence without spatial heterogeneity.
Compared with the classical GWR, MGWR produces more accurate and actual regression results, revealing the spatial scale of driving factors, and directly affecting the spatial distribution of emotional health risk patterns.
Due to the different heterogeneity and scale of different influencing factors, that is, within a certain range, the effect size is similar, but beyond this range, the effect size is significantly different. From Figure 7, it can be seen that the risk pattern of irritability in Beijing in 2015 had an obvious circle structure, which was expressed as follows: the center was high, the periphery was low, the southwest was high, and the northeast was low. The high-risk areas were mainly located in the city center, the West Fourth Ring Road, and along the expressway. Descriptive statistics of each coefficient are shown in Table 6. The degree of influence on irritability is WSR > NDVI > BD > MNDWI > RND > intercept > FVC > FAR. In particular, intercept, NDVI, BD, and FAR showed great difference in the spatial distribution of influence (see Figure 8).
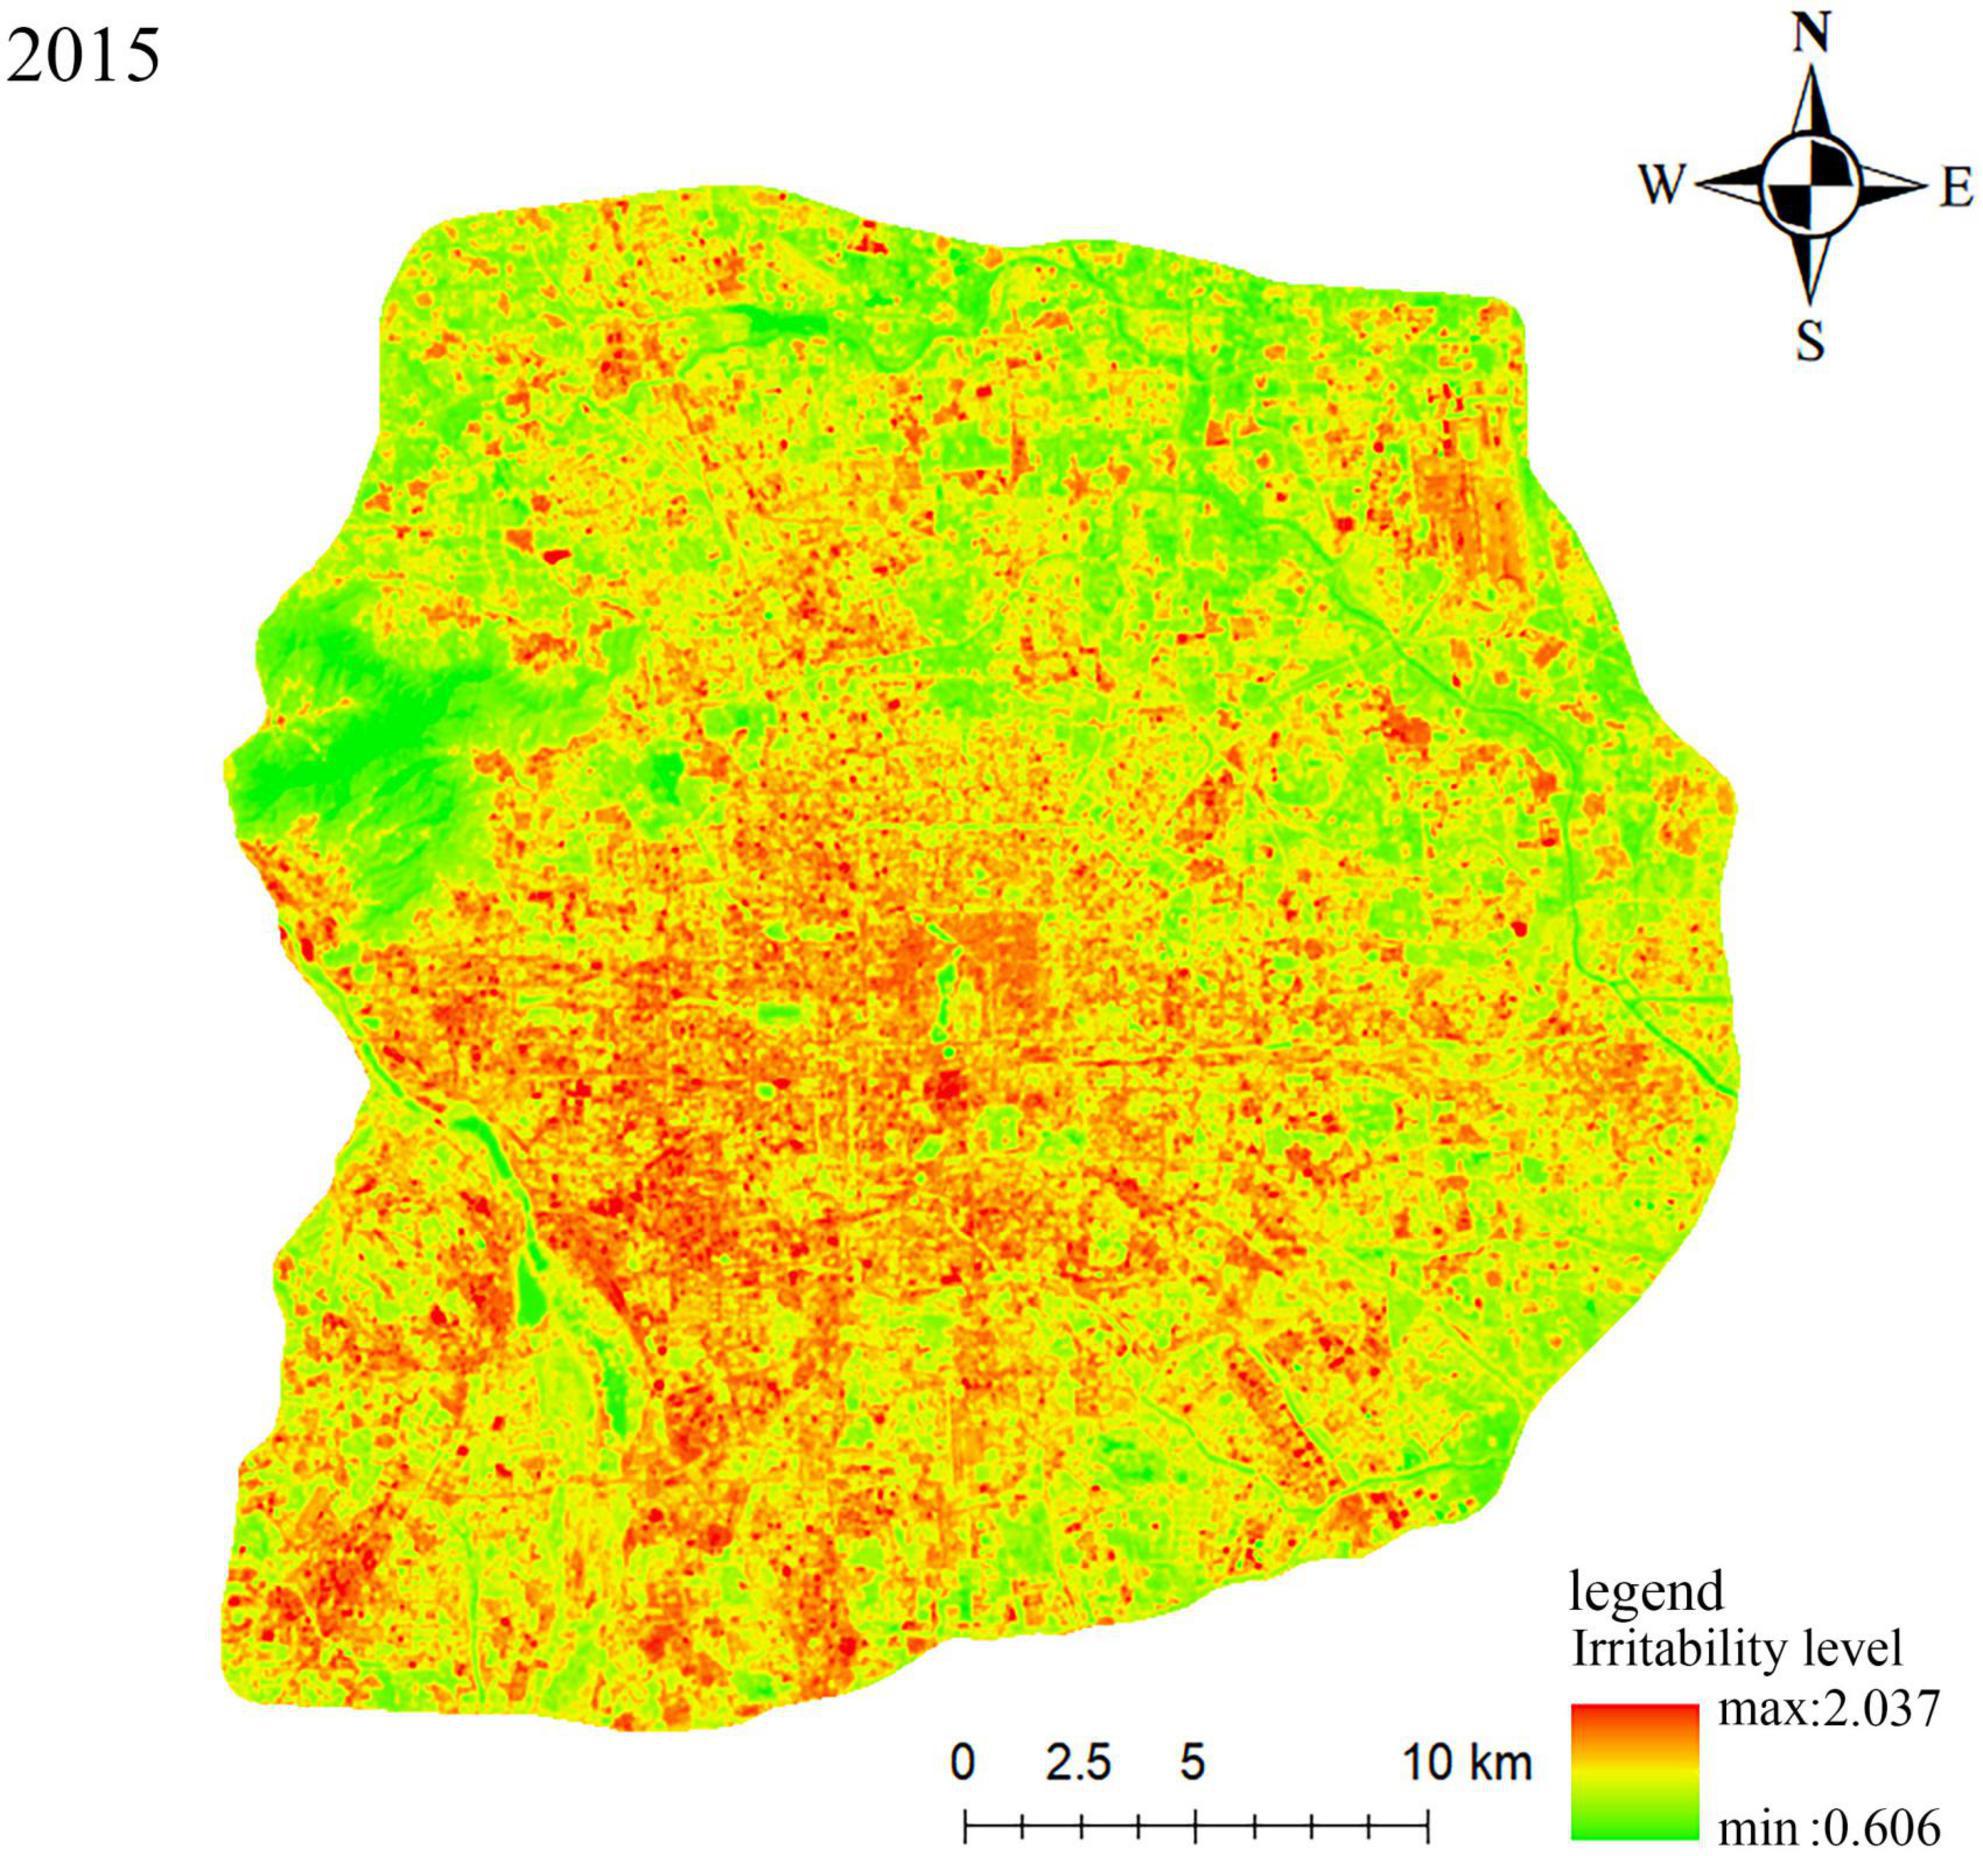
Figure 7. Risk pattern of irritability in the Sixth Ring Road in 2015.
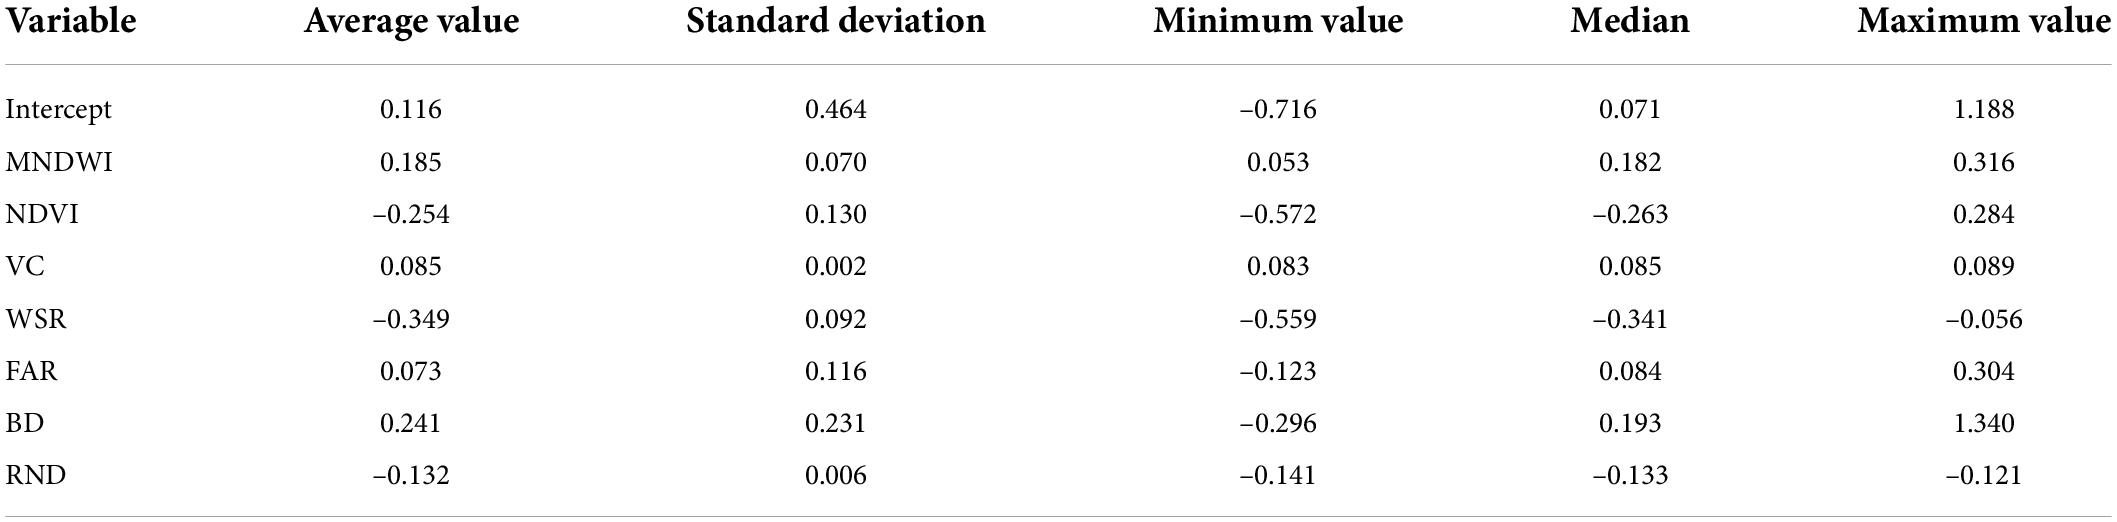
Table 6. Results of multiscale geographically weighted regression (MGWR) model operations.
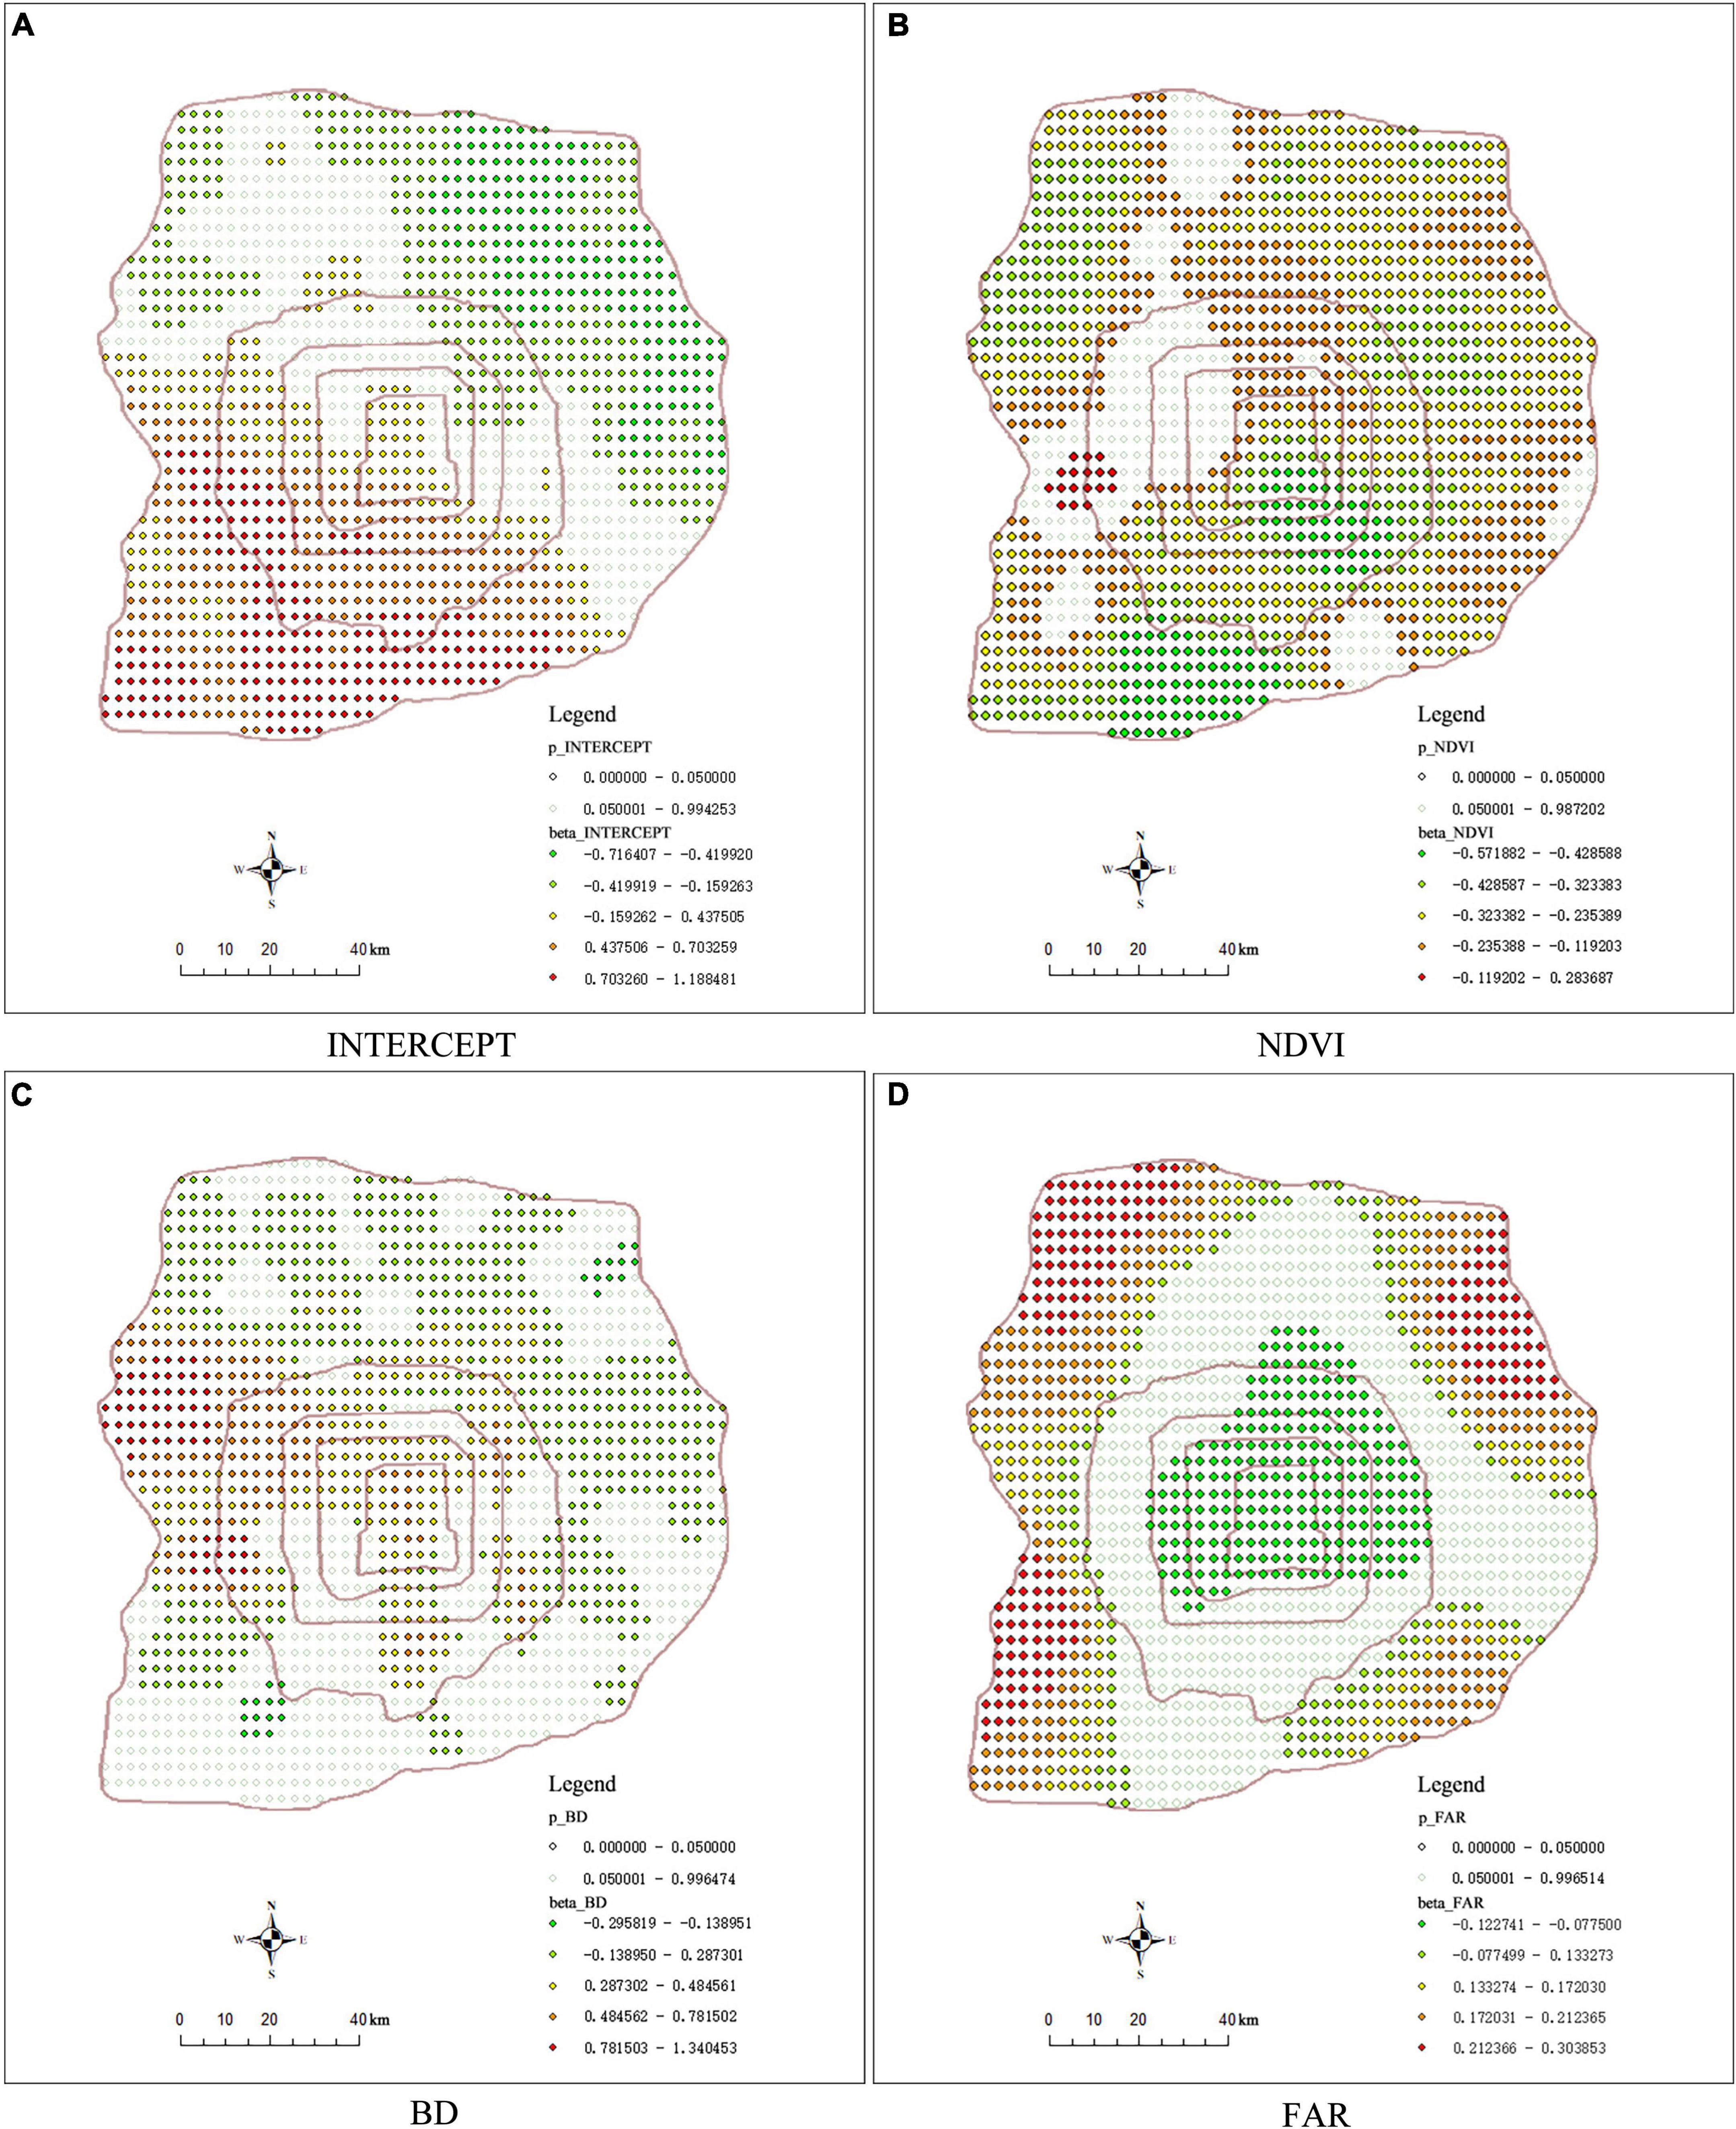
Figure 8. Spatial patterns of coefficients in the MGWR.
As shown in Figure 8A, the positive influence area is mainly concentrated in the southwestern part between the Second and Fifth Ring Roads, basically overlapping with the area of high irritability value. The intercept value ranges from –0.716 to 1.188, with an average value of 0.116, indicating that when the irritability value ranges from –0.716 to 1.188 per kilometer within the Sixth Ring Road, the influence of intercept on irritability is significantly different.
The negative ratio reaches 96.1%, critical in alleviating the thermal environment. The coefficient ranges from –0.572 to 0.284, with an average value of –0.254 and a standard deviation of 0.13, indicating that as NDVI increases by every unit, the average irritability value decreases by 0.254, and the area with the strongest negative effect can be reduced by 0.572. As shown in Figure 8B, the positive influence areas of NDVI are scattered in Haidian District and the boundary of the Eastern Fifth Ring Road. In contrast, the negative influence areas are scattered everywhere as a large mitigation matrix.
There is a circle structure similar to the irritability risk map. The value ranges from –0.296 to 1.340, with an average value of 0.241, a standard deviation of 0.231, and a positive ratio of 87.5. BD has an overall positive effect on irritability, and the area with the most substantial positive impact can increase the irritability value by 1.340 per unit. As shown in Figure 8C, the negative influence area is radially distributed between the Fourth and Fifth Ring Roads, with weak thermal effect; The positive value areas are mainly distributed in the south of Haidian District, north of Fengtai District, Dongcheng District, Xicheng District, and Shijingshan District, with dense building layout, large floor area, and strong thermal effect.
Floor area ratio yields a significant influence on irritability in the city and the outskirts, showing a trend of spreading outward from the center. The coefficient value ranges from –0.123 to 0.304, with an average value of 0.073. As shown in Figure 8D, the negative influence area of FAR is mainly concentrated in the city center, probably because of the large shadow area and low ground heat.
First, different from other scholars’ researches that focus on exploring the relationship between temperature and the morbidity and mortality of residents’ physical or psychological diseases (Petitti et al., 2016; Ebi et al., 2021; Yang et al., 2021), this study focuses on the emotional health of the general population, especially the middle-aged and elderly, in an innovative way. The quantitative relationship between temperature and irritability was established, and based on this, the impact of urban high temperature on irritability was divided into 10 grades. Using the established irritability risk evaluation criteria, this manuscript analyzed the temporal and spatial pattern of irritable emotions in Beijing from 09:00 to 20:00 in summer. Consistent with the inverted “U-shaped” relationship between temperature and mental health (Mullins and White, 2019), there is a similar relationship between irritability and time (Figure 9). The difference is that this relationship further reflects the tolerance of the human body to high temperature in the environment and the time law of the emotional regulation mechanism, which provides an idea for further research on the impact of high temperature and human emotional health in the future. However, the impact of high temperature on human emotional health is the combined result of many factors. This manuscript ignored the influence of the subjects’ own mental health level, education level, family status, economic status, race, etc., (Abbasi et al., 2019; Chang and Kajackaite, 2019) on their emotional status, as well as the interference of other environmental factors such as humidity and wind speed, resulting in biases in the validity and accuracy of the data.
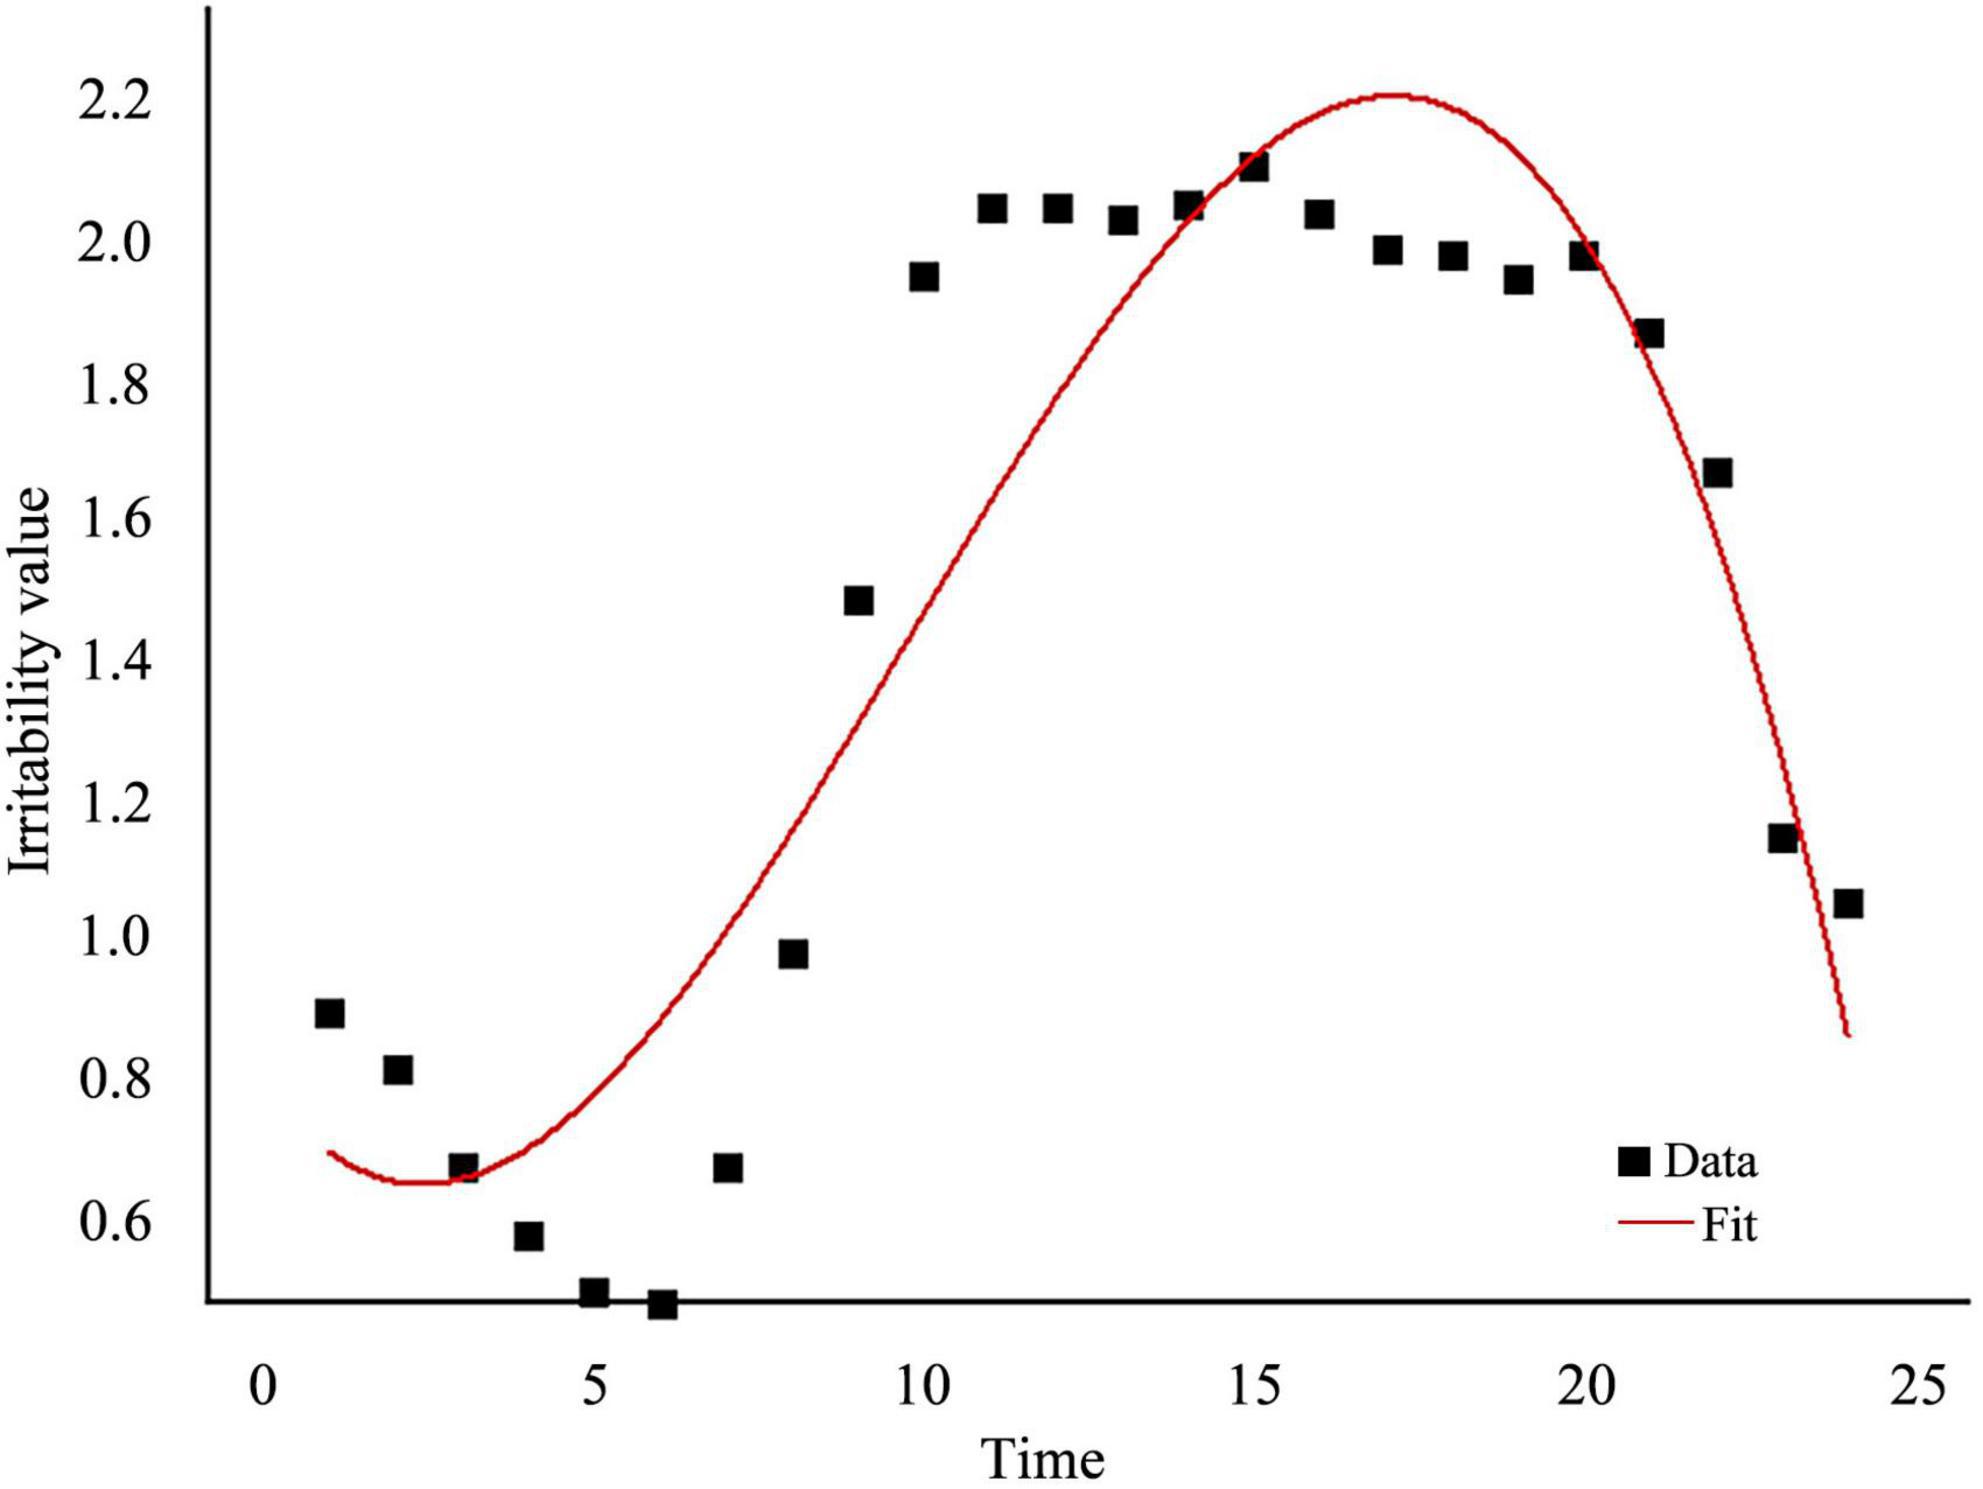
Figure 9. Irritability curve over time.
Second, this manuscript also used MGWR to analyze the mechanism of high temperature on irritability, which is more conducive to the regulation of surface indicators in local high temperature areas and effectively reduces the risk of emotional health. Although they are not the same as the indicators selected for the thermal environment correlation research in recent years, they have obtained similar research results (Chen and Deng, 2021; Li et al., 2021). Yet, this paper only revealed the differential effect of a single land use type on temperature and irritability, but lacked the analysis of the joint effect of multiple land use types, and the effects of non-land-use type-related indicators such as regional climate, socio-demographics, local plant characteristics, albedo, and other environmental conditions were also ignored. For the analysis results, the increase of NDVI, WSR, and RND can alleviate irritability, but according to Li et al. (2011), the interspacing of urban green into other land use types seems to have a greater effect on mitigating the UHI effect than a large green area itself. Comparably, Dugord et al. (2014) found that forested green areas contribute better to thermal reduction when patches are more complex in shape and more distributed in space. Moreover, urban microclimate has prominent scale characteristics. MNDWI, NDVI, and other indicators would be quickly captured by satellite thermal sensors in a smaller spatial resolution, while the influence of human living, transportation, and commercial activities on the temperature field is difficult to be captured accurately (Huang et al., 2020b). The small sample size used for the MGWR model operation limits the statistical power, so that the analysis on the influence mechanism of thermal environment on irritability is imperfect, and open street maps and points of interest should be included in the future (Chen et al., 2022).
Based on the summer high-temperature measurement and emotional health survey in Beijing, ArcGIS, MATLAB, GraphPad and other platforms were used for data processing to construct a relationship model between temperature and irritability, and to evaluate the time-space relationship between hourly temperature in summer and residents’ irritability; the differential action scale and spatial action characteristics of high temperature driving factors on irritability risk were analyzed through the MGWR model. The conclusions are as follows:
1. During 09:00–20:00 in summer, irritability level increased then decreased. From 09:00 to 15:00, irritability value rocketed; From 15:00 to 20:00, irritability value declined slowly. Irritability reached the peak of Level 8 at 15:00. The influence pattern of high temperature on irritability showed a trend of “aggregation-fragmentation-aggregation”.
2. Irritability is very sensitive to intercept and BD, with high spatial heterogeneity, close to the street scale. VC and RND are global variables without spatial heterogeneity. Other variables all have spatial heterogeneity (sorted by scale: NDVI < WSR < FAR < MNDWI).
3. The risk pattern of irritability in Beijing in 2015 had an obvious circle structure, which was expressed as follows: the center was high, the periphery was low, the southwest was high, and the northeast was low. The high-risk areas were mainly located in the city center, the West Fourth Ring Road, and along the expressway. NDVI, WSR, and RND have a negative impact on irritability, while intercept, MNDWI, VC, FAR, and BD have a positive effect on irritability. The degree of influence on irritability is WSR > NDVI > BD > MNDWI > RND > intercept > VC > FAR.
4. Compared with GWR, MGWR can avoid the noise and error caused by single-scale research methods, and can get more precise regression results with fewer parameters. It can be used for spatial analysis on a refined scale, serving as an excellent fitting model to study urban thermal environment, and providing a method for studying the spatial variation characteristics of other driving forces.
5. In future construction, green space and water bodies should be planned and laid out in areas with more land use types and more complex patches; building density and floor area ratio in high-risk areas of irritability should be controlled to maintain the cooling capacity of the water body, and at the same time, the density of the road network should be appropriately added to maximize the reduction of heat, to reduce the risk of emotional health.
Current research suggests that high temperatures in the context of global heating pose significant risks to the emotional health of the general population, and the magnitude of future risks will depend largely on planning and mitigation measures. Existing mental health resources are mostly concentrated on people with mental illnesses. For the general population and vulnerable groups with multiple physical comorbidities, it is suggested to identify areas where temperature-related emotional health risks are particularly increased, and clinically improve physical health may relieve heat stress. In the future, we will combine the regional changes of negative emotional risk in different years and the degree and scale of the effects of more high temperature drivers on emotional health risk to conduct regional emotional health risk assessment, providing reference for formulating regional planning and design strategies to reduce emotional health risk. Furthermore, temperature in different urban functional areas differs greatly—the average temperature difference between the center and the surrounding areas of Beijing can reach 268.6°C (Zhang et al., 2002). The complexity of the internal structure of human settlements should also be considered. To be specific, the local climate zone (LCZ) divides a city into built environment and natural environment, thus generating a classification system suitable for studying the thermal field changes in human settlements (Stewart and Oke, 2012; Yang et al., 2020). Therefore, this study will combine LCZ, crowd characteristics, and emotional health in the future, to make clear of how different climate layouts influence emotional health.
The datasets for this study can be found the official website of NASA’s landsat satellite (https://landsat.gsfc.nasa.gov/).
HH: conceptualization, methodology, data curation, formal analysis, writing—original draft preparation, review and editing, investigation, and visualization. XL: methodology, data curation, formal analysis, writing—original draft preparation, review and editing, investigation, and visualization. LR: conceptualization. All authors contributed critically to the manuscript and agreed to publication.
This work was supported by National Natural Science Foundation of China (NSFC), grant number 31971717 and Top-notch Academic Programs Project of Jiangsu, grant number PPZY2015A063.
We sincerely acknowledge Hao Cui for data provision and Yimin Zhao, Yang Li, and Shuying Zhang’s help for investigation.
The authors declare that the research was conducted in the absence of any commercial or financial relationships that could be construed as a potential conflict of interest.
All claims expressed in this article are solely those of the authors and do not necessarily represent those of their affiliated organizations, or those of the publisher, the editors and the reviewers. Any product that may be evaluated in this article, or claim that may be made by its manufacturer, is not guaranteed or endorsed by the publisher.
Abbasi, A. M., Motamedzade, M., Aliabadi, M., Golmohammadi, R., and Tapak, L. (2019). The impact of indoor air temperature on the executive functions of human brain and the physiological responses of body. Health Promot. Perspect. 9:55. doi: 10.15171/hpp.2019.07
Bao, L., Zhan, G., Li, C., and Wang, Y. (2020). Reliability and validity of the Chinese version of the positive negative emotion scale in the elderly. China J. Health Psychol. 28, 617–621. doi: 10.13342/j.cnki.cjhp.2020.04.029
Bielby, P. (2019). Not ‘us’ and ‘them’: towards a normative legal theory of mental health vulnerability. Int. J. Law Context 15, 51–67. doi: 10.1017/S1744552318000149
Burke, M., González, F., Baylis, P., Heft-Neal, S., Baysan, C., Basu, S., et al. (2018). Higher temperatures increase suicide rates in the United States and Mexico. Nat. Climate Change 8, 723–729. doi: 10.1038/s41558-018-0222-x
Chang, T. Y., and Kajackaite, A. (2019). Battle for the thermostat: Gender and the effect of temperature on cognitive performance. PLoS One 14:e0216362. doi: 10.1371/journal.pone.0216362
Chen, Y., Yang, J., Yang, R., Xiao, X., and Xia, J. C. (2022). Contribution of urban functional zones to the spatial distribution of urban thermal environment. Build. Environ. 216:109000. doi: 10.1016/j.buildenv.2022.109000
Chen, Z., and Deng, Z. (2021). Research on the relationship between block morphology and heat island intensity in Guangzhou’s main urban area based on multi-scale geographically weighted regression. Intellig. Build. Smart City 10, 13–17. doi: 10.13655/j.cnki.ibci.2021.10.003
Denissen, J. J. A., Butalid, L., Penke, L., and van Aken, M. A. G. (2008). The effects of weather on daily mood: a multilevel approach. Emotion 8, 662–667. doi: 10.1037/a0013497
Ding, N., Berry, H. L., and Bennett, C. M. (2016). The importance of humidity in the relationship between heat and population mental health: evidence from Australia. PLoS One 11:e0164190. doi: 10.1371/journal.pone.0164190
Dugord, P. A., Lauf, S., Schuster, C., and Kleinschmit, B. (2014). Land use patterns, temperature distribution, and potential heat stress risk–the case study Berlin, Germany. Comput. Environ. Urban Syst. 48, 86–98. doi: 10.1016/j.compenvurbsys.2014.07.005
Ebi, K. L., Capon, A., Berry, P., BR257oderick, C., de Dear, R., Havenith, G., et al. (2021). Hot weather and heat extremes: Health risks. Lancet 398, 698–708. doi: 10.1016/S0140-6736(21)01208-3
Estoque, R. C., Murayama, Y., and Myint, S. W. (2017). Effects of landscape composition and pattern on land surface temperature: an urban heat island study in the megacities of Southeast Asia. Sci. Total Environ. 577, 349–359. doi: 10.1016/j.scitotenv.2016.10.195
Fotheringham, A. S., Yang, W., and Kang, W. (2017). Multiscale geographically weighted regression (MGWR). Ann. Am. Assoc. Geogr. 107, 1247–1265. doi: 10.1080/24694452.2017.1352480
Fritze, J. G., Blashki, G. A., Burke, S., and Wiseman, J. (2008). Hope, despair and transformation: climate change and the promotion of mental health and wellbeing. Int. J. Ment. Health Syst. 2, 1–10. doi: 10.1186/1752-4458-2-13
Gill, S. E., Handley, J. F., Ennos, A. R., and Pauleit, S. (2007). Adapting cities for climate change: the role of the green infrastructure. Built Environ. 33, 115–133. doi: 10.2148/benv.33.1.115
Gunawardena, K. R., Wells, M. J., and Kershaw, T. (2017). Utilising green and bluespace to mitigate urban heat island intensity. Sci. Total Environ. 584, 1040–1055. doi: 10.1016/j.scitotenv.2017.01.158
Guo, Y., Gasparrini, A., Li, S., Sera, F., Vicedo-Cabrera, A. M., de Sousa Zanotti Stagliorio Coelho, M., et al. (2018). Quantifying excess deaths related to heatwaves under climate change scenarios: A multicountry time series modelling study. PLoS Med. 15:e1002629. doi: 10.1371/journal.pmed.1002629
Hames, E., Stoler, J., Emrich, C. T., Tewary, S., and Pandya, N. (2016). A GIS approach to identifying socially and medically vulnerable older adult populations in south florida. Gerontologist 57, 1133–1141. doi: 10.1093/geront/gnw106
Han, G., Cai, Z., Xie, Y., and Zeng, W. (2016). Correlation between urban construction and urban heat island:A case study in Kaizhou District, Chongqing. J. Civil Environ. Eng. 38, 138–147. doi: 10.11835/j.issn.1674-4764.2016.05.018
Hansen, A., Bi, P., Nitschke, M., Ryan, P., Pisaniello, D., and Tucker, G. (2008). The effect of heat waves on mental health in a temperate Australian city. Environ. Health Perspect. 116, 1369–1375. doi: 10.1289/ehp.11339
Hayes, K., and Poland, B. (2018). Addressing mental health in a changing climate: incorporating mental health indicators into climate change and health vulnerability and adaptation assessments. Int. J. Environ. Res. Public Health 15:1806. doi: 10.3390/ijerph15091806
Huang, H., Deng, X., Yang, H., and Li, S. (2020a). Spatial evolution of the effects of urban heat island on residents’ health. Tehnièki Vjesnik 27, 1427–1435. doi: 10.17559/TV-20200503211912
Huang, H., Yang, H., Deng, X., Hao, C., Liu, Z., Liu, W., et al. (2020b). Analyzing the influencing factors of urban thermal field intensity using big-data-based GIS. Sustain. Cities Soc. 55:102024. doi: 10.1016/j.scs.2020.102024
Huang, L., Yang, T., and Li, Z. (2003). Applicability of the positive and negative affect scale in Chinese. Chinese Ment. Health J. 01, 54–56. doi: 10.3321/j.issn:1000-6729.2003.01.018
Li, B., Xing, H., and Liu, Y. (2021). Analysis of the relationship between urban landscape and thermal environment based on MGWR model. J. Xian Univ. Technol. 37, 517–525. doi: 10.19322/j.cnki.issn.1006-4710.2021.04.008
Li, J., Song, C., Cao, L., Zhu, F., Meng, X., and Wu, J. (2011). Impacts of landscape structure on surface urban heat islands: A case study of Shanghai, China. Remote Sens. Environ. 115, 3249–3263. doi: 10.1016/j.rse.2011.07.008
Li, J., Xu, X., Yang, J., Liu, Z., Xu, L., Gao, J., et al. (2017). Ambient high temperature and mortality in Jinan, China: a study of heat thresholds and vulnerable populations. Environ. Res. 156, 657–664. doi: 10.1016/j.envres.2017.04.020
Liu, H., and Weng, Q. (2008). Seasonal variations in the relationship between landscape pattern and land surface temperature in Indianapolis, USA. Environ. Monit. Assess. 144, 199–219. doi: 10.1007/s10661-007-9979-5
Liu, H., Zhan, Q., Gao, S., and Yang, C. (2019). Seasonal variation of the spatially non-stationary association between land surface temperature and urban landscape. Remote Sens. 11:1016. doi: 10.3390/rs11091016
Liu, X., Zhang, Y., Shan, X., Zhang, J., and Jiang, B. (2012). Association between heat waves and daily hospital visits for mental illness in Ji’nan: A case-crossover study. J. Environ. Health 29, 166–170. doi: 10.16241/j.cnki.1001-5914.2012.02.027
Manning, C., and Clayton, S. (2018). “Threats to mental health and wellbeing associated with climate change,” in Psychology and Climate Change, eds S. Clayton and C. Manning (Cambridge, MA: Academic Press), 217–244.
Mao, C., Zhang, M., Liu, Y., Zhang, L., and Xiao, G. (2021). Analysis of urban heat island in yichang based on automatic weather station data. Desert Oasis Meteorol. 15, 103–110. doi: 10.12057/j.issn.1002-0799.2021.01.014
McMichael, A. (2017). Climate Change and the Health of Nations: Famines, Fevers, and the Fate of Populations. Oxford: Oxford University Press.
Mullins, J. T., and White, C. (2019). Temperature and mental health: Evidence from the spectrum of mental health outcomes. J. Health Econ. 68:102240. doi: 10.1016/j.jhealeco.2019.102240
Nitschke, M., Tucker, G. R., Hansen, A. L., Williams, S., Zhang, Y., and Bi, P. (2011). Impact of two recent extreme heat episodes on morbidity and mortality in Adelaide, South Australia: A case-series analysis. Environ. Health 10, 1–9. doi: 10.1186/1476-069X-10-42
Noelke, C., McGovern, M., Corsi, D. J., Jimenez, M. P., Stern, A., Wing, I. S., et al. (2016). Increasing ambient temperature reduces emotional well-being. Environ. Res. 151, 124–129. doi: 10.1016/j.envres.2016.06.045
Oshan, T. M., Li, Z., Kang, W., Wolf, L. J., and Fotheringham, A. S. (2019). mgwr: a Python implementation of multiscale geographically weighted regression for investigating process spatial heterogeneity and scale. ISPRS Int. J. Geo Inform. 8:269. doi: 10.3390/ijgi8060269
Parker, G., Lie, D., Siskind, D. J., Martin-Khan, M., Raphael, B., Crompton, D., et al. (2016). Mental health implications for older adults after natural disasters–a systematic review and meta-analysis. Int. Psychogeriatr. 28, 11–20. doi: 10.1017/S1041610215001210
Peng, S., Piao, S., Ciais, P., Friedlingstein, P., Ottle, C., Breìon, F. M., et al. (2012). Surface urban heat island across 419 global big cities. Environ. Sci. Technol. 46, 696–703. doi: 10.1021/es2030438
Peng, Z., Wang, Q., Kan, H., Chen, R., and Wang, W. (2017). Effects of ambient temperature on daily hospital admissions for mental disorders in Shanghai, China: A time-series analysis. Sci. Total Environ. 590, 281–286. doi: 10.1016/j.scitotenv.2017.02.237
Petitti, D. B., Hondula, D. M., Yang, S., Harlan, S. L., and Chowell, G. (2016). Multiple trigger points for quantifying heat-health impacts: New evidence from a hot climate. Environ. Health Perspect. 124, 176–183. doi: 10.1289/ehp.1409119
Qi, X., Hu, W. B., Page, A., and Tong, S. L. (2015). Associations between climate variability, unemployment and suicide in Australia: a multicity study. BMC Psychiatry 15:114. doi: 10.1186/s12888-015-0496-8
Ren, G., Chu, Z., Zhou, Y., Xu, M., Wang, Y., Tang, G., et al. (2005). Recent progresses in studies of regional temperature changes in China. Clim. Environ. Res. 10, 701–716. doi: 10.3969/j.issn.1006-9585.2005.04.001
Shen, T. Y., Yu, H. C., Zhou, L., Gu, H., and He, H. (2020). On hedonic price of second-hand houses in Beijing based on multi-scale geographically weighted regression: scale law of spatial heterogeneity. Econ. Geogr. 40, 75–83. doi: 10.15957/j.cnki.jjdl.2020.03.001
Shen, Z. P., Liang, P., and He, J. H. (2017). Analysis on the climatic characteristics of the fine structure of the urban heat island in Shanghai. Trans. Atmos. Sci. 40, 369–378. doi: 10.13878/j.cnki.dqkxxb.20160922001
Simpson, J. A., and Weiner, E. S. C. (1993). Oxford English Dictionary–1989. Oxford: Oxford University Press.
Stewart, I. D., and Oke, T. R. (2012). Local climate zones for urban temperature studies. Bull. Am. Meteorol. Soc. 93, 1879–1900. doi: 10.1175/BAMS-D-11-00019.1
Tan, Z., Li, W., Xu, B., Chen, Z., and Liu, J. (2004). The estimation of land surface emissivity for landsat TM6. Remote Sens. Land Resour. 28-32, 36–41. doi: 10.3969/j.issn.1001-070X.2004.03.007
Thompson, R., Hornigold, R., Page, L., and Waite, T. (2018). Associations between high ambient temperatures and heat waves with mental health outcomes: A systematic review. Public Health 161, 171–191. doi: 10.1016/j.puhe.2018.06.008
Vanos, J. K., Warland, J. S., Gillespie, T. J., and Kenny, N. A. (2012). Thermal comfort modelling of body temperature and psychological variations of a human exercising in an outdoor environment. Int. J. Biometeorol. 56, 21–32. doi: 10.1007/s00484-010-0393-2
Xu, H. (2006). Modification of normalised difference water index (NDWI) to enhance open water features in remotely sensed imagery. Int. J. Remote Sens. 27, 3025–3033. doi: 10.1080/01431160600589179
Xu, Q., Xu, Z., and Sun, C. (2021). Evaluation schoolyard wind comfort changes due to rapid developments: Case study of Nanjing, China. Atmosphere 13:43. doi: 10.3390/atmos13010043
Xue, Z., Hou, G., Zhang, Z., Lyu, X., Jiang, M., Zou, Y., et al. (2019). Quantifying the cooling-effects of urban and peri-urban wetlands using remote sensing data: case study of cities of Northeast China. Landsc. Urban Plann. 182, 92–100. doi: 10.1016/j.landurbplan.2018.10.015
Yang, B., Yang, X., Leung, L., Zhong, S., Qian, Y., Zhao, C., et al. (2019). Modeling the impacts of urbanization on summer thermal comfort: the role of urban land use and anthropogenic heat. J. Geophys. Res. Atmos. 124, 6681–6697. doi: 10.1029/2018JD029829
Yang, J., Wang, Y., Xiu, C., Xiao, X., Xia, J., and Jin, C. (2020). Optimizing local climate zones to mitigate urban heat island effect in human settlements. J. Clean. Product. 275:123767. doi: 10.1016/j.jclepro.2020.123767
Yang, J., Zhou, M., Ren, Z., Li, M., Wang, B., Liu, D. L., et al. (2021). Projecting heat-related excess mortality under climate change scenarios in China. Nat. Commun. 12, 1–11. doi: 10.1038/s41467-021-21305-1
Yao, L., Xu, Y., and Zhang, B. (2019). Effect of urban function and landscape structure on the urban heat island phenomenon in Beijing, China. Landsc. Ecol. Eng. 15, 379–390. doi: 10.1007/s11355-019-00388-5
Yin, P., Chen, R., Wang, L., Liu, C., Niu, Y., Wang, W., et al. (2018). The added effects of heatwaves on cause-specific mortality: A nationwide analysis in 272 Chinese cities. Environ. Int. 121, 898–905. doi: 10.1016/j.envint.2018.10.016
Yin, S., Gong, Z., Gu, L., Deng, Y., and Niu, Y. (2022). Driving forces of the efficiency of forest carbon sequestration production: spatial panel data from the national forest inventory in China. J. Clean. Product. 330:129776. doi: 10.1016/j.jclepro.2021.129776
Yu, H., Fotheringham, A. S., Li, Z., Oshan, T., Kang, W., and Wolf, L. J. (2020). Inference in multiscale geographically weighted regression. Geogr. Anal. 52, 87–106. doi: 10.1111/gean.12189
Yue, H., and Liu, Y. (2018). Comparison and analysis of land surface temperature retrieval algorithms based on Landsat 8 TIRS. Sci. Technol. Eng. 18, 200–205. doi: 10.3969/j.issn.1671-1815.2018.20.028
Yue, W., Qiu, S., Xu, H., Xu, L., and Zhang, L. (2019). Polycentric urban development and urban thermal environment: a case of Hangzhou, China. Landsc. Urban Plann. 189, 58–70. doi: 10.1016/j.landurbplan.2019.04.008
Keywords: influencing factors of thermal environment, hourly temperature, emotional health, irritability, multiscale geographically weighted regression, Beijing
Citation: Huang H, Liu X and Ren L (2022) Analysis of the spatiotemporal mechanism of high temperature on residents’ irritability in Beijing based on multiscale geographically weighted regression model. Front. Ecol. Evol. 10:973365. doi: 10.3389/fevo.2022.973365
Received: 20 June 2022; Accepted: 26 July 2022;
Published: 22 August 2022.
Edited by:
Jun Yang, Northeastern University, ChinaReviewed by:
Shaohua Wang, Aerospace Information Research Institute (CAS), ChinaCopyright © 2022 Huang, Liu and Ren. This is an open-access article distributed under the terms of the Creative Commons Attribution License (CC BY). The use, distribution or reproduction in other forums is permitted, provided the original author(s) and the copyright owner(s) are credited and that the original publication in this journal is cited, in accordance with accepted academic practice. No use, distribution or reproduction is permitted which does not comply with these terms.
*Correspondence: Lijian Ren, cmVubGlqaWFuQDEyNi5jb20=
†These authors have contributed equally to this work and share first authorship
Disclaimer: All claims expressed in this article are solely those of the authors and do not necessarily represent those of their affiliated organizations, or those of the publisher, the editors and the reviewers. Any product that may be evaluated in this article or claim that may be made by its manufacturer is not guaranteed or endorsed by the publisher.
Research integrity at Frontiers
Learn more about the work of our research integrity team to safeguard the quality of each article we publish.