- College of Geodesy and Geomatics, Shandong University of Science and Technology, Qingdao, China
Wetlands in estuary deltas functionally protect biodiversity, store water, and regulate ecological balance. However, wetland monitoring accuracy is low when using only synthetic aperture radar (SAR) images or optical images. This study proposes a novel method for extracting ground objects in a wetland using principal component analysis (PCA) and random forest (RF) classification, which combines the features of fully polarimetric SAR images and optical images. Firstly, polarization decomposition features and texture features were extracted based on polarimetric SAR data, and spectral features were extracted based on optical data. Secondly, the optical image was registered to SAR image. Then PCA was performed on the nine polarimetric features of the SAR images and the four spectral features of the optical images to obtain the first two principal components of each. After combining these components, a RF classification algorithm was used to extract the objects. The objects in the Yellow River Delta wetland were successfully extracted using our proposed method with Gaofen-3 fully polarimetric SAR data and Sentinel-2A optical data acquired in November 2018. The overall accuracy of the proposed method was 86.18%, and the Kappa coefficient was 0.84. This was an improvement of 18.96% and 0.22, respectively, over the GF-3 polarimetric features classification, and 11.02% and 0.13, respectively, over the Sentinel-2A spectral features classification. Compared with the results of the support vector machine, maximum likelihood, and minimum distance classification algorithms, the overall accuracy of the RF classification based on joint features was 2.03, 5.69, and 23.36% higher, respectively, and the Kappa coefficient was 0.03, 0.07, and 0.27 higher, respectively. Therefore, this novel method can increase the accuracy of the extraction of objects in a wetland, providing a reliable technical means for wetland monitoring.
Introduction
Wetlands are an important part of the ecosystem in estuary deltas. They not only have rich biodiversity and extremely high productivity, but also play an irreplaceable role in purifying the environment, regulating climate, conserving water sources, protecting biodiversity, and providing humans with land, tourism, and natural resources (Delgado and Marín, 2013). In China, the Yellow River Delta is the second largest estuary delta after the Yangtze River Delta and the youngest wetland ecosystem in the warm temperate zone (Kong et al., 2015; Cong et al., 2019). The Yellow River Delta wetland provides environmental, cultural, and economic value. However, in recent years, due to the influence of human activities, industrial development, invasive species (Spartina alterniflora), and other factors, the wetland has suffered significant damage and degradation. Therefore, it is important to monitor and protect the Yellow River Delta wetland.
Recently, many experts and scholars have used multisource remote sensing images and various classification methods to monitor wetlands with varying results (Mahdavi et al., 2018). Among these methods, optical remote sensing has provided an important data source. Using Landsat data of 20 scenes from 1976 to 2000, Chu et al. (2006) examined the changing pattern of accretion and erosion of the modern Yellow River subaerial delta. Feng et al. (2015) utilized the spectral and texture features of Landsat images to study the cropland dynamics of the Yellow River Delta during the last three decades. Liu et al. (2016) proposed a method that combined multiple end-member spectral mixture analysis and a random forest (RF) to map the land cover in the Yellow River Delta wetland using Landsat-8 images. Mao et al. (2016) reconstructed wetland ecosystem patterns using Landsat and Chinese HJ satellite images and investigated the dynamics of the spatial characteristics and heterogeneity of natural and human-made wetlands in Northeast China. Zhang L. et al. (2019) extracted and selected features based on Sentinel-2 data, and then extracted wetland information for the Yellow River Delta using an RF algorithm. Wang et al. (2019) classified land cover in the Linhong Estuary Wetland in Lianyungang using Worldview-2 and Landsat-8 images and the RF method. Geng et al. (2019) used unmanned aerial vehicle (UAV) images and an object-oriented RF algorithm to achieve high-precision classification of karst wetland vegetation in Huixian. Jia et al. (2021) used Sentinel-2 time-series images of the entire coastline of China to draw more accurate and higher spatial resolution tidal flat maps based on the GEE platform. Dang et al. (2021) used Landsat images with the aid of a hybrid classification approach to determine the long-term dynamics of wetlands in the south-west coast of the coastal wetlands in the Mekong Delta and analyze the potential factors driving these dynamics. Martínez Prentice et al. (2021) used high-resolution images obtained by multispectral cameras mounted on UAV to capture the heterogeneity of the environment in images. They compared the accuracies of two machine learning classifiers using a pixel and object analysis approach in six coastal wetland sites. It can be seen from the above literature that many scholars used Landsat images or Sentinel-2 images in optical data for wetland research. The resolution of Landsat images is low, and the ability to recognize specific objects in some wetlands is poor. Using time series Landsat or Sentinel-2 images can effectively improve the accuracy of wetland monitoring, but they also have the problem of large data volume and long calculation time. And because of the weather, it is difficult to obtain sufficient images. All these have an impact on monitoring wetland. Some scholars use UAV data for monitoring wetland, but its endurance is poor and it is difficult to monitor wetland in a larger area.
Synthetic aperture radar (SAR), with all-time and all-weather observation capabilities, also provides effective data for wetland monitoring. Du et al. (2014) proposed a new approach: Boosted Multiple-Kernel Extreme Learning Machines, and applied it to the classification of AIRSAR and EMISAR data. Experimental results indicate that the proposed technique achieves the highest classification accuracy values when dealing with multiple features, such as a combination of polarimetric coherency and multiscale spatial features. Wang et al. (2016) chose three study sites (including the Yangtze Estuary, Hangzhou Bay, and the Leizhou Peninsula) with different environmental conditions and land cover characteristics and proposed a new classification scheme for mud and sand flats on intertidal flats using fully polarimetric (SAR) data. Freeman–Durden and Cloude–Pottier polarization decomposition components as well as double bounce eigenvalue relative difference are introduced into the feature sets. Then classification is carried out using the RF. Buono et al. (2017) analyzed object types in the Yellow River Delta wetland based on Freeman–Durden decomposition and polarization scattering entropy/average scattering angle (H/α) decomposition using Radarsat-2 fully polarimetric SAR data. Using multipolarization and multifrequency SAR data, including X-band TerraSAR-X single-polarized (HH), L-band ALOS-2 dual-polarized (HH/HV), and C-band RADARSAT-2 fully polarized images, Mahdianpari et al. (2017) proposed a hierarchical, object-based RF approach for wetland classification in the northeastern portion of the Avalon Peninsula. Wei et al. (2019) extracted polarization characteristic parameters from four Gaofen-3 (GF-3) quad-polarized SAR images and classified the Longbao Plateau wetland using the maximum likelihood classification (MLC) method. Hu et al. (2021) utilized annual SAR composite features to address the seasonal variations and tidal dynamics in salt marshes, and Sentinel-1 time-series data and knowledge-based automatic decision tree classifiers to produce a 10 m resolution map of the salt marshes in the coastal zones of China. Chen et al. (2020) used ALOS-PAL SAR fully polarimetric SAR data to extract polarimetric scattering characteristics using various decomposition methods and proposed a new algorithm combining an RF with sequential forward selection to classify coastal wetlands in Jiangsu Province. Zhang X. et al. (2021) obtained SAR features based on GF-3 images, and combined RF with sequential backward selection to select the best polarization features for classification in the Yancheng Coastal Wetlands. Scholars used multipolarization and multifrequency SAR data for monitoring wetland. Because fully polarimetric data contains more ground information, when a small amount of SAR data was used for monitoring, the monitoring effect of the fully polarimetric data was better than that of the single/double polarization. However, due to the limitation of data sources, it may be difficult to obtain more fully polarimetric data. The Sentinel-1 dual polarization long time series data were often used for monitoring ground objects, which can also achieve better classification accuracy. SAR data provided a large number of data sources for monitoring wetland without the influence of weather, but its own noise also affected the accuracy of ground objects monitoring.
Optical remote sensing data contains abundant spectral information, including the reflection or emission spectra of ground objects. SAR data can penetrate ground objects to certain degrees, and contains information on the surface roughness, complex permittivity, and body structure of the objects. The combined use of SAR and optical images utilizes the advantages of both and improves the monitoring of ground objects. Zhen et al. (2018) developed a method to improve the classification of mangrove forests using Radarsat-2 quad-polarized SAR data and Landsat 8 optical data, by analyzing the spectral and backscattering signatures of the mangrove forests and using the support vector machine (SVM) classification method to classify the land cover in Dongzhaigang National Nature Reserve in Hainan. Franklin et al. (2018) used quad-polarized SAR data and Landsat 8 optical data to classify the northern swamps of Canada with pixel-based MLC and object-oriented machine learning algorithms. Gao et al. (2018) combined the intensity vector of GF-3 polarimetric SAR data with Sentinel-2A optical data, and used the SVM method to classify crops in the Dongting Lake basin. Mahdianpari et al. (2019) used multiyear summer SAR Sentinel-1 and optical Sentinel-2 data composites to identify the spatial distribution of five wetland and three non-wetland classes on the Island of Newfoundland. The classification results were evaluated using both pixel-based and object-based RF classifications implemented on the GEE platform. Li et al. (2019) used GF-3 SAR data and Sentinel-2B multispectral data to analyze the spectral, index, polarization scatter, and texture feature information of seven types of objects in the Yellow River Delta wetland, and chose the MLC, decision tree, and SVM classifier methods, which are all supervised classification methods for monitoring wetland. The results of three classification methods showed that the overall accuracy of the joint classification can reach 90.4, 95.4, and 95.7%, significantly higher than that of the individual classifications, showing the promising potential of GF-3 SAR and Sentinel-2B multispectral images in joint wetland classification. Taking the Yellow River Delta region as an example, Feng et al. (2019) proposed a multibranch convolutional neural network for the fusion of multitemporal and multisensor Sentinel data to improve classification accuracy for coastal land cover. Experimental results indicated that the proposed method showed good performance, with an overall accuracy of 93.78% and a Kappa coefficient of 0.9297. Slagter et al. (2020) used dense Sentinel-1 and Sentinel-2 data for wetland mapping in multiple levels of characterization by RF. The results for the St. Lucia wetlands in South Africa showed that combining Sentinel-1 and Sentinel-2 led to significantly higher classification accuracies than for using the systems separately. Ferrentino et al. (2020) discussed methods of coastline extraction of a wetland in the Solway Firth based on RadarSAT-2 and Sentinel-1 data. They proved that the joint combination of nonlocal speckle filters and dual-polarimetric information provided the best accuracy. In addition, larger incidence angles resulted in the best accuracy when the dual-polarization metric, augmented by a nonlocal filtering, was used. Zhang et al. (2020) studied the karst mountain in Chongqing using features of the spectrum, texture, and space from optical and SAR images, supplemented by the normalized difference vegetation index, elevation, slope, and other relevant information. Furthermore, they proposed a new feature fusion framework to conduct land cover classification experiments. Hosseiny et al. (2021) presented a WetNet model for classifying wetland areas using time series of Sentinel-1 and Sentinel-2 data. Experimental results indicate that WetNet outperforms the state-of-the-art deep models (e.g., InceptionResnetV2, InceptionV3, and DenseNet121) in terms of both the classification accuracy and processing time. Granger et al. (2021) used advanced remote sensing methods including field-collected data, object-based image analysis of Sentinel-1, Sentinel-2, and digital elevation model Earth observation data to develop a wetland inventory of the area in Conne River. Hosseiny et al. (2021) presented a WetNet model for classifying wetland areas using time series of Sentinel-1 and Sentinel-2 data. Experimental results indicated that WetNet outperforms the state-of-the-art deep models (e.g., InceptionResnetV2, InceptionV3, and DenseNet121) in terms of both the classification accuracy and processing time. Fu et al. (2021) combined 18 multidimensional data sets based on sentinel-1 and Sentinel-2 data. The recursive feature elimination variable selection algorithm was used for variable selection and an object-based RF model was constructed to explore the impact of multitemporal active and passive data source integration on marsh vegetation classification.
Based on the above research, optical images can reflect the rich spectral information of objects. SAR is capable of imaging under all-weather conditions, such as clouds and rain; moreover, it is sensitive to soil moisture and can detect hydrological vegetation characteristics. Combining polarimetric and optical data for wetland classification fully utilizes the spectral and backscattering information of the wetland objects. Additionally, it increases the separability between the wetland objects and reduces the influence of speckle noise, making it an effective monitoring method. However, combining the two types of data results in greater redundancy, because of the large amount of data. Thus, both spectral and polarization features must be selected to reduce data redundancy and improve wetland monitoring efficiency in the Yellow River Delta. Therefore, in this paper, we proposed a new method of combining GF-3 polarimetric features and Sentinel-2A spectral features; after using principal component analysis (PCA) to select the features, an RF classification method was applied for monitoring the wetland.
The main sections of this paper are organized as follows: In section “Materials and Methods,” the study area and experimental data are introduced, including the fully polarimetric SAR data and optical remote sensing data. Additionally, it describes the novel method proposed in this paper, which is based on polarimetric SAR features extraction, spectral features extraction, PCA, and RF classification. Section “Results” presents the results of the polarization decomposition, texture features selection, PCA, and final classification maps. Section “Discussion” presents our analysis and discussion. To illustrate the effectiveness of this method in monitoring the wetland, the results of the proposed method are compared with the results from single-featured RF classification and other classification methods using joint features. Finally, some important conclusions drawn from this study are presented in Section “Conclusion.”
Materials and Methods
Study Area
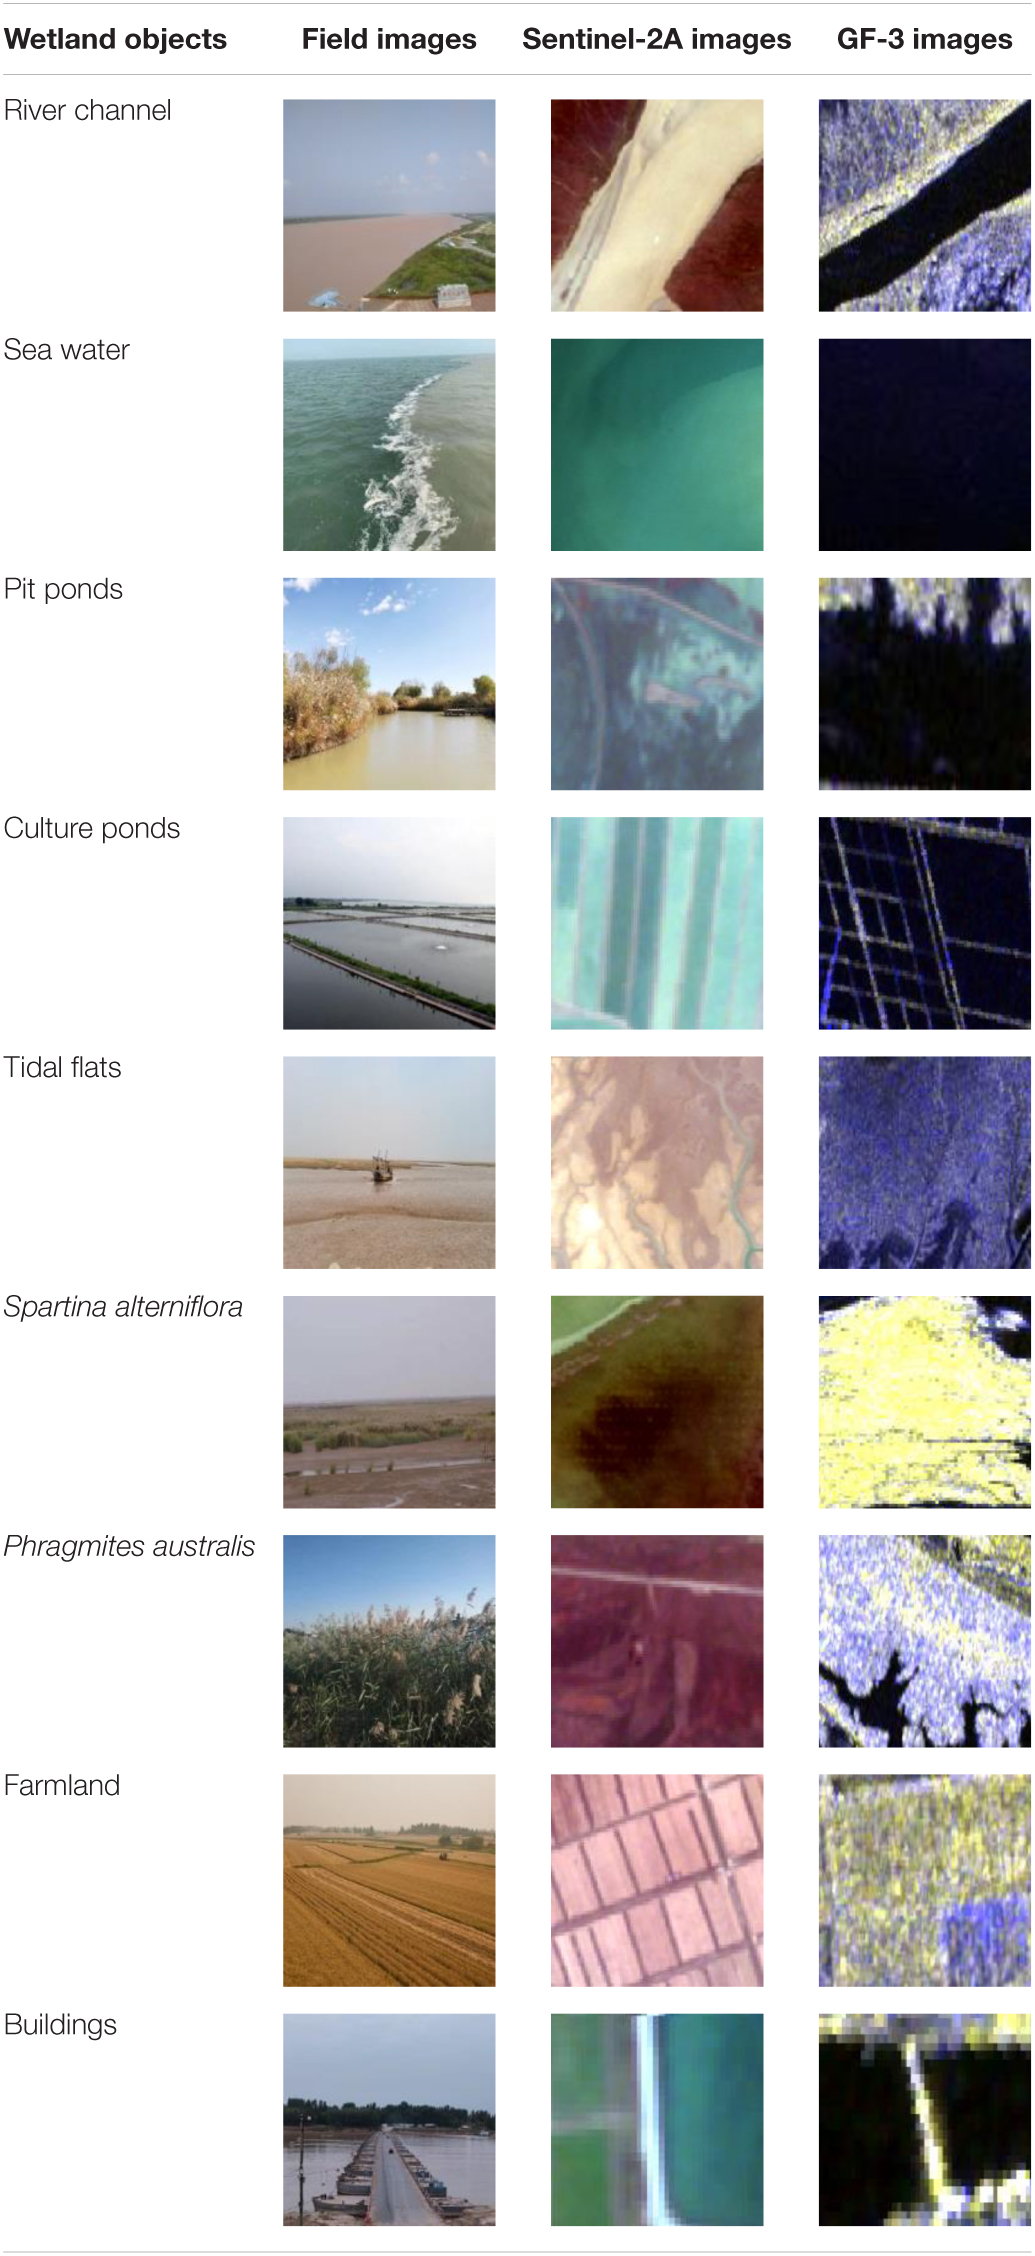
The Yellow River Delta is located on the south coast of Bohai Bay and on the west coast of Laizhou Bay in China. Its geographical coordinates are 36°55′–38°16′N, 117°31′–119°18′E, which is mainly in Dongying City, Shandong Province. The Yellow River Delta is in the eastern portion of the warm temperate zone of Eurasia, where the differing thermal properties between the land and sea form a temperate monsoon climate with four distinct seasons. The summer is hot and rainy, and the winter is cold and dry (Gao et al., 2021). The Yellow River Delta is divided into two parts: the estuary of the old Yellow River and the estuary of the current Yellow River. This study considers the current Yellow River estuary in the south as the study area, as shown in the red box in Figure 1. Combining literature (Ma et al., 2019; Li et al., 2021; Zhang C. et al., 2021) and data query, this study classified objects in the delta wetland into nine types as follows: the river channel, sea water, pit ponds, culture ponds, tidal flats, S. alterniflora, Phragmites australis, farmland, and buildings. In order to better determine the types of wetland objects, we carried out field investigation and obtained real images of ground objects. The real images of various wetland objects and corresponding Sentinel-2A optical and GF-3 polarimetric images are shown in Table 1.
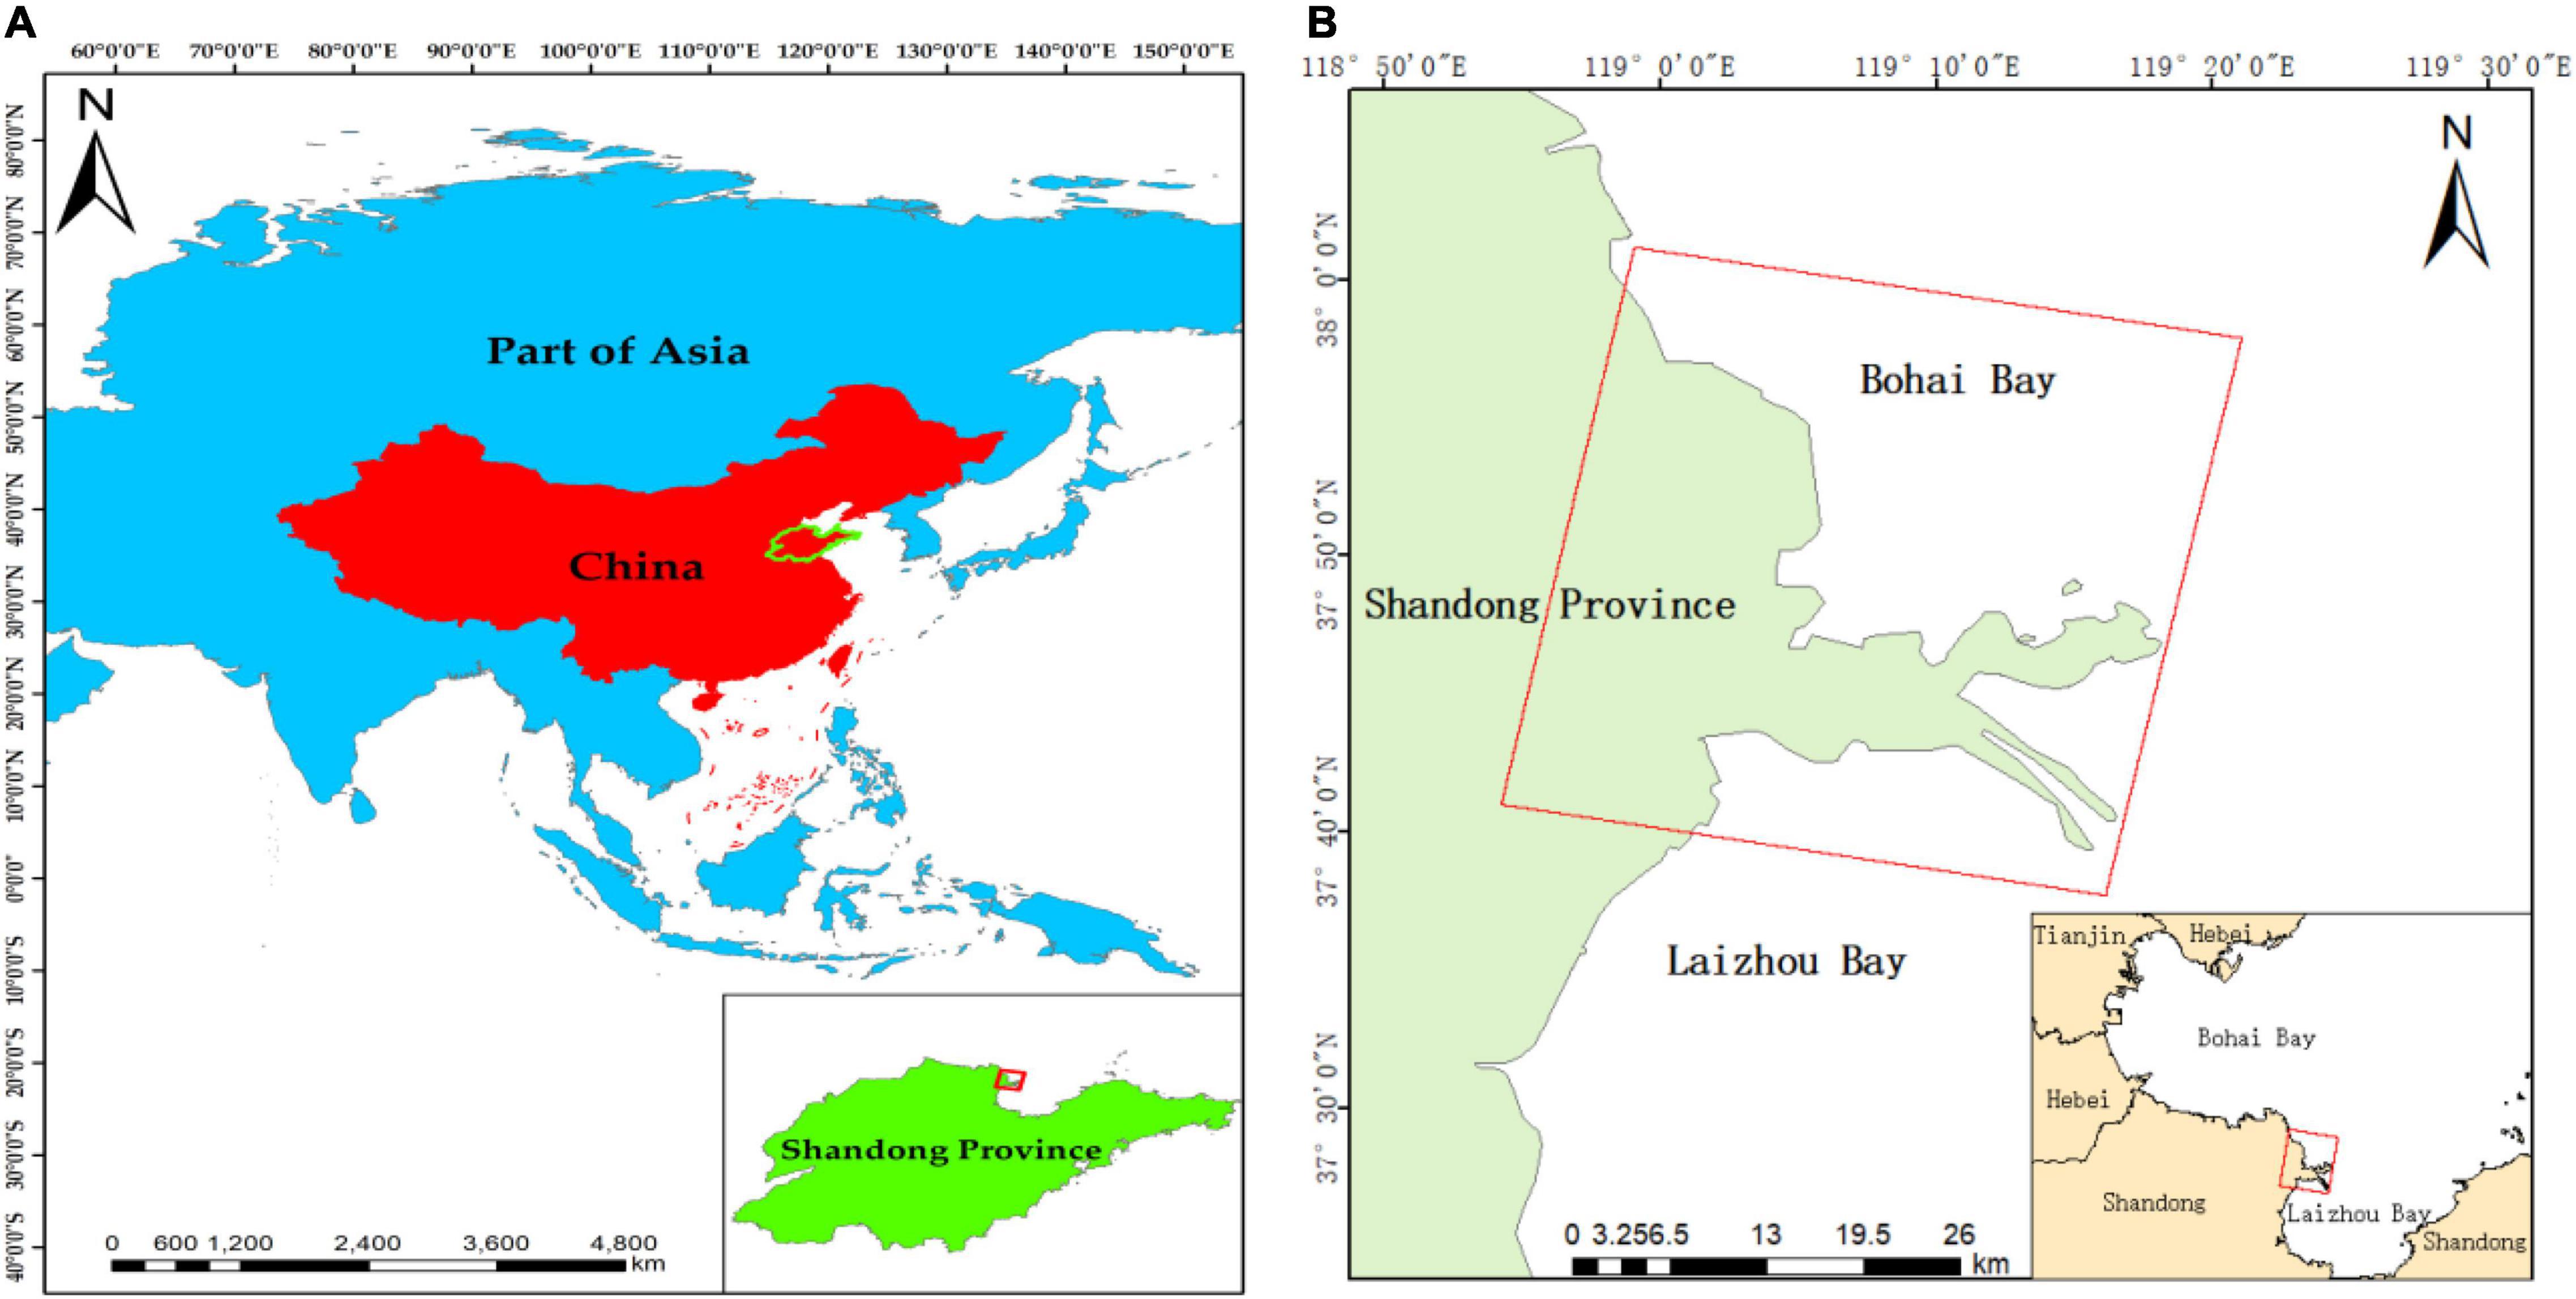
Figure 1. Location of the study area, as indicated by the red square. (A) Asia with the study area location. The light blue represents parts of Asia. Red is China and the bright green part represents Shandong province in China. (B) The specific location of the study area in China.
Data
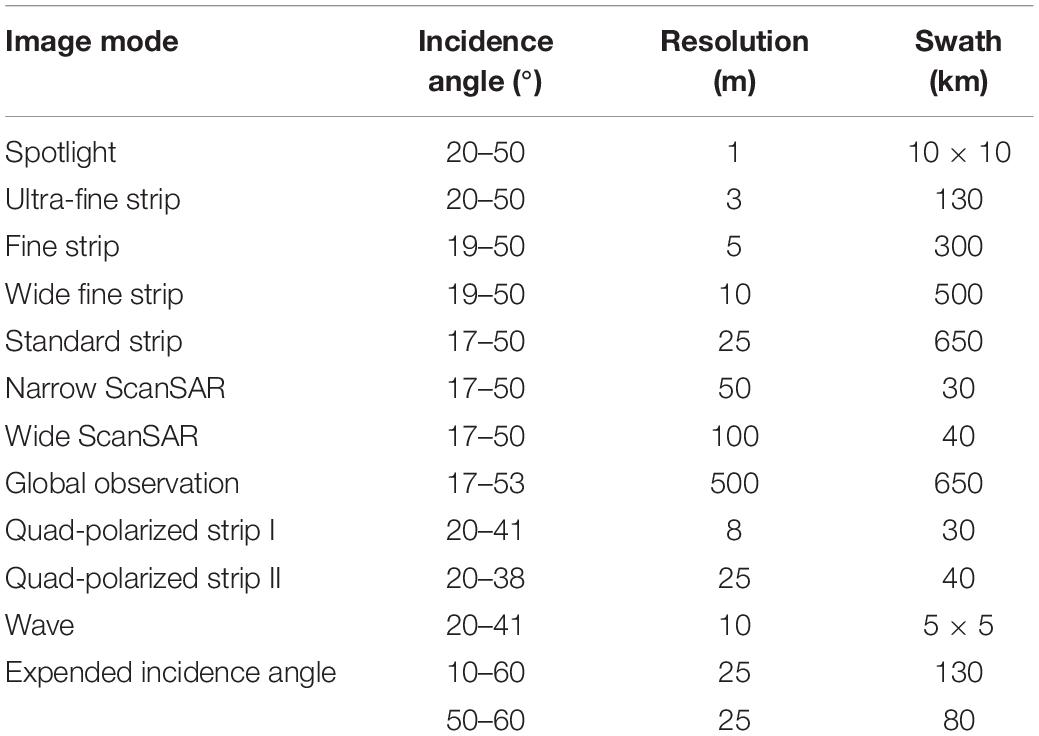
The fully polarimetric SAR data used in the experimental study were from GF-3, the first Chinese civilian C-band SAR, which was launched on August 10, 2016. The radar operates in 12 imaging modes with a resolution of up to 1 m. The imaging modes of GF-3 images are listed in Table 2. Its high-resolution satellite imaging modes include traditional striping and scanning imaging modes, as well as a wave imaging mode and global observation imaging mode for marine applications (Yin et al., 2017). GF-3 images from October 12, 2017 and November 5, 2018 were used in this study. The imaging mode is quad-polarized strip I. Each GF-3 image contains four polarization channels, HH, HV, VH, and VV, with a resolution of 8 m. Three of the polarization channels, VH, HV, and VV, were assigned the colors red, green, and blue, respectively, to compose color images. The results of this color synthesis are shown in Figure 2. The coverage area of GF-3 image acquired on October 12, 2017 is 619.31 square kilometers, and the incident angle ranges from 36.89° to 38.17°. The coverage area of GF-3 image on acquired November 5, 2018 is 1249.14 square kilometers, and the incident angle is 32.46°–34.52°. The swath width of both SAR images is 30 km.
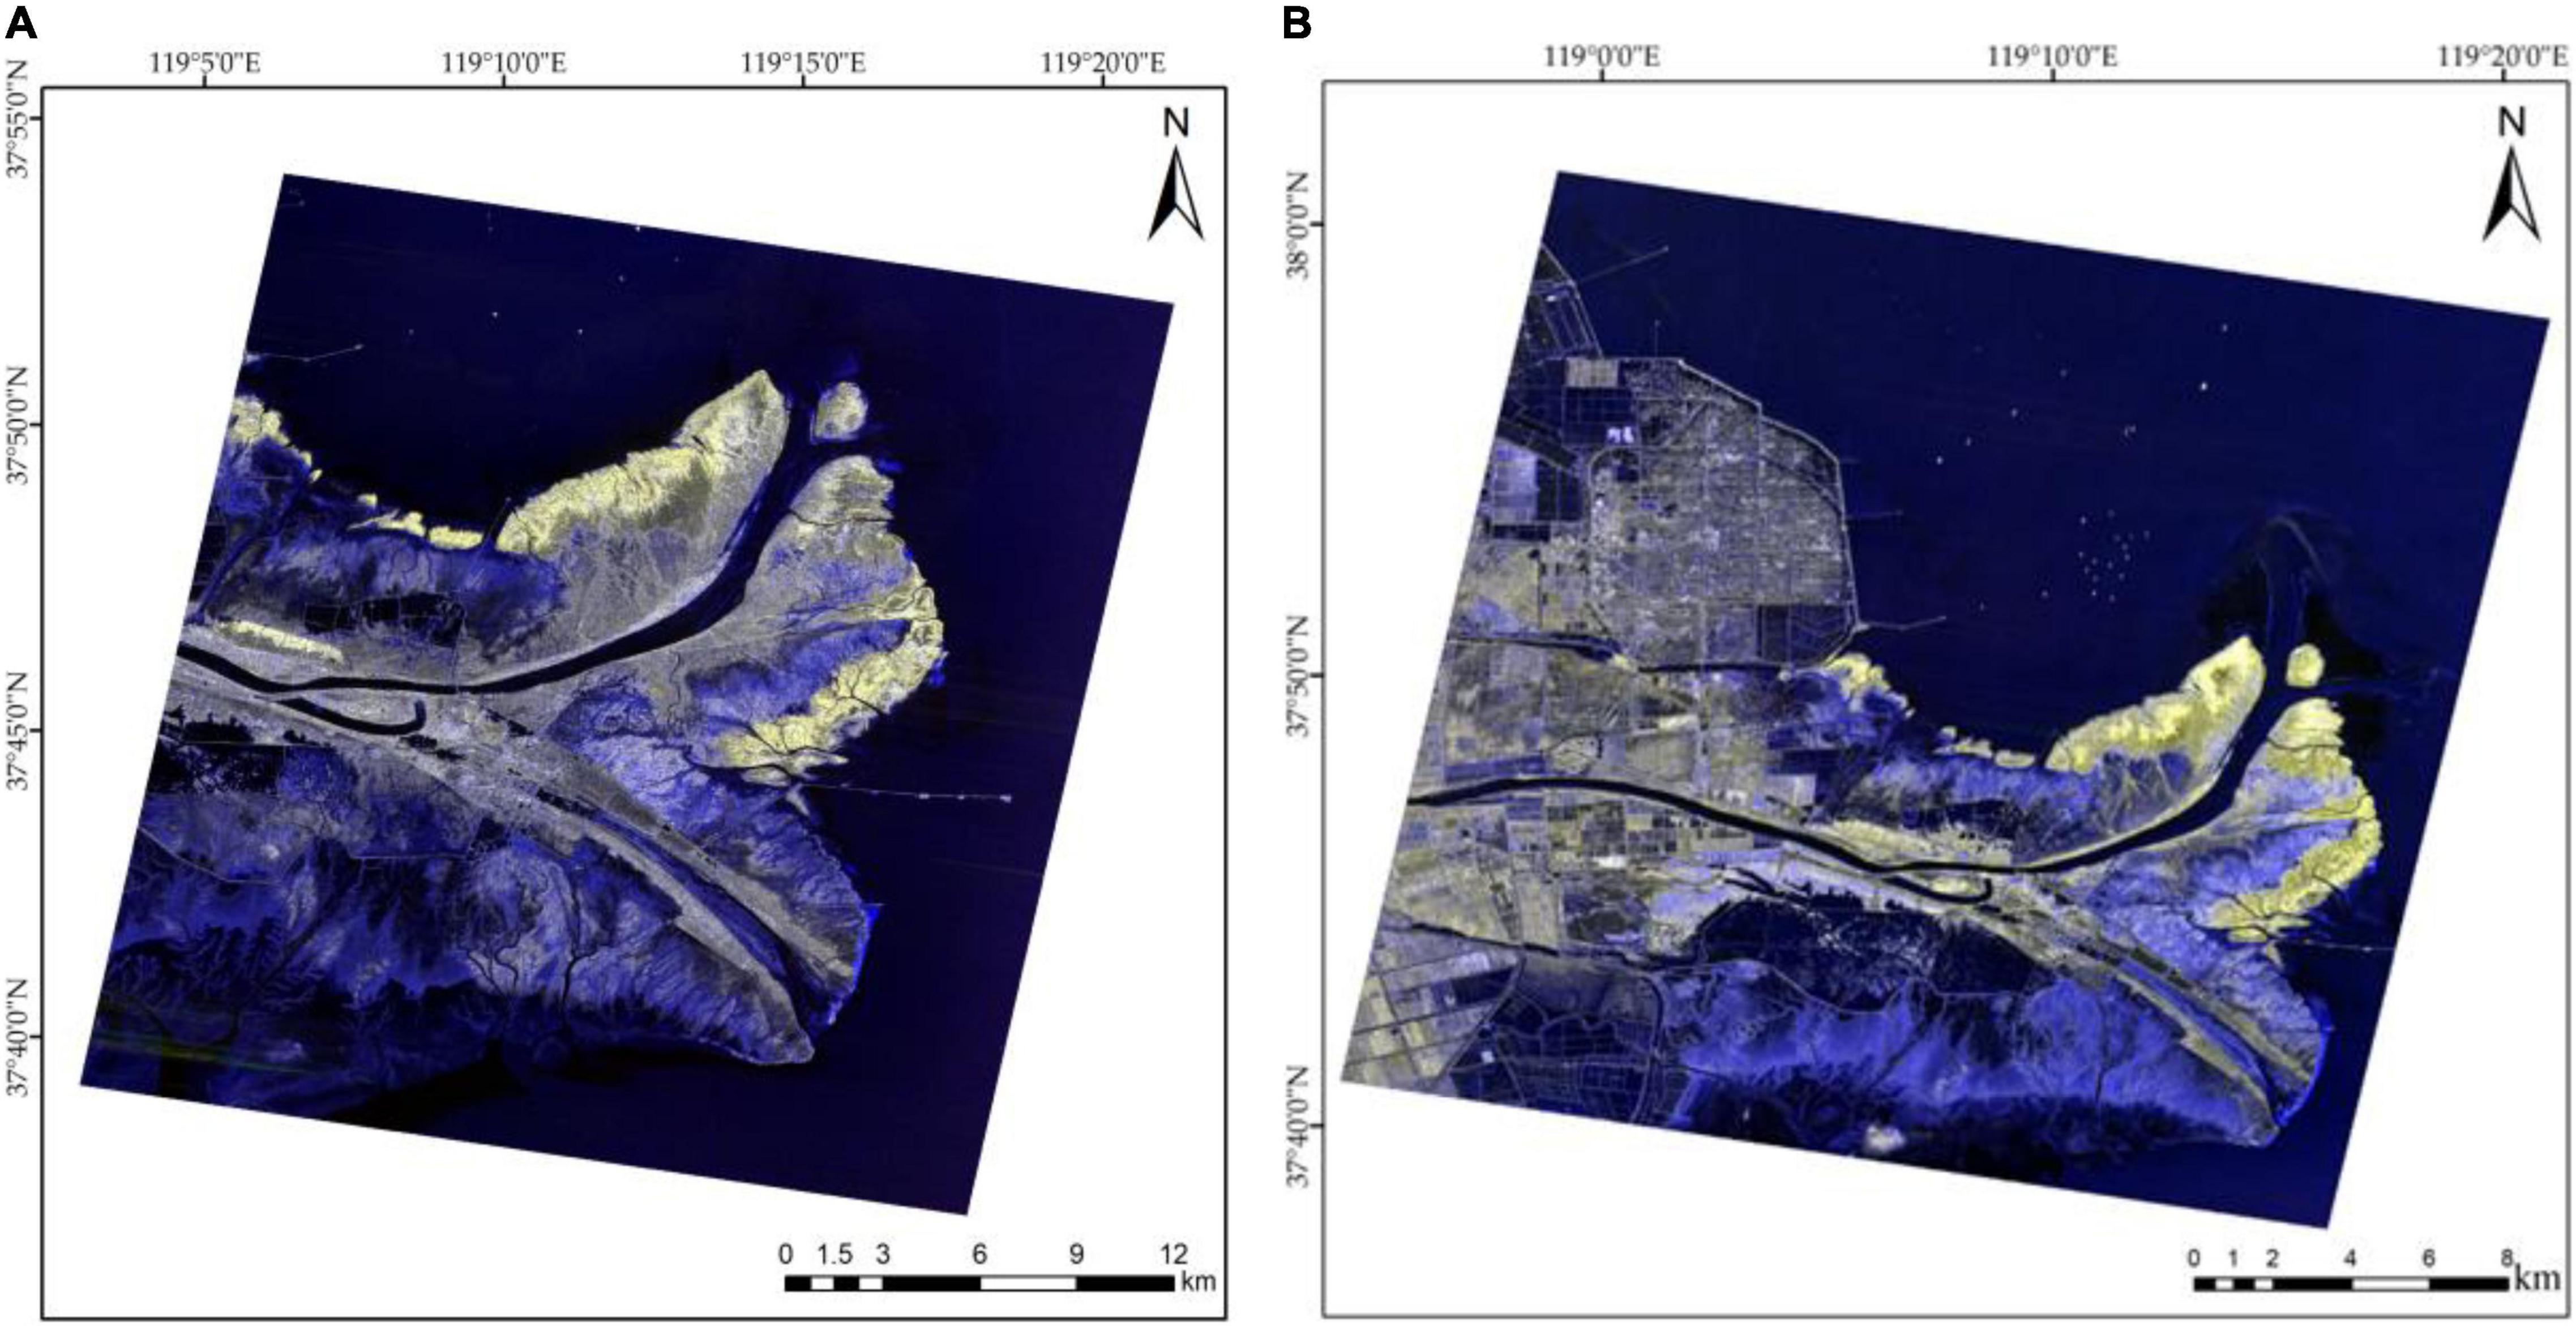
Figure 2. Result of the color synthesis of the GF-3 polarization channels. The darker areas in the image are mainly water or tidal flat, and the brighter coastal areas are vegetation, mainly S. alterniflora and P. australis. (A) Image obtained on October 12, 2017; (B) Image obtained on November 05, 2018.
The optical remote sensing data used in this study were from the Sentinel-2 satellites, which are the second satellite of the “Global Environment and Safety Monitoring” program. Sentinel-2A was launched on June 23, 2015 and Sentinel-2B was launched on March 07, 2017. Sentinel-2 carry a multispectral imager that covers 13 spectral bands and has a width of 290 km. The highest spatial resolution of Sentinel-2 is 10 m, and the revisit period for each Sentinel-2 satellite is 10 days (Zarco-Tejada et al., 2019). A Sentinel-2 multispectral image with a cloud cover of less than 10% and a spatial resolution of 10 m, captured on October 12, 2017 and November 3, 2018, the same period as the GF-3 data, were used to analyze the Yellow River Delta wetland. The Sentinel-2A data were given red, green, and blue primary colors for bands 4, 3, and 2, respectively, to generate true color images. The results of this color synthesis are shown in Figure 3. Based on GF-3 and Sentinel-2A images from November 2018, we combined polarimetric features and spectral features for wetland monitoring in the Yellow River Delta, and a validation experiment was carried out using GF-3 and Sentinel-2B data from October 2017.
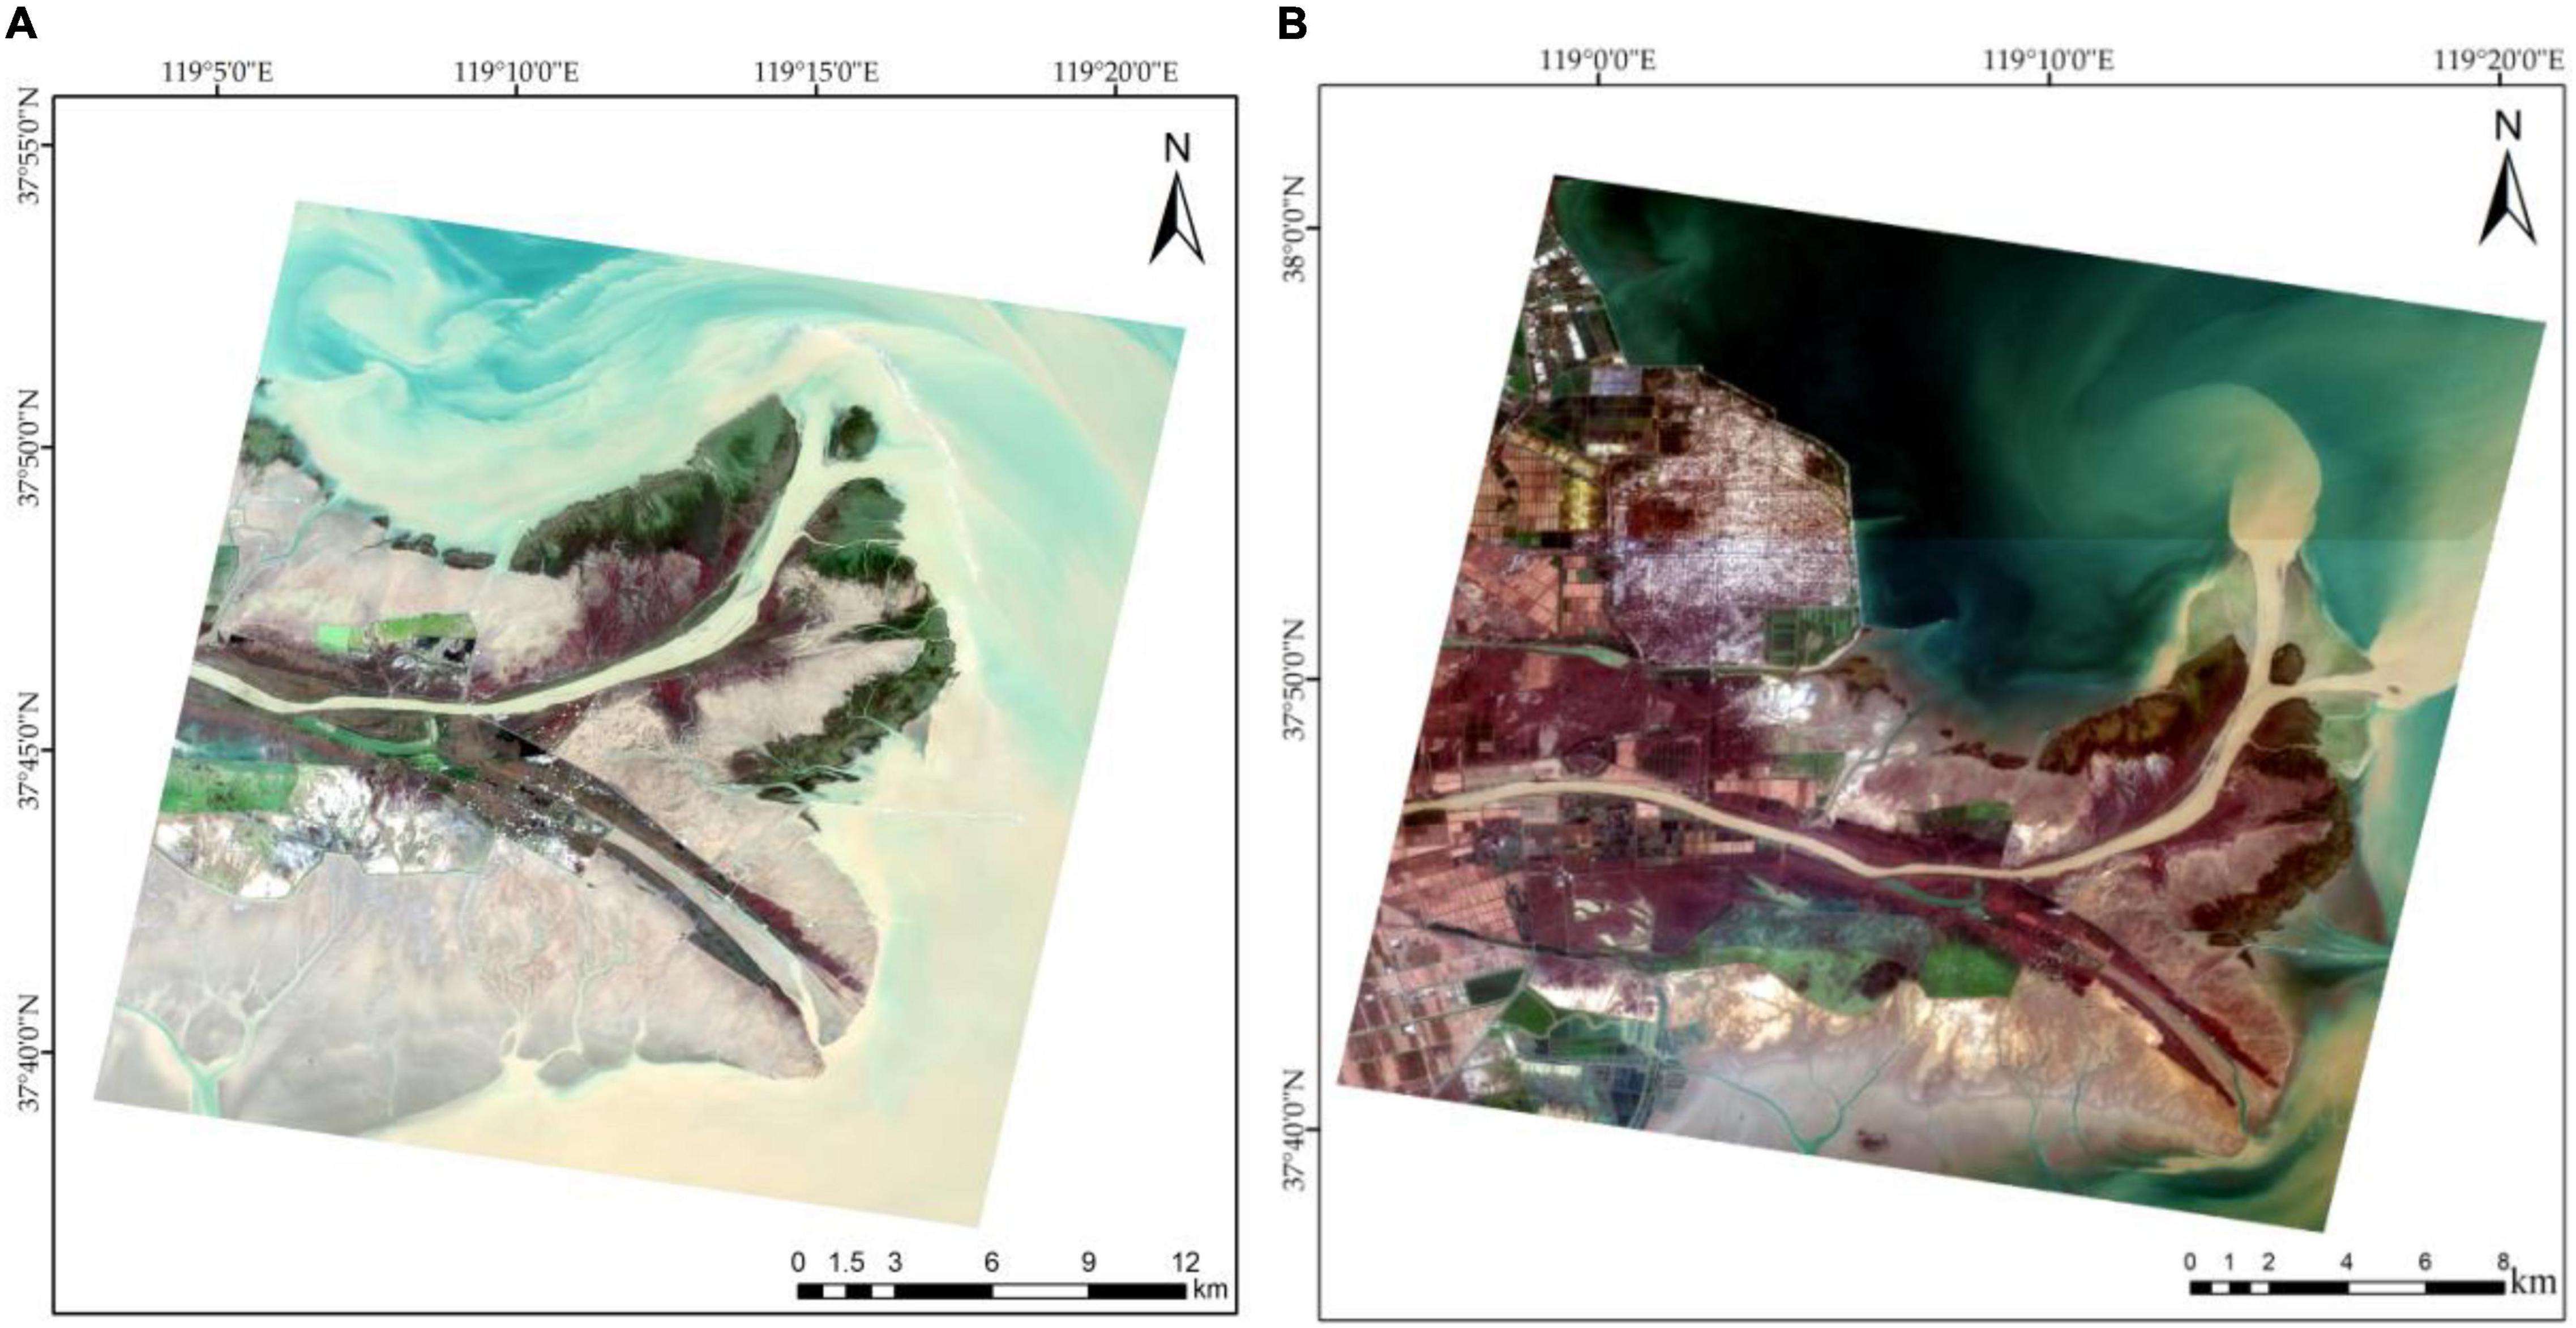
Figure 3. Sentinel-2A color synthesis result. The yellow ribbon-like object in the figure is the Yellow River, and the P. australis is beside it. The light blue in the upper right is sea water. (A) Image obtained on October 12, 2017; (B) Image obtained on November 05, 2018.
Methods
In this study, a novel method for extracting wetland object types was established using PCA and the RF classification method, which combined the polarimetric features of fully polarimetric SAR images and the spectral features of optical images. The polarimetric features, which contained polarization decomposition features and texture features, were obtained from a fully polarimetric SAR image. The spectral features of the optical image were also extracted, and then the PCA method was used to select features to reduce data redundancy. Then, the selected features were combined to classify the objects and monitor the wetland using an RF classifier.
Feature Extraction
The basic principle of polarization target decomposition is to decompose the polarimetric SAR Mueller matrix into a sum of several scattering mechanisms with certain physical significance (Huynen, 1978; Nunziata et al., 2012). According to the scattering characteristics of the target, the target decomposition is divided into two categories, including coherent target decomposition and incoherent target decomposition (Cloude and Pottier, 1996). In this paper, Pauli decomposition (Migliaccio and Nunziata, 2014; Rosa et al., 2016; Zhang X. et al., 2019) in coherent polarization target decomposition and H/α/A (where A is polarization anisotropy) decomposition (Cloude and Pottier, 1997) in incoherent target decomposition were used to obtain polarization decomposition features of wetland objects.
We extracted polarimetric texture features based on polarimetric total power images. Haralick et al. (1973) calculated 14 types of eigenvalues using a gray level cooccurrence matrix to quantitatively describe the texture information of an image, among which eight texture eigenvalues, specifically the mean (MEAN), variance (VAR), homogeneity (HOM), contrast (CON), dissimilarity (DIS), entropy (ENT), angular second moment (ASM), and correlation (COR), are often used to express the texture of remote sensing images. This method is robust and widely used to extract texture information from SAR images. Therefore, Therefore, in this paper, we used the gray level cooccurrence matrix to obtain the texture features from the polarimetric total power of SAR.
Spectral features were obtained from Sentinel-2 images. We used the Sen2Cor (Main-Knorn et al., 2017) plug-in provided by the European Space Agency to achieve radiometric calibration and atmospheric correction for the Sentinel-2 data, and then extracted four bands with a spatial resolution of 10 m (bands 2, 3, 4, and 8, corresponding to the blue, green, red, and near-infrared bands). We then registered the Sentinel-2 spectral data based on GF-3 SAR data to facilitate the combination of the polarimetric and spectral features for our classification algorithms.
In order to eliminate the influence of different dimensions between different features, the data need to be normalized. We normalized the obtained polarimetric features (including polarization decomposition features and texture features) and spectral features. The standardized calculation formula is as follows:
Where, Xnormalization is the standardized value, Xi is the original value, Xmin is the minimum value, and Xmax is the maximum value.
Principal Component Analysis
Principal Component Analysis transforms a group of potentially correlated variables into a group of linearly uncorrelated variables through orthogonal transformation, which can be used to output irrelevant image bands, separate noise components, and reduce the dimensionality of data sets in remote sensing (Eklundh and Singh, 1993).
Random Forest Classification
The RF algorithm is an ensemble algorithm based on the decision tree proposed by Breiman (2001) in 2001. It extracts and generates a subset of training samples from a set of original training samples and generates a decision tree from a subset of the training samples. The set composed of these decision trees constitutes an RF. Finally, the average prediction value of all decision trees is taken as the final prediction result. An RF classifier can reduce the risk of overfitting and deal with high-dimensional data through an average decision tree.
We combined polarimetric features and spectral features to form joint feature for RF classification. At the same time, we used only polarimetric features, only spectral features for RF classification. Based on the joint features, we used the SVM, MLC, and MDC to compare with the RF classification. All classification experiments were performed on a computer with i5-6200 GPU and 8 GB RAM.
According to Sentinel-2 images data and field survey data, we select training samples and verification samples. For data in October 2017, 385 samples were randomly selected, including 185 training samples and 200 validation samples. For data in November 2018, 650 samples were selected, including 350 training samples, and 300 validation samples.
Wetland Object Extraction Method Based on a Random Forest
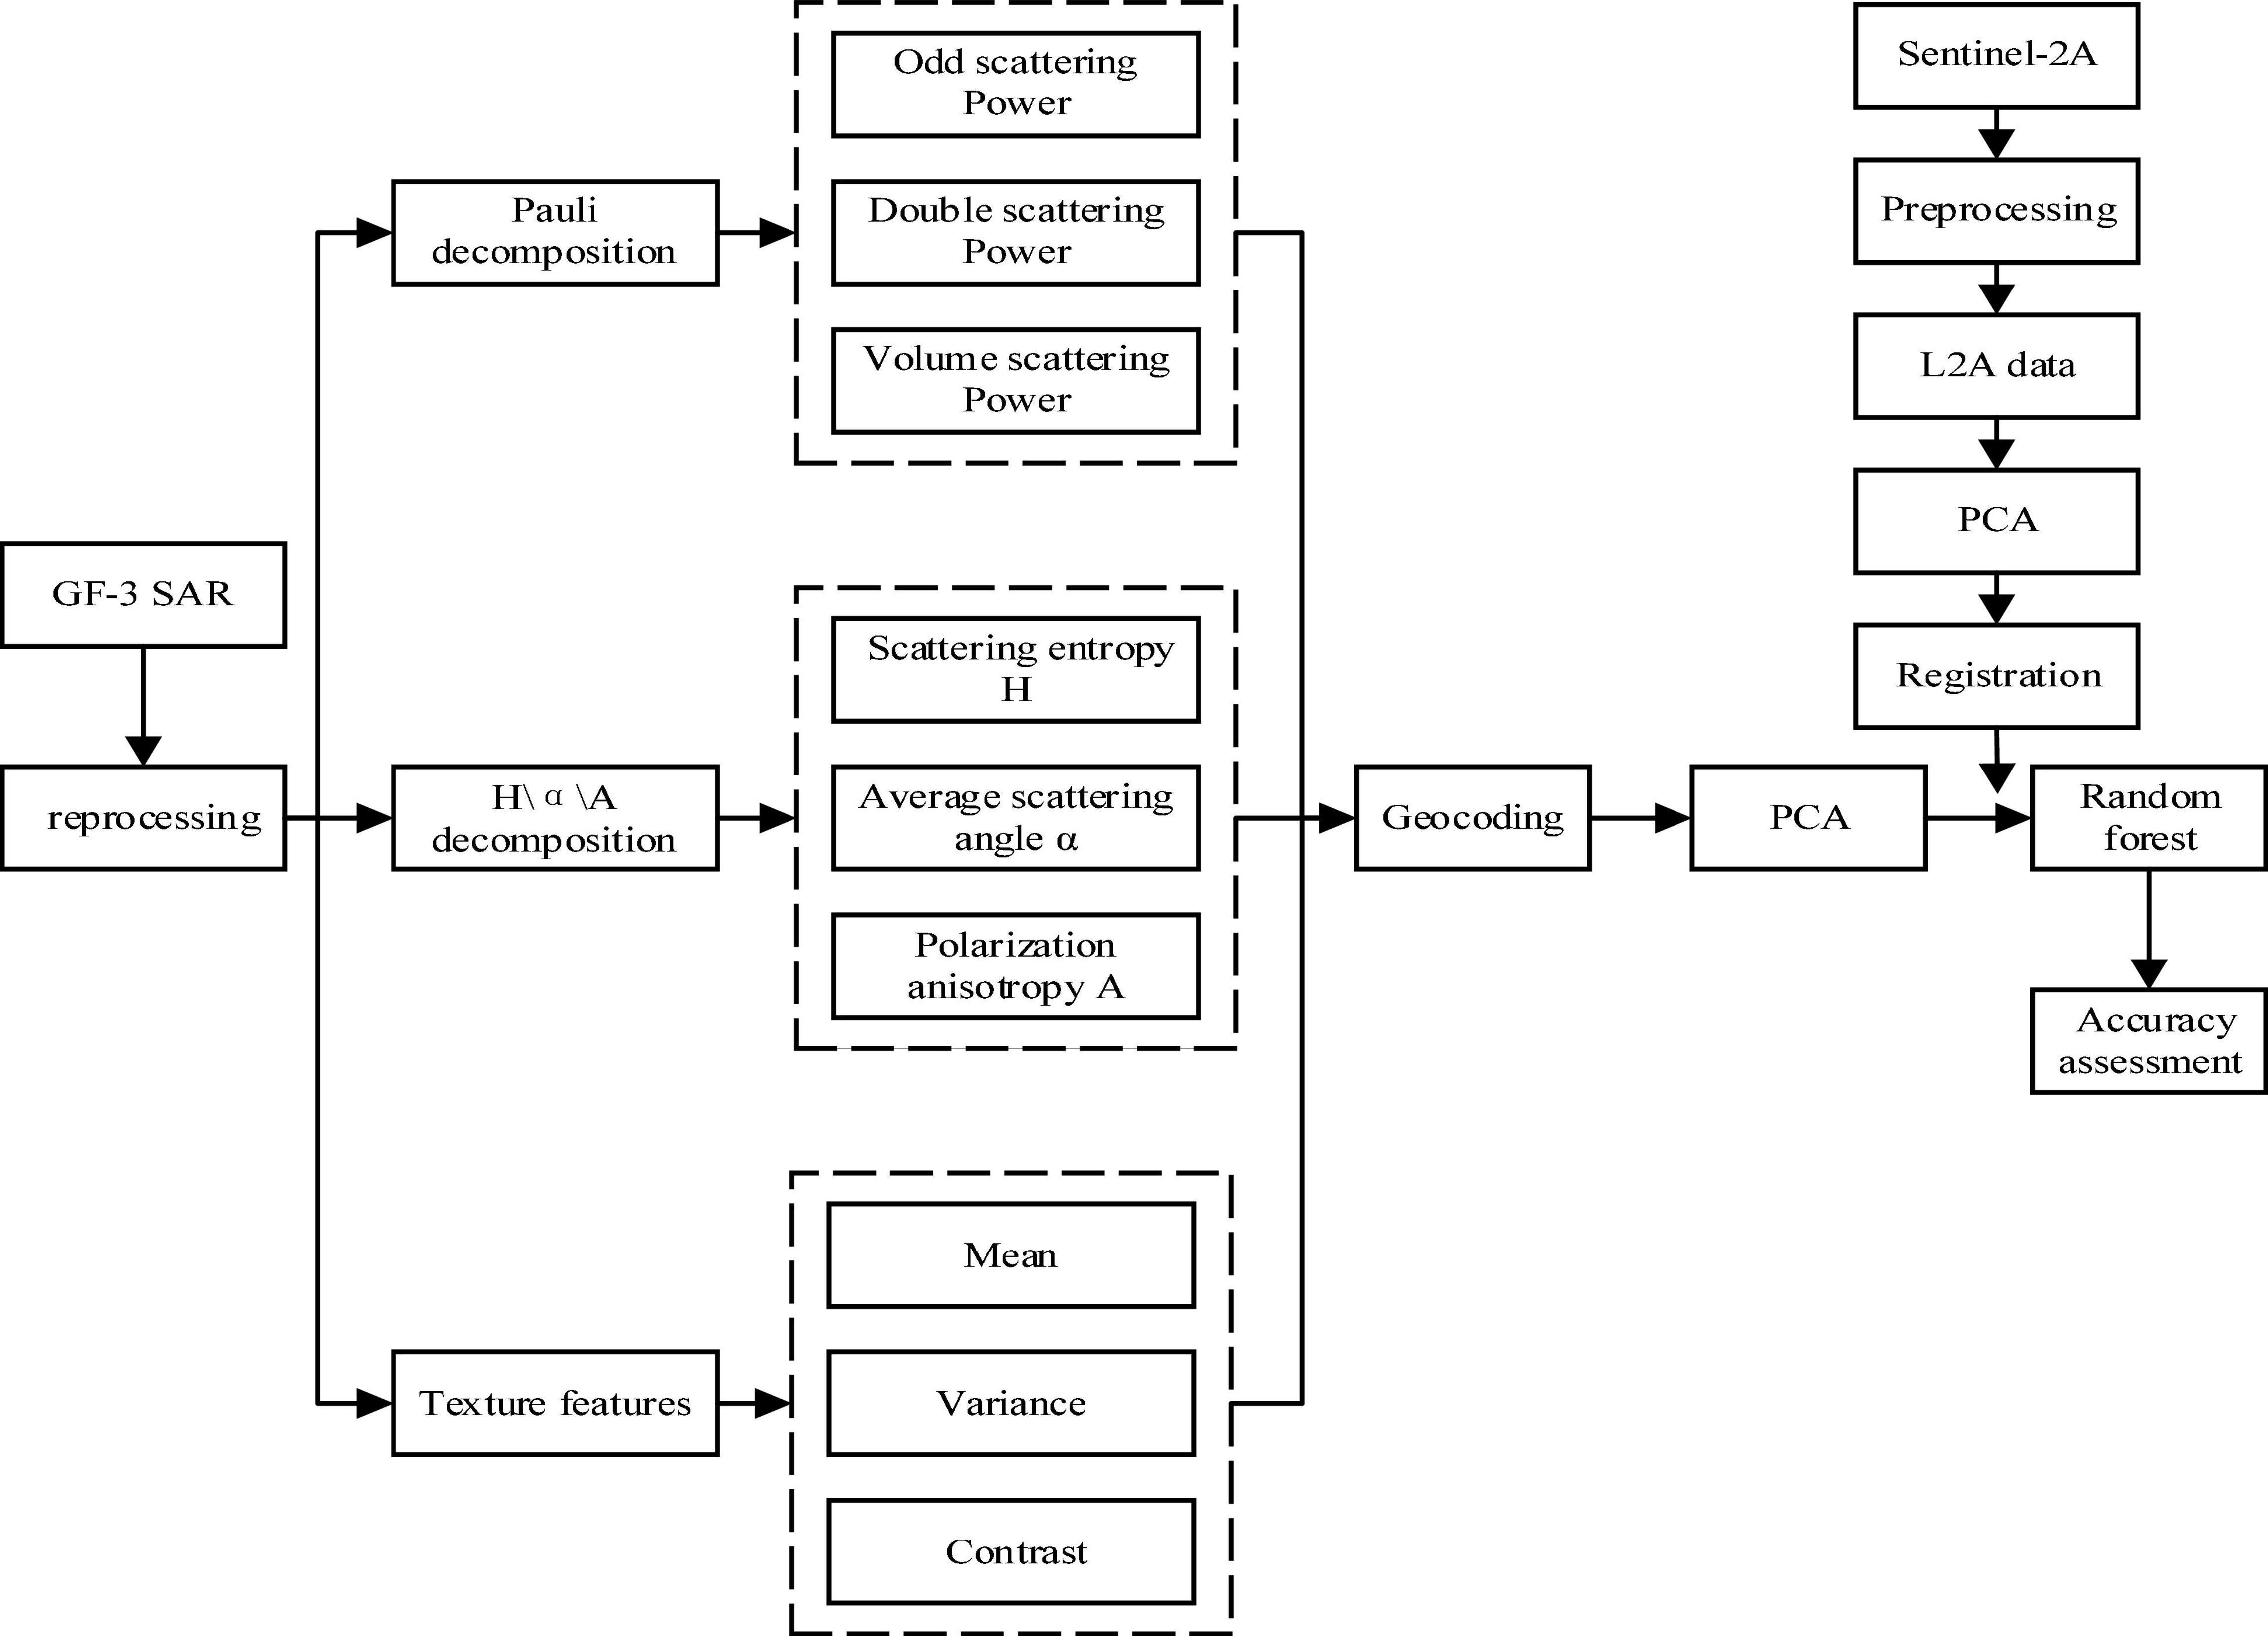
The RF classification algorithm was used to classify the ground objects in the Yellow River Delta wetland by combining the polarimetric features of the GF-3 data and spectral features of the Sentinel-2 data. A flow chart of the method for extracting specific wetland object types is shown in Figure 4 and the list below.
(1) The GF-3 data were preprocessed by radiation calibration and polarization matrix conversion to obtain the polarization matrix T3. Multilook processing and refined Lee filter (Lee et al., 1999) processing were performed to reduce speckle noise. The azimuth and range window for multilook processing was set to 3 × 3, and the filtering window was 3 × 3.
(2) Polarization target decomposition of T3 was carried out. Based on the Pauli decomposition and H/α/A decomposition, six polarimetric parameters were extracted: odd scattering, 0° dihedral angle scattering, 45° dihedral angle scattering, scattering entropy, anisotropy, and average scattering angle.
(3) The texture characteristics of the total polarization power of GF-3 were extracted and screened to obtain the three texture parameters: mean, variance, and contrast. The polarization decomposition features and texture features extracted from GF-3 are collectively referred to as polarimetric features.
(4) Geocoding transferred the characteristic parameters of the fully polarimetric SAR data from the slant-range coordinate system to the geographic coordinate system, which facilitates the interpretation of the objects in the wetland. After preprocessing, the cubic convolution method was used to resample the GF-3 images, and the final resolution were 10 m.
(5) The Sentinel-2 L1C data were processed by radiometric calibration and atmospheric correction to obtain the L2A data. Four bands (2, 3, 4, and 8, corresponding to blue, green, red, and near-infrared bands) with a 10 m resolution were extracted as spectral features for classification.
(6) A deviation existed between the geometric position of the geocoded GF-3 image and the Sentinel-2A image. Based on the GF-3 data, Sentinel-2 spectral data were registered by selecting control points.
(7) To reduce data redundancy, PCA was carried out on the polarimetric and spectral features. The first two principal components of each were obtained. Then, these four principal components were combined as joint features for classification.
(8) The number of classified ground objects was determined. Training samples were selected and the RF classifier was trained. Then, using the joint features as the input, the trained RF classifier was applied to extract the object types in the Yellow River Delta wetland.
(9) Using the Sentinel-2 image and field images, verification samples were selected through visual interpretation, and the accuracy of the extracted wetland objects was analyzed.
Results
In this study, the polarimetric features were extracted based on GF-3 polarimetric SAR data, including the following: odd scattering power, double scattering power, and volume scattering power, which were obtained by Pauli decomposition; H, α, and A, which were obtained by H/α/A decomposition; the polarization texture features of MEAN, VAR, and CON; and a total of nine polarization feature parameters. After PCA of the nine polarization feature parameters, the first two principal components were selected as polarimetric features. Based on Sentinel-2 data, four bands with 10 m resolution were extracted, and the first two principal components were selected as spectral features after PCA. The two types of features were combined to form joint feature for wetland classification.
Polarization Decomposition Features
After obtaining and processing the T3 coherence matrix, polarization decomposition of this filtered matrix was carried out, using Pauli and H/α/A decomposition. The window size for both Pauli decomposition and H/α/A decomposition is set to 3 × 3. The color synthesis results of polarization decomposition are shown in Figure 5. Figures 5A,C are the Pauli decomposition figures for October 2017 and November 2018, respectively. The double scattering power, volume scattering power, and odd scattering power of Pauli decomposition are assigned red, green and blue channel to compose color images, respectively. Figures 5B,D are the H/α/A decomposition results for October 2017 and November 2018, respectively. The scattering angle, anisotropy, and entropy of H/α/A decomposition are assigned to red, green, and blue channel to compose color images, respectively.
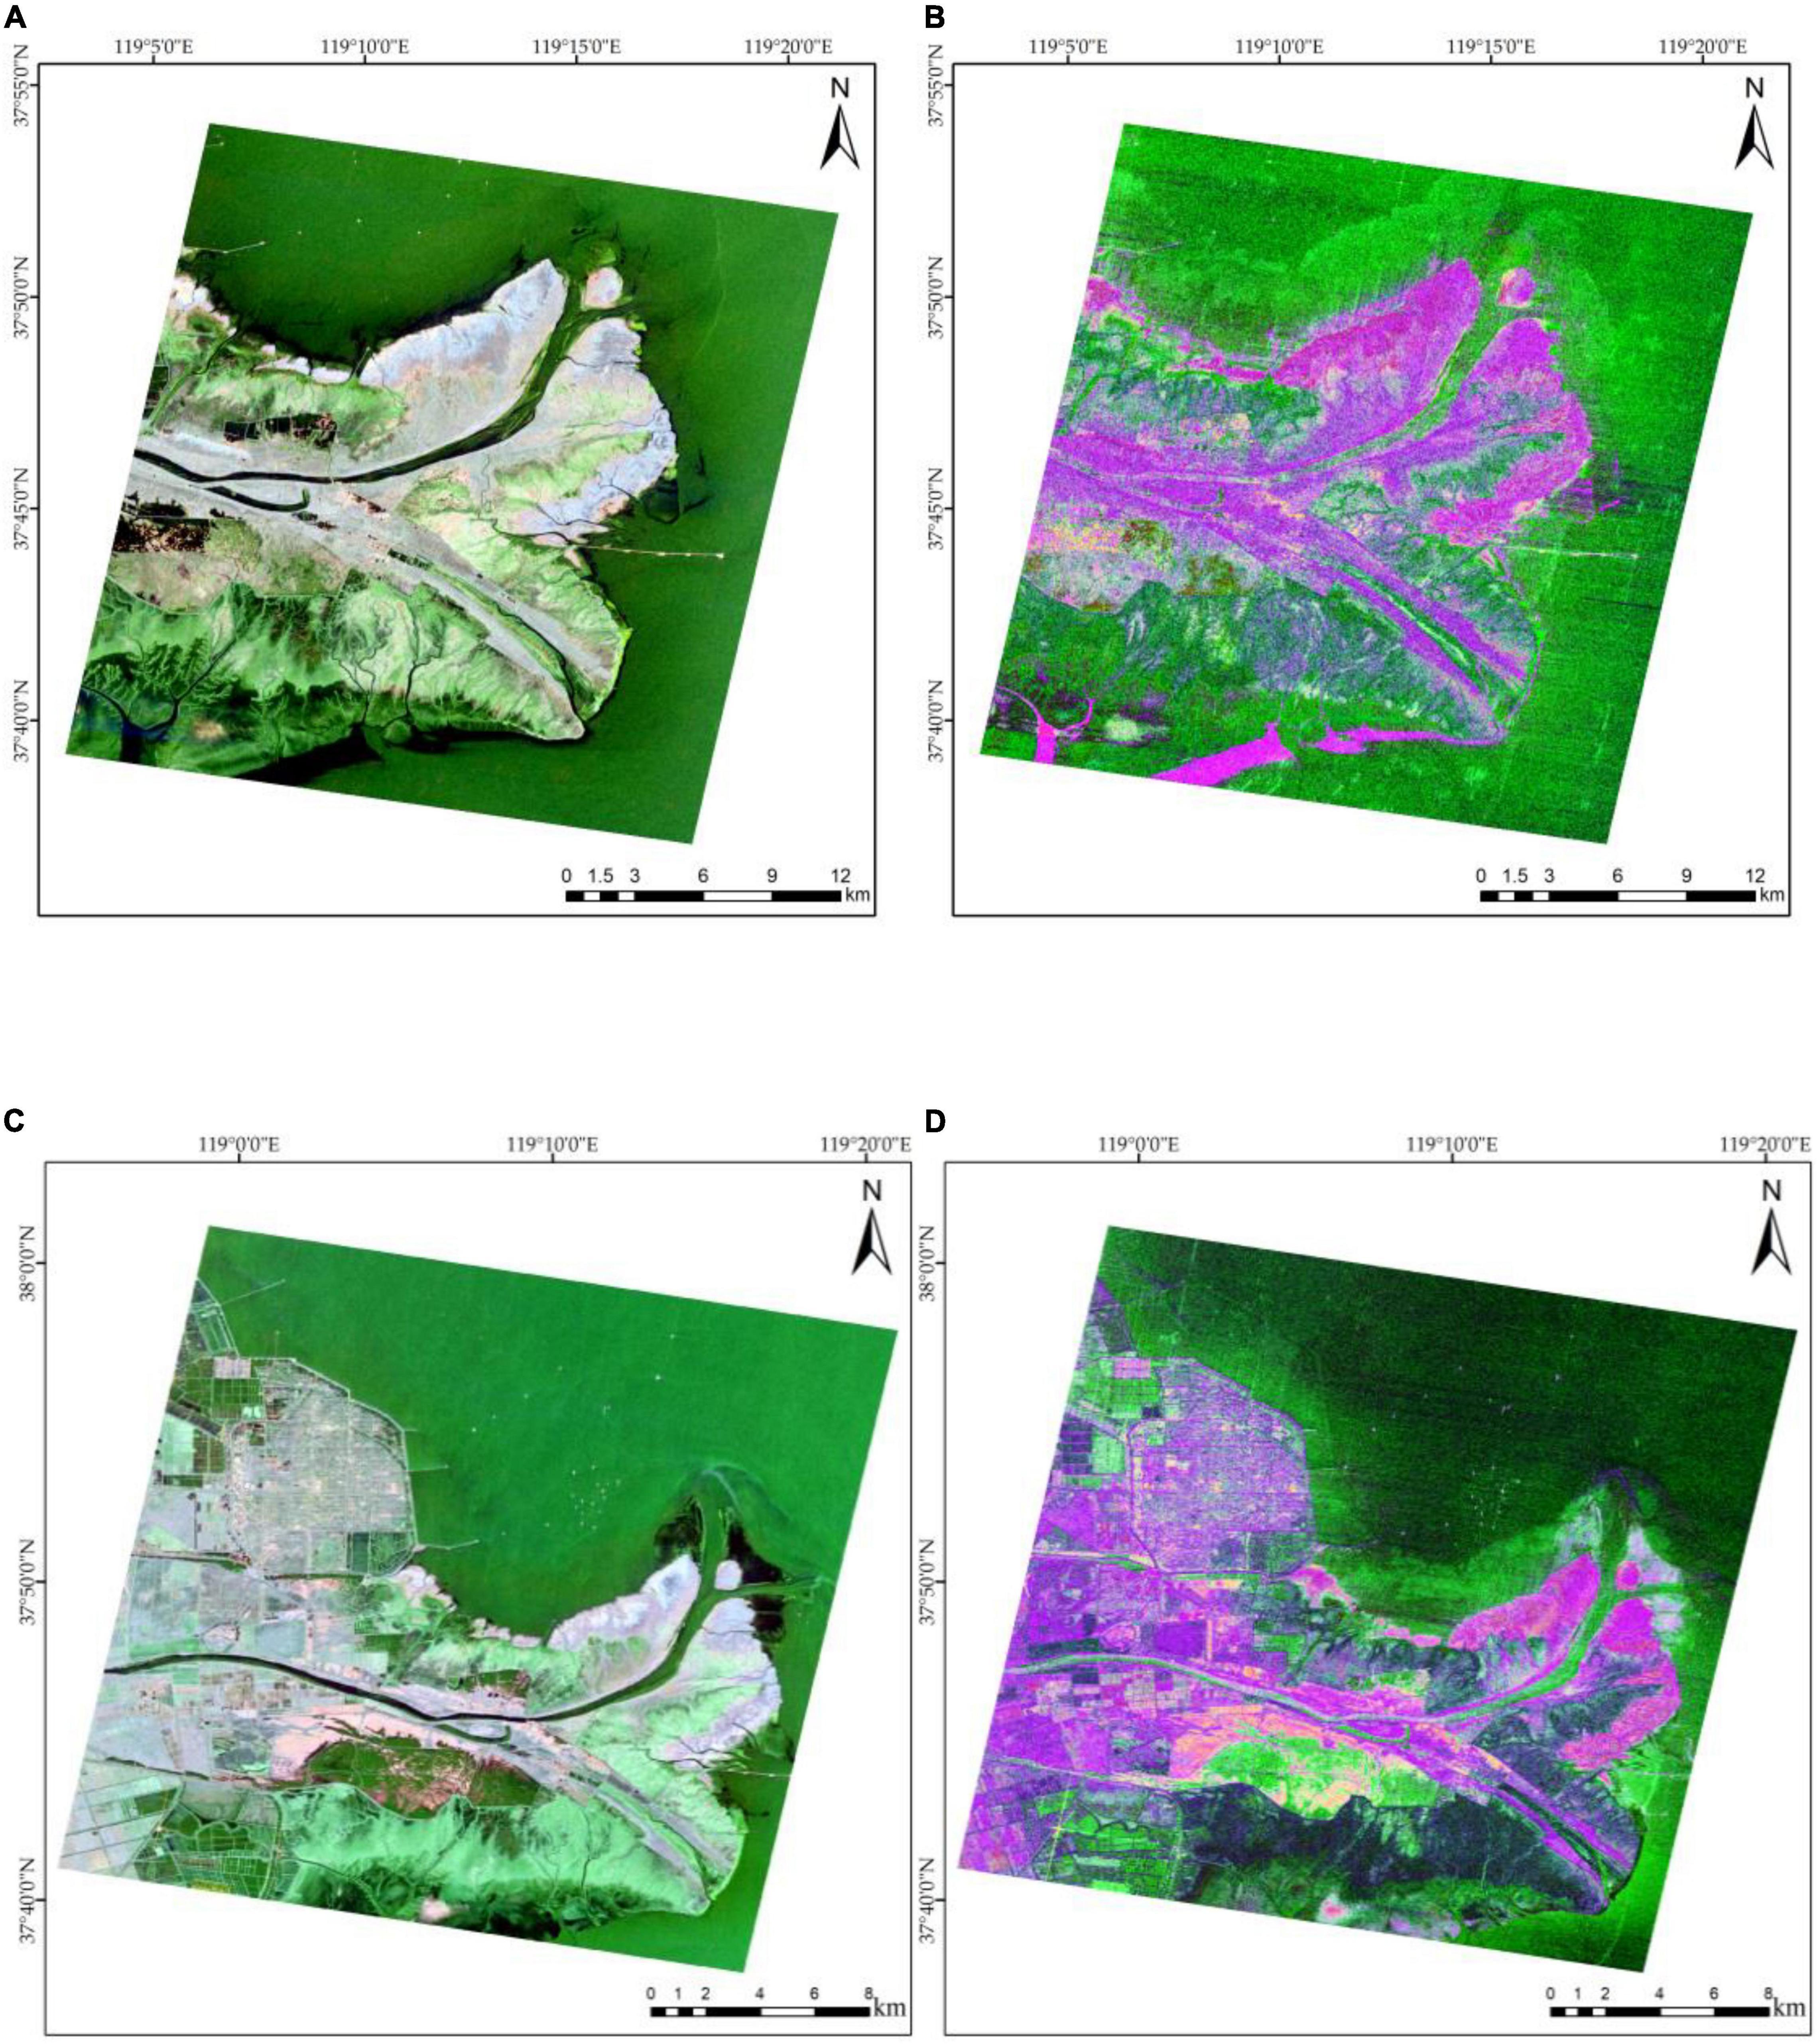
Figure 5. Results of polarization decomposition. (A,C) Are the Pauli decomposition figures for October 2017 and November 2018, respectively. (B,D) Are the H/α/A decomposition figures for October 2017 and November 2018, respectively.
Texture Feature Selection
The polarimetric total power (SPAN) was obtained by the superposition of the intensities of the four polarization channels: HH, HV, VH, and VV. After superposition, some of the positive and negative noise interference was eliminated or weakened, which increased the separability among the objects in the wetland. The polarimetric total power of GF-3 are shown in Figure 6. The calculation formula of SPAN is as follows:
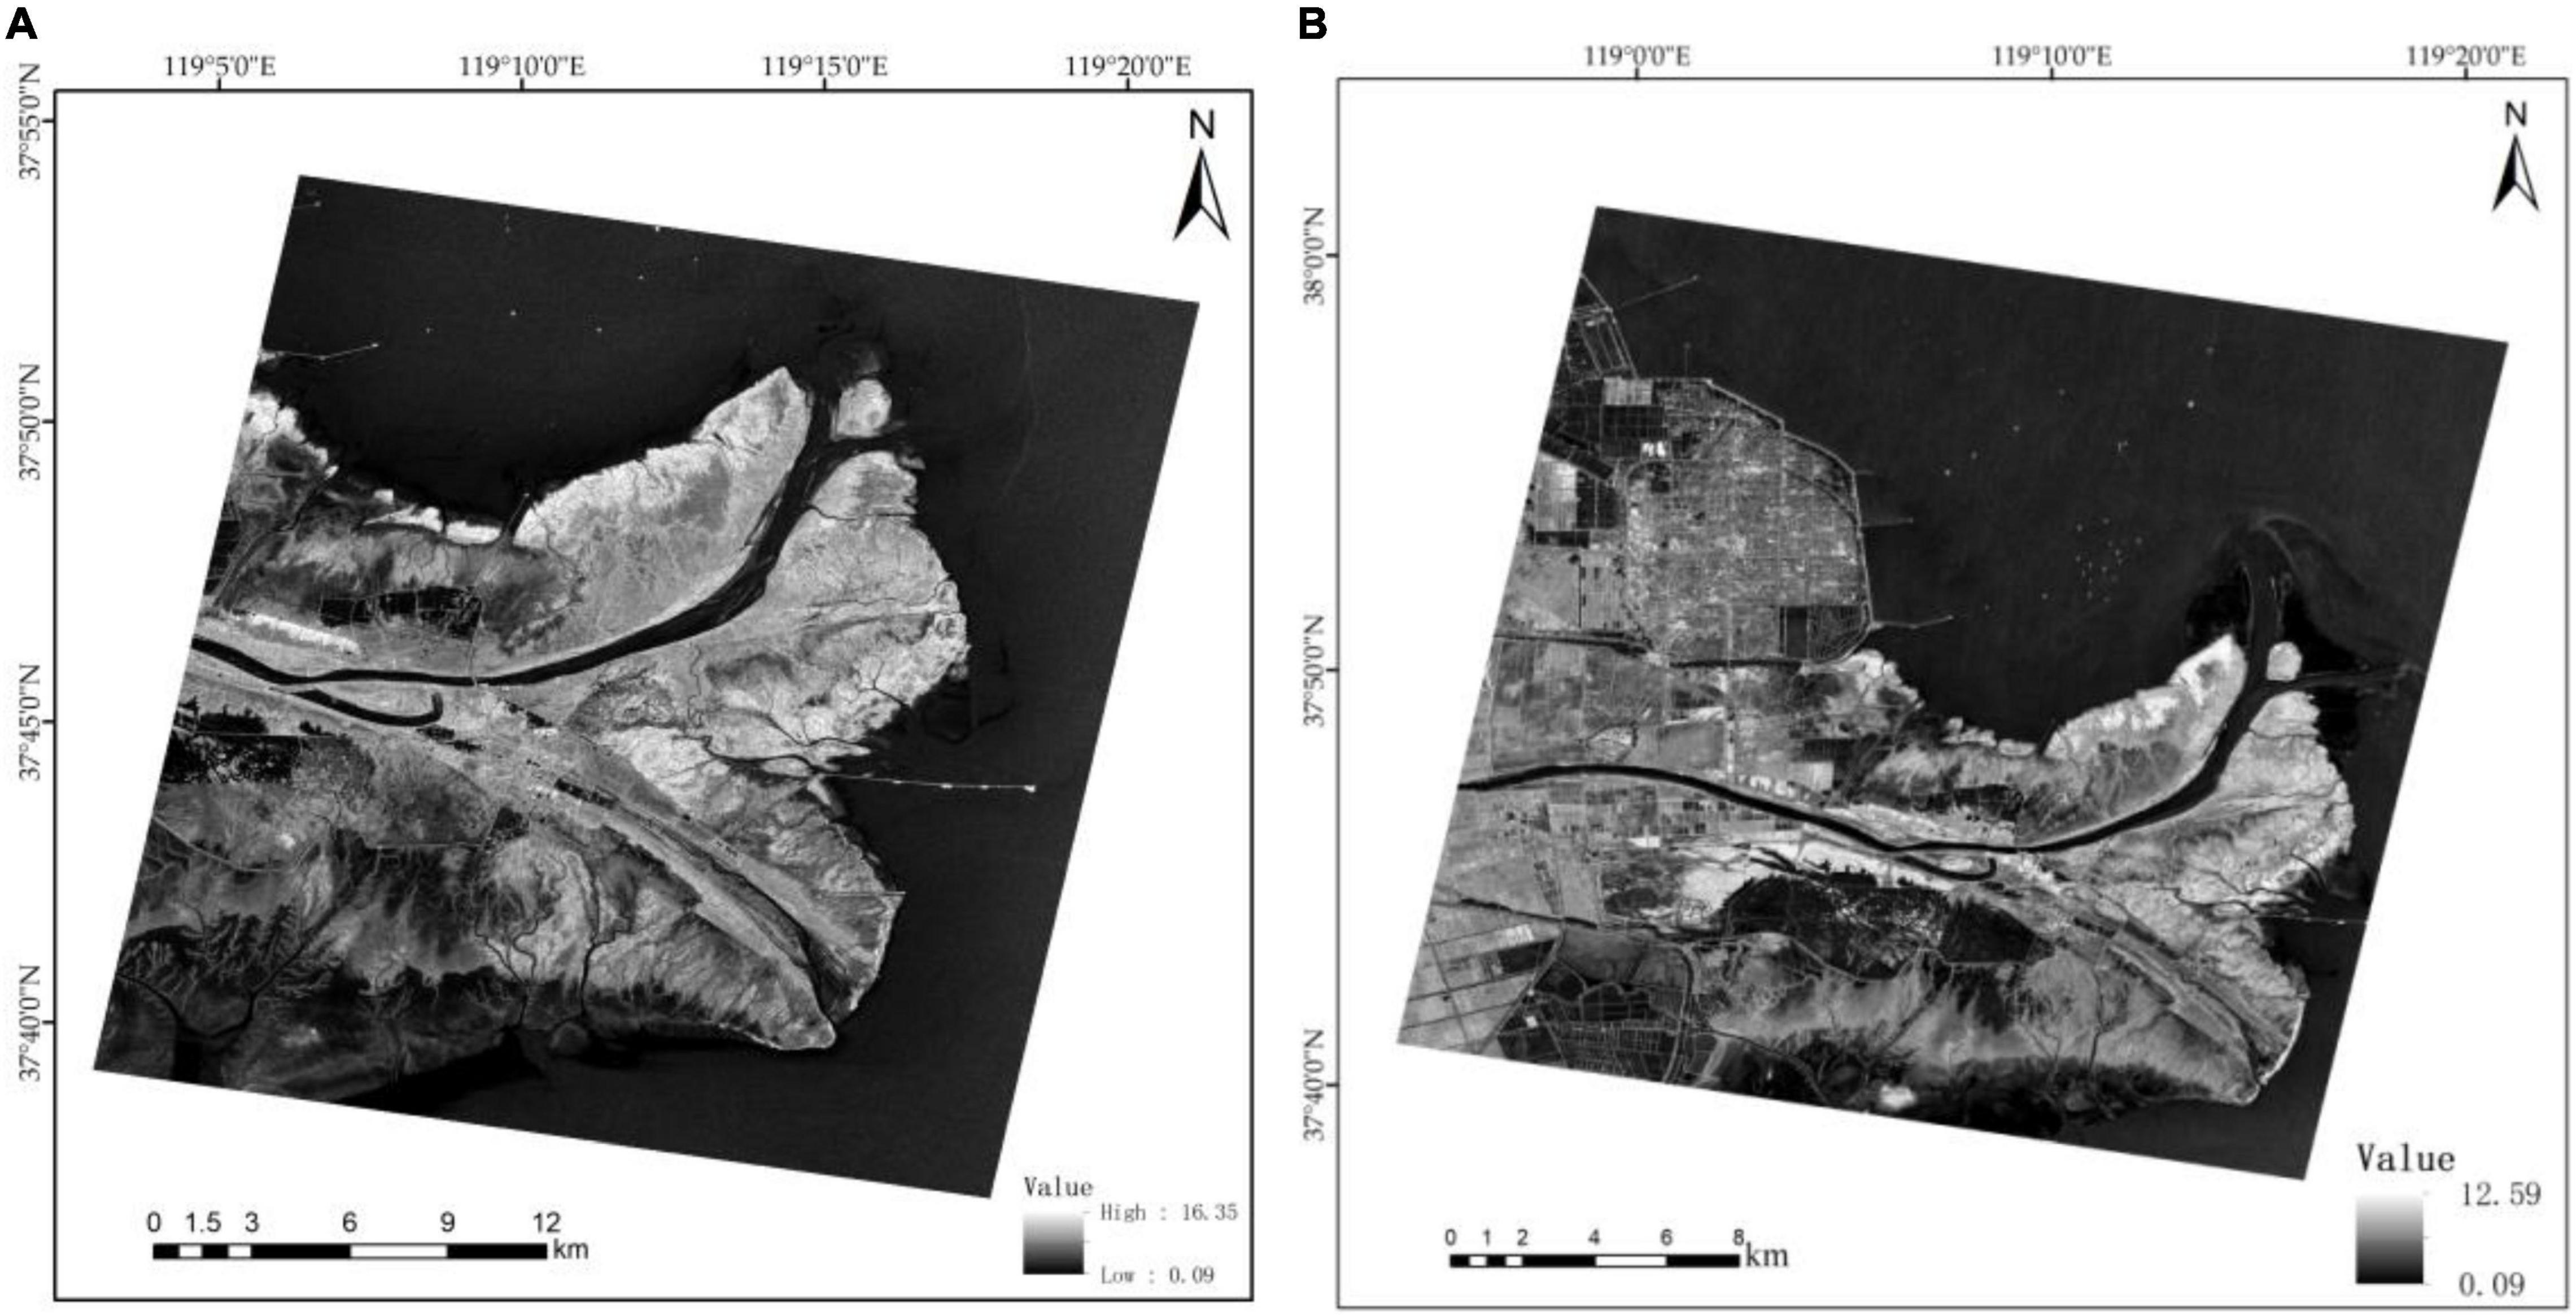
Figure 6. The polarimetric total power of GF-3. The dark area is water body, and the brighter area is various vegetations in the figure. (A) Is the data of October 2017, (B) is the data of November 2018.
Where, σhh, σhv, σvh, and σvv represent polarization channel backscattering intensities of HH, HV, VH, and VV, respectively.
A combination of different texture features can improve the classification accuracy for ground objects; therefore, a gray level co-occurrence texture matrix was used to extract polarimetric texture features from the polarimetric total power images. Seven window sizes were tested, specifically 3 × 3, 5 × 5, 7 × 7, 9 × 9, 11 × 11, 13 × 13, and 15 × 15. Through experimental verification, the best window size for extracting the texture features was 5 × 5. Eight texture feature parameters, specifically the MEAN, VAR, HOM, CON, DIS, ENT, ASM, and COR, were extracted based on this window size. To reduce accidental errors, the mean value of the texture feature parameters for each wetland object type was calculated and analyzed. The statistical results are shown in Figure 7.
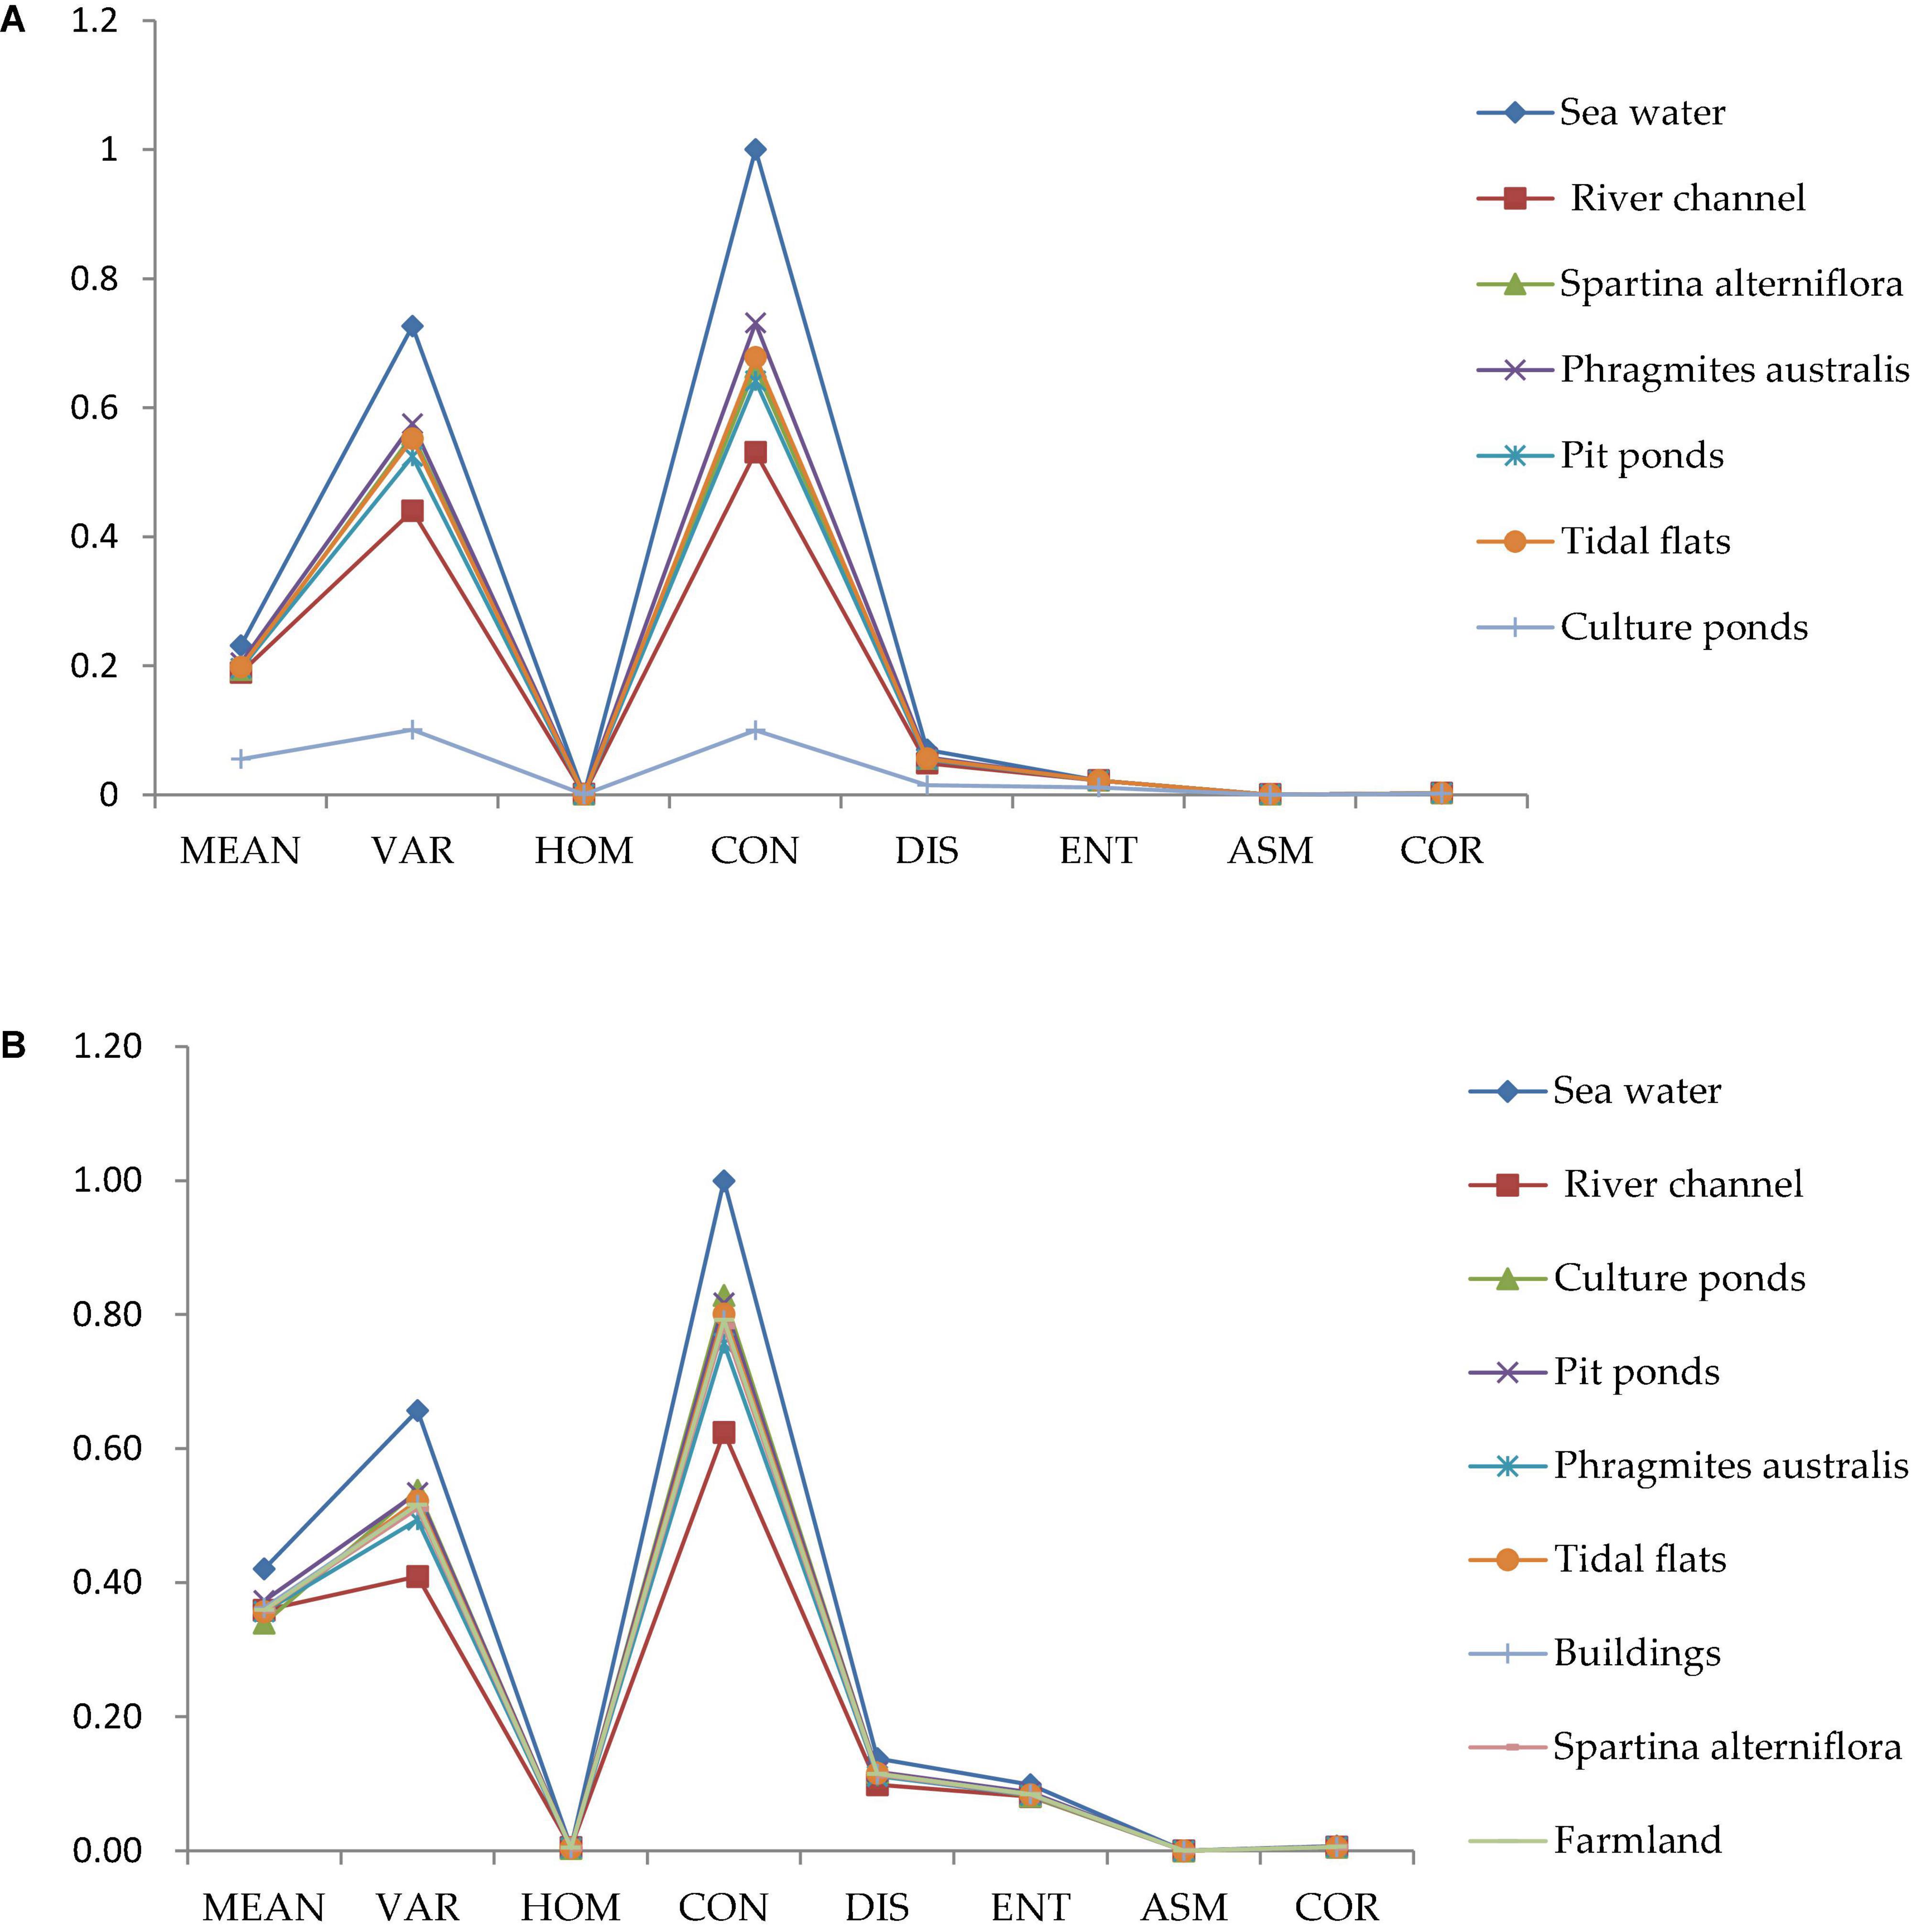
Figure 7. Statistics of the texture feature parameters. (A) Is the data of October 2017, (B) is the data of November 2018.
Figure 7 shows that among the eight texture feature parameters, the object types are significantly different among MEAN, VAR, and CON. Therefore, these three texture features were selected for subsequent classification processing. When considering the details, discrimination, and operation time for the ground objects, the direction was 45°, and the gray level was 32.
Principal Component Analysis Results
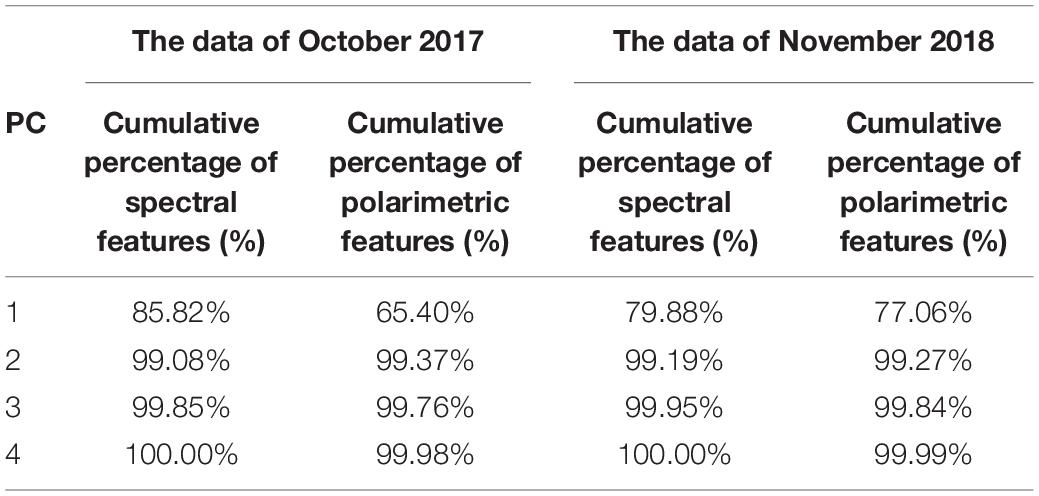
Because the four spectral features and the nine polarimetric features had data redundancy, PCA was performed on the two kinds of data separately. Afterward, the main feature information was obtained to extract the wetland objects. According to the statistical information for each component obtained by this process, the cumulative eigenvalue percent of the first four principal components of both the spectral and polarimetric features were close to 100%. The cumulative percentages of these eigenvalues are shown in Table 3.
According to the cumulative eigenvalue percent for each type in Table 3, the first two principal components of both the spectral and polarimetric features contain almost all the information. Therefore, the first two principal components of both the polarimetric and spectral features were combined to constitute the joint features.
The Classification Results
To verify the effectiveness of our proposed method, RF classification based on only the GF-3 polarimetric features or the Sentinel-2A spectral features were also used. These were compared with the RF classification based on the joint features. The results are shown in Figure 8.
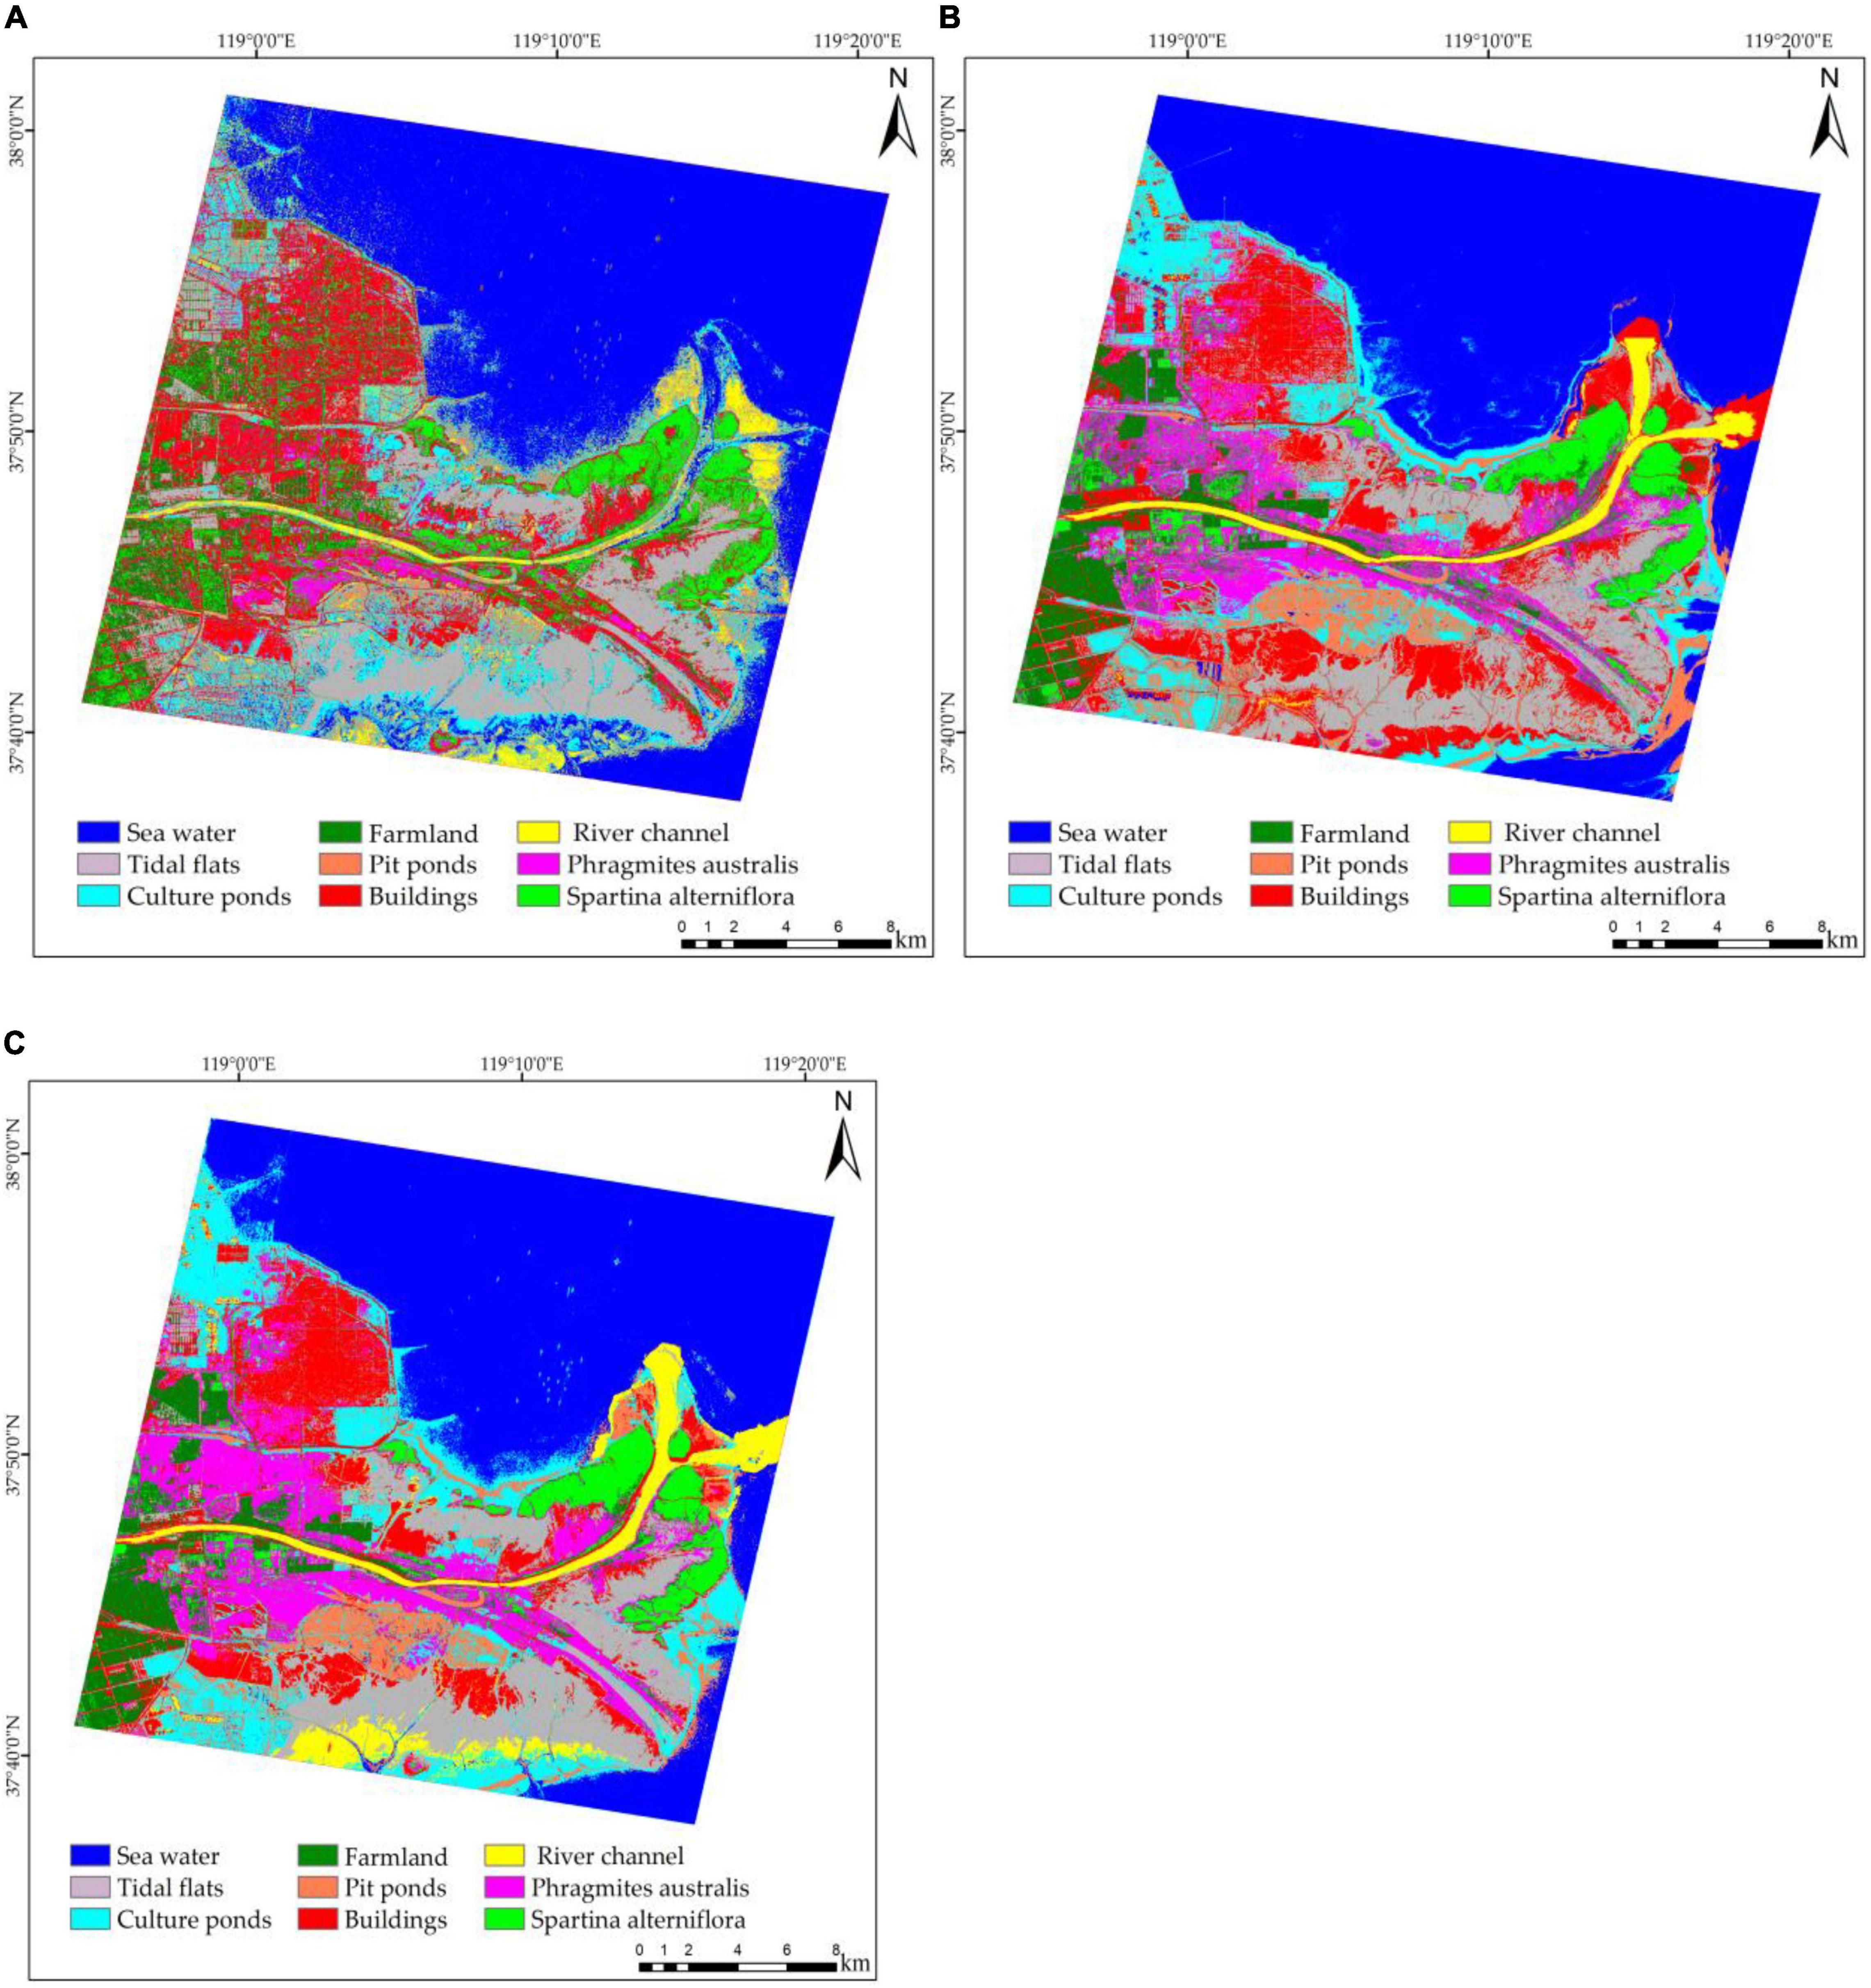
Figure 8. RF classification results based on different features using November 2018 data: (A) The RF with polarimetric features; (B) The RF with spectral features; and (C) The RF with joint features.
Comparative Analysis of Different Features
Based on the RF classification of different features (only polarimetric features, only spectral features, and joint features), the producer accuracies, user accuracies, overall accuracies, and Kappa coefficients for wetland objects were statistically analyzed; the results are shown in Table 4.
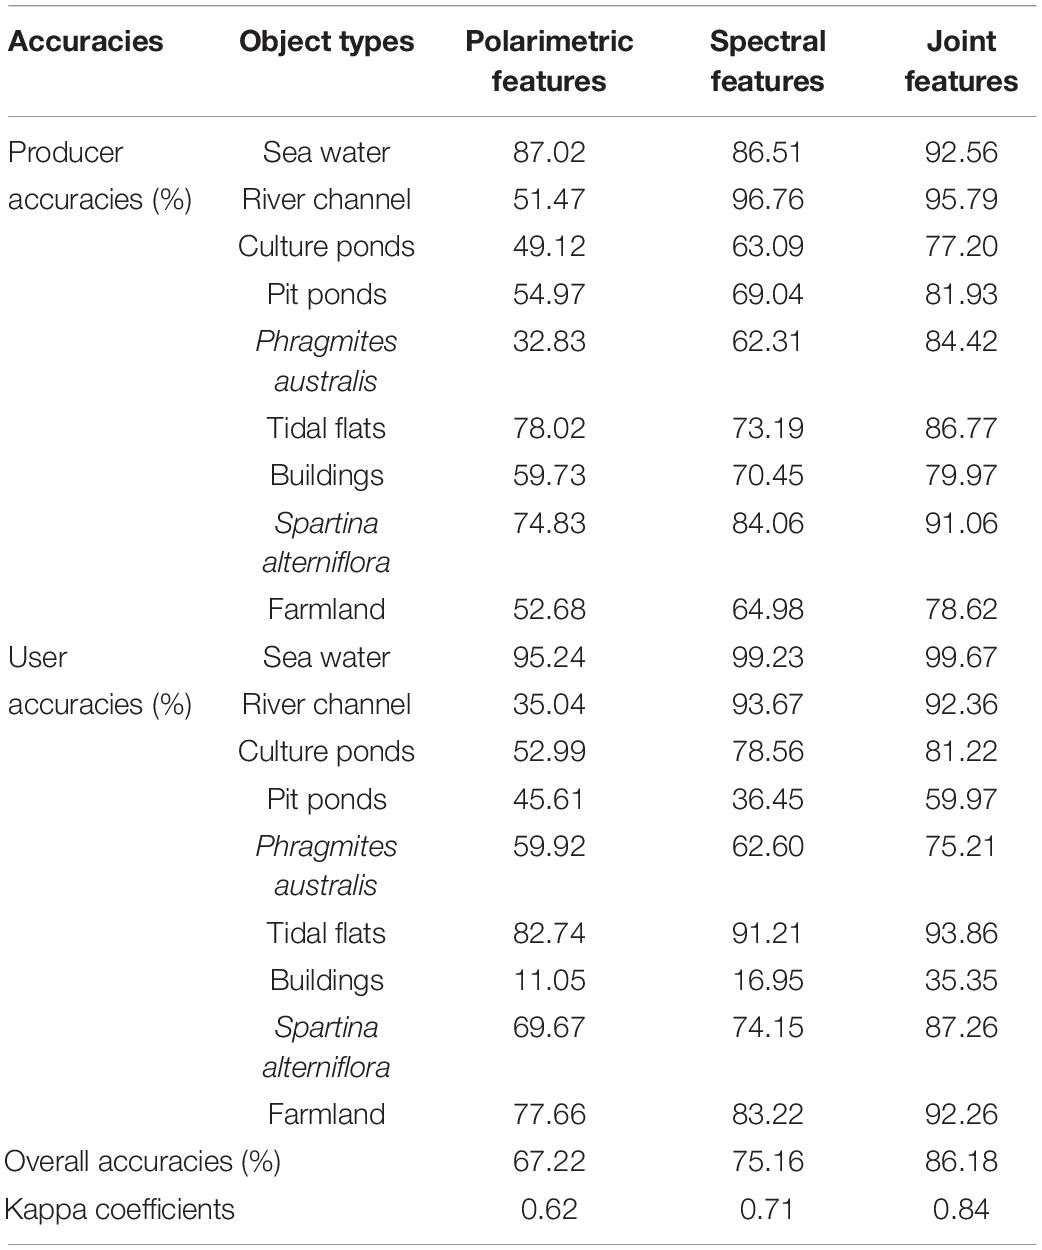
Table 4. Wetland object type extraction accuracies of November 2018 data for RF classification using different features.
As shown in Table 4, the RF classification based on joint features had the highest accuracy, with the overall accuracy of 86.18% and Kappa coefficient of 0.84. These values are 18.96% and 0.22 higher than those using only polarimetric features. Additionally, the overall accuracy and Kappa coefficient of the RF classification with joint features was 11.02% and 0.13 higher, respectively, than those of the classification using only Sentinel-2A spectral features. For specific wetland objects, the classification accuracy of the joint features was the highest. Among all the wetland object types, the producer accuracies for sea water, the river channel, and S. alterniflora were higher than 90%. The producer accuracy for the culture ponds by the joint features was 28.08% and 14.11% higher than that of only using polarimetric and only using spectral features, respectively. The producer accuracy of P. australis by the joint features was 84.42%, which was 51.59 and 22.11% higher than that of using only polarimetric and using only spectral features, respectively. When P. australis was extracted by polarimetric features only, most of it was mistakenly classified as a building, so the producer accuracy for polarimetric features was only 32.83%. The producer accuracy for P. australis with spectral features was 62.31%, which was 29.48% higher than that of the using only polarimetric features, because the confusion between buildings and P. australis was reduced to a certain extent; however, there was still confusion between farmland and S. alterniflora. The user accuracy of buildings based on the joint features was only 35.35%, which was due to the confusion between P. australis and buildings. In addition, some edges of bare land and culture ponds were classified as buildings. The producer accuracy of the joint features for buildings was 79.97%, which was 20.24% and 9.52% higher than that of using only polarimetric and using only spectral features, respectively. The producer accuracy for the tidal flats was 8.75% and 13.58% higher than that of only using polarimetric and only using spectral features, respectively, which was a 4.83% difference between the latter two. The producer accuracy of the joint features extraction for farmland was 78.62%, which was 25.94% and 13.64% higher than that of only using polarimetric and spectral features, respectively.
Comparing the results of RF classification using the different features, the overall classification accuracy and Kappa coefficient of the RF classification with the joint features was the highest. For all wetland object types, compared with only using polarimetric and only using spectral features, its producer accuracies were also the highest; therefore, the method proposed in this paper can accurately extract object types to achieve accurate monitoring of wetland objects in the Yellow River Delta.
Comparative Analysis Among Different Classification Methods
In addition, to verify the classification accuracy of the proposed method, three other classification methods, namely, SVM, MLC, and MDC, were used to extract the wetland object types based on the joint features, and their classification accuracies were compared with that of the classification algorithm proposed in this paper. The kernel type of SVM was radial basis function, and the gamma in kernel function was 0.5. The penalty parameter was set to 100. The MLC was to calculate the likelihood that a given pixel belongs to a certain training sample, and the pixel was finally merged into the category with the greatest likelihood. The MDC was to use the training sample data to calculate the center position of the class in the feature space and then calculated the distance from each pixel in the input image to the center of each type. The pixel was classified into the closest type. The classification results of SVM, MLC, and MDC based on joint features are shown in Figure 9.
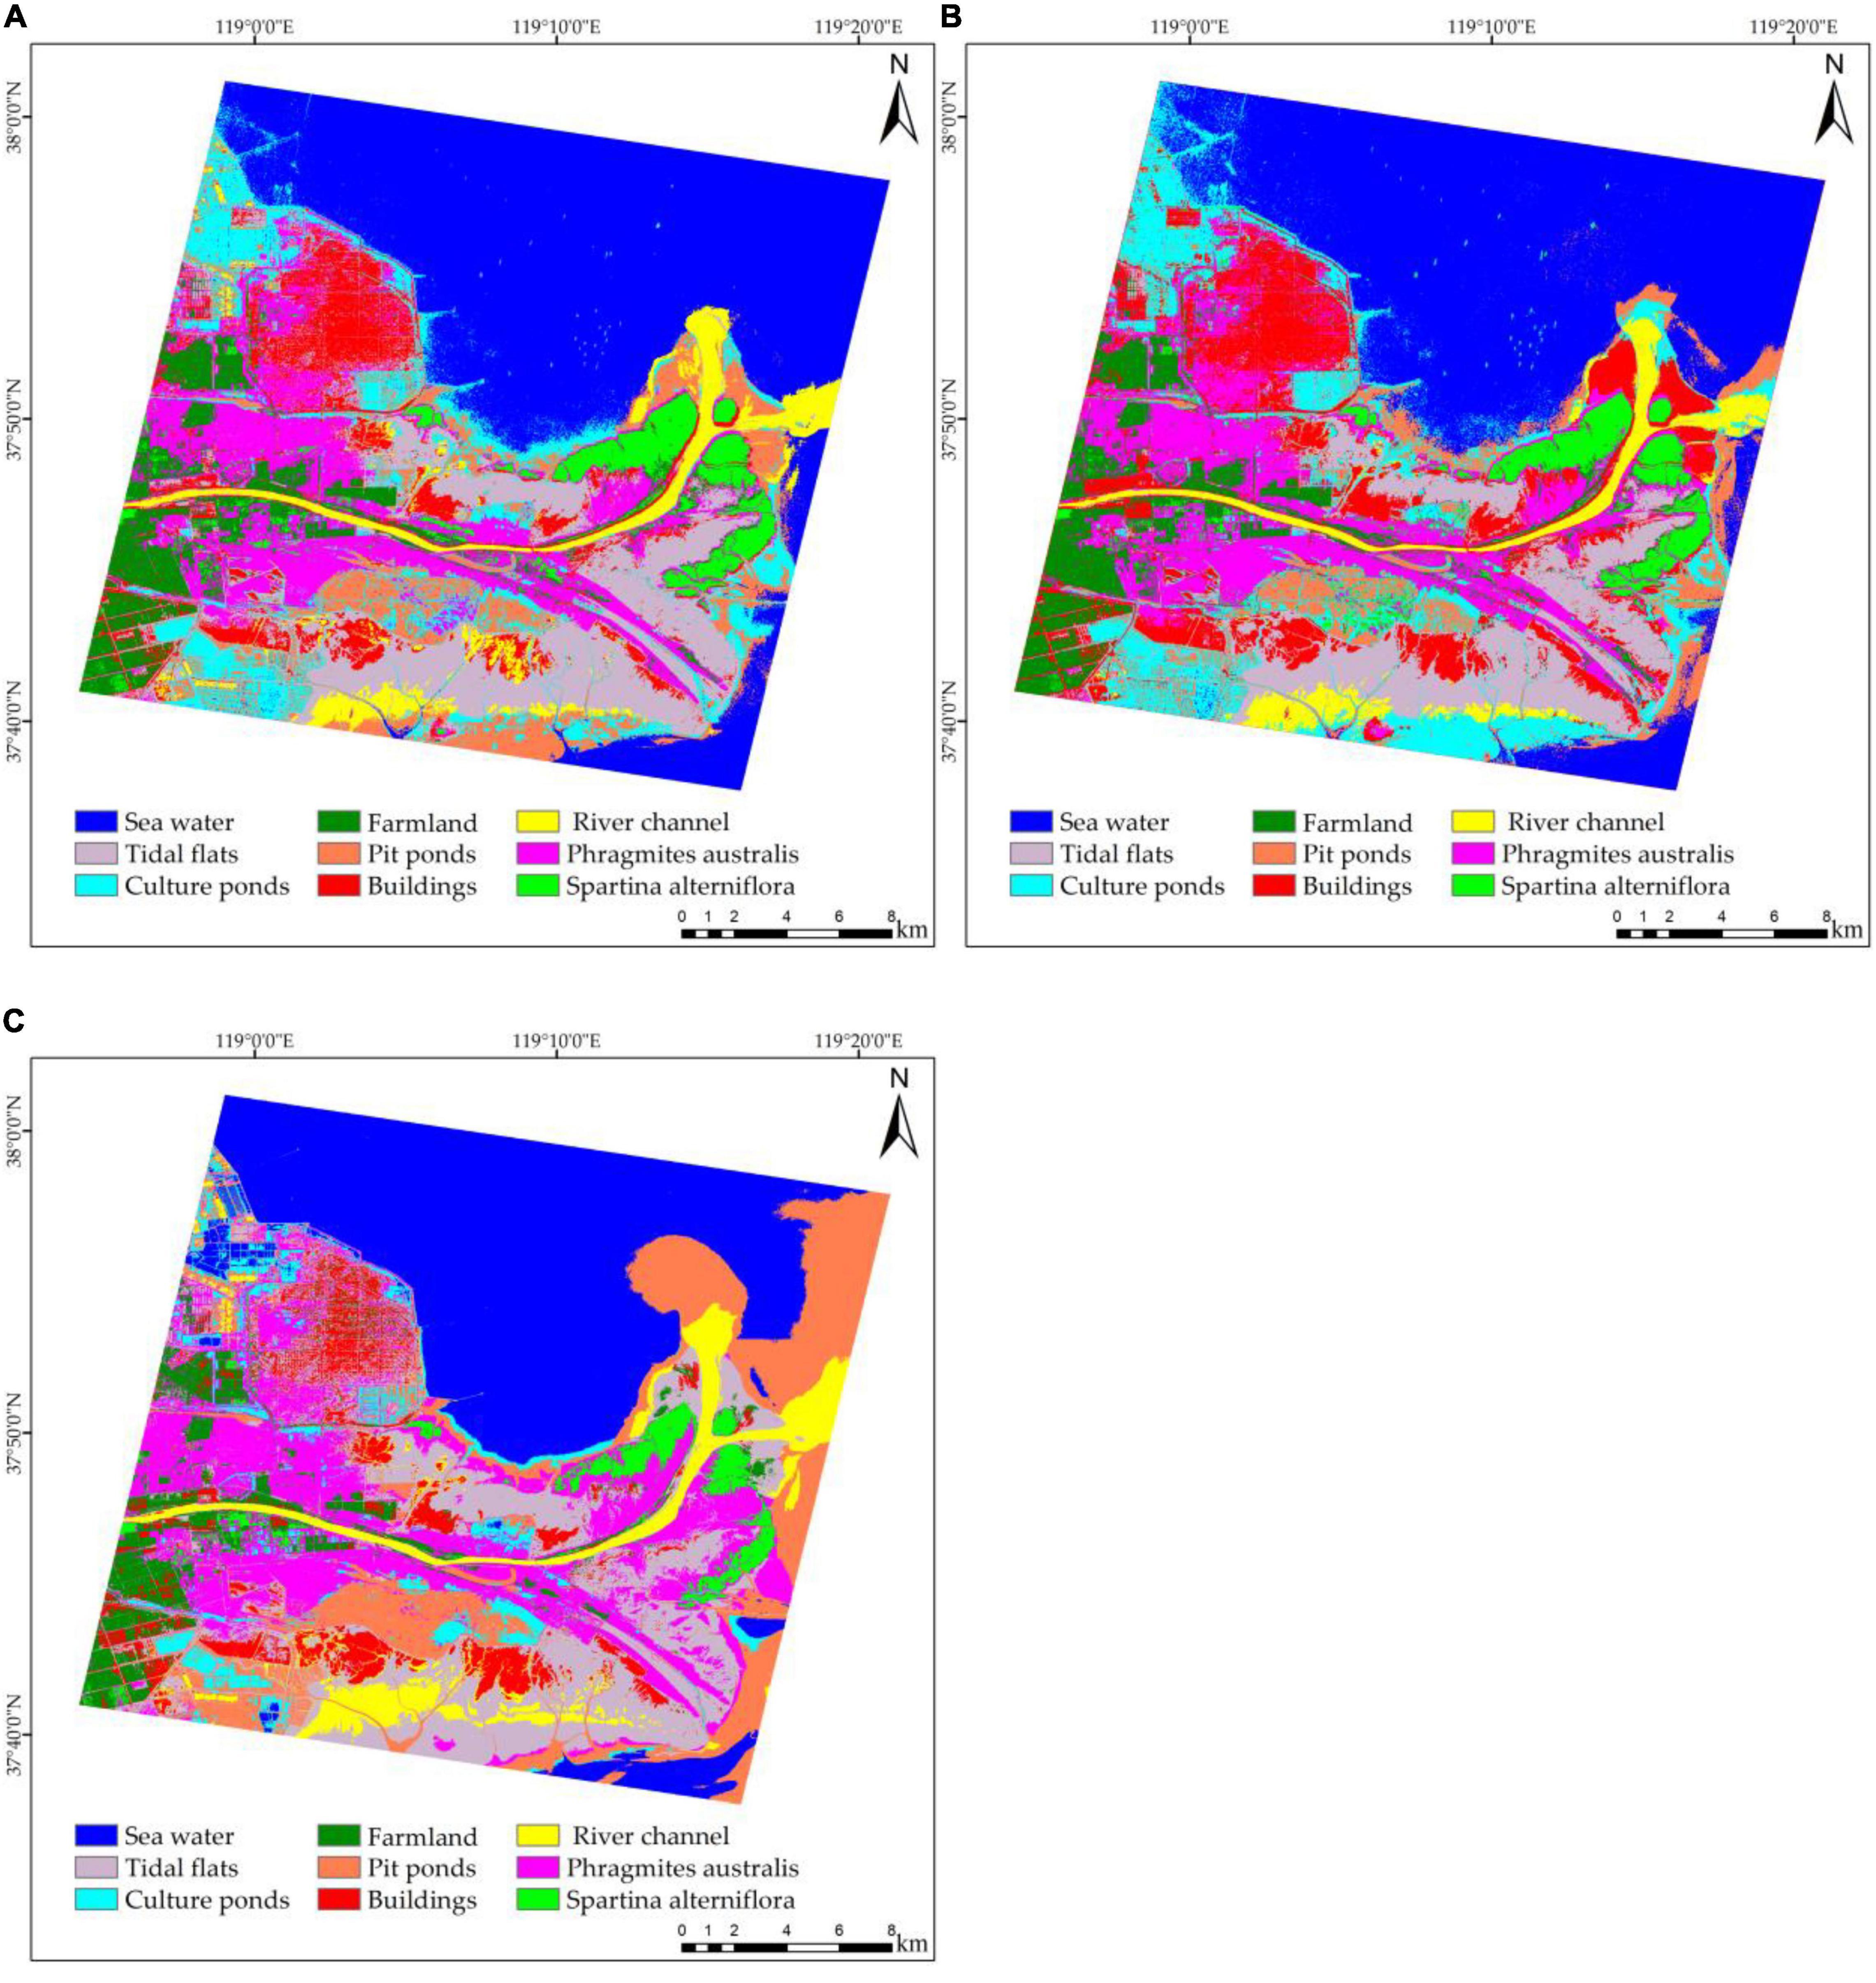
Figure 9. Results of different classification methods based on joint features using November 2018 data: (A) Support vector machine classification; (B) Maximum likelihood classification; and (C) Minimum distance classification.
Comparing and analyzing the different classification methods in Figure 9, the MDC was the least accurate. There was confusion among pit ponds, culture ponds, and sea water, and the extraction of vegetation was also very poor. The MLC also had large errors in the extraction of the object types in the wetland study area. The alluvial fan area in the estuary, formed by sediment accumulation from the Yellow River, was mistakenly classified as buildings, and this method confused P. australis, S. alterniflora, and buildings. The SVM and RF classification methods showed better overall performance in classifying wetland objects. To compare the advantages and disadvantages of the four classification methods, their classification accuracies are shown in Table 5.
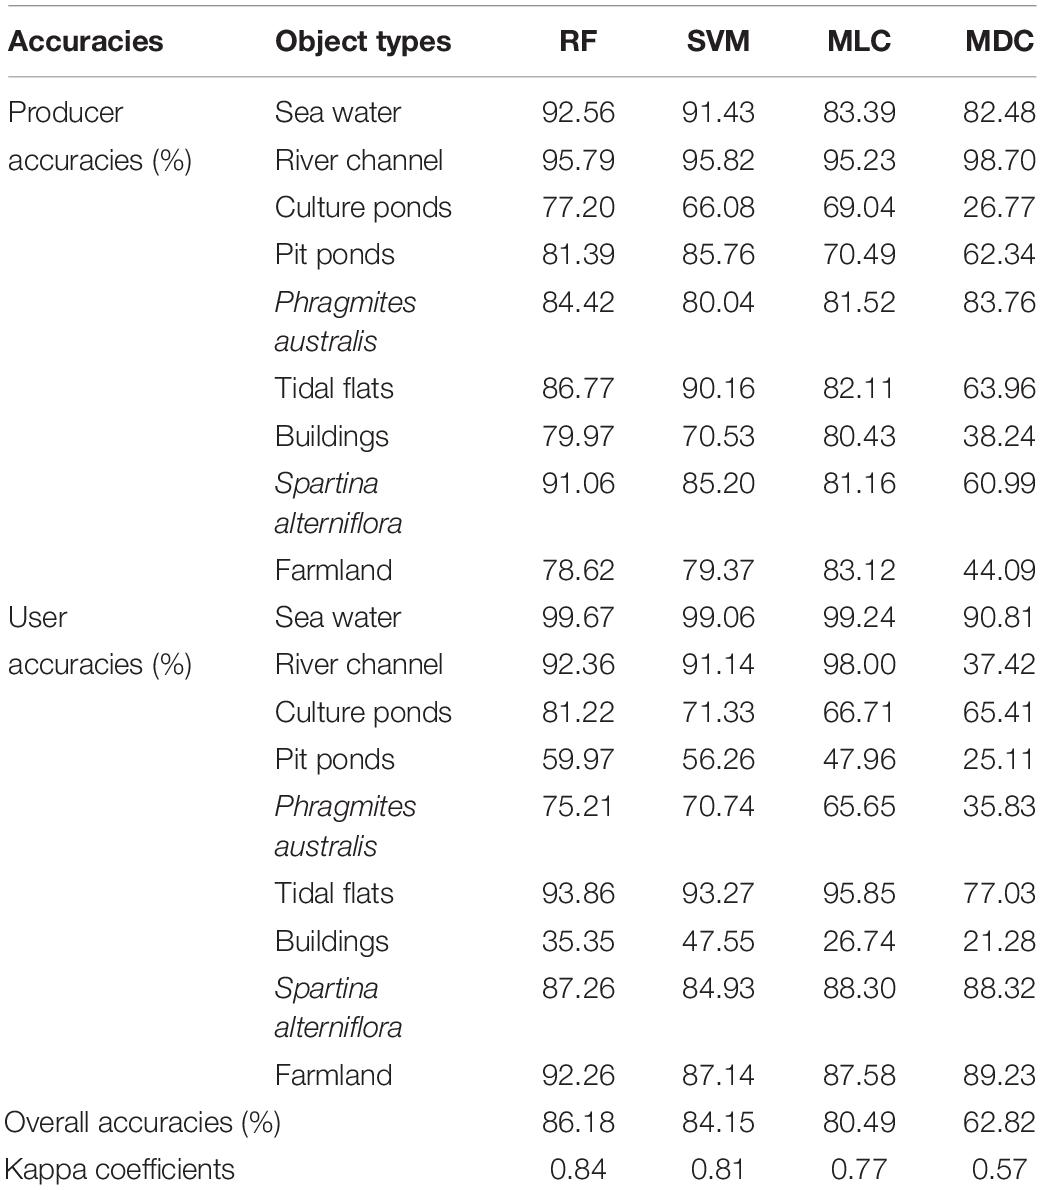
Table 5. Accuracies of the extraction of wetland object types of November 2018 data using different classification algorithms based on the joint features.
As shown in Table 5, the RF classification method proposed in this paper had the best extraction effect for objects in the Yellow River Delta wetland, with the overall accuracy and kappa coefficient of 86.18% and 0.84, respectively. Compared with the SVM, MLC, and MDC, its overall accuracy was 2.03, 5.69, and 23.36% higher, respectively, and its Kappa coefficient was 0.03, 0.07, and 0.27 higher, respectively. Although the MLC had the highest producer accuracies for farmland and buildings, and its producer accuracy for P. australis was 1.48% higher than that of SVM classification, its producer accuracies for sea water, culture ponds, tidal flats, and S. alterniflora were lower than those of SVM and RF classification. The producer accuracies of the RF classification were slightly lower than those of the SVM classification for the river channel, pit ponds, tidal flats, and farmland. However, its producer accuracies for sea water, culture ponds, P. australis, buildings, and S. alterniflora were 1.13, 11.12, 4.38, 9.44, and 5.86% higher. Furthermore, RF classification took 27 min, which was less than SVM classification took 39 min. Therefore, the RF classification algorithm based on the joint features had the highest extraction accuracies for objects in the Yellow River Delta wetland, compared to SVM, MLC, and MDC methods.
Experimental Verification
Using GF-3 and Sentinel-2A data in November 2018, different features and different classification methods were used to extract wetland objects. It was proved that RF classification combined with polarimetric and spectral features can improve the accuracy of wetland monitoring. In order to further prove the effectiveness of the proposed method, GF-3 and Sentinel-2B data in October 2017 were selected for experimental verification.
October 2017 data processing method was the same as that of the November 2018 data. The feature extraction results of October 2017 and November 2018 data were presented in the same figure, distinguished by different letters. Due to the different coverage of GF-3 data, there were different types of wetland objects in the experimental verification. Comparing Figures 3A,B, it can be seen that the images in 2017 basically do not include buildings and farmland. Therefore, the wetland objects were divided into seven main types: the river channel, sea water, pit ponds, culture ponds, P. australis, tidal flats and S. alterniflora.
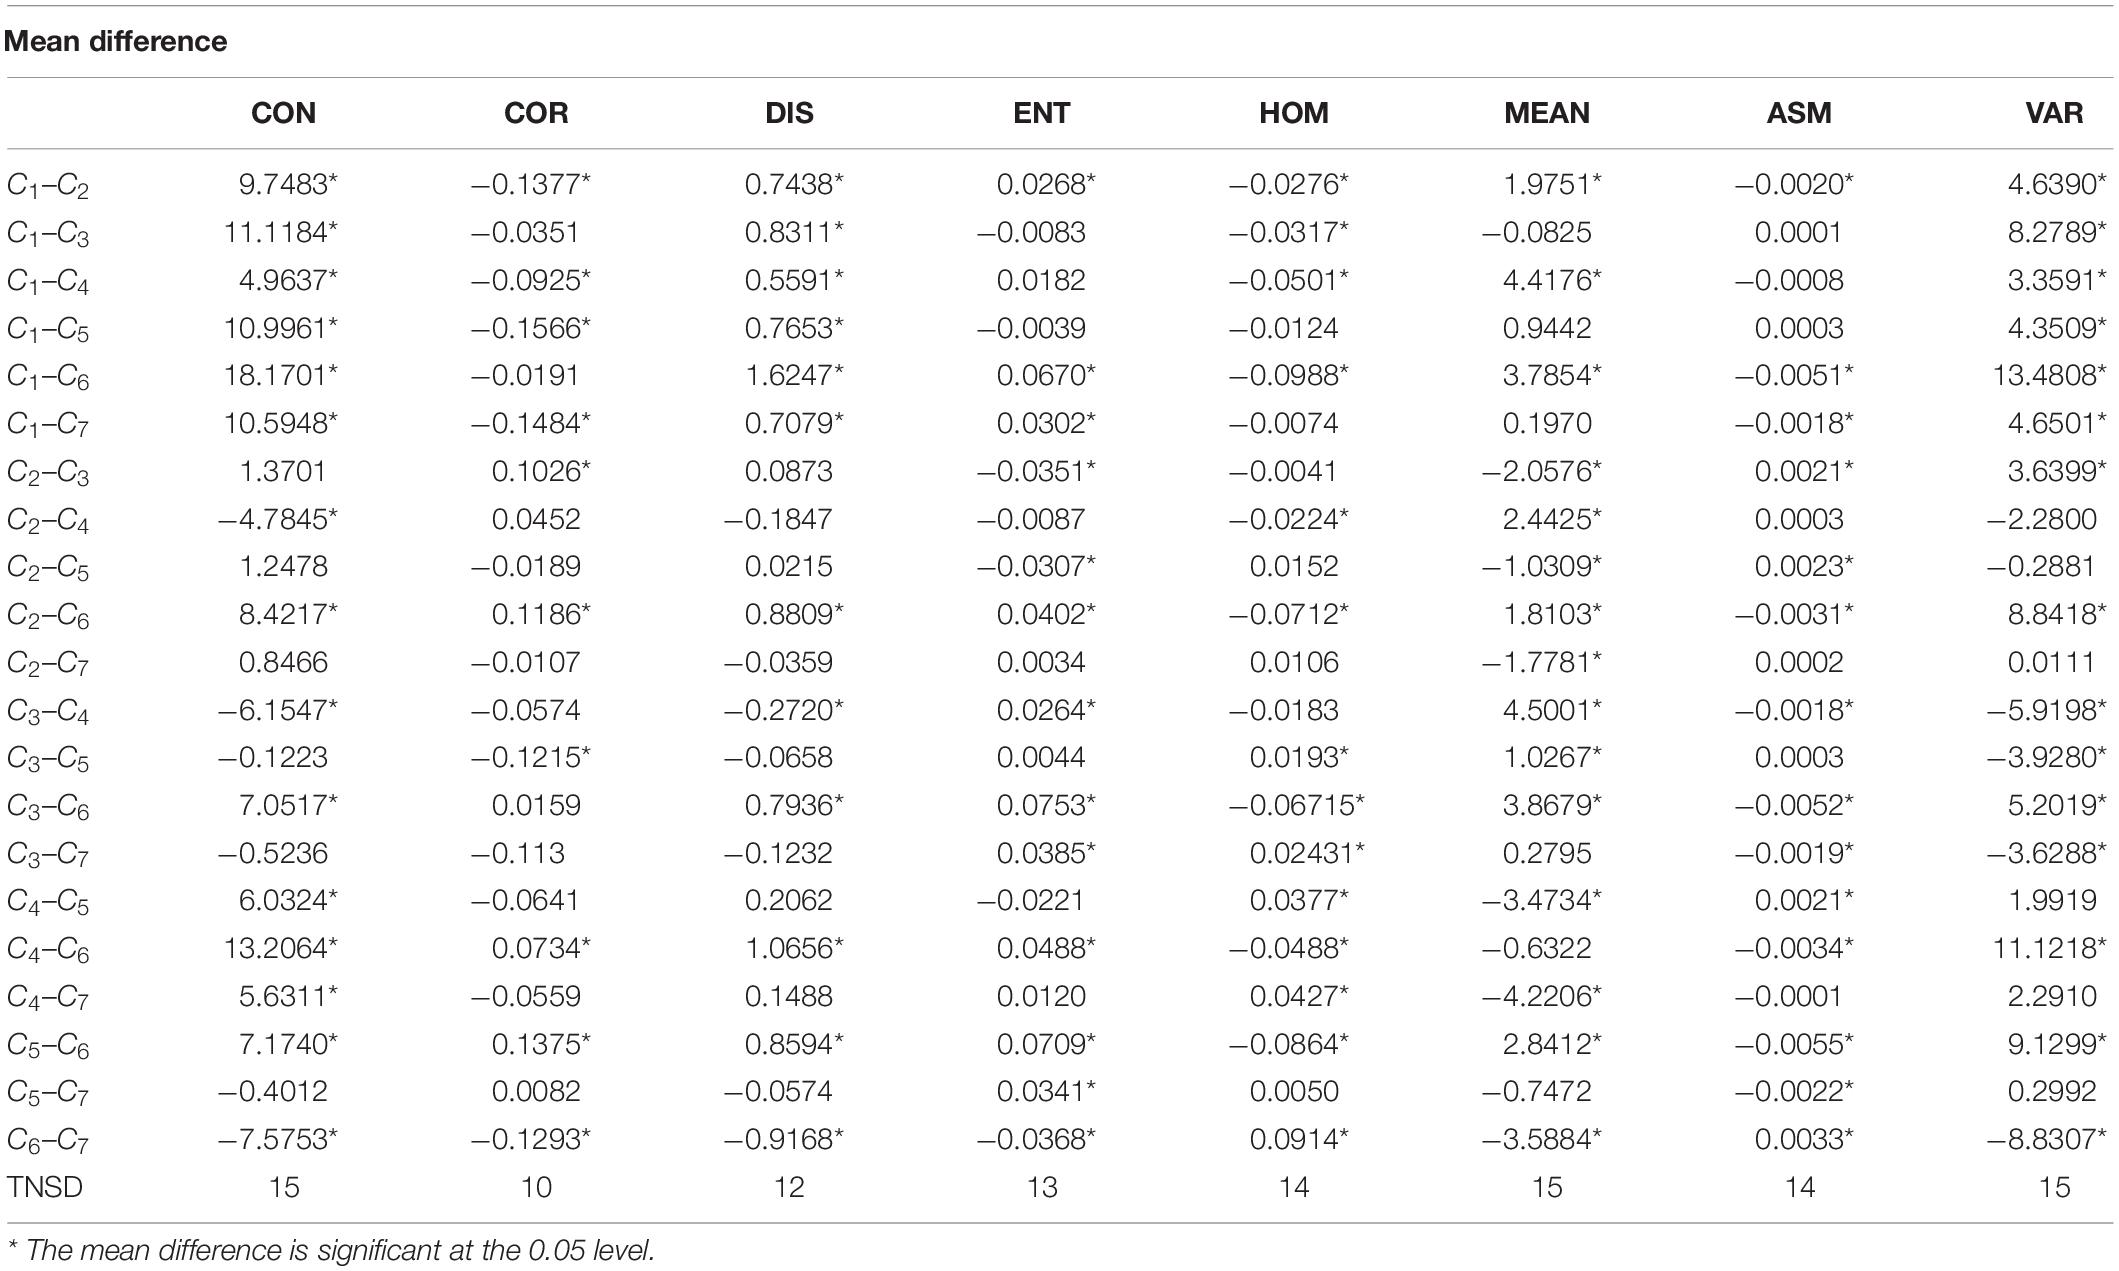
Furthermore, in order to prove that the selection of texture features was feasible, we took the polarimetric SAR data in October 2017 as an example to obtain the values of texture features of 225 pixels and provided the box-plots. The box-plots are shown in Figure 10. Compare with Figure 7B, from Figure 10 we can not only obtain the mean value of texture features, but also the distribution range, median and outliers of the texture features. It can be seen from Figure 10 that there are differences among the four texture features of CON, DIS, MEAN, and VAR. Combining Figures 7B, 10H, we can find that there are large differences between CON, MEAN, and VAR. We used Tukey’s HSD post hoc test for the significance in differences among mean values and confidence level was set to 0.05. The statistics of Tukey’s HSD post test results are shown in Table 6. For convenience of expression, the object types in Table 6 were represented by Ci. The C1, C2, C3, C4, C5, C6, and C7 represent seawater, Yellow River, S. alterniflora, pit ponds, P. australis, tidal flats and culture ponds, respectively. Ci-Cj represents the mean value of Ci minus the mean value of Cj. We judged whether the feature can effectively distinguish the wetland objects by comparing the total number of significant differences (TNSD) in the mean value of different wetland objects under the same texture feature. From the value of TNSD in Table 6, it can be seen that the three polarimetric texture features of CON, MEAN, and VAR can better distinguish the types of wetland objects. Therefore, it proved the reliability of Figure 7B by Tukey’s HSD post hoc test.
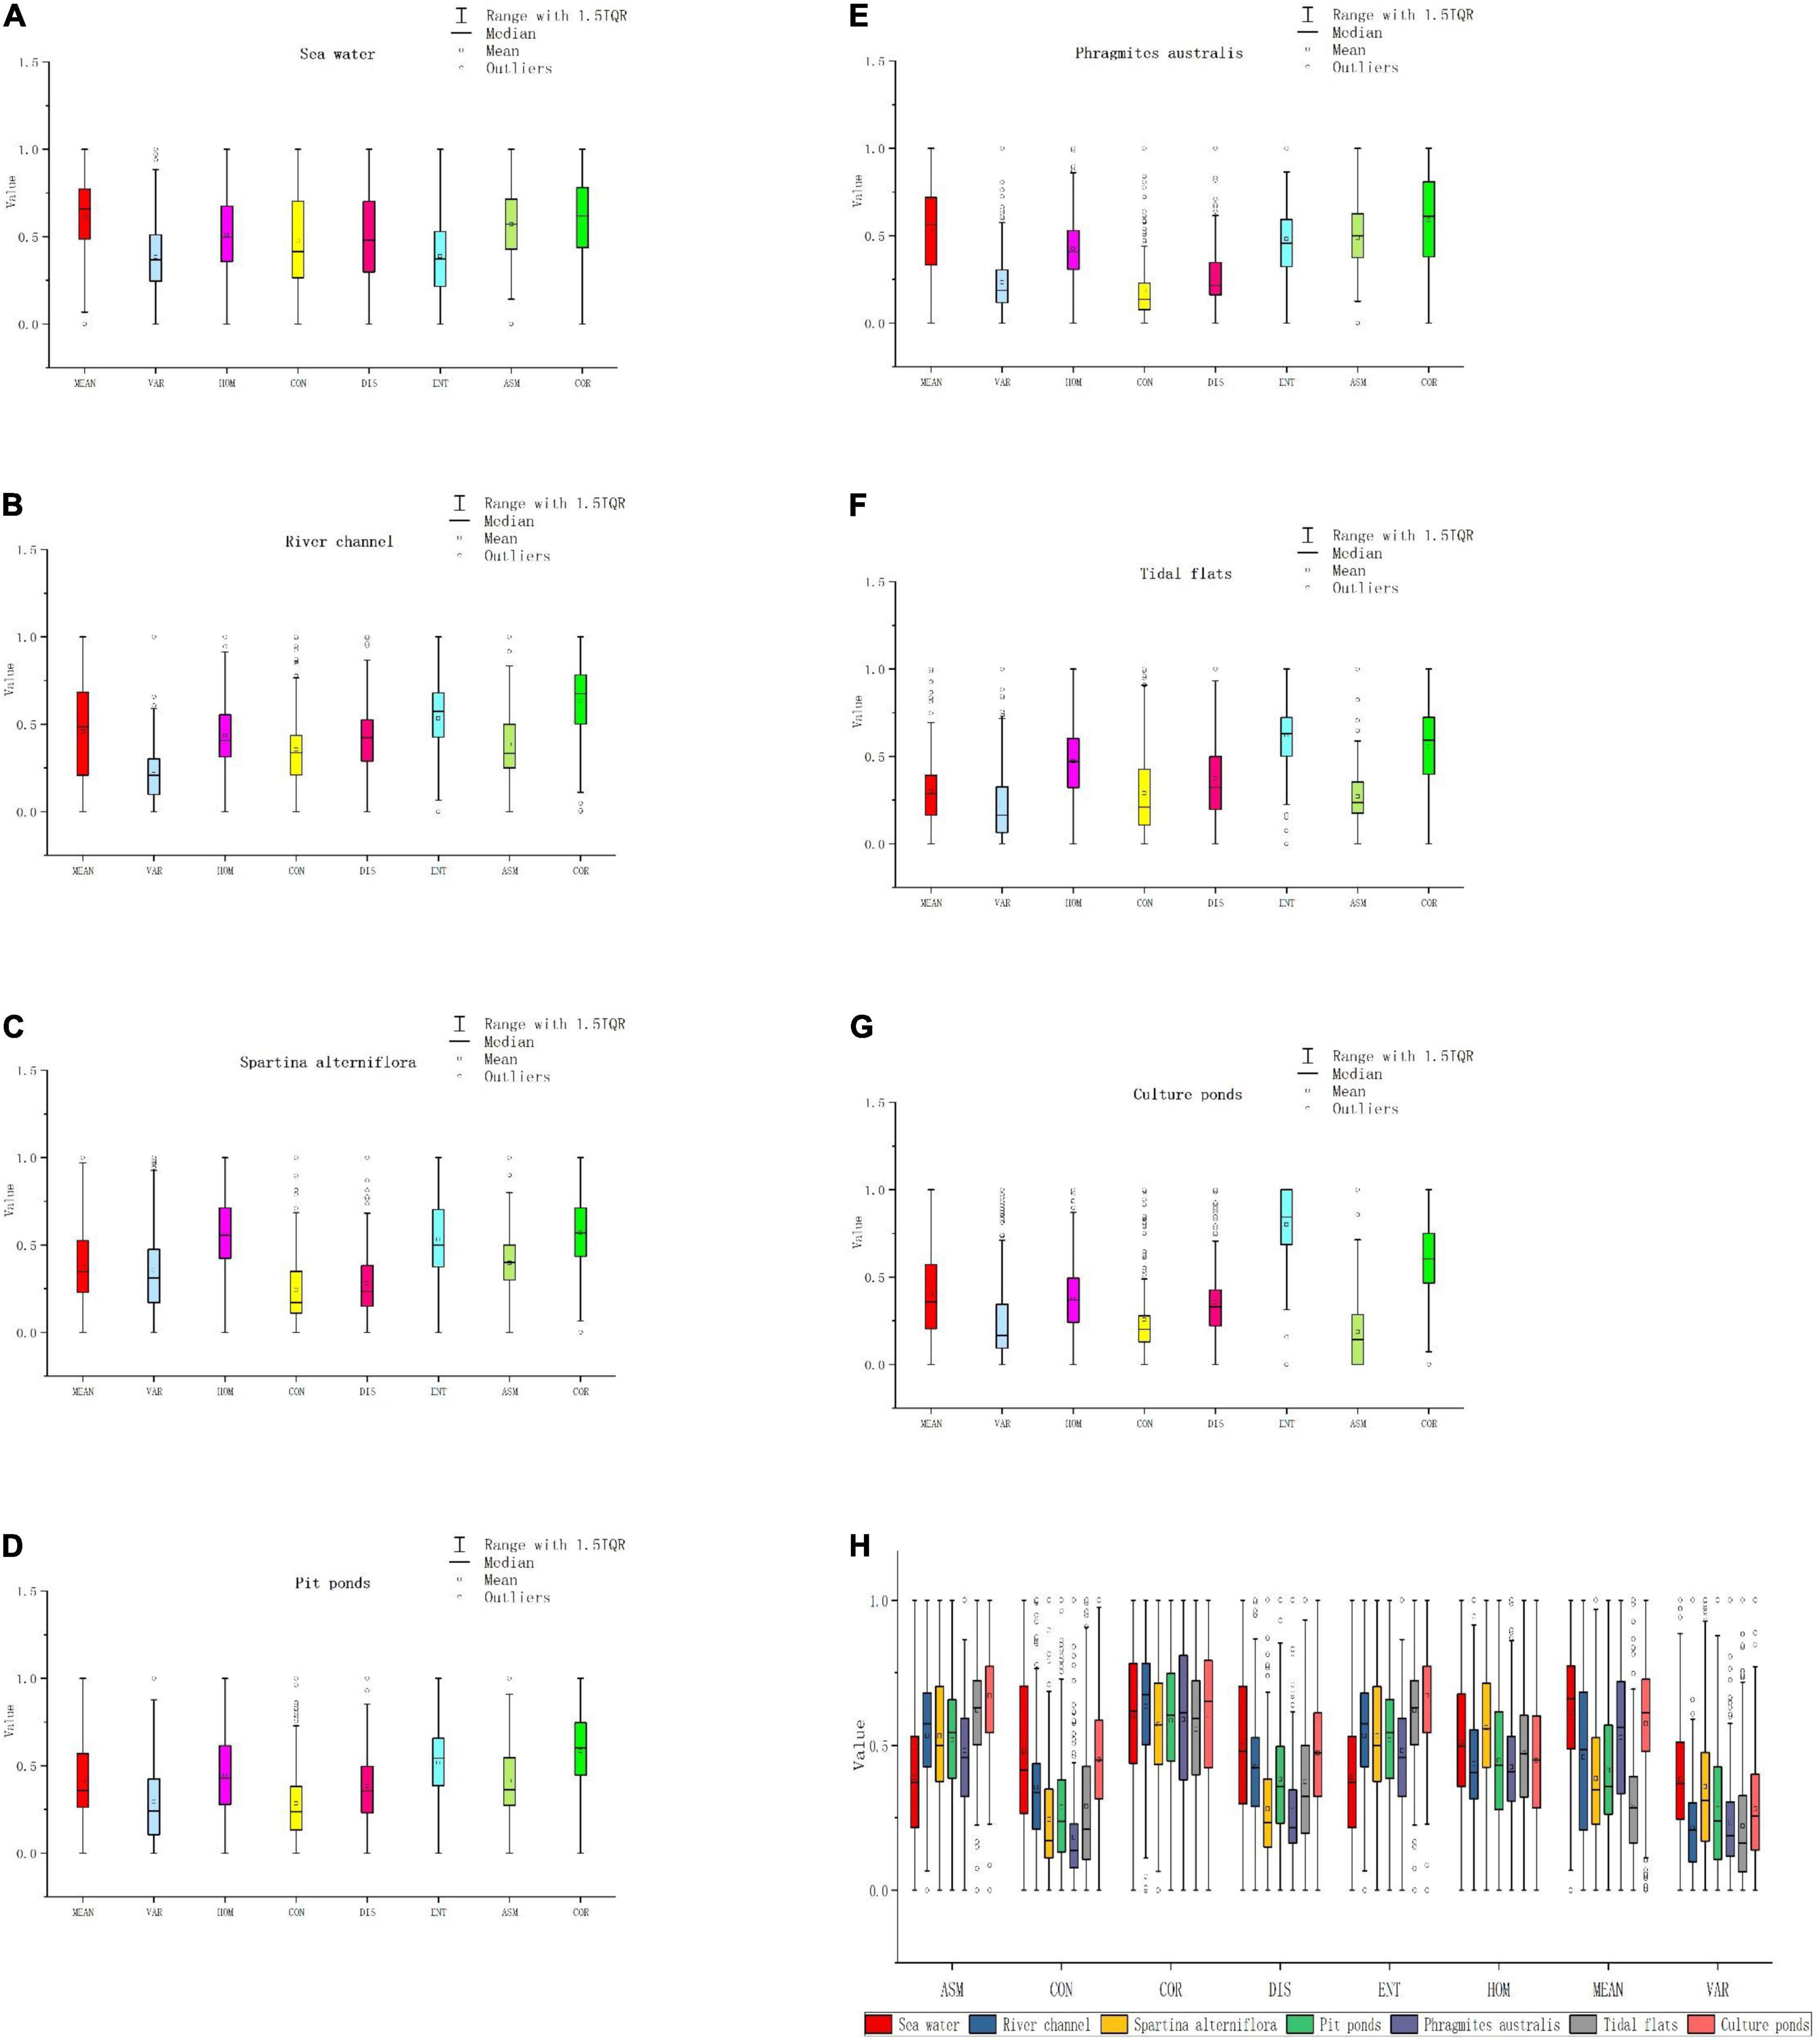
Figure 10. Box-plots of polarimetric texture features. (A–G) Represent the eight texture feature box plots of sea water, river channel, S. alterniflora, pit ponds, P. australis, tidal flats and culture ponds, respectively. (H) Is the box-plot of eight texture features of different objects.
Considering the poor accuracy of the MDC based on the data of November 2018, we only select three classification methods in the experimental verification: RF, SVM, and MLC. The classification results of RF with different features were shown in the Figure 11, and the classification results of different classification methods were shown in the Figure 12.
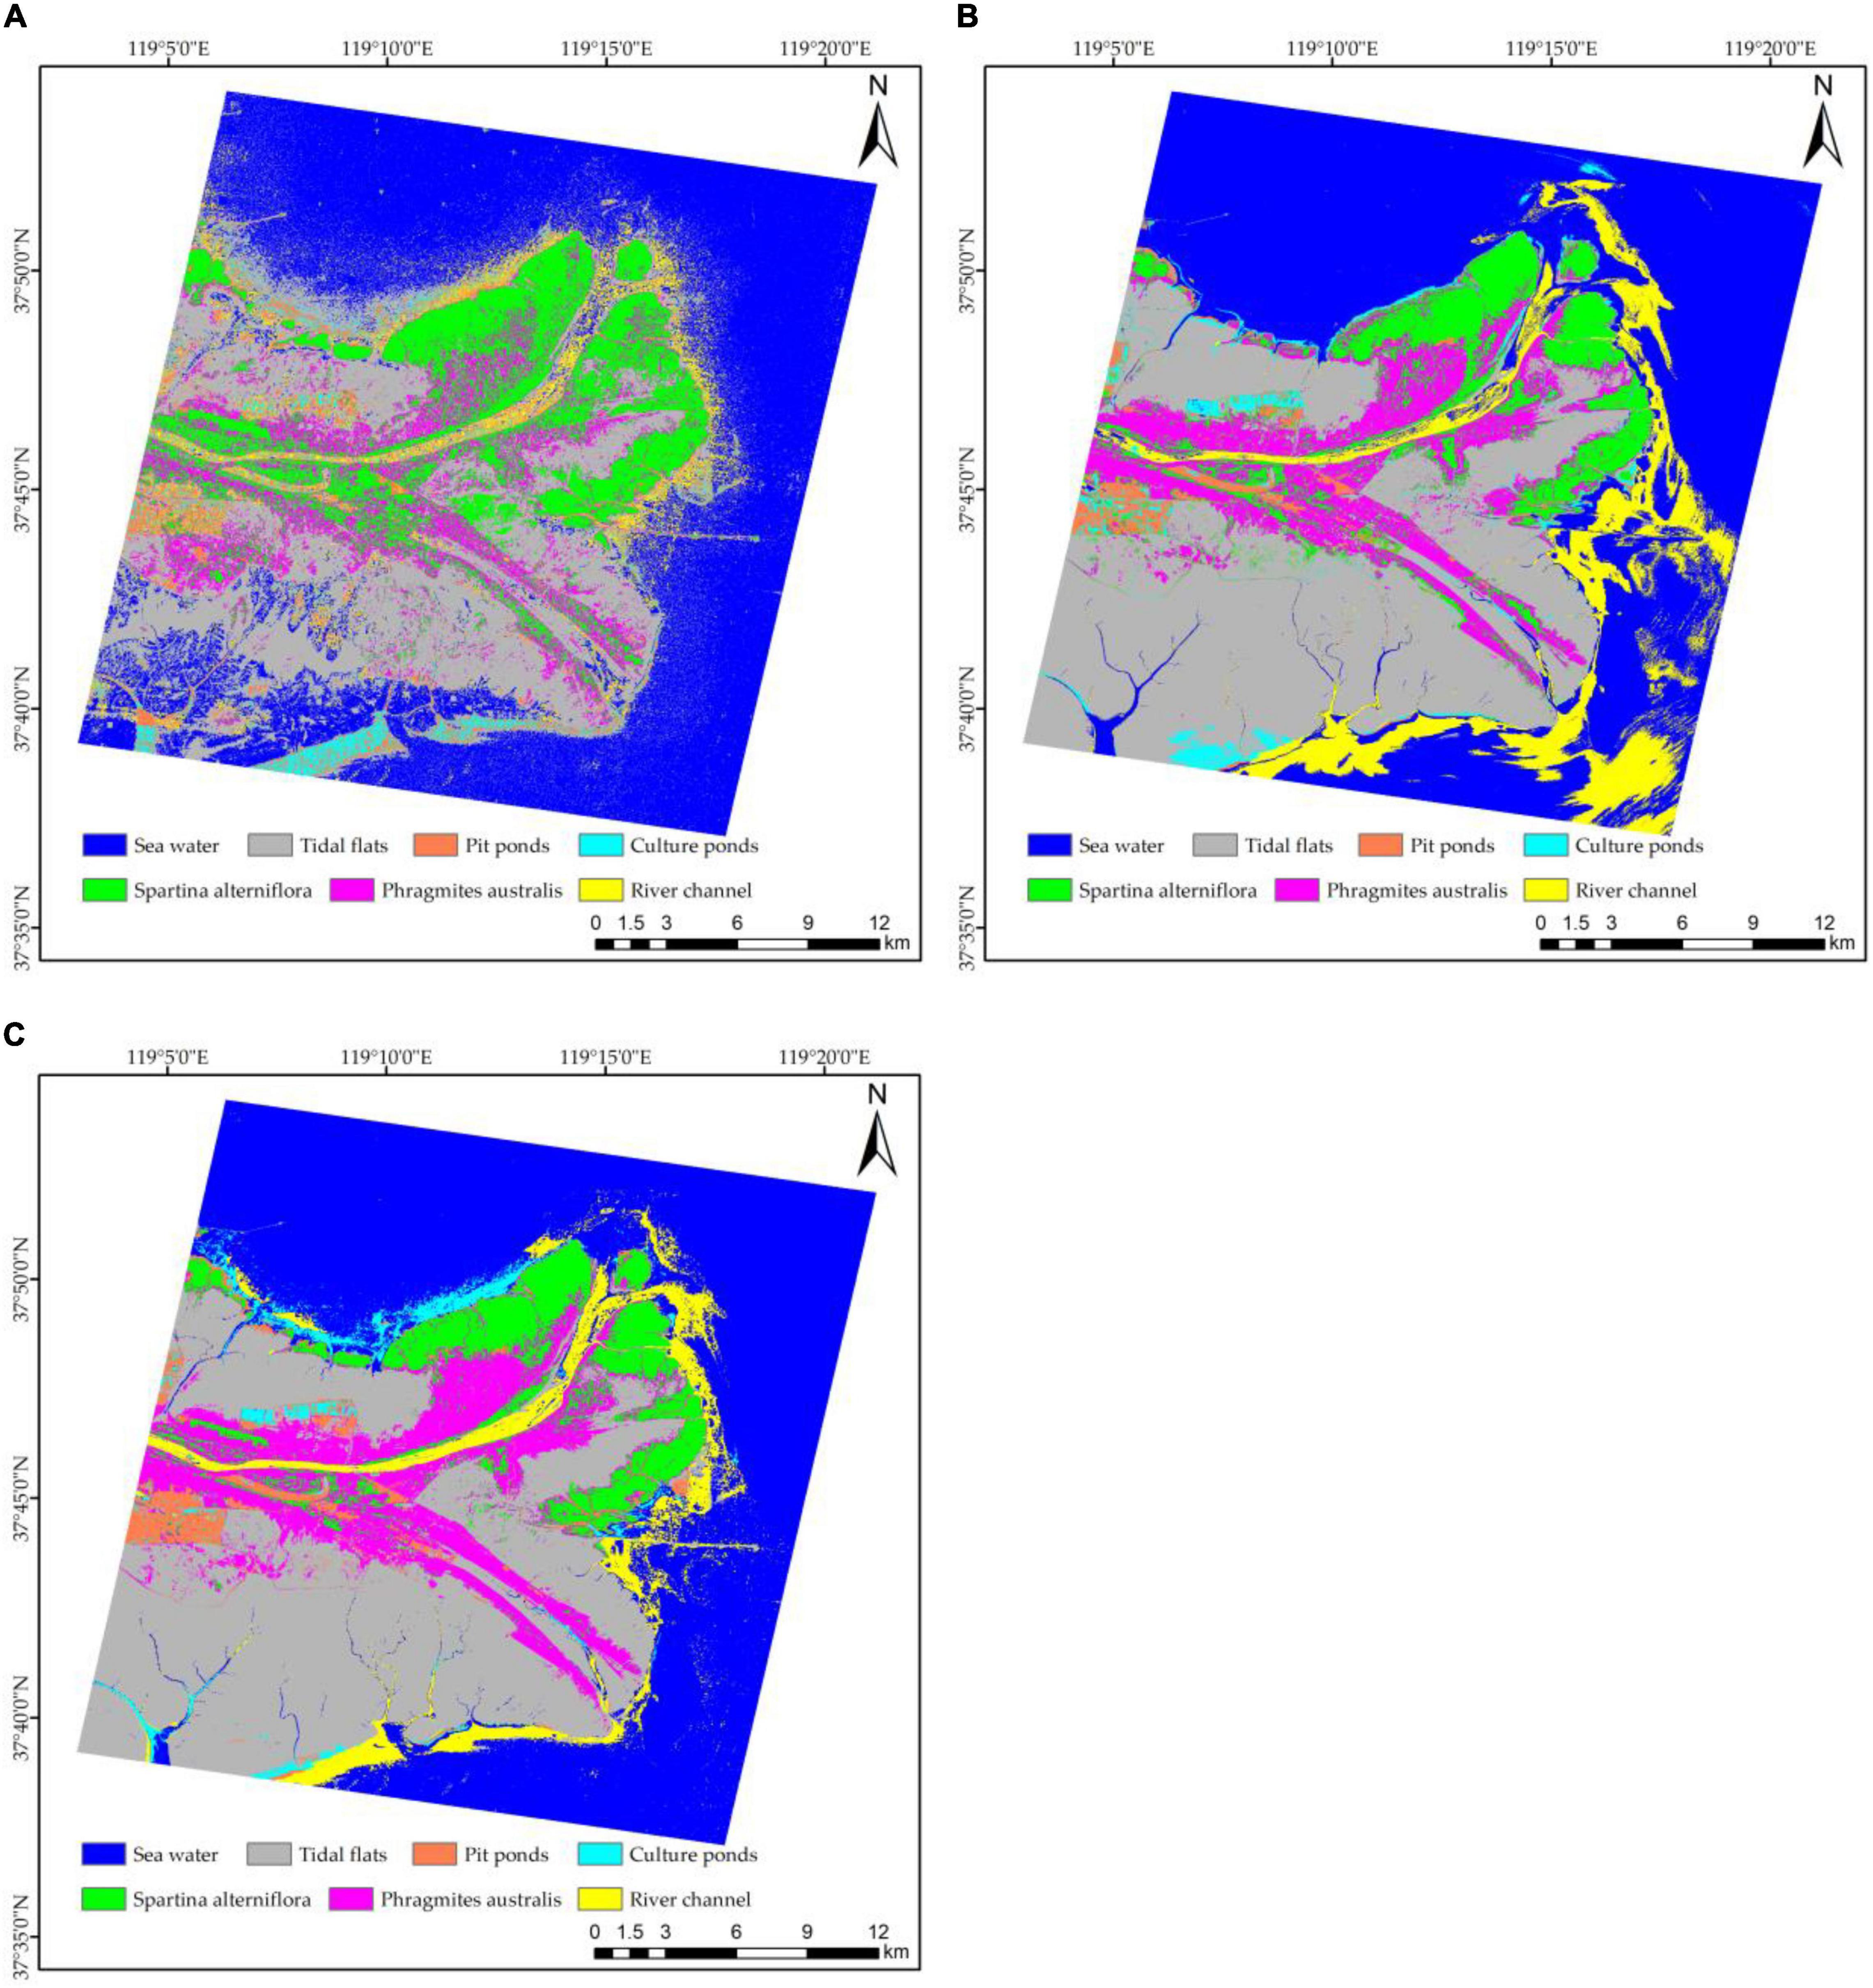
Figure 11. RF classification results based on different characteristics using October 2017 data: (A) The RF with polarimetric features; (B) The RF with spectral features; and (C) The RF with joint features.
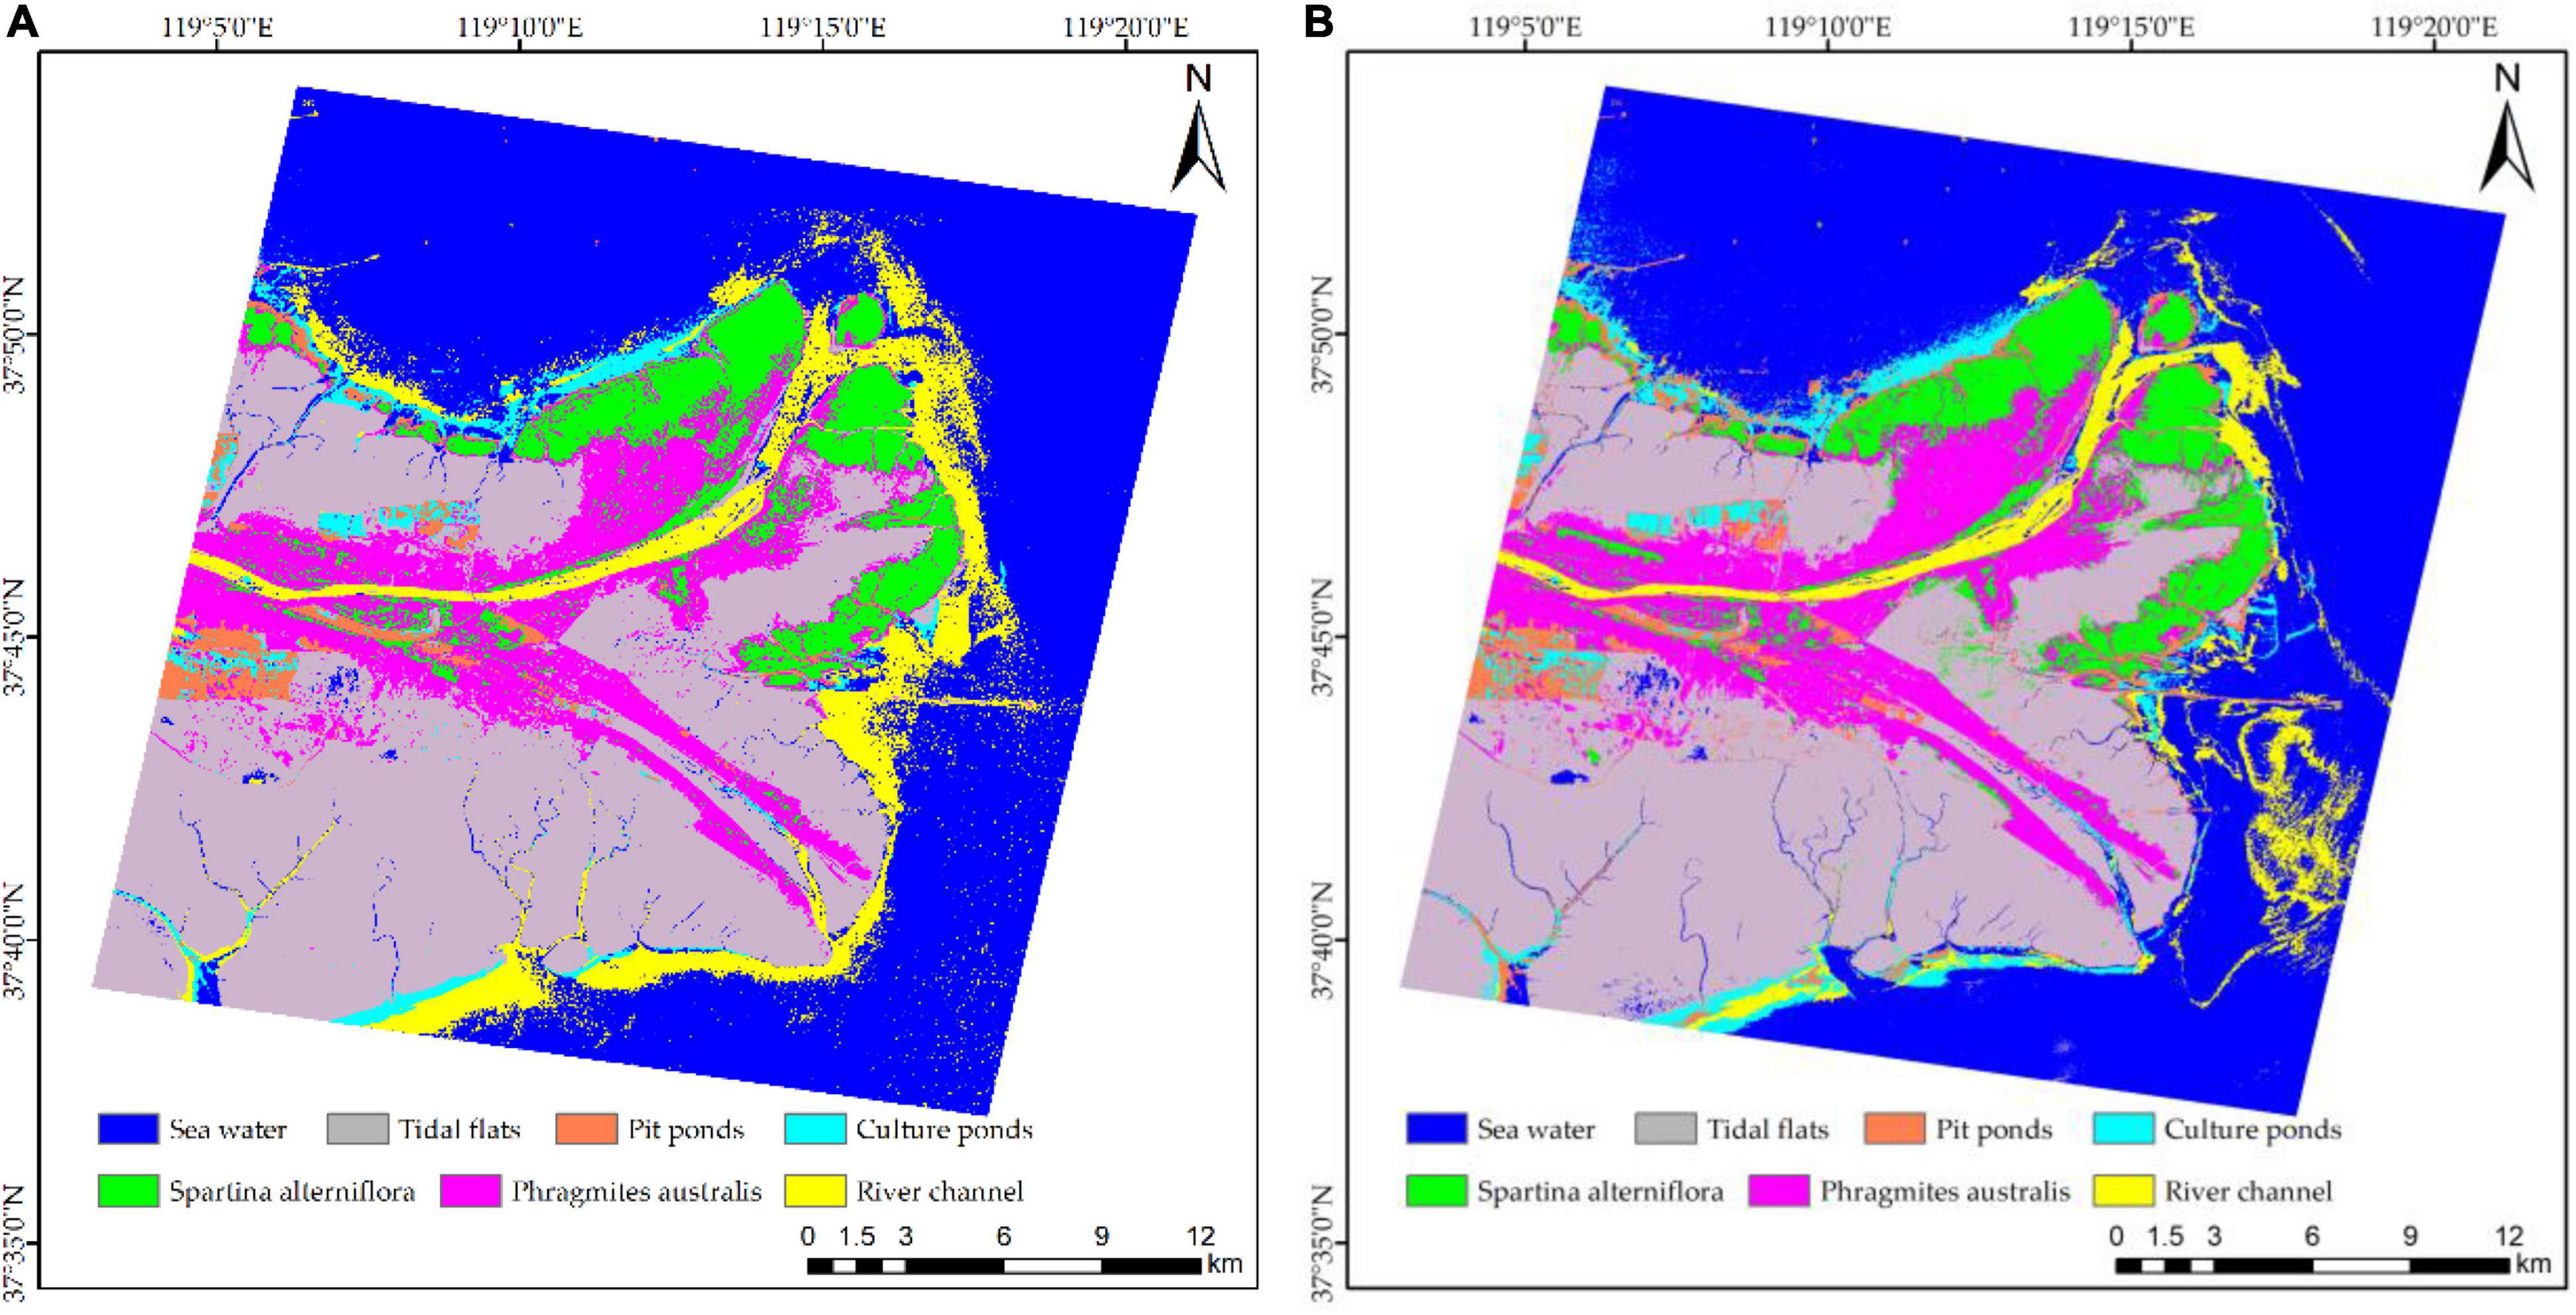
Figure 12. Results of different classification methods based on joint features using October 2017 data: (A) Support vector machine classification; (B) Maximum likelihood classification.
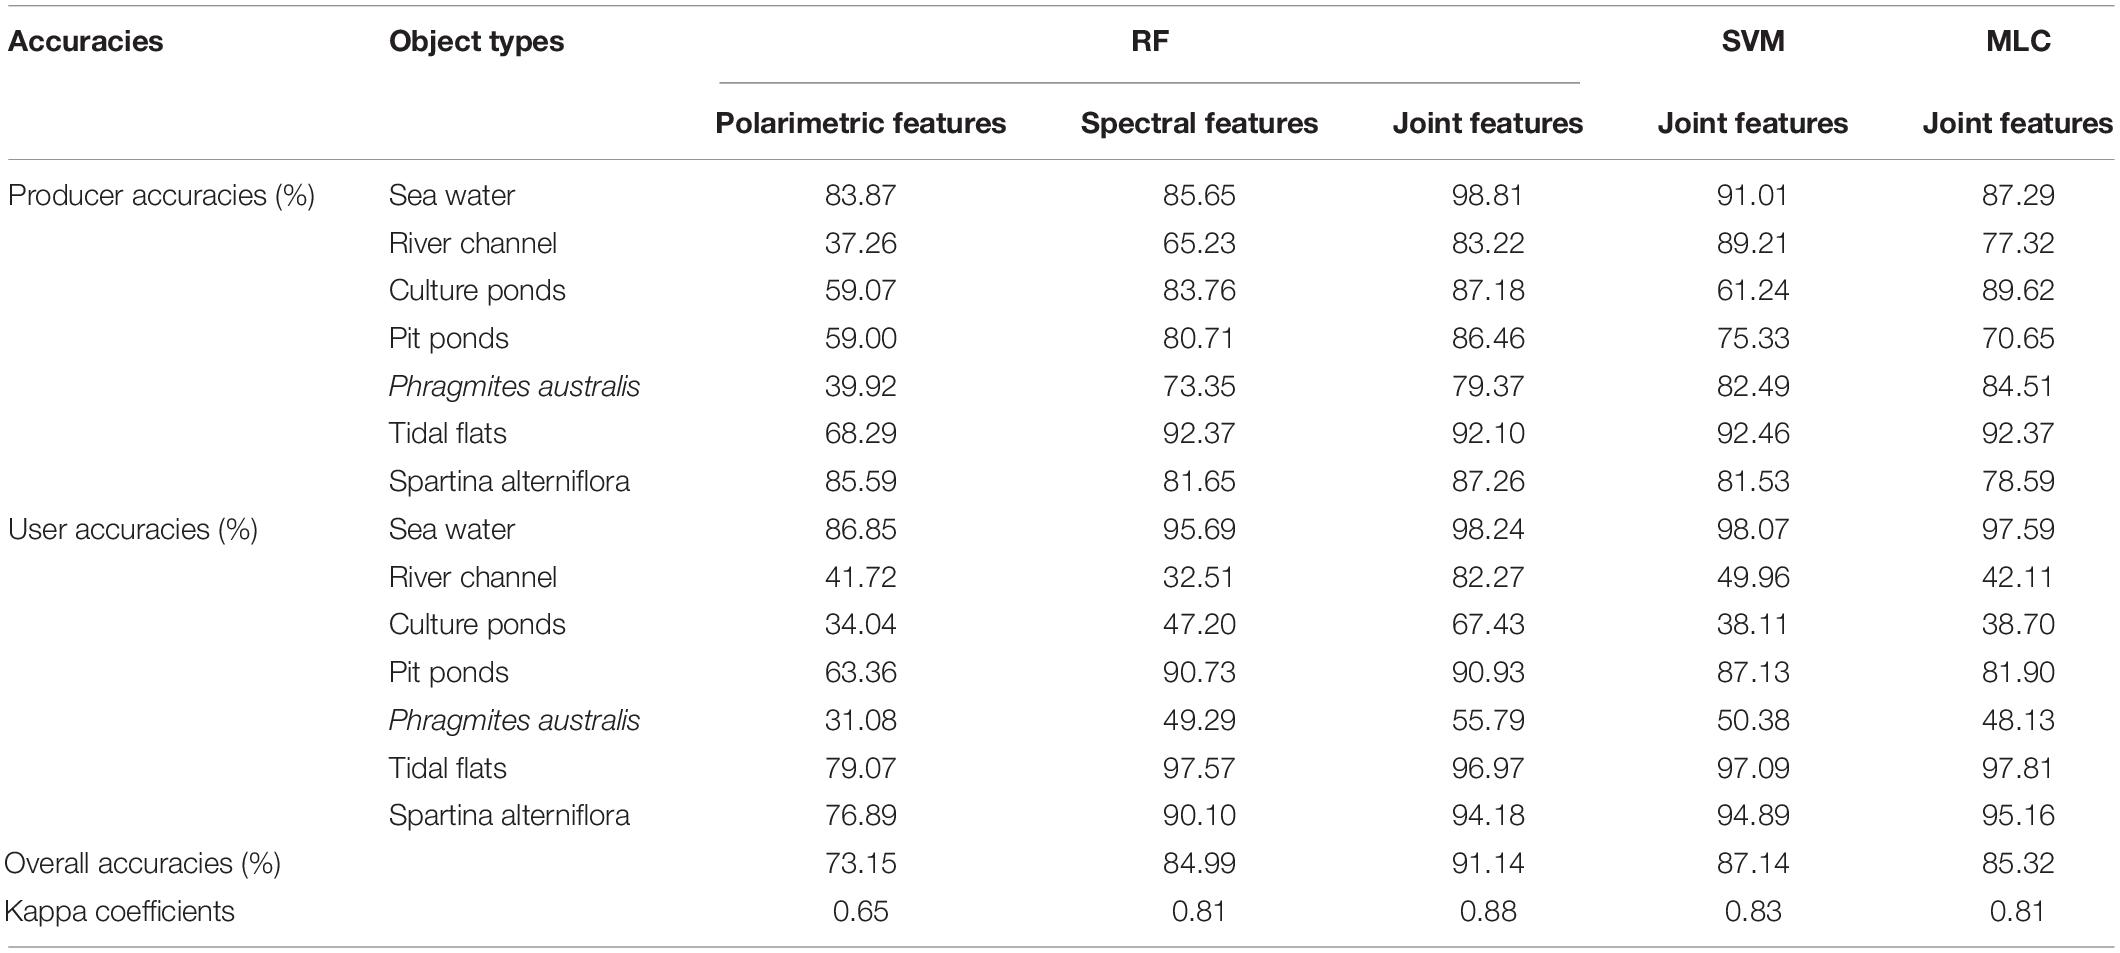
We also statistically analyzed the classification accuracies of various classification methods using October 2017 data. They included RF classification using spectral features only, polarimetric features only, and joint features. Also MLC and SVM classification based on joint features. The statistical results of producer accuracies, user accuracies, overall accuracies and Kappa coefficients were shown in Table 7.
It can be seen from Table 7 that among all the classification methods, the accuracy of the RF classification with joint feature proposed in this paper was the highest, with the overall accuracy of 91.14% and the Kappa coefficient of 0.81. The overall accuracy and Kappa coefficient of the proposed method were improved by 17.99% and 0.23, respectively, compared with those of the polarimetric feature classification. Compared with the classification using only spectral features, the overall accuracy and Kappa coefficient increased by 6.15% and 0.07, respectively. For specific types of wetland objects, except that the producer accuracy of tidal flat based on joint features was slightly lower than that of spectral features, the producer accuracy of other wetland objects based on joint features were higher than that of using only polarimetric and spectral features.
It can also be seen from Table 7 that the overall accuracy of RF based on joint features was increased by 4 and 5.82%, respectively, compared with SVM and MLC, and Kappa coefficients was increased by 0.05 and 0.07, respectively. For specific wetland types, the three methods have their own advantages and disadvantages. The producer accuracies of pit ponds and P. australis were the highest based on MLC, and the producer accuracies of the river channel and tidal flat were the highest based on SVM. The producer accuracies of sea water, S. alterniflora and culture pond extracted by RF classification were the highest. In addition, RF classification took about 13 min, SVM classification took about 36 min, MLC took about 8 min under the same conditions. Therefore, considering time efficiency and overall classification accuracy, RF classification performed best.
In summary, two sets of experiments have proved that the RF classification method with both the GF-3 polarimetric features and Sentinel-2A spectral features proposed in this paper can effectively mine the backscattering information of fully polarimetric SAR data and the spectral information of optical remote sensing data. The method proposed in this paper increases the reparability of wetland objects and improves their classification accuracies, enabling fine classification of objects in the Yellow River Delta wetland.
Discussion
In the introduction, we knew that many scholars also used multisource data to monitor the wetland in the Yellow River Delta. Compared with Li et al. (2019), we used similar data, both GF-3 data and Sentinel-2 data. By integrating GF-3 SAR data and Sentinel-2B multispectral data, they adopted decision tree, SVM and MLC to realize wetland monitoring. We used the RF classification, which was jointly determined by multiple decision trees, reducing the influence of abnormal values and the possibility of overfitting. In addition, we subdivided the vegetation and water bodies in the Yellow River Delta. The water body was divided into four types: sea water, river channel, pit ponds, and culture ponds. Of course, we also had shortcomings. We only used the spectral features of the four bands of the Sentinel-2 data, and did not carry out band operations to obtain more spectral indexes. Compared with Feng et al. (2019), the high resolution fully polarimetric GF-3 data we used can obtain more polarimetric features than they used Sentinel-1 data, which can improve the classification accuracy to some extent. It is worth learning that they proposed a multibranch convolutional neural network to fuse multitemporal and multisensor Sentinel data to improve the accuracy of coastal land cover classification.
In this paper, two sets of experiments have proved the effectiveness of RF classification based on joint features. The classification accuracy using only SAR data was also lower than that of using only spectral features due to the influence of noise. However, polarimetric features can reduce the misclassification phenomenon of “foreign body homospectral.” It can be seen from Figure 3A that the water of the Yellow River flows into the sea, resulting in the color of the offshore water is yellow. The spectral features of sea water are similar to those of the river channel, so only spectral feature classification can divide part of sea water into the river channel, as shown in Figure 11B. Because of the influence of sediment concentration and water color in different waters, there were certain confusions among sea water, river channel and tidal flat. For the data of 2018, because the bright white color of some tidal flats is similar to the color of inland buildings, the tidal flats were mistakenly divided into buildings, as shown in Figure 9. For the data of 2017, due to the impact of coverage, there is no type of buildings, so the phenomenon of misclassification of tidal flats was reduced.
Some other conditions will also affect the classification results, such as tides, image acquisition time, filtering methods, etc. The high or low tide will change the spectral features and polarimetric features of the tidal flats or vegetation. For example, when the tide is high, coastal tidal flats and vegetation are covered by sea water, which are features of sea water in the optical image. In addition, sea water will also affect the backscattering coefficient of coastal objects, which also causes misclassification. In this paper, the wetland objects were only classified in October and November. At that time, there were fewer Suaeda salsa plants in the beach area, so it was not classified as a separate type and instead attributed to the tidal flat. Moreover, a mixed area of P. australis and S. alterniflora mainly presented the features of the latter, which influenced the classification results.
In addition, this paper only monitored and analyzed the wetland in the Yellow River Delta in China, and proved that the combined polarimetric and spectral features can improve the classification accuracies of wetland objects. For monitoring wetland in other regions, it can be determined that the classification accuracy of the combined feature is higher than that of a single feature. However, because of the different types of wetlands in different regions, their polarimetric and spectral features will be different. Therefore, it is necessary to explore which polarimetric and spectral features combined will improve the classification accuracy of different wetlands.
Conclusion
In this study, a novel method for extracting wetland objects from combined polarimetric SAR and optical data was established using PCA and RF classification. A GF-3 polarimetric SAR image and Sentinel-2 optical image were used to classify objects in the Yellow River Delta wetland in China.
Some valuable conclusions can be drawn from this study, as follows:
(1) The overall classification accuracy of the method proposed in this paper is higher than that for single features, which can enable effective recognition of object types in the Yellow River Delta wetland. For the data of October 2017, the overall classification accuracy and Kappa coefficient of the new method were 17.99% and 0.23 higher, respectively, than those using only polarimetric features, and 6.15% and 0.07 higher, respectively, than those using only spectral features. For the data of November 2018, the overall classification accuracy and Kappa coefficient of the new method were 18.96% and 0.22 higher, respectively, than those using only polarimetric features, and 11.02% and 0.13 higher, respectively, than those using only spectral features. This shows that the proposed method is better for monitoring wetlands than using only polarimetric and using only spectral features for RF classification.
(2) The new method proposed in this paper has a higher extraction accuracy of for the objects in the Yellow River Delta wetland than other classification methods based on joint features. For the data of October 2017, compared with the SVM, MLC, the overall classification accuracy was improved by 4 and 5.82%, respectively, and the Kappa coefficient was improved by 0.05 and 0.07, respectively. For the data of November 2018, compared with the SVM, MLC, and minimum distance classification methods, the overall classification accuracy was improved by 2.03, 5.69, and 23.36%, respectively, and the Kappa coefficient was improved by 0.03, 0.07, and 0.27, respectively. Comparing these classification accuracies for different methods based on joint features, it proves that the RF classification has the highest classification accuracy.
(3) The proposed method can achieve fine classification of wetland objects. For the data of October 2017, the producer accuracies for the sea water, pit ponds and S. alterniflora were the highest, at 98.81, 86.46, and 87.26%, respectively. For the data of November 2018, the producer accuracies for the sea water, pit ponds, P. australis, buildings, and S. alterniflora were the highest, at 92.56, 77.20, 84.42, 79.97, and 91.06%, respectively. This indicates that this method can accurately monitor objects in the Yellow River Delta wetland.
Therefore, the proposed method, which combines GF-3 polarimetric features and Sentinel-2 spectral features, would be effective for monitoring objects in the Yellow River Delta wetland. It can improve the monitoring accuracy for nine types of wetland objects in the Yellow River Delta, specifically the river channel, sea water, pit ponds, culture ponds, tidal flats, S. alterniflora, P. australis, farmland, and buildings. Subsequent experiments will use SAR and optical data in different bands to further monitor the Yellow River Delta wetland.
Data Availability Statement
The original contributions presented in the study are included in the article/supplementary material; further inquiries can be directed to the corresponding author.
Author Contributions
ZW proposed the method, wrote the manuscript, designed its structure, and revised the manuscript. KY collected and analyzed the data. MZ, HL, and XL helped in collecting and analyzing the data. ZL, YZ, and KT critically revised the manuscript. All authors contributed to the article and approved the submitted version.
Funding
This research is funded by the Major Science and Technology Innovation Projects of Shandong Province (No. 2019JZZY020103). This research is supported by funding from the National Natural Science Foundation of China (No. 41876202).
Conflict of Interest
The authors declare that the research was conducted in the absence of any commercial or financial relationships that could be construed as a potential conflict of interest.
Publisher’s Note
All claims expressed in this article are solely those of the authors and do not necessarily represent those of their affiliated organizations, or those of the publisher, the editors and the reviewers. Any product that may be evaluated in this article, or claim that may be made by its manufacturer, is not guaranteed or endorsed by the publisher.
Acknowledgments
We are grateful for the Sentinel-2 optical data provided by ESA’s Copernicus program, and the GF-3 fully polarimetric SAR data provided by National Satellite Ocean Application Service (NSOAS).
Abbreviations
ASM, Angular second moment; CON, Contrast; COR, Correlation; DIS, Dissimilarity; ENT, Entropy; HOM, Homogeneity; VAR, Variance; MDC, Minimum distance classification; MLC, Maximum likelihood classification; PCA, Principal component analysis; RF, Random forest; SAR, Synthetic aperture radar; SVM, Support vector machine; UAV, Unmanned aerial vehicles.
References
Buono, A., Nunziata, F., Migliaccio, M., Yang, X., and Li, X. (2017). Classification of the Yellow River delta area using fully polarimetric SAR measurements. Internat. J. Remote Sens. 38, 6714–6734. doi: 10.1080/01431161.2017.1363437
Chen, Y., He, X., Xu, J., Zhang, R., and Lu, Y. (2020). Scattering feature set optimization and polarimetric SAR classification using object-oriented RF-SFS algorithm in coastal wetlands. Rem. Sens. 12:407. doi: 10.3390/rs12030407
Chu, Z., Sun, X., Zhai, S., and Xu, K. H. (2006). Changing pattern of accretion/erosion of the modern Yellow River (Huanghe) subaerial delta, China: based on remote sensing images. Mar. Geol. 227, 13–30. doi: 10.1016/j.margeo.2005.11.013
Cloude, S. R., and Pottier, E. (1997). An entropy based classification scheme for land applications of polarimetric SAR. IEEE Transac. Geosci. Rem. Sens. 35, 68–78. doi: 10.1109/36.551935
Cloude, S. R., and Pottier, E. A. (1996). A review of target decomposition theorems in radar polarimetry. IEEE Transac. Geosci. Rem. Sens. 34, 498–518. doi: 10.1109/36.485127
Cong, P., Chen, K., Qu, L., and Han, J. (2019). Dynamic changes in the wetland landscape pattern of the Yellow River Delta from 1976 to 2016 based on satellite data. Chin. Geograph. Sci. 29, 372–381. doi: 10.1007/s11769-019-1039-x
Dang, A. T., Kumar, L., Reid, M., and Nguyen, H. (2021). Remote Sensing Approach for Monitoring Coastal Wetland in the Mekong Delta, Vietnam: change Trends and Their Driving Forces. Rem. Sens. 13:3359. doi: 10.3390/rs13173359
Delgado, L. E., and Marín, V. H. (2013). Interannual changes in the habitat area of the black-necked swan, Cygnus melancoryphus, in the Carlos Anwandter Sanctuary, southern Chile: a remote sensing approach. Wetlands 33, 91–99. doi: 10.1007/s13157-012-0354-0
Du, P., Samat, A., Gamba, P., and Xie, X. (2014). Polarimetric SAR image classification by boosted multiple-kernel extreme learning machines with polarimetric and spatial features. Internat. J. Rem. Sens. 35, 7978–7990. doi: 10.1080/2150704x.2014.978952
Eklundh, L., and Singh, A. A. (1993). comparative analysis of standardised and unstandardized principal components analysis in remote sensing. Internat. J. Rem. Sens. 14, 1359–1370. doi: 10.1080/01431169308953962
Feng, Q., Gong, J., Liu, J., and Li, Y. (2015). Monitoring cropland dynamics of the Yellow River Delta based on multi-temporal landsat imagery over 1986 to 2015. Sustainability 7, 14834–14858.
Feng, Q., Yang, J., Zhu, D., Liu, J., Guo, H., Bayartungalag, B., et al. (2019). Integrating multitemporal sentinel-1/2 data for coastal land cover classification using a multibranch convolutional neural network: a case of the yellow river delta. Rem. Sens. 11:1006. doi: 10.3390/rs11091006
Ferrentino, E., Buono, A., Nunziata, F., Marino, A., and Migliaccio, M. (2020). On the use of multipolarization satellite SAR data for coastline extraction in harsh coastal environments: the case of Solway Firth. IEEE J. Sel. Top. Appl. Earth Observ. Rem. Sens. 14, 249–257. doi: 10.1109/jstars.2020.3036458
Franklin, S. E., Skeries, E. M., Stefanuk, M. A., and Ahmed, O. S. (2018). Wetland classification using Radarsat-2 SAR quad-polarization and Landsat-8 OLI spectral response data: a case study in the Hudson Bay Lowlands Ecoregion. Internat. J. Rem. Sens. 39, 1615–1627. doi: 10.1080/01431161.2017.1410295
Fu, B., Xie, S., He, H., Zuo, P., Sun, J., Liu, L., et al. (2021). Synergy of multi-temporal polarimetric SAR and optical image satellite for mapping of marsh vegetation using object-based random forest algorithm. Ecol. Indic. 131:108173. doi: 10.1016/j.ecolind.2021.108173
Gao, H., Wang, C., Wang, G., Zhu, J., Tang, Y., Shen, P., et al. (2018). crop classification method integrating GF-3 PolSAR and Sentinel-2A optical data in the Dongting Lake Basin. Sensors 18:3139. doi: 10.3390/s18093139
Gao, R., Wang, Z., Zhou, X., and Liu, R. (2021). Monitoring and analysis of wetland change dynamics in the Yellow River Delta using multi-temporal remote sensing. Bull. Surv. Mapp. 4, 22–27.
Geng, R., Fu, B., Cai, J., Geng, W., and Lou, P. (2019). Object-based karst wetland vegetation classification method using unmanned aerial vehicle images and random forest algorithm. J. Geoinform. Sci. 21, 1295–1306.
Granger, J. E., Mahdianpari, M., Puestow, T., Warren, S., Mohammadimanesh, F., Salehi, B., et al. (2021). Object-based random forest wetland mapping in Conne River, Newfoundland, Canada. J. Appl. Remote Sens. 15:038506.
Haralick, R. M., Shanmugam, K., and Dinstein, I. H. (1973). Textural features for image classification. IEEE Trans. Syst. Man Cybern. 6, 610–621.
Hosseiny, B., Mahdianpari, M., Brisco, B., Mohammadimanesh, F., and Salehi, B. (2021). WetNet: A Spatial-Temporal Ensemble Deep Learning Model for Wetland Classification Using Sentinel-1 and Sentinel-2. IEEE Transact. Geosci. Rem. Sens. 2021, 1–14. doi: 10.1109/tgrs.2021.3113856
Hu, Y., Tian, B., Yuan, L., Li, X., Huang, Y., Shi, R., et al. (2021). Mapping coastal salt marshes in China using time series of Sentinel-1 SAR. ISPRS J. Photogr. Remote Sens. 173, 122–134. doi: 10.1016/j.isprsjprs.2021.01.003
Huynen, J. R. (1978). Phenomenological Theory of Radar Targets. Electromag. Scatter. 1978, 653–712. doi: 10.1016/b978-0-12-709650-6.50020-1
Jia, M., Wang, Z., Mao, D., Ren, C., Wang, C., and Wang, Y. (2021). Rapid, robust, and automated mapping of tidal flats in China using time series Sentinel-2 images and Google Earth Engine. Rem. Sens. Env. 255:112285. doi: 10.1016/j.rse.2021.112285
Kong, D., Miao, C., Borthwick, A. G., Duan, Q., Liu, H., Sun, Q., et al. (2015). Evolution of the Yellow River Delta and its relationship with runoff and sediment load from 1983 to 2011. J. Hydrol. 520, 157–167. doi: 10.1016/j.jhydrol.2014.09.038
Lee, J. S., Grunes, M. R., and De Grandi, G. (1999). Polarimetric SAR speckle filtering and its implication for classification. IEEE Transact. Geosci. Rem. Sens. 37, 2363–2373. doi: 10.1109/36.789635
Li, J., Chen, Q., Li, Q., Zhao, C., and Feng, Y. (2021). Influence of plants and environmental variables on the diversity of soil microbial communities in the Yellow River Delta Wetland, China. Chemosphere 274:129967. doi: 10.1016/j.chemosphere.2021.129967
Li, P., Li, D., Li, Z., and Wang, H. (2019). Wetland Classification Through Integration of GF-3 SAR and Sentinel-2B Multispectral Data over the Yellow River Delta. Geomat. Inform. Sci. Wuhan Univ. 44, 1641–1649.
Liu, J., Feng, Q., Gong, J., Zhou, J., and Li, Y. (2016). Land-cover classification of the Yellow River Delta wetland based on multiple end-member spectral mixture analysis and a Random Forest classifier. Internat. J. Rem. Sens. 37, 1845–1867. doi: 10.1080/01431161.2016.1165888
Ma, X., Yan, J., Wang, F., Qiu, D., Jiang, X., Liu, Z., et al. (2019). Trait and density responses of Spartina alterniflora to inundation in the Yellow River Delta China. Mar. Poll. Bull. 146, 857–864. doi: 10.1016/j.marpolbul.2019.07.022
Mahdavi, S., Salehi, B., Granger, J., Amani, M., Brisco, B., and Huang, W. (2018). Remote sensing for wetland classification: a comprehensive review. GISci. Rem. Sens. 55, 623–658. doi: 10.3390/s17040777
Mahdianpari, M., Salehi, B., Mohammadimanesh, F., Homayouni, S., and Gill, E. (2019). The first wetland inventory map of newfoundland at a spatial resolution of 10 m using sentinel-1 and sentinel-2 data on the google earth engine cloud computing platform. Rem. Sens. 11:43. doi: 10.3390/rs11010043
Mahdianpari, M., Salehi, B., Mohammadimanesh, F., and Motagh, M. (2017). Random forest wetland classification using ALOS-2 L-band, RADARSAT-2 C-band, and TerraSAR-X imagery. ISPRS J. Photogr. Rem. Sens. 130, 13–31. doi: 10.1016/j.isprsjprs.2017.05.010
Main-Knorn, M., Pflug, B., Louis, J., Debaecker, V., Müller-Wilm, U., and Gascon, F. (2017). Sen2Cor for sentinel-2[C]//Image and Signal Processing for Remote Sensing XXIII. Internat. Soc. Opt. Phot. 10427:1042704.
Mao, D., Wang, Z., Luo, L., Ren, C., and Jia, M. (2016). Monitoring the evolution of wetland ecosystem pattern in northeast China from 1990 to 2013 based on remote sensing. J. Nat. Resour. 31, 1253–1263.
Martínez Prentice, R., Villoslada Peciña, M., Ward, R. D., Bergamo, T. F., Joyce, C. B., and Sepp, K. (2021). Machine learning classification and accuracy assessment from high-resolution images of coastal wetlands. Rem. Sens. 13:3669. doi: 10.3390/rs13183669
Migliaccio, M., and Nunziata, F. (2014). On the exploitation of polarimetric SAR data to map damping properties of the Deepwater Horizon oil spill. Internat. J. Rem. Sens. 35, 3499–3519. doi: 10.1080/01431161.2014.905730
Nunziata, F., Gambardella, A., and Migliaccio, M. A. (2012). unitary Mueller-based view of polarimetric SAR oil slick observation. Internat. J. Rem. Sens. 33, 6403–6425. doi: 10.1080/01431161.2012.687474
Rosa, R. A., Fernandes, D., Barreto, T. L., Wimmer, C., and Nogueira, J. B. (2016). “Change detection under the forest in multitemporal full-polarimetric P-band SAR images using Pauli decomposition,” in 2016 IEEE International Geoscience and Remote Sensing Symposium (IGARSS), (IEEE), 6213– 6216.
Slagter, B., Tsendbazar, N. E., Vollrath, A., and Reiche, J. (2020). Mapping wetland characteristics using temporally dense Sentinel-1 and Sentinel-2 data: a case study in the St. Lucia wetlands, South Africa. Internat. J. Appl. Earth Observ. Geoinform. 86:102009. doi: 10.1016/j.jag.2019.102009
Wang, W., Yang, X., Li, X., Chen, K., Liu, G., Li, Z., et al. (2016). fully polarimetric SAR imagery classification scheme for mud and sand flats in intertidal zones. IEEE Trans. Geosci. Rem. Sens. 55, 1734–1742. doi: 10.1109/tgrs.2016.2631632
Wang, X., Gao, X., and Zhang, Y. (2019). Land-cover classification of coastal wetlands using the RF algorithm for Worldview-2 and Landsat 8 images. Rem. Sens. 11:1927. doi: 10.3390/rs11161927
Wei, Q., Shao, Y., and Wang, X. (2019). Preliminary Evaluation of Gaofen-3 Quad-Polarized SAR Imagery for Longbao Protected Plateau Wetland Reserve. J. Sens. 2019, 1–7. doi: 10.1155/2019/8789473
Yin, J., Yang, J., and Zhang, Q. (2017). Assessment of GF-3 polarimetric SAR data for physical scattering mechanism analysis and terrain classification. Sensors 17:2785. doi: 10.3390/s17122785
Zarco-Tejada, P. J., Hornero, A., Beck, P. S. A., Kattenborn, T., Kempeneers, P., and Hernández-Clemente, R. (2019). Chlorophyll content estimation in an open-canopy conifer forest with Sentinel-2A and hyperspectral imagery in the context of forest decline. Rem. Sens. Env. 223, 320–335. doi: 10.1016/j.rse.2019.01.031
Zhang, C., Gong, Z., Qiu, H., Zhang, Y., and Zhou, D. (2021). Mapping typical salt-marsh species in the Yellow River Delta wetland supported by temporal-spatial-spectral multidimensional features. Sci. Total Env. 783:147061. doi: 10.1016/j.scitotenv.2021.147061
Zhang, L., Gong, Z., Wang, Q., Jin, D., and Wang, X. (2019). Wetland mapping of Yellow River Delta wetlands based on multi-feature optimization of Sentinel-2 images. J. Rem. Sens. 23, 313–326.
Zhang, R., Tang, X., You, S., Duan, K., Xiang, H., and Luo, H. A. (2020). novel feature-level fusion framework using optical and SAR remote sensing images for land use/land cover (LULC) classification in cloudy mountainous area. Appl. Sci. 10:2928. doi: 10.3390/app10082928
Zhang, X., Xia, J., Tan, X., Zhou, X., and Wang, T. (2019). PolSAR Image Classification via Learned Superpixels and QCNN Integrating Color Features. Rem. Sens. 11:1831. doi: 10.3390/rs11151831
Zhang, X., Xu, J., Chen, Y., Xu, K., and Wang, D. (2021). Coastal Wetland Classification with GF-3 Polarimetric SAR Imagery by Using Object-Oriented Random Forest Algorithm. Sensors 21:3395. doi: 10.3390/s21103395
Keywords: wetland monitoring, Yellow River Delta, principal component analysis, random forest, fully polarimetric SAR, optical image
Citation: Wang Z, Ye K, Zhang M, Li H, Li Z, Zhu Y, Liu X and Tian K (2022) Monitoring the Wetland of the Yellow River Delta by Combining GF-3 Polarimetric Synthetic Aperture Radar and Sentinel-2A Multispectral Data. Front. Ecol. Evol. 10:806978. doi: 10.3389/fevo.2022.806978
Received: 01 November 2021; Accepted: 01 April 2022;
Published: 12 May 2022.
Edited by:
Marco Casazza, Surgery and Dentistry, University of Salerno, ItalyReviewed by:
Jakub Nowosad, Adam Mickiewicz University, PolandAndrea Buono, Parthenope University of Naples, Italy
Dipankar Mandal, Kansas State University, United States
Copyright © 2022 Wang, Ye, Zhang, Li, Li, Zhu, Liu and Tian. This is an open-access article distributed under the terms of the Creative Commons Attribution License (CC BY). The use, distribution or reproduction in other forums is permitted, provided the original author(s) and the copyright owner(s) are credited and that the original publication in this journal is cited, in accordance with accepted academic practice. No use, distribution or reproduction is permitted which does not comply with these terms.
*Correspondence: Kaile Ye, a2FpbGUxMjAxQHNkdXN0LmVkdS5jbg==
 Zhiyong Wang
 Kaile Ye
 Mengyue Zhang
 Zhenjin Li