 Andrew Endo
 Priyanga Amarasekare*
- Department of Ecology and Evolutionary Biology, University of California, Los Angeles, Los Angeles, CA, United States
Predicting how climate warming affects vector borne diseases is a key research priority. The prevailing approach uses the basic reproductive number (R0) to predict warming effects. However, R0 is derived under assumptions of stationary thermal environments; using it to predict disease spread in non-stationary environments could lead to erroneous predictions. Here, we develop a trait-based mathematical model that can predict disease spread and prevalence for any vector borne disease under any type of non-stationary environment. We parameterize the model with trait response data for the Malaria vector and pathogen to test the latest IPCC predictions on warmer-than-average winters and hotter-than-average summers. We report three key findings. First, the R0 formulation commonly used to investigate warming effects on disease spread violates the assumptions underlying its derivation as the dominant eigenvalue of a linearized host-vector model. As a result, it overestimates disease spread in cooler environments and underestimates it in warmer environments, proving its predictions to be unreliable even in a constant thermal environment. Second, hotter-than-average summers both narrow the thermal limits for disease prevalence, and reduce prevalence within those limits, to a much greater degree than warmer-than-average winters, highlighting the importance of hot extremes in driving disease burden. Third, while warming reduces infected vector populations through the compounding effects of adult mortality, and infected host populations through the interactive effects of mortality and transmission, uninfected vector populations prove surprisingly robust to warming. This suggests that ecological predictions of warming-induced reductions in disease burden should be tempered by the evolutionary possibility of vector adaptation to both cooler and warmer climates.
Introduction
Vector-borne diseases constitute a significant source of the global disease burden (WHO, 2019). Vectors and pathogens are ectotherms whose life history traits and contact rates are directly affected by temperature. There is increasing evidence that climate warming will not only increase global mean temperatures but also hot extremes (IPCC, 2018; Sherwood et al., 2020). This means that diseases are likely to go extinct from areas that become too hot and spread to cooler climates at higher latitudes. Knowing when and where this will happen is crucial for developing cost-effective public health policies to combat vector-borne diseases.
For well over a century, vector-borne disease spread has been predicted using the Basic Reproductive Number (R0) (Ross, 1911; MacDonald, 1955, 1957; Aron, 1988; May and Anderson, 1991), the expected number of secondary cases produced by a single case during its infectious period (Diekmann et al., 1990; Dietz, 1993). This metric was initially derived using the classical Ross-Macdonald model for Malaria with time delays (Ross, 1911; MacDonald, 1955; Diekmann et al., 1990; Dietz, 1993), under the strict assumption of a constant environment and equilibrium conditions. Specifically, R0 is the dominant eigenvalue of the next generation matrix evaluated at the disease-free equilibrium (Diekmann et al., 1990; Dietz, 1993). Despite this history, R0 computed as the dominant eigenvalue is increasingly being used to predict the effects of climate warming on vector-borne disease spread [e.g., Mordecai et al. (2013, 2017), Johnson et al. (2015), Shocket et al. (2018, 2020), Tesla et al. (2018), Cator et al. (2020)]. The problem is that climate warming violates both the constant environment and equilibrium assumptions.
It is not uncommon in theoretical ecology to apply models to real-world situations that violate model assumptions. However, doing this in the case of disease spread is risky, given the direct impacts of model predictions on public health. Climate warming is a phenomenon that is not only non-constant but also non-stationary, meaning that, unlike typical seasonal variation, it does not settle into a predictable pattern of temperature variation. In such an environment, there is no disease-free equilibrium, and the eigenvalue approach no longer holds. The R0 formula used to predict climate warming, retains the eigenvalue approach but assumes the vector population to be growing exponentially in the absence of the disease (Mordecai et al., 2013, 2017; Johnson et al., 2015; Shocket et al., 2018, 2020; Tesla et al., 2018; Cator et al., 2020). This itself is a contradiction, since the eigenvalue approach is predicated on equilibrium assumptions. The studies using the R0 formula attempt to circumvent this problem by assuming the vector population is in climatic equilibrium under exponential growth, i.e., for each climate there is a population size at which the vector's intrinsic growth rate is zero (Parham and Michael, 2010). But, climate warming is a dynamical process, which means that a climatic equilibrium is never reached.
These complications suggest the need for alternative approaches that can accommodate the non-stationary thermal environment generated by climate warming. Here, we propose a trait-based framework that provides such an alternative. This work goes above and beyond previous work in three important ways. First, we use mechanistic response functions, derived from first principles of thermodynamics, to characterize vector and pathogen trait responses to temperature. Second, we incorporate vector trait response functions into stage-structured models that realistically depict the developmental delays characteristic of vector life cycles. Third, we couple the vector dynamics model with trait-based epidemiological models of host-vector interactions to predict disease prevalence under the most recent IPCC predictions of hotter-than-average summers and warmer-than-average winters (IPCC, 2018). Our mechanistic approach allows us to make predictions about disease prevalence based solely on trait response data and completely independently of population-level information, a potentially powerful approach for formulating public health policy in the age of warming.
Conceptual Framework
We defer the mathematical details to Appendices and focus instead on the biological implications. We start with a summary of past work, with emphasis on the use of R0 to predict disease spread. We then explain why R0 is not suitable for predicting disease spread under warming. We present an alternative approach, based on a dynamical model, for investigating climate warming effects on vector-borne diseases.
Derivation of the Basic Reproductive Number (R0)
As noted above, R0 is derived as the dominant eigenvalue of the next generation matrix of a host-vector model (Ross, 1911; MacDonald, 1955; Aron, 1988; Diekmann et al., 1990; Dietz, 1993). Here, we provide a new derivation using a delay differential equation model that incorporates both stage structure arising from the vector's life cycle (e.g., juvenile and adult) and class structure arising from the host-vector interaction (see Appendix A for details). We also consider vector self-regulation at different life stages (Table A1 in Appendix A). With these biological details, the expression for R0 is given by:
where dH, dI, and γ represent, respectively, the host's background mortality rate, disease-induced mortality rate, and the recovery rate, and τH is the disease exposure (latent) period in the host. The quantity is the equilibrium abundance of a self-regulated host population with qH denoting the per capita competition coefficient. The parameters B(T) and d(T) depict the vector's temperature-dependent per capita biting rate and adult mortality rate, and pVH(T) and pHV(T) denote, respectively, the per-bite transmission probability of the pathogen from host to vector and from vector to host. The quantity U⋆(T) is the equilibrium abundance of a self-regulated population of the uninfected vector, which depends on the life stage (juvenile, adult) at which self-regulation operates (Table A1 in Appendix A).
Previous studies of warming effects on disease spread (Parham and Michael, 2010; Mordecai et al., 2013, 2017; Johnson et al., 2015; Shocket et al., 2018, 2020; Tesla et al., 2018) use a formula for R0:
which is a special case of our general derivation when there is no background or disease-induced mortality in the host (i.e., dH = dI = 0) and the host population is constant. The most crucial difference between our general derivation and this one is that the latter assumes exponential growth in the uninfected vector population, with no long-term steady state. This is a violation of the fundamental assumption underlying the eigenvalue analysis that a disease-free equilibrium exists (i.e., there is a unique vector population abundance to which the population returns following a perturbation; Diekmann et al., 1990; Dietz, 1993). Previous authors circumvent this problem by using a Poisson approximation of the probability that there are a given number of mosquitos at any time t, and calculate the probability of extinction using the mean of the Poisson distribution (birth rate/death rate), assuming that the population is in climatic equilibrium (i.e., under any given climate there is a population size at which the vector's intrinsic growth rate is zero) (Parham and Michael, 2010). Under these assumptions, they approximate the uninfected vector population as . Before any consideration of climate warming, one needs to determine how this approximation affects R0 predictions in a content thermal environment.
To this end, we compare our derivation of R0 based on a self-regulated vector population with vector developmental delays [Equation (1)] with the previous derivation assuming an exponentially growing vector population with no developmental delays [Equation (2)]. Making this comparison requires that we first characterize the temperature dependence of vector and pathogen traits.
Temperature Dependence of Vector and Pathogen Traits
The prevailing approach of describing trait responses to temperature is to fit a range of phenomenological functions (e.g., linear, quadratic) to the data, and to choose the best-fit function based on statistical criteria (e.g., AIC; Burnham and Anderson, 2002). We take the approach of deriving mechanistic response functions based on how temperature affects the underlying biochemical processes (Appendix B). This has the advantage that the functions are derived from first principles of thermodynamics, and, hence, independently of the data. We then fit the functions to the data and estimate parameters (Appendix C). An additional advantage of our approach is that both the response functions and their parameters have clear biological meaning (e.g., physiologically optimal temperature, thermal sensitivity, thermal tolerance limits). Because the response functions are mechanistic and derived independently of the data, a poor statistical fit can highlight data limitations that could lead to mis-specification of trait responses (e.g., characterizing a left-skewed function as exponential due to lack of data at high temperatures). Importantly, its mechanistic underpinnings make our approach less dependent on species-specific data. Several large-scale data analyses show that the qualitative nature (e.g., left-skewed, Gaussian) of trait responses to temperature is conserved across ectotherm taxa, and that their parameter values are thermodynamically constrained to fall within a narrow range (Gillooly et al., 2001, 2002; Brown et al., 2004; Savage et al., 2004; Dell et al., 2011). This holds the promise that our mechanistically-derived parameter estimates may yield model predictions that apply across different vectors and pathogens inhabiting different geographic areas and latitudes.
Figure 1 shows that these mechanistic functions provide a very good fit to temperature response data for the Malaria pathogen (Plasmodium) and its mosquito vectors (Anopheles species). Table 1 provides the resulting parameter estimates.
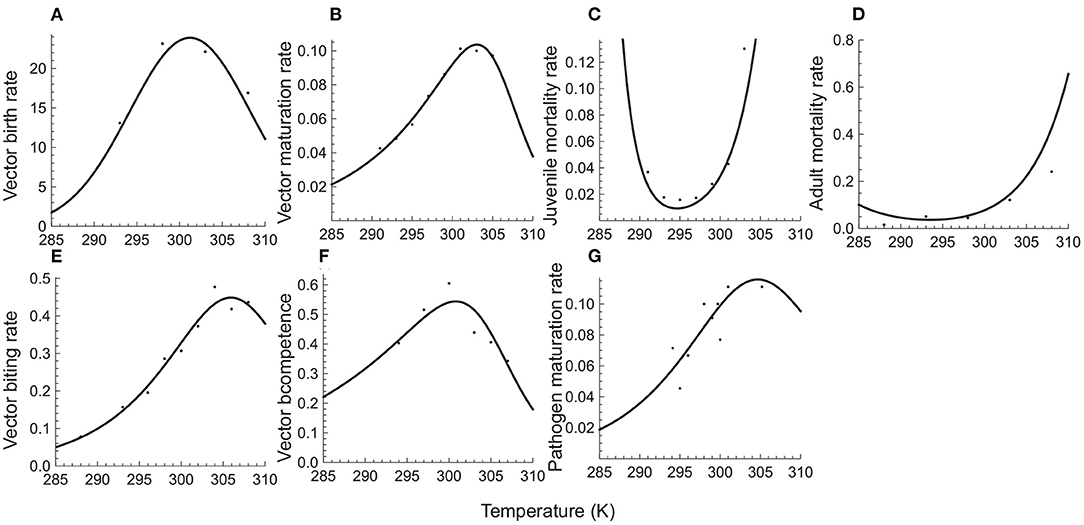
Figure 1. Temperature responses of vector and pathogen traits. The top row depicts, respectively, per capita birth (A), maturation (B), juvenile mortality (C), and adult mortality (D) rates of the mosquito vector of Malaria (Anopheles species). The bottom row depicts the vector's biting rate (E) and competence (F), and the sporozoite developmental rate (G) of the Malaria parasite (Plasmodium falciparum). Solid circles depict the observed responses based on published data (Mordecai et al., 2013; Ciota et al., 2014; Shapiro et al., 2017) on temperature responses of the Malaria pathogen (Plasmodium) and its mosquito vectors (Anopheles species). The solid curves depict predicted responses obtained by fitting trait response data to mechanistic temperature response functions using least squares non-linear regression (see Appendix C for details).
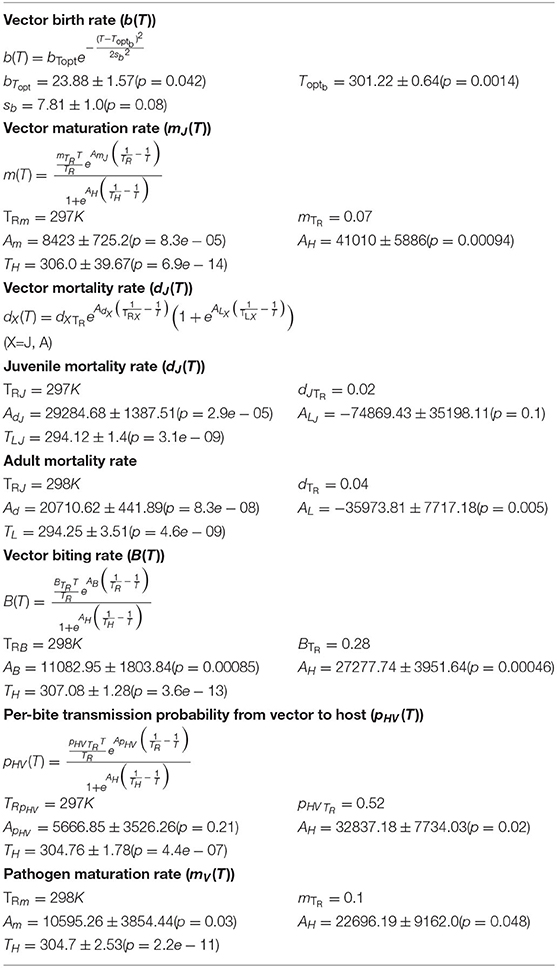
Table 1. Key parameters (mean ± SE) of the temperature responses of the Malaria pathogen (Plasmodium) and its mosquito vectors (Anopheles species).
Comparing R0 Formulations
Incorporating trait response parameters for the Malaria vector and pathogen into our derivation of R0 based on a self-regulated vector population [Equation (1)] and the previous derivation assuming an exponentially growing vector population (Equation (2)), we see that the latter is greater in magnitude, attains a maximum at a lower temperature, and has a lower high temperature threshold for disease spread compared to the former (Figure 2). This means that the R0 formulation used in previous studies (Parham and Michael, 2010; Mordecai et al., 2013, 2017; Johnson et al., 2015; Shocket et al., 2018, 2020; Tesla et al., 2018) over-predicts disease spread in cooler environments and under-predicts it in warmer environments. This does not inspire confidence that the widely used formulation for R0 accurately depicts disease spread, even in constant thermal environments. Given that R0, even when correctly derived, cannot be used to predict disease spread under non-constant, non-equilibrium conditions (Aron, 1988; Diekmann et al., 1990; Dietz, 1993), we need to look for metrics for predicting disease spread under climate warming that do not depend on these restrictive assumptions.
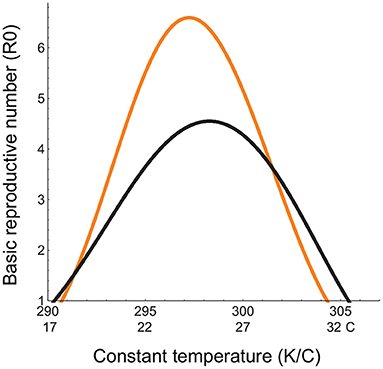
Figure 2. Basic reproductive number (R0(T)) in a constant thermal environment. The x-axis depicts the range of the constant temperatures over which R0(T) is quantified; The orange curve represents R0 calculated in previous studies assuming an exponentially growing vector population with no developmental delays (Equation (2)), and the black curve, R0 we have derived from the DDE model for a self-regulated vector population with developmental delays (Equation (1)). Temperature-dependent parameters are given in Table 1. Temperature-independent parameter values are: bH = 0.02, dH = 0.01;qH = 0.002, dI = 0.02, δH = 0.2, γ = 0.05, k = 0.3, pVH = 0.91.
Alternatives To R0: Dynamical Models of Vector-Host Interactions
The obvious alternative to R0 to predicting disease spread is prevalence, the proportion of infected hosts in the population (Diekmann et al., 1990; May and Anderson, 1991; Dietz, 1993). Prevalence has the advantage that it can be calculated in both stationary and nonstationary environments. Quantifying prevalence, however, requires a dynamical model of host-vector interactions. The host-vector model we have developed (Appendix A, Equation A.1) goes above and beyond previous models in incorporating all relevant time delays (latent period in the host, juvenile development delay in the vector, and the pathogen's extrinsic incubation period) as well as vector self-regulation at different life stages. It has the advantage that it can predict disease prevalence under any variable thermal regime based solely on how temperature affects the vector's and pathogen's life history traits, and thus completely independently of population-level (e.g., time series) data. However, the biological realism of the model comes at the cost of analytically intractability, and the numerical methods used for solving delay differential equations are out of reach for most ecologists and epidemiologists.
Here we adopt an approach that combines the biological realism of delay differential equation (DDE) models with the tractability of ordinary differential equation (ODE) models. A number of previous studies have used class-structured epidemiological models (e.g., Susceptible-Exposed-Infected-Removed), constructed using ordinary differential equations, to model such diseases as Zika, Malaria, Chikungunya, West Nile, and Leishmaniasis [e.g., Wonham et al. (2004), Bacaër and Guernaoui (2006); Bacaër (2007); Hartemink et al. (2009, 2011), Alonso et al. (2010), Gao et al. (2016)]. None of these studies, however, considered the temperature dependence of vector and pathogen traits. We develop a stage- and class-structured ODE model that explicitly incorporates mechanistic descriptions of vector and pathogen trait responses to temperature. The model depicts time delays in terms of instantaneous rates, and is therefore more tractable both analytically and numerically. We use the model to investigate climate warming effects on disease prevalence using the latest IPCC predictions (IPCC, 2018). We defer the mathematical details (Appendix D) and focus instead on parameterizing the model with trait response data to investigate disease prevalence under climate warming.
Model Analysis
We use the ODE model (Appendix D, Equation D.1) to predict warming effects on disease prevalence, using seasonal variation as the basis for comparison. We depict seasonal variation using the sinusoidal function T(t) = MT+ATS(t) where t is time in days, MT is the mean habitat temperature in K, AT is the amplitude of seasonal fluctuations (), and (or ) with yr = 365 days. We incorporate latitudinal variation into our analyses by using climate data to derive a statistical relationship between mean habitat temperature and the amplitude of seasonal fluctuations. Based on 47 different latitudes ranging from the tropics to the high temperate (and including many locations in west Africa where Malaria is endemic), we obtained the following relationship: AT = 151.46−0.49MT (see online Figure E1 in Appendix E).
Warming Scenarios
We follow the most recent IPCC predictions that climate warming will manifest as an increase in the mean annual temperature and/or an increase in thermal extremes (IPCC, 2018). We consider the following scenarios:
1. Warmer-than-average winters: minimum temperature increases faster than the maximum temperature, resulting in an increase in the mean temperature and a decrease in the amplitude.
2. Hotter-than average summers: minimum temperature increases more slowly than the maximum temperature, resulting in an increase in the mean and amplitude both.
3. Baseline: minimum and maximum temperatures change at the same rate, resulting in an increase in the mean while the amplitude stays the same.
We depict the change in the seasonal thermal regime under climate warming as follows: T(t) = (MT+mt) + (AT+at)S(t) with m = (mhigh+mlow)/2 and a = (mhigh−mlow)/2 depicting, respectively, the daily rate of increase in mean and amplitude. The quantities mlow = s1/(n*yr) and mhigh = s2/(n*yr) where s1 and s2 are, respectively, the number of degrees by which the minimum and maximum temperatures increase in n years. When the minimum and maximum temperatures increase at the same rate (s1 = s2), the mean temperature increases over time with no net change in the amplitude (Baseline scenario). When the minimum temperature increases faster than the maximum (Warmer winters; s1 > s2), the mean increases over time while the amplitude decreases. When the maximum temperature increases faster than the minimum (Hotter summers; s1 < s2), the mean and the amplitude both increase over time. We incorporate warming as a linear increase in the mean, minimum and maximum temperatures. Our formulation, however, is general and can accommodate any form of empirically observed warming regime.
Warming Effects on Disease Prevalence
The most recent study (July 2020) of climate sensitivity predicts that the global increase in mean temperature over the next 150 years is likely between 2.6−4.1°, and very likely between 2.0−5.7° (Sherwood et al., 2020). We, therefore, investigate cases in which minimum and maximum temperatures change in such a way that the mean annual temperature increases by 2–4° over a period of 100 years. To give an illustrative example, in the warmer-winters (hotter-summers) scenario the mean increases by 3° when the minimum temperature increases by 4° (2°), and the maximum temperature by 2° (4°) over 100 years. When minimum and maximum temperatures both increase by 3° over 100 years, we get the baseline scenario. We investigate warming-induced changes in disease prevalence under the three warming scenarios over a gradient from tropical to temperate latitudes.
Warming Effects on Vector-Host Dynamics
The above analysis on disease prevalence seeks to uncover large-scale patterns in disease prevalence. A complete understanding of how warming affects disease prevalence requires elucidating how these patterns arise from temperature effects on life history and transmission traits at the individual level. To this end, we compared the annual abundance patterns of vector life stages (juvenile, adult) and epidemiological classes (susceptible, exposed, infected) at different latitudinal locations. Because we have the most complete trait response data for Malaria, we used the parameterized model to investigate disease dynamics in four subregions in west Africa where current disease prevalence ranges from low to high, and which is predicted to experience a temperature increase of 1.2–5.9° between 2070–2100 Yamana et al., 2016).
Results
Warming Effects on Trait Responses
All warming scenarios cause the mean habitat temperature to approach or exceed the physiologically optimal temperature for vector life history (birth, maturation) and transmission traits (biting rate, per-bite transmission probability from vector to host), causing large decreases in trait response values compared to typical seasonal variation (Figure 3). Hotter-than-average summers have stronger effects on vector traits than warmer-than-average winters because this scenario increases the mean temperature as well as the amplitude, leading to hot extremes that exceed the limit of vectors' phenotypic plasticity. Warming has its strongest effects on juvenile maturation, juvenile and adult mortality, and per bite transmission probability from vector to host (Figure 3). While the biting rate itself is less sensitive to warming than the per-bite transmission probability from vector to host, their multiplicative effect is what determines disease transmission from vector to host (Appendix D, Equation D.1). As can be seen (Figures 3K,O), this joint response is strongly impacted by warming.
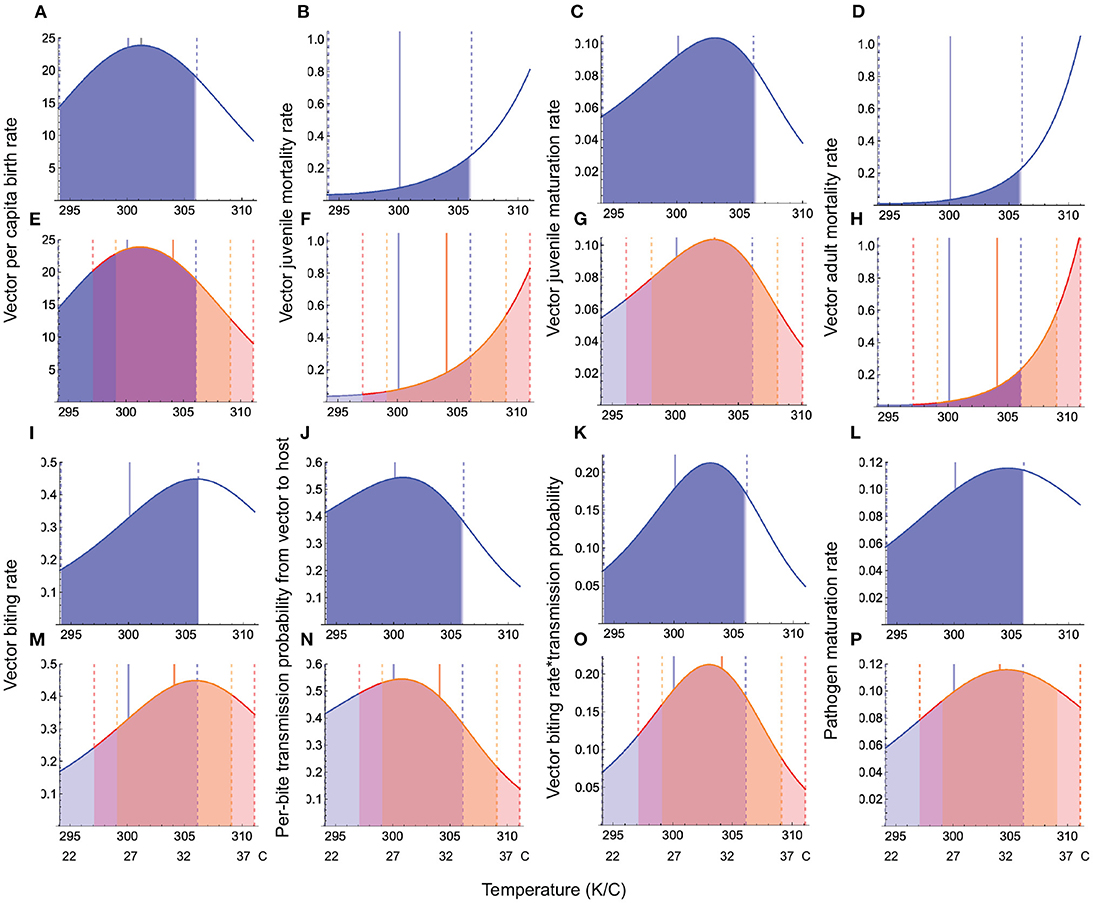
Figure 3. Temperature responses of vector and pathogen traits under seasonal variation and warming. In all panels, the blue curves depict the temperature response function under typical seasonal variation, the blue shaded region depicts the trait response under typical seasonal variation, the solid blue vertical line depicts the mean habitat temperature, and the dashed vertical blue lines depict the temperature range experienced by species under typical seasonal variation. Panels (A–D, I–L) depict trait responses under typical seasonal variation, while (E–H, M–P) depict trait responses under the warmer winters and hotter summers scenarios when the mean annual temperature increases by 4°. Panels (E–H, M–P), the orange shaded region, delimited by dashed vertical orange lines depicts the warmer winters scenario, while the red shaded region, delimited by dashed red vertical lines, depicts the hotter summers scenario. Parameter values for trait responses are given in Table 1.
These findings allow us to predict how trait responses to temperature may translate into disease prevalence at the population level. Given that warming both increases mortality and causes a steep decline in vector and pathogen maturation rates, vector biting rate, and the per-bite transmission probability from vector to host, we expect these two responses to jointly drive warming effects on disease prevalence. Given that the qualitative nature of the temperature responses of life history and interaction (e.g., transmission) traits are conserved across taxa, these predictions about how warming effects on traits translate into disease prevalence should be applicable to most ectotherm disease vectors.
Warming Effects on Disease Prevalence Across Latitudes
Climate warming not only causes disease extinction from the warmest climates (e.g., equatorial tropics) but also contracts the overall thermal range for disease persistence (Figure 4). This is because, despite substantial warming of cooler climates at higher latitudes, there is a lower thermal limit below which the infected vector population cannot persist (Figures 4D–F). Hotter summers prove to be the most detrimental, through a substantially larger decrease in infected host abundance within the thermal range for disease persistence (Figure 4).
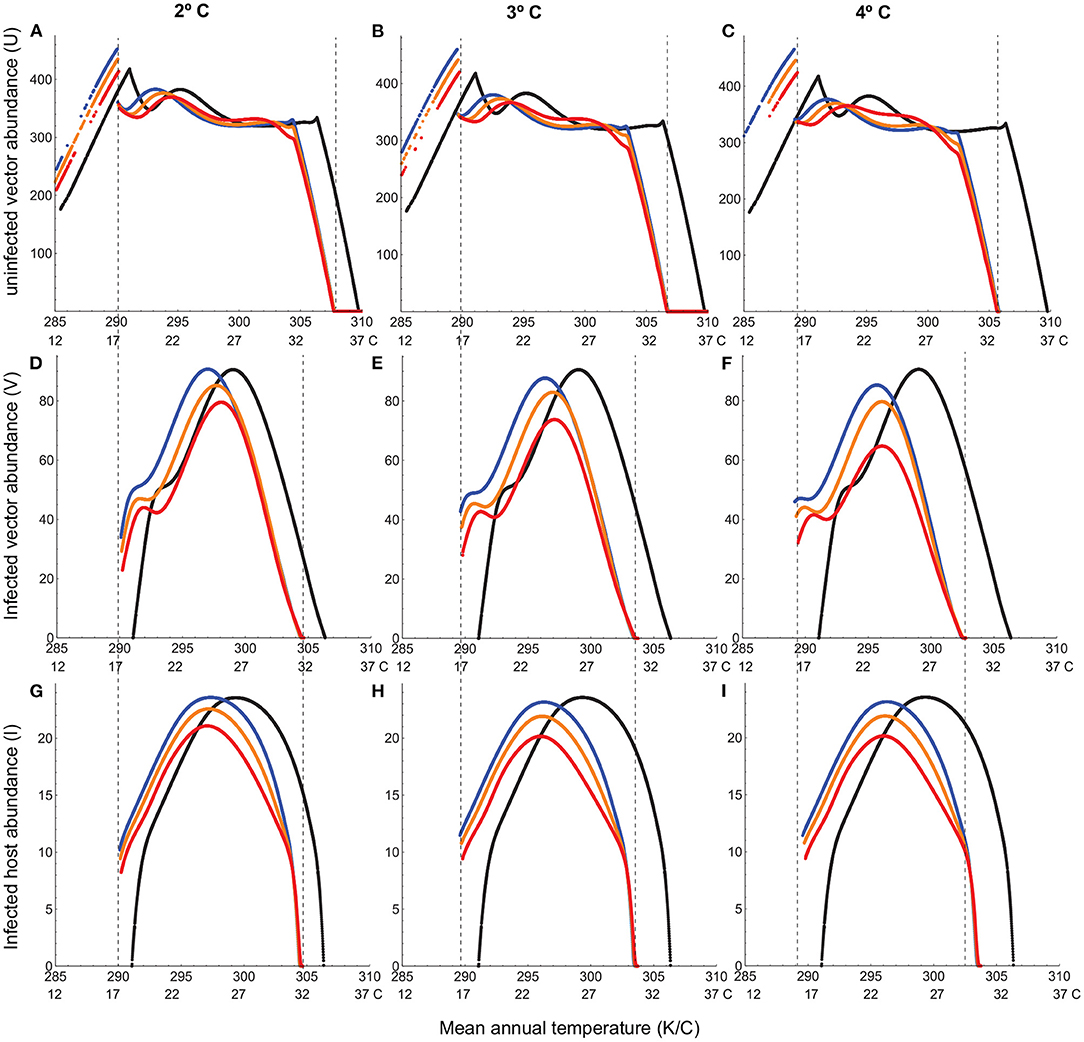
Figure 4. Abundances of uninfected vector (A–C), infected vector (D–F), and infected host (G–I) under climate warming (2°, 3° and 4° increase in mean temperature). In all panels, the black curve depicts typical seasonal variation, the blue, orange, and red curves depict, respectively, warmer winters, baseline and hotter summers scenarios for warming, and the dashed vertical lines depict the thermal limits for infected vector and host viability. Note that the discontinuity in uninfected vector abundance corresponds to the lower thermal limit for infected vector and host viability. Below this temperature, the uninfected vector persists at a higher abundance. Temperature-dependent parameters are given in Table 1. Temperature-independent parameter values are: bH = 0.02, dH = 0.01;qH = 0.002, dI = 0.02, δH = 0.2, γ = 0.05, k = 0.5, pVH = 0.91.
A closer analysis of vector-host dynamics reveals how trait responses to temperature at the individual level can lead to unanticipated outcomes at the population level. Uninfected adult vector populations exhibit a much wider thermal range for viability compared to their infected counterparts (Figure 4; Figures E1–E3, in Appendix E). They can withstand a 3° increase in the mean temperature in localities with typical mean temperatures as high as 33° C (Figure E1 in Appendix E). They can attain substantial numbers in localities of initially high disease prevalence even after the mean temperature increases by 4°, the only adverse effect being a brief decline in summer abundance under the hotter summers scenario (Figure E2 in Appendix E). They can also expand their range to higher latitudes, with typical mean temperatures as low as 12° C, even under low levels of warming (2° increase in the mean temperature; Figures 4A–C; Figure E3 in Appendix E). This is in dramatic contrast to the infected vector population, which exhibits a steep decline in abundance over a much longer duration even under the best case scenario of moderate warming (mean temperature increase of only 2°) at the latitude corresponding to maximum disease prevalence in the absence of warming (Figures 4D–F; Figure E2 in Appendix E). The infected host population follows the same trend as the infected vector population (Figures 4G–I; Figure E2 in Appendix E). When the disease goes extinct from lower latitudes (Figures 4G–I), it is because the infected vector population does (Figures 4D–F; Figure E1 in Appendix E). We see the same pattern at the low-temperature end. The infected vector population cannot persist at higher latitudes even under the highest levels of warming (Figures 4D–F; Figure E3 in Appendix E).
Warming Effects on Malaria Prevalence in West Africa
To determine whether the above general conclusions hold in the specific case of Malaria prevalence, we used the dynamical model to analyze vector-host dynamics in four subregions of west Africa (Figure 5). Yamana et al. (2016) predicted a reduction in prevalence in subregion (i), disease extinction in subregion (ii), decreased prevalence (subject to rainfall) in subregion (iii), and no effect in subregion (iv). Our trait-based analysis of the most recent IPCC predictions shows that prevalence in subregion (i) is driven by the amplitude of typical seasonal fluctuations and warming effects on transmission. When seasonal fluctuations are relatively small (e.g., Linguere, Senegal), infected mosquitos experience large declines in summer abundance under all warming scenarios, lowering the number of infected hosts and reducing disease incidence; when fluctuations are large, (e.g., Berma, Mali) infected mosquitos experience large declines in summer abundance under the warmer winters scenario, and extinction under hotter summers scenario. Even when the uninfected mosquito populations can persist, albeit with large fluctuations, disease prevalence is minimized by large reductions in the infected vector and host populations.
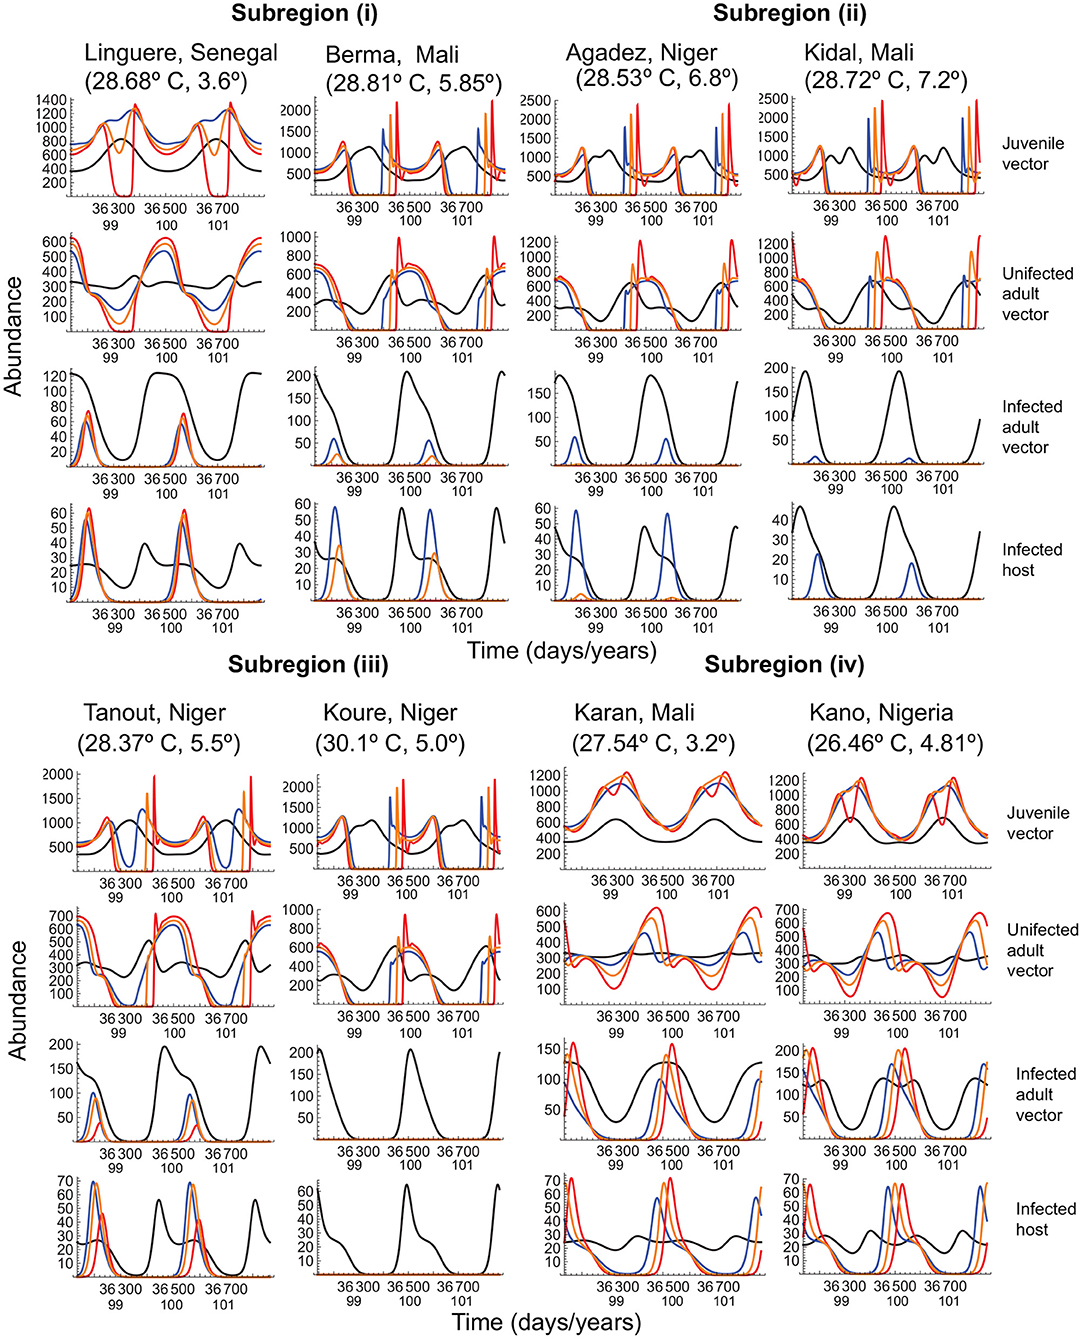
Figure 5. Vector-host dynamics under typical seasonal variation and the three warming scenarios, when the mean temperature increases by 4° over a period of 100 years, in several west African regions to which Malaria is endemic. In all panels, the black curve depicts typical seasonal variation, and the blue, orange, and red curves depict, respectively, warmer winters, baseline, and hotter summers scenarios for warming. Vector and host abundance patterns are depicted for the last two years of warming. The quantities within brackets below each locality name depict the mean annual temperature and the amplitude of seasonal fluctuations at that locality. Temperature-dependent parameters are given in Table 1. Temperature-independent parameter values are as in Figure 4.
In subregion (ii), which already experiences thermal regimes at the upper limit of the vector and pathogen's phenotypic plasticity, the infected vector population barely persists even under typical seasonal variation, and disease extinction is indeed the only outcome except under the warmer winters scenario. In subregion (iii), where the expectation is reduced prevalence, the observed outcome depends on the mean annual temperature. When the mean temperature is lower (< 30° C), the disease can persist but only during the cooler months; when the mean temperature is higher (≥ 30° C) the only outcome is disease extinction. In subregion (iv), where the expectation is no change in prevalence, large summer reductions in infected vector and host populations cause large decreases in disease prevalence.
Discussion
Pathogens (e.g., virus, bacteria, protists) and disease vectors (e.g., mosquitoes, flies, ticks) are ectotherms whose life history traits (e.g., birth, maturation, mortality) and contacts with hosts (e.g., biting rate, transmission probability) depend directly on the environmental temperature. Climate warming is therefore likely to have strong effects on disease spread and prevalence. Predicting warming effects on disease burden requires that we understand how temperature effects on vector and pathogen traits translate into population-level patterns of vector abundance and dynamics, and how these in turn influence vector species' interactions with their (mostly) endotherm hosts. Making accurate predictions about disease spread and prevalence is a high research priority, given the pressing need to develop cost-effective public health policies in an increasingly warmer world.
The typical approach to predicting effects of climate warming on vector-borne diseases is to use the basic reproductive number (R0) to predict disease spread (Mordecai et al., 2013, 2017; Johnson et al., 2015; Shocket et al., 2018, 2020; Tesla et al., 2018; Cator et al., 2020). This metric, however, is derived under assumptions of constant thermal environments and equilibrium conditions (MacDonald, 1955, 1957; Aron, 1988; Diekmann et al., 1990; Dietz, 1993; Parham and Michael, 2010). It is not applicable to the nonstationary (i.e., non-constant, non-equilibrium) thermal environment generated by climate warming. Using R0 to predict disease spread under warming runs the risk of making erroneous predictions about warming that could misguide policy decisions. The challenge is to find an alternative metric that both realistically depicts temperature effects on vector and pathogen traits, and yields reliable metrics of disease spread and prevalence.
Here, we present a theoretical approach that combines a stage-structured model of vector population dynamics with a class-structured epidemiological model of vector-host dynamics. It has the advantage of being able to predict disease spread and prevalence under any type of non-equilibrial, non-stationary environment, including seasonal variation and warming. The novelty of our approach is that we incorporate mechanistic descriptions of vector and pathogen trait responses to temperature into stage-structured models that realistically capture the complex life cycles of arthropod disease vectors. We attempt to strike a balance between biological realism, mathematical rigor, and tractability of numerical analyses. We report three key findings.
First, we find that fitting mechanistic temperature response functions do not require more data than do the current phenomenological approaches. Use of mechanistic response functions is important because it provides a common framework for characterizing vector and pathogen trait responses to temperature that can apply broadly across vector taxa, pathogen types, and geographic location. The functions we use, which are derived from first principles of thermodynamics, depict how temperature effects on underlying biochemical processes (e.g., reaction kinetics, enzyme inactivation) translate into phenotypic-level traits such as the vector's birth, maturation and biting rates, and the pathogen's incubation period within the vector. Several large-scale data analyses (Dell et al., 2011; Englund et al., 2011) have shown that the qualitative nature of these trait responses (e.g., Gaussian, left-skewed; Figure 1) are conserved across ectotherm taxa, and that their parameters are thermodynamically constrained to take only a narrow range of values (Gillooly et al., 2001, 2002; Savage et al., 2004). This means that one can use parameter values from related species when data are unavailable for focal species, a practice already employed in previous studies that use phenomenological trait response functions (Mordecai et al., 2013, 2017; Johnson et al., 2015).
Second, by deriving the Basic Reproductive Number (R0) from an underlying model of vector-host dynamics that incorporates all relevant time delays (latent period in the host, juvenile development delay in the vector, and the pathogen's extrinsic incubation period), we show that the R0 formulation commonly used to predict warming effects on disease spread (Mordecai et al., 2013, 2017; Johnson et al., 2015; Shocket et al., 2018, 2020; Tesla et al., 2018; Cator et al., 2020) is unsuitable for making such predictions. First, it excludes disease-induced mortality in the host, despite strong empirical evidence to the contrary. Second, it assumes an exponentially growing vector population, which violates the fundamental assumption in deriving R0 as the dominant eigenvalue of the next generation matrix evaluated at the disease-free equilibrium. Third, it assumes that the exponentially growing vector population is in climatic equilibrium with the environment, making it inapplicable to the non-equilibrium conditions generated by climate warming. A comparison of the previous formulation of R0 with one we have derived for a self-regulated vector population shows that the former overestimates disease spread in cooler environments and underestimates it in warmer environments, proving to be unreliable even in a constant thermal environment.
Our third finding is on the climate warming effects on vector-borne disease prevalence. The most recent IPCC predictions (IPCC, 2018) suggest an increase in mean temperatures as well as hot extremes. We find that the hotter summers scenario, which incorporates such extremes substantially lowers the upper thermal limit for disease persistence and reduces disease prevalence within the viable region. Because the lower thermal limit, which is set by infected vector population viability, is relatively inflexible, warming has the overall consequence of narrowing the thermal range for disease viability.
A closer inspection of vector-host dynamics reveals an interesting outcome: uninfected vector populations are largely unaffected by warming, while infected vector and host populations are greatly reduced even at low levels of warming. This finding was confirmed by a separate analysis of Malaria prevalence in several west African locations. The reason for this is as follows. Data show that density-independent mortality increases with increasing temperature above a critical threshold, and increases with decreasing temperature below it [Savage et al. (2004) and references in Gillooly et al. (2001, 2002)] (Figure 1). Because such mortality affects all vector classes regardless of their infection status, its effects are compounded as the uninfected vector class moves through the exposed class to the infected class (see Appendix D, Equation D.1). As a result, the infected vector population will necessarily have a narrower thermal limit for viability, and exhibit lower abundances at low and high temperature extremes, compared to its uninfected counterpart.
While higher mortality of the infected vector population at lower temperatures explains why the disease cannot spread to higher latitudes despite warming, higher vector mortality at higher temperatures cannot, in itself, explain the warming-induced decline in the infected host population. We need to also understand how warming affects the transition (maturation) and transmission rates. It is well-known, based on data from a large number of multicellular ectotherms, that the maturation rate exhibits a left-skewed response to temperature, with a rapid decline at high temperatures (Johnson and Lewin, 1946; Sharpe and DeMichele, 1977; Schoolfield et al., 1981; Van der Have and de Jong, 1996; Van der Have, 2002; Ratkowsky et al., 2005; Dell et al., 2011). The sporozoite maturation rate of Protozoan parasites (e.g., Plasmodium, Leishmania) within their vectors exhibits such a left-skewed response. Since it is directly dependent on the sporozoite maturation rate, the per-bite transmission probability of the pathogen from vector to host also exhibits a left-skewed temperature response (Fig. 1). Moreover, the difficulty of obtaining biting rate data has led to approximating the biting rate as the inverse of the gonadotropic cycle (egg maturation time of mosquitoes; Alonso et al., 2010; Hartemink et al., 2011; Mordecai et al., 2013; Johnson et al., 2015). But, the mosquito egg maturation rate itself exhibits a left-skewed response (Fig. 1). The key point is that the transition from exposed to infected vectors, and disease transmission from infected vector to susceptible host are both driven by four temperature response functions, all of which are left-skewed and decline rapidly at high temperature extremes. Not only does the high-temperature decline in the pathogen's maturation rate further reduce the number of infected vector individuals at any given time, but the concomitant decline in the biting rate and per-bite transmission probability means that fewer host individuals will be infected. The key point is that it is the interactive effect of the temperature response of mortality with those of transition (maturation) and transmission traits that drives the differential effect of warming on the uninfected vector class, and on the infected vector and host classes.
Given the inapplicability R0 to the nonstationary environment generated by warming, a more informative approach is to use a trait-based model of vector-host interactions to calculate disease prevalence under the appropriate warming scenario. This requires incorporating temperature response functions of vector and pathogen traits into the dynamical model. Doing so, however, does not constitute an additional burden on the investigator since one needs to perform the same exercise in order to obtain R0 predictions under warming (Mordecai et al., 2013, 2017; Johnson et al., 2015; Shocket et al., 2018, 2020; Tesla et al., 2018; Cator et al., 2020). As we have shown here, fitting mechanistic temperature response functions that accurately capture temperature effects on the biochemical processes underlying vector and pathogen traits does not require more data than the typical approach of fitting phenomenological functions. Moreover, it affords the advantage that parameters have clear biological meaning, and can be compared across different diseases as well as different studies of the same disease.
Previous studies attribute warming-induced declines in disease spread and prevalence to vector mortality. For instance, (Yamana et al., 2016) combined a decade of field observations with climate models to show that warming reduced mosquito survival and lowered the Malaria burden in west Africa. Erickson et al. (2012) found that warming facilitated the spread of dengue to higher latitudes (Illinois) by increasing season length and vector (Aedes albopitucs) period, but deterred it at lower latitudes (Texas, Georgia) due to hotter summers increasing larval mortality. The net outcome was a reduction in overall mosquito abundance, and a change in the abundance pattern from a single summer peak to a bimodal distribution with a spring and autumn peak. Morin and Comrie (2013) predicted a steeper summer decline of the west Nile virus vector (Culex sp.) for the central and Gulf states due to the longer and more intense summer warming projected for these regions, and a shallower decline for northerly locations and high elevations experiencing fewer high temperature extremes. Our trait-based analysis, which differs from these previous studies in using experimental data to parameterize mechanistic trait response functions, shows that when warming reduces infected host and vector populations it is through a complex interaction between adult mortality—the effects of which become compounded as the vector transitions from uninfected to infected—and the warming-induced decreases in the pathogen maturation rate, the vector's biting rate, and the per bite vector-to-host transmission probability. These findings highlight the crucial role that the pathogen's maturation rate and the vector's transmission traits play in driving warming effects on vector-borne diseases.
Our finding that uninfected vector populations can both persist at lower latitudes despite warming, and spread to higher latitudes because of it, has important evolutionary implications for predicting future disease burden. While the currently observed high vector mortality, combined with the reduction in maturation and transmission, may indicate a lowering of disease burden from lower latitudes and a curtailment of its spread to higher latitudes, this expectation does not accommodate vector adaptation to warming. Provided uninfected vector populations are not too small and the requisite genetic variation exists, it is entirely possible that the vector species' thermal reaction norms may evolve to withstand warmer climates and to spread to cooler climates. Evidence for rapid evolution of insecticide resistance in mosquitos and other arthropod vectors (Roberts and Andre, 1994; Hemingway and Ranson, 2000; Zaim and Guillet, 2002; Liu, 2015; Labbé et al., 2017) combined with evidence of genetic diversity within and between species (Tabachnick, 2013; Gloria-Soria et al., 2016; Powell, 2018) caution against being overly optimistic about warming-induced decreases in disease burden in lower latitudes. The same is true of the lower thermal limit for disease persistence. There is ample empirical evidence of rapid acclimation and adaptation of the lower critical temperature in insects (Storey and Storey, 1992; Addo-Bediako et al., 2000; Somero, 2010; Overgaard et al., 2011; Sunday et al., 2012; Araujo et al., 2013; Olson et al., 2013; Pintor et al., 2016), raising the possibility of greater disease spread to cooler climates than is expected based on ecological models alone. There is a crucial need to develop eco-evolutionary models of vector-host dynamics that can accommodate both thermal acclimation and adaptation.
Lastly, our analyses clearly show that using a DDE model with temperature- and time-dependent developmental delays provides the most biologically realistic depiction of vector and pathogen biology, and is therefore the best candidate for predicting disease spread and prevalence under climate warming. The problem, though, is that numerical implementation of such models is difficult and error-prone, unless the appropriate history conditions are correctly specified and the integral functions that calculate juvenile mortality during development are correctly implemented in a computer program (Murdoch et al., 2003). These challenges put DDE-based models out of reach for most ecologists and epidemiologists. The use of ODE equivalents presents an alternative that is more easily numerically implemented, but the representation of delays in terms of instantaneous maturation rates can lead potential under-prediction of disease spread and prevalence at high temperature extremes. The fact that the ODE models allow for calculations of both spread and prevalence in variable thermal environments make them more reliable than the sole use of R0 formulations derived under constant-temperature assumptions. However, the reliability of ODE models needs to be verified by comparing predictions from time-varying DDE models with their ODE equivalents. While this is beyond the scope of our current study, it is an important future direction to pursue.
In conclusion, our work constitutes one of the first attempts at developing a mechanistic theoretical framework that integrates life history theory, thermal biology, population dynamics and epidemiology to investigate climate warming effects on vector-borne diseases. Its novelty lies in elucidating mechanisms from first principles, rather than inferring mechanisms from the data. We incorporate mechanistically-derived temperature response functions, parameterized with temperature response data, into dynamical models to make predictions about disease spread and prevalence that are completely independent of population-level (e.g., time series) data. This provides for greater degrees of freedom and statistical power in comparing time series of prevalence predicted from the model with equivalent data for any location. Our mechanistic approach has the potential to provide reliable information that can be used in formulating cost-effective public health policies.
Data Availability Statement
The original contributions presented in the study are included in the article/Supplementary Material, further inquiries can be directed to the corresponding author.
Author Contributions
PA designed the project and wrote this article with input from AE. AE and PA conducted the analyses. Both authors contributed to the article and approved the submitted version.
Funding
This research was supported by a National Science Foundation grant DEB-1949796 and a Guggenheim Fellowship to PA.
Conflict of Interest
The authors declare that the research was conducted in the absence of any commercial or financial relationships that could be construed as a potential conflict of interest.
Publisher's Note
All claims expressed in this article are solely those of the authors and do not necessarily represent those of their affiliated organizations, or those of the publisher, the editors and the reviewers. Any product that may be evaluated in this article, or claim that may be made by its manufacturer, is not guaranteed or endorsed by the publisher.
Acknowledgments
We thank the Amarasekare lab for their helpful comments and suggestions.
Supplementary Material
The Supplementary Material for this article can be found online at: https://www.frontiersin.org/articles/10.3389/fevo.2022.758277/full#supplementary-material
References
Addo-Bediako, A., Chown, S., and Gaston, K. (2000). Thermal tolerance, climatic variability and latitude. Proc. R. Soc. London Series B 267, 739–745. doi: 10.1098/rspb.2000.1065
Alonso, D., Bouma, M., and Pascual, M. (2010). Epidemic malaria and warmer temperatures in recent decades in an east african highland. Proc. R. Soc. B 278, 1661–1669. doi: 10.1098/rspb.2010.2020
Araujo, M., Ferri-Yanez, F., Marquet, P., Valladares, F., and Chown, S. (2013). Heat freezes niche evolution. Ecol. Lett. 9, 1206–1219. doi: 10.1111/ele.12155
Bacaër, N. (2007). Approximation of the basic reproduction number r0 for vector-borne diseases with a periodic vector population. Bull. Math. Biol. 69, 1067–1091. doi: 10.1007/s11538-006-9166-9
Bacaër, N., and Guernaoui, S. (2006). The epidemic threshold of vector-borne diseases with seasonality. J. Math. Biol. 53, 421–436. doi: 10.1007/s00285-006-0015-0
Brown, J., Gillooly, J. F., Allen, A. P., Savage, V. M., and West, G. B. (2004). Toward a metabolic theory of ecology. Ecology 85, 1771–1789. doi: 10.1890/03-9000
Burnham, K., and Anderson, D. (2002). Model Selection and Multimodel Inference: a Practical Information-Theoretic Approach. 2nd Ed. New York, NY: Springer-Verlag.
Cator, L. J., Johnson, L. R., Mordecai, E. A., El Moustaid, F., Smallwood, T. R., LaDeau, S. L., et al. (2020). The role of vector trait variation in vector-borne disease dynamics. Front. Ecol. Evol. 8, 189. doi: 10.3389/fevo.2020.00189
Ciota, A., Kilpatrick, A., and Kramer, L. (2014). Modelling the effect of temperature on the seasonal population dynamics of temperate mosquitoes. J. Med. Entomol. 51, 55–62. doi: 10.1603/ME13003
Dell, A., Pawar, S., and Savage, V. M. (2011). Systematic variation in the temperature dependence of physiological and ecological traits. Proc. Natl. Acad. Sci. U.S.A. 108, 10591–10596. doi: 10.1073/pnas.1015178108
Diekmann, O., Heesterbeek, J., and Metz, J. A. (1990). On the definition and the computation of the basic reproduction ratio r0 in models for infectious diseases in heterogeneous populations. J. Math. Biol. 28, 365–382.
Dietz, K. (1993). The estimation of the basic reproduction number for infectious diseases. Stat. Methods Med. Res. 2, 23–41.
Englund, G., Ohlund, G., and Hein, C. S D. (2011). Temperature dependence of the functional response. Ecol. Lett. 14, 914–921. doi: 10.1111/j.1461-0248.2011.01661.x
Erickson, R., Hayhoe, K., Presley, S., Allen, L., Long, K., and Cox, S. (2012). Potential impacts of climate change on the ecology of dengue and its mosquito vector the asian tiger mosquito (aedes albopictus). Environ. Res. Lett. 7, 034003. doi: 10.1088/1748-9326/7/3/034003
Gao, D., Lou, Y., He, D., Porco, T., Kuang, Y., Chowell, G., and Ryan, S. (2016). Prevention and control of zika as a mosquito-borne and sexually transmitted disease: a mathematical modelling analysis. Sci. Rep. 6, 28070–28080. doi: 10.1038/srep28070
Gillooly, J. F., Brown, J. H., West, G. B., Savage, V. M., and Charnov, E. L. (2001). Effects of size and temperature on metabolic rate. Science 293, 2248–2251. doi: 10.1126/science.1061967
Gillooly, J. F., Charnov, E. L., West, G. B., Savage, V. M., and Brown, J. H. (2002). Effects of size and temperature on developmental time. Science 293, 2248–2251. doi: 10.1038/417070a
Gloria-Soria, A., Ayala, D., Bheecarry, A., Calderon-Arguedas, O., Chadee, D. D., Chiappero, M., et al. (2016). Global genetic diversity of aedes aegypti. Mol. Ecol. 25, 5377–5395. doi: 10.1111/mec.13866
Hartemink, N., Vanwambeke, S., Heesterbeek, H., Rogers, D., Morley, D., Pesson, B., et al. (2011). Integrated mapping of establishment risk for emerging vector-borne infections: a case study of canine leishmaniasis in southwest france. PLoS ONE 6, 8. doi: 10.1371/journal.pone.0020817
Hartemink, N. A., Purse, B. V., Meiswinkel, R., Brown, H. E., De Koeijer, A., Elbers, A. R. W., et al. (2009). Mapping the basic reproduction number (r0) for vector-borne diseases: a case study on bluetongue virus. Epidemics 1, 153–161. doi: 10.1016/j.epidem.2009.05.004
Hemingway, J., and Ranson, H. (2000). Insecticide resistance in insect vectors of human disease. Ann. Rev. Entomol. 45, 371–391. doi: 10.1146/annurev.ento.45.1.371
IPCC (2018). Global Warming of 1.5 °C: An IPCC Special Report on the Impacts of Global Warming of 1.5 °C Above Pre-industrial Levels and Related Global Greenhouse Gas Emission Pathways, in the Context of Strengthening the Global Response to the Threat of Climate Change, Sustainable Development, and Efforts to Eradicate Poverty. IPCC.
Johnson, F., and Lewin, I. (1946). The growth rate of e. coli in relation to temperature, quinine and coenzyme. J. Cell. Comparat. Physiol. 28, 47–75.
Johnson, L., Ben-Horin, T., Lafferty, K., McNally, A., Mordecai, E., Paaijmans, K., et al. (2015). Understanding uncertainty in temperature effects on vector853 borne disease: a bayesian approach. Ecology 96, 203–213. doi: 10.1890/13-1964.1
Labbé, P., David, J. P., Alout, H., Milesi, P., Djogbénou, L., Pasteur, N., et al. (2017). “Evolution of resistance to insecticide in disease vectors,” in Genetics and Evolution of Infectious Diseases, Ch. 14, ed M. Tibayrenc (Boston: Elsevier), 313–339.
Liu, N. (2015). Insecticide resistance in mosquitoes: impact, mechanisms, and research directions. Annu. Rev. Entomol. 60, 537–559. doi: 10.1146/annurev-ento-010814-020828
MacDonald, G. (1957). The Epidemiology and Control of Malaria. London: Oxford University Press, 201 p.
May, R., and Anderson, R. (1991). Infectious Diseases of Humans: Dynamics and CONTROL. New York, NY: Oxford University Press.
Mordecai, E. A., Cohen, J. M., Evans, M. V., Gudapati, P., Johnson, L., Lippi, C. A., et al. (2017). Detecting the impact of temperature on transmission of zika, dengue, and chikungunya using mechanistic models. PLOS Neglected Tropical Dis. 11:e0005568. doi: 10.1371/journal.pntd.0005568
Mordecai, E. A., Paaijmans, K., Johnson, L., Balzer, C., Ben-Horin, T., Moor, E. A M., et al. (2013). Optimal temperature for malaria transmission is dramatically lower than previously predicted. Ecol. Lett. 16, 22–30. doi: 10.1111/ele.12015
Morin, C. W., and Comrie, A. C. (2013). Regional and seasonal response of a west nile virus vector to climate change. Proc. Natl. Acad. Sci. U.S.A. 110, 15620–15625.
Murdoch, W., and Briggs, C. J. M N. R. (2003). Consumer Resource Dynamics. Princeton, NJ: Princeton University Press.
Olson, J. F., Eaton, M., Kells, S. A., Morin, V., and Wang, C. (2013). Cold tolerance of bed bugs and practical recommendations for control. J. Econ. Entomol. 106, 2433–2441. doi: 10.1603/ec13032
Overgaard, J., Kristensen, T., Mitchell, K., and Hoffmann, A. (2011). Thermal tolerance in widespread and tropical drosophila species: does phenotypic plasticity increase with latitude? Am. Nat. 178, S80–S96. doi: 10.1086/661780
Parham, P. E., and Michael, E. (2010). Modeling the effects of weather and climate change on malaria transmission. Environ. Health Perspect. 118, 620–626. doi: 10.1289/ehp.0901256
Pintor, A. F. E., Schwarzkopf, L., and Krockenberger, A. K. (2016). Extensive acclimation in ectotherms conceals interspecific variation in thermal tolerance limits. PLOS ONE 11, 1–15. doi: 10.1371/journal.pone.0150408
Powell, J. R. (2018). Genetic variation in insect vectors: death of typology? Insects 9, 139. doi: 10.3390/insects9040139
Ratkowsky, D., Olley, J., and Ross, T. (2005). Unifying temperature effects on the growth rate of bacteria and the stability of globular proteins. J. Theor. Biol. 233, 351–362. doi: 10.1016/j.jtbi.2004.10.016
Roberts, D. R., and Andre, R. G. (1994). Insecticide resistance issues in vector-borne disease control. Am. J. Trop. Med. Hygiene 50, 21–34.
Savage, V. M., Gillooly, J. F., Brown, J. H., West, G. B., and Charnov, E. L. (2004). Effects of body size and temperature on population growth. Am. Nat. 163, 429–441. doi: 10.1086/381872
Schoolfield, R., Sharpe, J., and Magnuson, C. (1981). Non-linear regression of biological temperature-dependent rate models based on absolute reaction-rate theory. J. Theor. Biol. 88, 719–731.
Shapiro, L. L. M., Whitehead, S. A., and Thomas, M. B. (2017). Quantifying the effects of temperature on mosquito and parasite traits that determine the transmission potential of human malaria. PLoS Biol. 15, e2003489. doi: 10.1371/journal.pbio.2003489
Sharpe, P., and DeMichele, D. (1977). Reaction kinetics of poikilotherm development. J. Theor. Biol. 64, 649–670.
Sherwood, S., Webb, M. J., Annan, J. D., Armour, K. C., Forster, P. M., Hargreaves, J. C., et al. (2020). An assessment of earth's climate sensitivity using multiple lines of evidence. Rev. Geophys. 58, e2019RG000678. doi: 10.1029/2019RG000678
Shocket, M. S., Ryan, S. J., and Mordecai, E. A. (2018). Temperature explains broad patterns of ross river virus transmission. Elife 7, e37762. doi: 10.7554/eLife.37762
Shocket, M. S., Verwillow, A. B., Numazu, M. G., Slamani, H., Cohen, J. M., El Moustaid, F., et al. (2020). Transmission of west nile and five other temperate mosquito-borne viruses peaks at temperatures between 23 c and 26 c. Elife 9, e58511. doi: 10.7554/eLife.58511
Somero, G. (2010). The physiology of climate change: how potentials for acclimatization and genetic adaptation will determine ‘winners’ and ‘losers’. J. Exp. Biol. 213, 912–920. doi: 10.1242/jeb.037473
Storey, K., and Storey, J. (1992). Natural freeze tolerance in ectothermic vertebrates. Annu. Rev. Physiol. 54, 619–637.
Sunday, J., Bates, A., and Dulvy, N. (2012). Thermal tolerance and the global redistribution of animals. Nat. Clim. Change 2, 686–90. doi: 10.1038/nclimate1539
Tabachnick, W. J. (2013). Nature, nurture and evolution of intra-species variation in mosquito arbovirus transmission competence. Int. J. Environ. Res. Publ. Health 10, 249–277. doi: 10.3390/ijerph10010249
Tesla, B., Demakovsky, L. R., Mordecai, E. A., Ryan, S. J., Bonds, M. H., Ngonghala, C. N., et al. (2018). Temperature drives zika virus transmission: evidence from empirical and mathematical models. Proc. R. Soc. B Biol. Sci. 285, 20180795. doi: 10.1098/rspb.2018.0795
Van der Have, T. (2002). A proximate model for thermal tolerance in ectotherms. Oikos 98, 141–155. doi: 10.1034/j.1600-0706.2002.980115.x
Van der Have, T. M., and de Jong, G. (1996). Adult size in ectotherms: temperature effects on growth and differentiation. J. Theor. Biol. 183, 329–340.
Wonham, M., De-Camino-Beck, T., and Lewis, M. (2004). An epidemiological model for west nile virus: invasion analysis and control applications. Proc. R. Soc. B 271, 501–507. doi: 10.1098/rspb.2003.2608
Yamana, T. K., Bomblies, A., and Eltahir, E. A. (2016). Climate change unlikely to increase malaria burden in west africa. Nat. Clim. Change 6, 1009–1013. doi: 10.1038/nclimate3085
Keywords: basic reproductive number (R0), climate warming, disease spread, disease prevalence, vector-borne diseases
Citation: Endo A and Amarasekare P (2022) Predicting the Spread of Vector-Borne Diseases in a Warming World. Front. Ecol. Evol. 10:758277. doi: 10.3389/fevo.2022.758277
Received: 13 August 2021; Accepted: 18 March 2022;
Published: 25 April 2022.
Edited by:
György Barabás, Linköping University, SwedenReviewed by:
Tom Lindström, Linköping University, SwedenMichael Thorsten Gastner, Yale-NUS College, Singapore
Copyright © 2022 Endo and Amarasekare. This is an open-access article distributed under the terms of the Creative Commons Attribution License (CC BY). The use, distribution or reproduction in other forums is permitted, provided the original author(s) and the copyright owner(s) are credited and that the original publication in this journal is cited, in accordance with accepted academic practice. No use, distribution or reproduction is permitted which does not comply with these terms.
*Correspondence: Priyanga Amarasekare, amarasek@ucla.edu