
95% of researchers rate our articles as excellent or good
Learn more about the work of our research integrity team to safeguard the quality of each article we publish.
Find out more
ORIGINAL RESEARCH article
Front. Environ. Sci. , 24 January 2025
Sec. Environmental Informatics and Remote Sensing
Volume 13 - 2025 | https://doi.org/10.3389/fenvs.2025.1524937
 Yongyi Yuan
 Boyi Liao*
Accurate precipitation data are crucial for effective drought monitoring, especially in China’s complex and diverse climatic regions. This study evaluates the performance of six multisource precipitation products-ERA5-Land, CMORPH CRT, GSMaP MVK, IMERG Late, and IMERG Final-in detecting drought across China from 2009 to 2019, using ground station observations for validation. By applying various drought and evaluation indices across various timescales, this analysis captures short and long-term climate variations, assessing each product’s accuracy across diverse regions. Spatial and temporal analyses revealed that IMERG Final closely aligns with observed precipitation, particularly in the high-rainfall areas like the Yangtze River Basin, while GSMaP MVK and ERA5 tend to overestimate precipitation in arid and semi-arid regions. Discrepancies are most pronounced in complex terrains such as the Qinghai-Tibet Plateau and southwestern mountains, where sparse observational networks exacerbate errors. Drought indices, including SPEI-3 and SPI-1, were used to measure each product’s effectiveness in detecting drought intensity, frequency, and duration. IMERG Final consistently showed the highest correlation with ground data across all drought levels (Light, Moderate, and Severe), while GSMaP MVK and ERA5 tended to overestimate drought occurrences in certain drought-prone areas. Hotspot analyses of indices such as CDD, PRCPTOT, and R95p further confirmed IMERG Final’s accuracy in identifying drought and wet event patterns, closely reflecting ground measurements, whereas ERA5 and GSMaP MVK occasionally overestimated drought frequencies. In summary, IMERG Final emerged as a relatively accurate and reliable product for drought monitoring, showing strong applicability across China’s diverse climatic regions. These findings aid in data correction, enhances understanding of regional drought variability, and integration strategies to improve water resource management and extreme event monitoring.
The primary drivers of climate change and increasing drought events in China include greenhouse gas emissions (Abbas et al., 2022), land use changes (Huang et al., 2024), industrial activities (Chen et al., 2021), and energy consumption (Xia et al., 2022). Precipitation, as a key component of the water cycle, directly impacts agriculture, water resource management, and ecosystem stability (Levizzani and Cattani, 2019). With its vast and diverse climate and terrain, China is particularly vulnerable to extreme drought events, which severely affect agriculture, water resources, ecosystems, economic development, and social stability (Yu et al., 2014). Addressing these challenges requires accurate precipitation data to support effective drought monitoring and forecasting, which are critical for disaster risk reduction, resource management, and ecosystem protection (Sheffield et al., 2018; Sarwar et al., 2022).
Traditional ground-based meteorological stations and radars, limited by uneven distribution—especially in remote and mountainous regions—struggle to effectively capture the spatial and temporal variability of precipitation effectively, posing challenges for drought monitoring and disaster prevention (Ye et al., 2024; Zhang, Liu, and Pu, 2023). Multi-source precipitation products, derived from satellite remote sensing and reanalysis data, offer extensive spatial coverage and high temporal resolution, effectively addressing these observational gaps (Hu et al., 2016). Recently, such datasets have become indispensable in hydrological and climate studies, particularly for assessing drought in complex terrains (Elahi et al., 2024; Abbas et al., 2023). Despite their utility, existing precipitation products face notable limitations.
For instance, IMERG underestimates rainfall in high-altitude areas like the Yarlung Tsangbo Grand Canyon (Li et al., 2023), while GSMaP demonstrates closer alignment to gauge data in mountainous areas (Tang et al., 2023). However, many evaluations are constrained to specific regions or short timeframes, limiting the generalizability of results across China’s diverse climates and overlooking critical aspects of drought detection by focusing primarily on average precipitation patterns (Ding et al., 2020; Xu et al., 2024). Current studies frequently assess precipitation products in isolation, neglecting comprehensive comparisons that account for differences in spatial and temporal resolution and data processing. These gaps hinder researchers and policymakers in selecting the most effective datasets for robust drought monitoring (Irannezhad and Liu, 2022).
Limited observational coverage in remote and mountainous areas introduces inaccuracies in validating satellite precipitation products (Thornton et al., 2022; Wijeratne et al., 2023). Moreover, satellite precipitation products encounter significant errors due to cloud classification limitations, atmospheric variability, and biases in estimating precipitation intensity, especially in convective or monsoon-prone regions (Battaglia et al., 2020; Morrison et al., 2020). Temporal resolution constraints further impede the detection of short-term events, while complex terrain and uneven cloud distribution exacerbate uncertainties, particularly in mountainous and coastal areas (Sokol et al., 2021). Traditional satellite algorithms face difficulties in capturing the high spatial heterogeneity in these regions. In drought monitoring, single indices like the Standardized Precipitation Index (SPI) or the Palmer Drought Severity Index (PDSI) provide useful insights across diverse terrains and climates (Pandžić et al., 2022). While multi-source precipitation products address some limitations of ground-based observations, their systematic evaluation for drought detection remain limited, especially in complex terrain (Stewart, Carleton, and Groucutt, 2022). This study aims to fill this gap by conducting a comprehensive evaluation of these products using multiple indicators, thereby enhancing their reliability for drought monitoring, water management, and ecological protection (Nguyen et al., 2023; Ullah et al., 2023).
This study conducts a comprehensive evaluation of six multi-source precipitation products (ERA5, ERA5-Land, CMORPH CRT, GSMaP MVK, IMERG Late, and IMERG Final) for detecting extreme precipitation and drought events across China, integrating multiple drought and evaluation indices—such as CDD, PRCPTOT, R95p, SPI, and SPEI—at varying spatial and temporal scales. By analyzing daily precipitation and monthly potential evapotranspiration data from 2009 to 2019, combined with ground-based gauge observations, this research systematically assesses the performance of these products in monitoring extreme climate events. The study addresses gaps in existing research by covering diverse climatic regions and providing insights into precipitation product performance in China’s sub-regions, including areas with complex terrain and distinct agricultural practices. Advanced hotspot analyses offer new interpretations of regional drought variability, while validation against extensive ground-based data enhances the reliability of satellite precipitation products, particularly in regions with sparse observational networks. The primary objectives are to analyze precipitation patterns, evaluate the capability of precipitation products in detecting drought conditions across various climatic and topographic regions, and identify regional variations to support socio-economic planning, water resource management, and ecological conservation. This research advances drought monitoring methodologies and provides actionable insights into data integration and validation, contributing to more effective drought management in China’s diverse environments.
China, located in East Asia, has a diverse topography characterized by a west-high to east-low stepped distribution, including plateaus, mountains, hills, and plains (Yang et al., 2023). This varied landscape leads to complex climate types, significantly affecting the spatial and temporal distribution of precipitation. As shown in Figure 1, The terrain is divided into three main steps: the first step is the Qinghai-Tibet Plateau, with an average elevation of over 4,000 m; the second step includes the Inner Mongolia, Loess, and Yunnan-Kweichow Plateau, with elevations of 1,000–2000 m; and the third step is the eastern plains and hills, with elevations below 500 m (Prieler, 2005). These terrain variations directly influence regional climate and precipitation patterns. Southern China, significantly influenced by the monsoon, has an average annual precipitation of 800–2,000 mm, while northern and northwestern regions receive less, with some areas below 200 mm (Wu et al., 2016). Precipitation is concentrated from June to September, leading to frequent floods and droughts. The diverse topography and climate contribute to frequent extreme precipitation and drought events, impacting agriculture, water resources, and socioeconomic development (Yu et al., 2018).
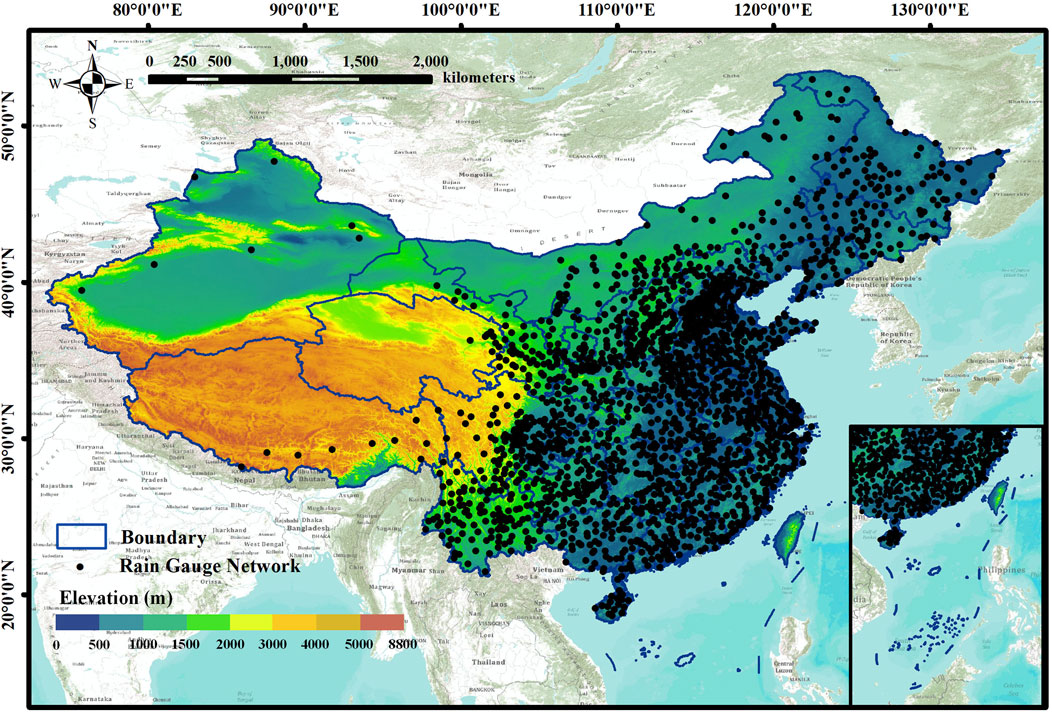
Figure 1. Spatial distributions of the elevation and rain gauge network in China.
The hourly rain gauge data from 1,950 national ground stations used in this study were obtained from the National Meteorological Information Center (NMIC) of CMA (http://data.cma.cn). The spatial distribution of these ground stations is illustrated in Figure 1. The daily datasets typically include measurements of air temperature, pressure, precipitation, wind, etc. The rain gauge data underwent strict quality control to ensure completeness and reliability. Apart from the relatively sparse distribution of stations in the western region, the stations are fairly evenly distributed across China, providing favorable conditions for analyzing regional precipitation patterns.
ERA5 is the fifth-generation ECMWF reanalysis of global climate and weather, providing data from 1940 to the present, replacing the ERA-Interim reanalysis (Hersbach et al., 2020). It combines model data with observations through data assimilation to create a globally consistent dataset. Unlike real-time forecasts, ERA5 allows more time to incorporate improved historical observations, enhancing data quality. Accessible via the C3S Climate Data Store (https://cds.climate.copernicus.eu/#!/home). Detailed information on the satellite-based and model-based precipitation products used in this study has been provided in Table 1.
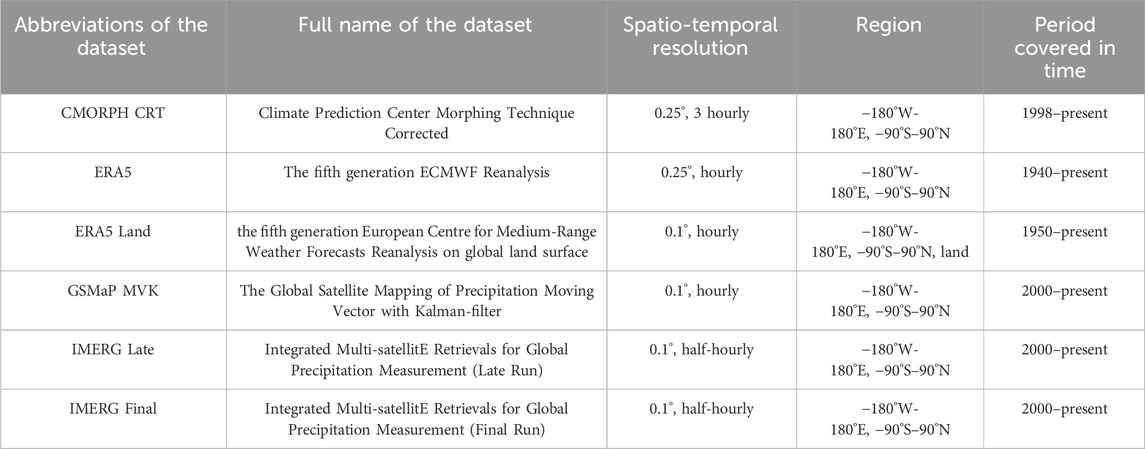
Table 1. Summary of the gridded precipitation products used in this study.
ERA5-Land is a high-resolution land reanalysis dataset derived from ECMWF’s ERA5 climate reanalysis (Muñoz-Sabater et al., 2021). It integrates model outputs and observational data through physical assimilation to effectively reconstruct historical climate conditions. The dataset provides multiple indicators, including temperature, lake levels, snow cover, soil moisture, radiation, evapotranspiration, runoff, wind speed, atmospheric pressure, precipitation, and vegetation. The dataset can be accessed via the C3S Climate Data Store (https://cds.climate.copernicus.eu/#!/home).
CMORPH CRT is a globally corrected high-resolution precipitation dataset designed to provide detailed precipitation distributions over both short and long-term scales (Joyce et al., 2004). Developed by the Climate Prediction Center (CPC), it integrates microwave observations from multiple low-earth orbit satellites and infrared data from geostationary satellites. The core algorithm generates precipitation motion vectors from infrared observations, which are used to morph the instantaneous precipitation estimates from microwave data to the desired time intervals, creating continuous spatial coverage. CMORPH CRT data can be accessed via the CPC website (https://www.ncei.noaa.gov/products/climate-data-records/precipitation-cmorph).
GSMaP MVK is a global high-resolution precipitation dataset designed to provide precise spatial and temporal precipitation distributions (Ushio et al., 2009). Developed by the Japan Aerospace Exploration Agency (JAXA), it is generated using microwave observations from multiple low-Earth orbit satellites, supplemented and refined by geostationary satellite infrared data. The generation algorithm first retrieves precipitation estimates from microwave data, and then applies motion vectors derived from infrared data to morph these instantaneous estimates, ensuring temporal continuity of precipitation features. GSMaP MVK data can be accessed through the JAXA website (https://sharaku.eorc.jaxa.jp/GSMaP/index.htm).
IMERG Late is a high-resolution precipitation dataset generated from a combination of satellite-based microwave and infrared data (Huffman et al., 2015). The dataset is created by using microwave-derived precipitation estimates from low-earth orbit satellites, supplemented by infrared data from geostationary satellites to generate motion vectors that capture the temporal and spatial dynamics of precipitation systems. The algorithm then applies Kalman filtering and data fusion techniques to integrate estimates from multiple sensors, ensuring continuity and accuracy in the precipitation distribution. The dataset can be accessed through the NASA GPM portal (https://disc.gsfc.nasa.gov/).
IMERG Final, developed by NASA’s Global Precipitation Measurement (GPM) mission, is a high-resolution precipitation dataset generated by integrating passive microwave data from multiple low-earth orbit satellites, infrared observations from geostationary satellites, and surface rain gauge data (Huffman et al., 2015). The process begins with the GPM core satellite’s microwave observations to estimate instantaneous precipitation. These estimates are then combined with data from other microwave satellites for a more comprehensive precipitation estimate. Infrared data from geostationary satellites ensure temporal and spatial continuity of the precipitation system, while surface rain gauge data are used for calibration and bias correction, enhancing accuracy. The dataset can be accessed through NASA’s GPM data portal (https://disc.gsfc.nasa.gov/).
The 1 km Monthly Potential Evapotranspiration (PET) Dataset for China is a reanalysis dataset providing high-resolution PET data from 1990 to 2021, with a spatial resolution of approximately 1 km (Peng et al., 2019). This dataset calculates PET using the Hargreaves formula, incorporating variables such as solar radiation, maximum temperature, minimum temperature, and average temperature. The dataset is available for download from the National Tibetan Plateau/Third Pole Environment Data Center (http://data.tpdc.ac.cn).
This study systematically evaluates the accuracy of multi-source satellite precipitation data by validating it against ground station observations, with a focus on drought detection. Ground-based meteorological data and multi-source precipitation datasets were aligned using nearest-neighbor interpolation to ensure consistency with station locations. The evaluation was conducted at daily, monthly, and annual timescales to analyze the performance across short- and long-term scales. This multi-temporal analysis enhances the robustness of the results by minimizing biases related to specific temporal scales.
This study lies in the integration of multiple drought indices (SPI, SPEI, CDD, PRCPTOT, and R95p) with traditional statistical metrics (CC, BIAS, MAE). Unlike previous studies that typically focus on a single index or temporal scale, this research applies a composite approach by cross-analyzing different indices to provide a more nuanced understanding of drought conditions across diverse climatic regions in China. Furthermore, To ensure the reliability of these indices, this study conducted comparative analysis across multiple datasets and performed historical drought event validation. By comparing SPI and SPEI values derived from different precipitation products, the study evaluated their consistency and applicability across diverse climatic regions. Additionally, the performance of drought indices was evaluated through historical precipitation records and ground station observations, ensuring their applicability and accuracy in monitoring drought across high-altitude, arid, and semi-arid regions.
The evaluation of gridded precipitation product data was carried out using a comprehensive set of validation metrics at various scales to assess their effectiveness in drought monitoring. These metrics include:
1. Correlation Coefficient (CC): Measures the consistency between precipitation products and rain gauge data, indicating the strength of their relationship.
2. Relative Bias (BIAS): Reflects the deviation between precipitation products and rain gauge data, identifying tendencies toward overestimation or underestimation.
3. Mean Absolute Error (MAE): Represents the average magnitude of errors between predicted and observed values, highlighting overall accuracy.
4. Consecutive Dry Days (CDD): Measures the longest stretch of consecutive days with precipitation below a defined threshold (e.g., 1 mm/day), providing insights into drought duration and severity.
5. Total Precipitation (PRCPTOT): Represents the cumulative precipitation over a given period, serving as a fundamental metric for evaluating overall precipitation availability and its role in drought development.
6. Very Wet Days (R95p): Quantifies the total precipitation on days exceeding the 95th percentile of daily rainfall, offering insights into the occurrence and intensity of wet periods, which inversely relate to drought conditions.
For this analysis, the threshold for precipitation occurrence was set at 0.1 mm/h. The equations for all evaluation metrics, including CC, BIAS, MAE, CDD, PRCPTOT, and R95p, are provided in Table 2. These metrics collectively offer a robust framework for assessing the accuracy and reliability of precipitation datasets in capturing drought characteristics across diverse climatic and geographic settings.
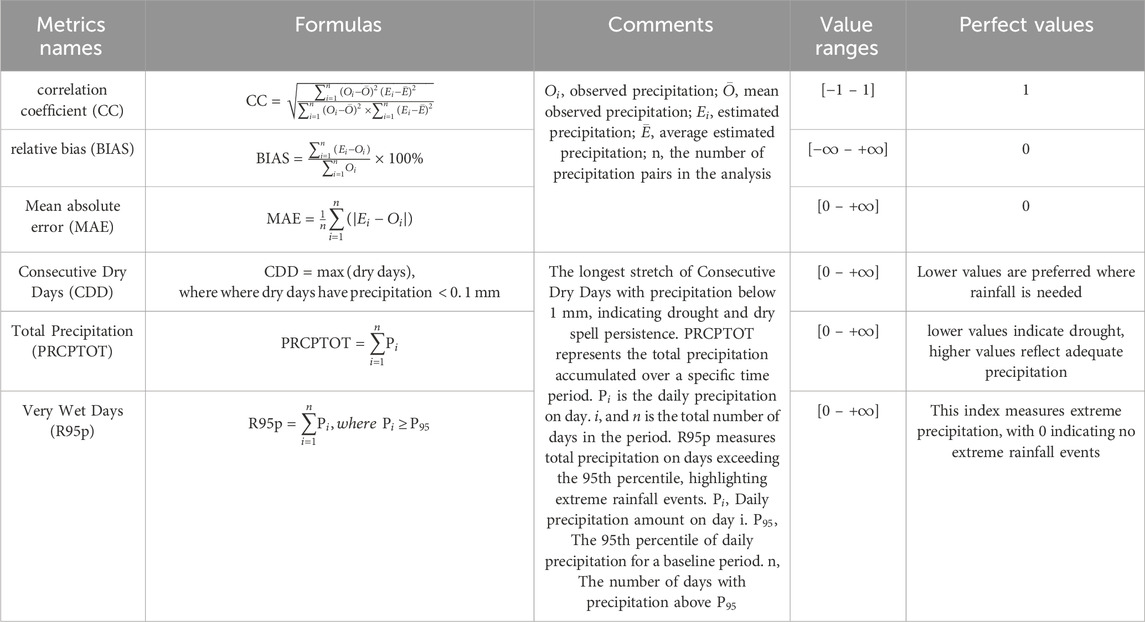
Table 2. List of the evaluation metrics for evaluating precipitation products in this study.
This study systematically evaluates drought dynamics across China by applying the Standardized Precipitation Index (SPI) and the Standardized Precipitation Evapotranspiration Index (SPEI) at multiple timescales (1, 3, 6, and 12 months). These indices are widely recognized for their ability to detect short- and long-term drought conditions by assessing moisture deficits and surpluses. While SPI focuses solely on precipitation variability, SPEI integrates both precipitation and evapotranspiration, offering a more comprehensive measure of drought severity by accounting for temperature-driven evapotranspiration effects. This research enhances the evaluation process by:
1. Multi-Timescale Analysis: SPI and SPEI are applied across four timescales (1, 3, 6, and 12 months), allowing for the identification of both rapid-onset and prolonged droughts. This multi-temporal approach provides deeper insights into seasonal and inter-annual drought variability, which is critical for regions with complex topography and diverse climates.
2. Cross-Validation with Ground Data: Unlike studies that focus exclusively on satellite data, our approach incorporates ground-based rain gauge measurements to validate SPI and SPEI outputs. This validation step ensures higher accuracy and reduces biases commonly associated with satellite precipitation estimates, particularly in remote or mountainous areas.
3. Hotspot and Cold Spot Analysis: By integrating drought frequency analysis with spatial pattern detection (CDD, PRCPTOT, R95p), the study not only quantifies drought intensity but also identifies regions prone to persistent droughts (cold spots) and extreme wet events (hot spots). This dual analysis reveals spatial heterogeneities that might be overlooked in traditional drought assessments.
1) SPI (Standardized Precipitation Index), SPI quantifies drought conditions by measuring deviations in precipitation from the historical average over specified timeframes, allowing for the identification of short-to long-term moisture deficits or excesses. This index provides insight into drought intensity, frequency, and duration. The precipitation amount x is assumed to follow a Gamma distribution (see Equation 1):
In Equation,
2) SPEI (Standardized Precipitation Evapotranspiration Index), SPEI evaluates drought by considering both precipitation and potential evapotranspiration, offering a comprehensive measure of moisture balance. This index helps in assessing the severity and duration of drought events across various timescales, accounting for changes in both rainfall and evaporative demand. To calculate the potential evapotranspiration (see Equation 4):
T, The monthly average temperature in Celsius. I, The heat index, calculated by summing the monthly indices over the year. m and K, Coefficients related to the number of days in the month and the geographic location. In Equation 5, Di, The difference between precipitation and potential evapotranspiration.
When the probability p > 0.5, the expressions of
The constant coefficients are, c0 = 2.515517, c1 = 0.802853, c2 = 0.010328, d1 = 1.432788, d2 = 0.189269, and d3 = 0.001308.
This study integrates ground station data with multi-source precipitation datasets to evaluate drought frequency and intensity across China using SPI and SPEI indices at multiple timescales (1, 3, 6, and 12 months). By incorporating cold and hot spot analyses (CDD, PRCPTOT, R95p), the research identifies regions with persistent dry or wet conditions, enhancing the understanding of spatial drought patterns. Validation is conducted by comparing index outputs to ground station observations, ensuring temporal consistency and accurate reflection of moisture deficits across diverse terrains. This comprehensive approach addresses the limitations of satellite-only indices, particularly in complex topographies, and highlights the value of evapotranspiration-sensitive indices (SPEI) for detecting heat-induced droughts. The findings provide actionable insights for policymakers, aiding in water resource management, disaster preparedness, and long-term drought risk assessment.
The annual precipitation and potential evapotranspiration patterns across China (Figures 2A–I) show distinct spatial variations, with higher precipitation in southern China and lower precipitation in northern arid regions. Monthly precipitation trends from 2009 to 2019 (Figure 2J) align closely with ground station data. The rain gauge data (Figure 2A) were interpolated using the inverse distance weighting (IDW) method (Figure 2B) to improve spatial continuity, capturing the clear north-south gradient in precipitation. The precipitation products—CMORPH CRT (Figure 2C), ERA5 (Figure 2D), GSMaP MVK (Figure 2E), IMERG Late (Figure 2F), IMERG Final (Figure 2G), and ERA5-Land (Figure 2H)—generally capture this distribution but show varying levels of accuracy. While IMERG Final (Figure 2G) demonstrates high consistency with observed precipitation, discrepancies are noticeable in other products. CMORPH CRT tends to underestimate precipitation in northern regions, reflecting limitations in detecting light precipitation events over complex terrains, and likely due to limited microwave signal penetration and misclassification of light precipitation. GSMaP MVK (Figure 2E) shows significant overestimation in arid and semi-arid regions, which may stem from convective biases and over-representation of small-scale rainfall events. ERA5 and ERA5-Land (Figures 2D, H) show slight overestimations, particularly in southern China, during summer and autumn, attributed to biases in reanalysis models that amplify precipitation over complex terrain. These overestimations are more pronounced in the Qinghai-Tibet Plateau and southwestern mountainous areas, where sparse ground station networks exacerbate inaccuracies. IMERG Final shows the best alignment, capturing both seasonal peaks and inter-annual variability. The potential evapotranspiration (PET) (Figure 2I) shows high values in arid northwest regions like Xinjiang and the Tibetan Plateau due to strong solar radiation and low humidity, while southern areas have lower PET due to higher humidity and frequent precipitation. Discrepancies are most pronounced, particularly over the Qinghai-Tibet Plateau and southwestern mountainous areas, where terrain complexity, sparse observational coverage, and algorithm limitations contribute significantly to performance variations across products. Calibration efforts should focus on addressing high-altitude regions and improving microwave retrieval algorithms to enhance precipitation detection over diverse landscapes.
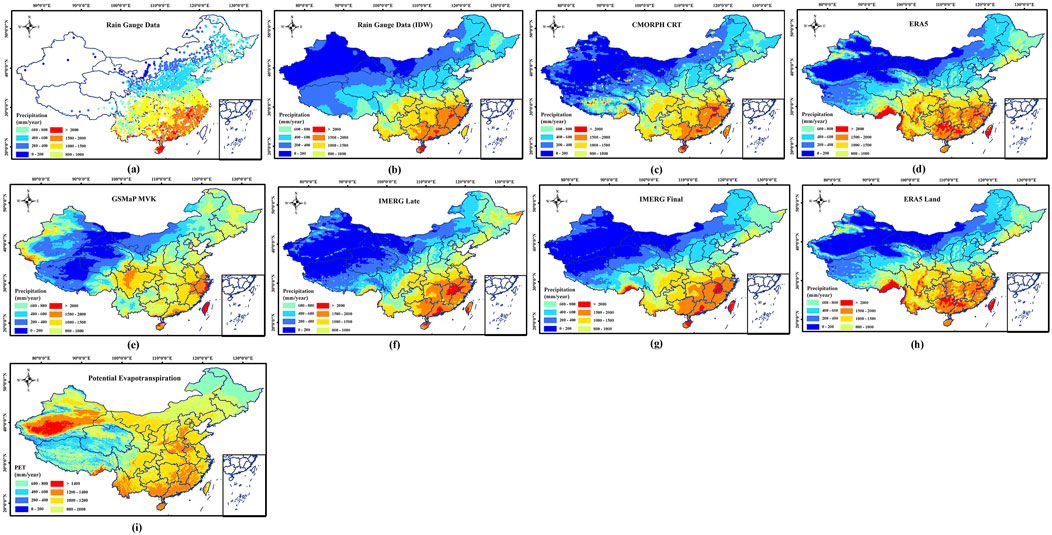
Figure 2. Annual precipitation and potential evapotranspiration across China: (A) Rain Gauge Data, (B) IDW-interpolated Rain Gauge Data, (C) CMORPH CRT, (D) ERA5, (E) GSMaP MVK, (F) IMERG Late, (G) IMERG Final, (H) ERA5-Land, (I) Potential Evapotranspiration (PET).
Figure 3 displays the monthly precipitation trends from 2009 to 2019, comparing ground station observations with six precipitation products. The graph highlights the seasonal cycle of precipitation, with distinct peaks during the summer months and lower precipitation during winter. IMERG Final consistently aligns closely with ground station data, demonstrating minimal deviations and accurately capturing seasonal fluctuations, particularly during monsoon seasons and winter. In contrast, GSMaP MVK exhibits noticeable overestimations during summer peaks. This overestimation likely results from the enhanced sensitivity of GSMaP to cloud cover and convective systems, which dominate the summer precipitation regime. ERA5 and ERA5-Land also show slight overestimations during summer, aligning with known biases in reanalysis models that tend to overestimate precipitation in high-moisture environments. CMORPH CRT and IMERG Late show minor deviations, with IMERG Late follows a pattern similar to IMERG Final but shows greater deviations. Overall, the products effectively follow the seasonal precipitation cycle; however, discrepancies become more pronounced during intense summer rainfall.
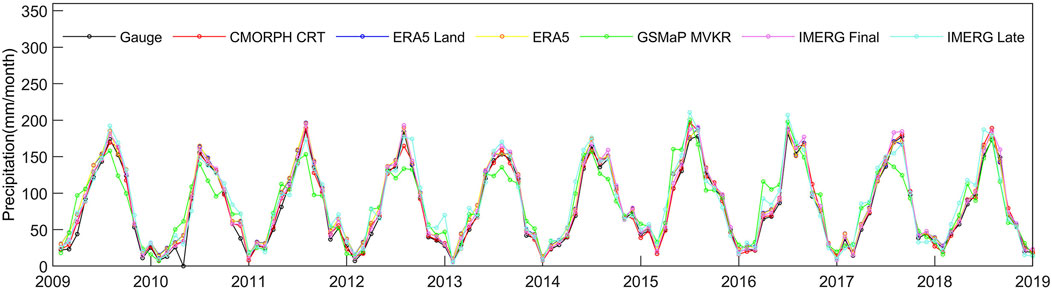
Figure 3. Monthly precipitation trends (2009–2019): Comparison of ground station observations with IMERG Final, IMERG Late, CMORPH CRT, GSMaP MVK, ERA5, and ERA5-Land.
Figure 4 compares SPEI-3 performance across multiple precipitation products (CMORPH CRT, ERA5, ERA5-Land, GSMaP MVK, IMERG Late, and IMERG Final) against ground station data using CC, Bias, and MAE as evaluation metrics. IMERG Final consistently outperformed other datasets, demonstrating the highest correlation (CC > 0.85) in high-precipitation regions, such as the Yangtze River Basin and southeastern China. Its low bias and minimal MAE highlight the effectiveness of IMERG Final in capturing precipitation variability and detecting drought conditions. This superior performance can be attributed to IMERG Final’s incorporation of gauge data during calibration, which enhances accuracy in humid environments. CMORPH CRT and IMERG Late exhibited moderate performance (CC = 0.75–0.83), but struggled in arid and high-altitude regions, such as the Tibetan Plateau and northwestern China. CMORPH CRT consistently underestimated precipitation (Bias < −10%), indicating difficulties in detecting light rainfall events common to these areas. This underestimation likely reduces the effectiveness of these products in identifying drought conditions in dry regions. ERA5 and ERA5-Land showed moderate correlations (CC = 0.68–0.76), but overestimated precipitation in southern regions, particularly during the monsoon season, with biases reaching +12% in areas with complex topography like the Qinghai-Tibet Plateau. GSMaP MVK performed the weakest, with the lowest correlation (CC = 0.61–0.68) and significant overestimations in northern arid zones (Bias >15%). The overestimation suggests GSMaP’s reliance on infrared-based precipitation estimates amplifies convective rainfall, leading to false detections of wet conditions during dry periods. IMERG Final consistently achieved the lowest MAE (MAE <8 mm/month), confirming its suitability for drought monitoring, while GSMaP MVK recorded the highest errors (MAE >15 mm/month), highlighting the need for further calibration and algorithm adjustments.
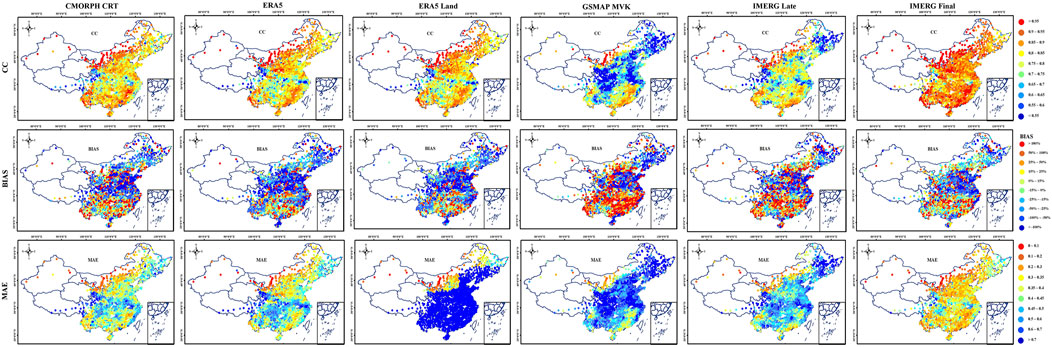
Figure 4. Performance comparison of SPEI-3 index across multiple precipitation products (CMORPH CRT, ERA5, ERA5-Land, GSMaP MVK, IMERG Late, and IMERG Final) against ground station data using CC, bias, and MAE metrics.
Figure 5 compares the SPI-3 performance of various precipitation products (CMORPH CRT, ERA5, ERA5-Land, GSMaP MVK, IMERG Late, and IMERG Final) against ground station data, evaluating CC, Bias, and MAE. IMERG Final once again outperformed other datasets, demonstrating the highest correlation (CC > 0.83) in monsoon-affected areas and the Yangtze River Basin. Its ability to capture dry spells and extreme rainfall events aligns closely with ground station data, reinforcing its suitability for monitoring short-term droughts, particularly in southern China. CMORPH CRT and IMERG Late followed with moderate correlations (CC = 0.74–0.81), but underestimated precipitation in northern and northwestern China. This underestimation led to frequent misclassification of drought severity, likely due to the products’ inability to capture light rainfall in regions with sporadic precipitation patterns. ERA5 and ERA5-Land demonstrated regional variability, overestimating precipitation in southern China while underestimating it in arid areas, with biases of approximately +9% observed in southwestern mountainous regions. GSMaP MVK consistently overestimated precipitation, resulting in false identifications of wet conditions during drought periods, particularly in northern China and the Tibetan Plateau. Although less pronounced in southern regions, this overestimation still influenced SPI-3’s accuracy during summer. IMERG Final had the lowest MAE (MAE <6 mm/month), reinforcing its effectiveness, while GSMaP MVK and ERA5-Land showed the highest errors (MAE >12 mm/month), indicating that further refinement is necessary to improve performance in complex terrains and arid climates.
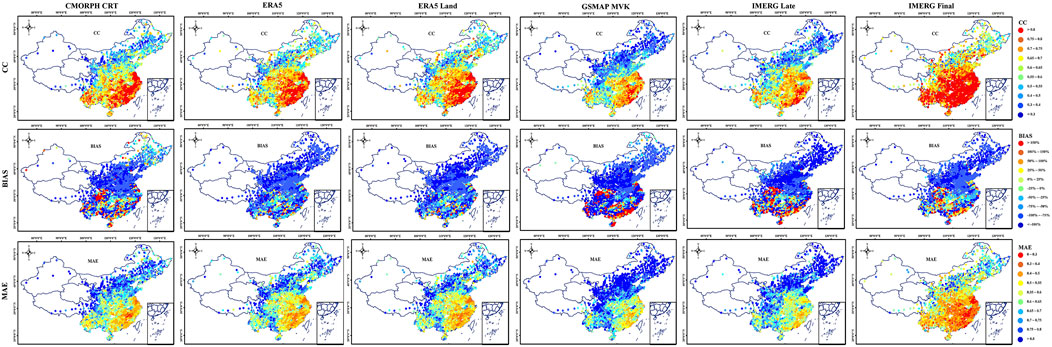
Figure 5. Performance comparison of SPI-3 index across multiple precipitation products (CMORPH CRT, ERA5, ERA5-Land, GSMaP MVK, IMERG Late, and IMERG Final) against ground station data using CC, bias, and MAE metrics.
Figure 6 presents a long-term monthly comparison from 2010 to 2019, with SPI indices on the left (Figure 6A) (SPI-1, SPI-3, SPI-6, SPI-12) and SPEI on the right (Figure 6B) (SPEI-1, SPEI-3, SPEI-6, and SPEI-12). Yellow-shaded areas mark extended periods where drought indices remain below 0.5, indicating persistent dry conditions. In the short term (SPI-1 and SPEI-1), IMERG Final closely aligns with gauge data, accurately capturing rapid fluctuations, while GSMaP MVK overestimates drought severity, particularly in arid regions. ERA5 underestimates drought in southern regions by overestimating precipitation. Medium-term indices (SPI-3, SPI-6, SPEI-3, and SPEI-6) reflect seasonal drought patterns, with SPEI showing greater variability due to sensitivity to temperature and evapotranspiration, notably over the Qinghai-Tibet Plateau and southwestern mountains. IMERG Final remains the most accurate, while ERA5 and GSMaP MVK overestimate drought in northern regions. Long-term indices (SPI-12 and SPEI-12) reveal cumulative drought, with SPEI-12 diverging significantly from SPI-12 in heat-affected areas, emphasizing evapotranspiration’s role. IMERG Final consistently mirrors observed data, but GSMaP MVK and ERA5 overestimate long-term drought, particularly in southern China. Regional discrepancies show SPEI indicating more severe drought than SPI over complex terrains, underscoring the need for temperature data in long-term monitoring. ERA5 and GSMaP MVK require calibration. Future research should integrate multiple datasets to reduce inaccuracies, with ensemble approaches combining IMERG Final, ERA5, and GSMaP MVK. Expanding ground station networks and applying machine learning for bias correction are recommended to improve drought assessments.
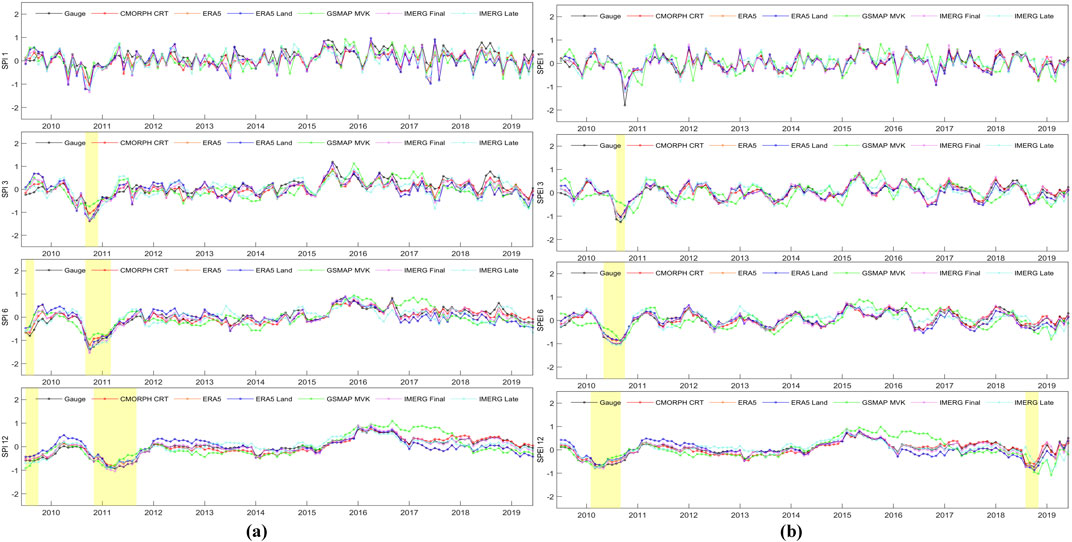
Figure 6. Long-term monthly comparison (2010–2019) of (A) SPI (1, 3, 6, and 12) and (B) SPEI (1, 3, 6, and 12) indices with extended drought periods (index <0.5) highlighted in yellow, showing the temporal dynamics of drought across varying timescales.
Figure 7 presents a cold and hot spot analysis of the CDD, PRCPTOT, and R95p indices across multiple precipitation products (CMORPH CRT, ERA5, ERA5-Land, GSMaP MVK, IMERG Late, and IMERG Final) compared to ground station data. The analysis reveals that IMERG Final and IMERG Late show the highest consistency with ground station data, effectively capturing hot spots in arid northern and northwestern regions where dry spells are most frequent. In contrast, CMORPH CRT and GSMaP MVK tend to overestimate dry conditions, extending hot spots into central China, which may lead to misinterpretations of drought severity. Similarly, IMERG Final accurately reflects areas of high total precipitation (PRCPTOT) in southern China, particularly along the Yangtze River Basin, while ERA5 and GSMaP MVK display overestimations in complex terrains like the Yunnan-Guizhou Plateau. The R95p analysis indicates that IMERG Final successfully identifies regions of frequent heavy rainfall, aligning closely with observed data. Conversely, ERA5-Land and GSMaP MVK tend to underestimate extreme precipitation events, potentially leading to underpreparedness for flood risks in vulnerable monsoon-affected areas.
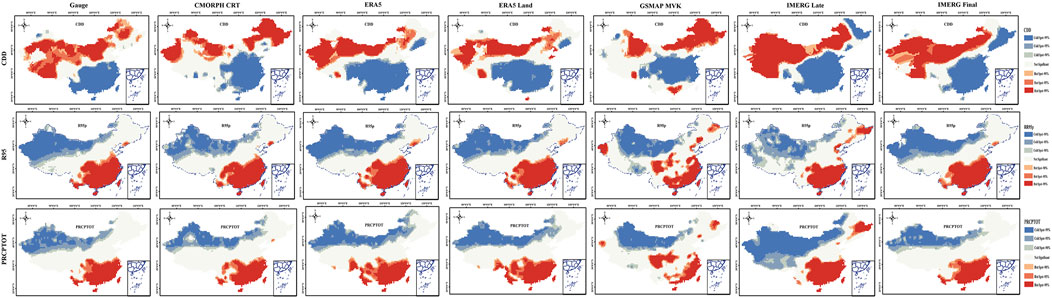
Figure 7. Spatial comparison of CDD, PRCPTOT, R95P hot spots across multiple precipitation products and gauge observations in China.
Figure 8 compares Drought Frequency (SPEI_1) at Light, Moderate, and Severe levels for different precipitation products (CMORPH CRT, ERA5, ERA5-Land, GSMaP MVK, IMERG Late, and IMERG Final) against ground station data. Light droughts are predominantly observed in northern and northwestern China, with IMERG Final and IMERG Late accurately capturing these patterns. However, CMORPH CRT and GSMaP MVK significantly overestimate light drought occurrences in central and northeastern regions, suggesting inflated risk assessments that could misguide resource allocation. For moderate droughts, IMERG Final continues to demonstrate superior performance, particularly in capturing drought patterns in the Loess Plateau and Hebei regions. Overestimations by ERA5 and GSMaP MVK in the Qinghai-Tibet Plateau highlight challenges in representing drought in remote areas with sparse observational data. Severe droughts, concentrated in southwestern China, are best reflected by IMERG Final, while ERA5 and GSMaP MVK overestimate drought intensity, particularly in complex terrains such as the Sichuan Basin. These inaccuracies underscore the need for enhanced calibration of precipitation products to improve drought detection in diverse climatic regions.
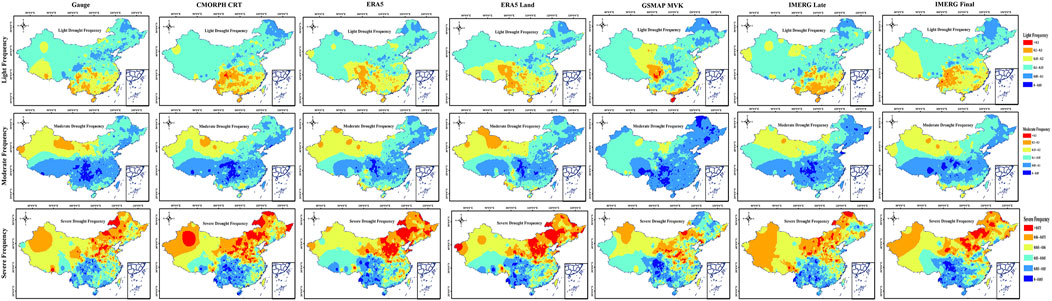
Figure 8. Drought frequency comparison across light, moderate, and severe levels using SPEI-1 for multiple precipitation products relative to ground station data.
Significant discrepancies in the performance of precipitation products across China reflect the interplay of topography, climate systems, and observation network density. IMERG Final consistently demonstrated the highest accuracy, particularly in the humid regions of southern China, while products like GSMaP MVK and ERA5 overestimated precipitation in arid and semi-arid areas, such as the Qinghai-Tibet Plateau and northwestern China. These differences arise from terrain complexity, convective rainfall, and observational gaps that affect satellite retrieval algorithms. In high-altitude and mountainous regions, sparse ground stations and challenging topography hinder accurate precipitation retrieval, leading to underestimations or overestimations depending on the algorithm. Microwave-based products often misclassify precipitation over snow or rocky surfaces, contributing to errors. By contrast, southeastern China, with its dense station network and simpler terrain, experiences fewer discrepancies, with IMERG Final excelling in these areas. Convective rainfall during summer monsoons further drives overestimations by GSMaP MVK and ERA5, which rely heavily on infrared data prone to convective biases, while CMORPH CRT underestimates precipitation in northern arid regions due to its limited detection of light rainfall. Sparse observational coverage in remote regions exacerbates these challenges, reducing the accuracy of gauge-corrected products like IMERG Final, which otherwise performs well in densely monitored areas.
Although ground station data serve as the primary reference for validating precipitation products, they are not without limitations. In complex terrains and remote areas, precipitation gauges often under-capture snowfall or fail during extreme weather events, introducing biases into the validation process. This underestimation can lead to inflated satellite performance metrics, masking underlying discrepancies. To mitigate this, future validation efforts should integrate diverse data sources, including radar, high-resolution reanalysis datasets, and hydrological observations, to create a more holistic validation framework. Cross-validation between ground station data and independent datasets can provide additional robustness, reducing the influence of station biases. In regions with sparse observational networks, data assimilation techniques that merge ERA5 or GSMaP outputs with local station data can enhance accuracy.
IMERG Final consistently outperforms other precipitation products, closely aligning with ground station data across various drought indices and frequency levels, particularly in regions with high precipitation variability like the Yangtze River Basin and southeastern China. Its accuracy in capturing extreme rainfall and dry spells highlights its strength in tracking seasonal and inter-annual precipitation patterns, reinforcing its value for hydrological modeling and early warning systems. By integrating drought indices, the study improves understanding of drought distribution, especially in complex terrains like the Qinghai-Tibet Plateau. While uncertainties persist in arid regions due to biases in detecting light rainfall, IMERG Final’s enhanced performance reflects advances in gauge-corrected algorithms that reduce errors in monsoon-prone zones.
ERA5, ERA5-Land, and GSMaP MVK show reasonable performance in general precipitation monitoring but reveal significant limitations in complex topographies and arid regions, where sparse observational networks exacerbate biases. ERA5 and ERA5-Land consistently overestimate precipitation in southern monsoon regions during summer, while GSMaP MVK significantly overestimates rainfall in northern arid and semi-arid areas, driven by convective biases and algorithmic limitations. These discrepancies distort drought risk assessments, potentially leading to misallocated resources, inflated crop yield projections, or unnecessary emergency responses. GSMaP MVK’s sensitivity to convective precipitation amplifies rainfall estimates, misrepresenting drought severity, while ERA5’s positive bias in high-moisture environments underestimates drought intensity in southern China, reflecting the challenges reanalysis models face in capturing localized rainfall over complex terrain. Addressing these issues requires product-specific calibration, tailored correction algorithms, and ensemble approaches to mitigate biases and improve accuracy. Expanding ground observation networks, particularly in remote and mountainous areas like the Qinghai-Tibet Plateau and southwestern China, and incorporating commercial microwave links and crowd-sourced weather data can enhance calibration and product reliability.
The comparison between SPI and SPEI indices underscores SPEI’s heightened sensitivity to evapotranspiration, making it particularly effective in capturing the cumulative effects of temperature on water deficits in long-term drought assessments (e.g., SPEI-12). This sensitivity is crucial for identifying prolonged droughts in heat-affected regions, offering valuable insights for guiding policy and resource allocation in areas vulnerable to heat-induced drought impacts. However, discrepancies in precipitation products, such as the overestimation of drought events by GSMaP MVK and ERA5, pose significant risks for drought management and policy development. Overestimations may lead to misallocated resources and unnecessary interventions, while underestimations by CMORPH CRT in arid regions risk delaying critical responses, intensifying agricultural losses and water shortages. To mitigate such risks, We need precipitation products with higher spatiotemporal resolution and accuracy, more adaptive and reliable drought forecasts can be achieved, enhancing decision-making in drought-prone areas.
Despite its strong performance, IMERG Final exhibits seasonal and regional discrepancies that warrant further investigation. The results show that precipitation products often diverge during summer, when convective rainfall is most intense, and in regions with complex terrain. GSMaP MVK’s tendency to overestimate summer precipitation reflects the influence of convective biases, while ERA5’s positive bias in southern China highlights the limitations of reanalysis models in capturing local rainfall variability. These seasonal discrepancies underscore the importance of developing calibration strategies that address region-specific biases. Tailoring correction algorithms for complex regions, such as the southwestern mountains and the Tibetan Plateau, can significantly improve precipitation estimates, enhancing the accuracy of drought assessments.
Hotspot and cold spot analysis using indices such as CDD and R95p unveils critical spatial patterns that enhance drought monitoring and mitigation strategies. IMERG Final consistently demonstrates superior performance in capturing high-frequency events, effectively identifying areas prone to both persistent droughts and extreme precipitation. In contrast, products like CMORPH CRT and GSMaP MVK often overestimate dry conditions in northern regions and underestimate wet extremes in the south, reflecting the limitations of generalized models in diverse climatic zones. By integrating region-specific datasets into drought frameworks, this analysis reduces uncertainties, enabling more accurate and targeted policy responses for resource management and disaster preparedness, particularly in regions vulnerable to extreme weather events.
As precipitation products continue to evolve, regular updates and recalibration are essential to maintain accuracy. This study reflects the performance of IMERG Final as of 2019, but subsequent improvements in retrieval algorithms and data assimilation techniques may further enhance its capabilities. Future research should focus on developing hybrid datasets that fuse multiple sources, leveraging the strengths of reanalysis, satellite, and ground observations to produce comprehensive precipitation records. Machine learning holds significant potential in this domain, offering new pathways to reduce biases and improve spatial resolution. By integrating advanced techniques into precipitation monitoring systems, researchers can enhance the reliability of drought assessments.
This study conducted a comprehensive evaluation of multi-source precipitation products (ERA5, ERA5-Land, CMORPH CRT, GSMaP MVK, IMERG Late, and IMERG Final) for monitoring extreme precipitation and drought events across China from 2009 to 2019. Utilizing ground meteorological observations, various extreme precipitation and drought indices, and advanced statistical methods, we analyzed the accuracy and applicability of different precipitation products. Among multi-source precipitation products, IMERG Final is a relatively reliable product for monitoring extreme precipitation and drought conditions in China. The key conclusions are as follows:
1) This study consistently demonstrates IMERG Final’s high accuracy and correlation in capturing precipitation and drought patterns across China, aligning closely with ground observations, especially in high-precipitation southern regions such as the Yangtze River Basin (Xu et al., 2014; Li et al., 2013). IMERG Final consistently outperforms other products like CMORPH CRT and GSMaP MVK, which often underestimate in arid northern regions and overestimate in complex terrains. Its low MAE and minimal deviations make it highly reliable for both extreme precipitation and drought monitoring. IMERG Final also excels in capturing drought onset and intensity, particularly in challenging topographies. This can be attributed to IMERG Final’s integration of gauge data for bias correction, which enhances accuracy in monsoon-affected areas and regions prone to extreme rainfall. Long-term assessments using SPI and SPEI indices confirm its suitability for comprehensive drought monitoring. Hotspot and drought frequency analyses further validate its alignment with ground data, contrasting with CMORPH CRT and GSMaP MVK, which tend to overestimate dry areas. IMERG Final’s robust performance across indices highlights its value for water resource management, climate monitoring, and drought assessment.
2) Significant discrepancies were observed in the performance of ERA5, ERA5-Land, and GSMaP MVK, particularly over complex terrains such as the Qinghai-Tibet Plateau and northwestern China. GSMaP MVK exhibited notable overestimation of precipitation, inflating drought frequency estimates, while ERA5 and ERA5-Land overestimated precipitation in southern regions during the summer monsoon, masking drought severity. These biases reflect the challenges associated with applying global reanalysis and satellite precipitation datasets to regions with sparse ground observations and heterogeneous precipitation patterns. The analysis reveals that terrain complexity, sparse observational networks, and algorithmic limitations contribute to product inaccuracies. For example, in high-altitude areas with snow cover and steep slopes, microwave and infrared retrievals often misclassify precipitation, resulting in substantial deviations from ground station data. This study highlights the need for tailored calibration approaches and the fusion of multiple datasets to address these regional discrepancies and enhance drought detection capabilities.
3) The evaluation of SPEI and SPI indices shows that SPEI’s inclusion of evapotranspiration adds valuable sensitivity to temperature-driven water deficits, crucial for drought and heat-affected areas. This sensitivity is especially clear in long-term assessments (e.g., SPEI-12), capturing cumulative evapotranspiration impacts on drought intensity. IMERG Final performed best for both SPEI and SPI, achieving the highest CC and lowest MAE compared to ground station data, particularly in high-precipitation regions. In contrast, GSMaP MVK and CMORPH CRT showed limitations, with GSMaP MVK having lower correlation in arid zones and CMORPH CRT underestimating in northern areas. ERA5 and ERA5-Land displayed moderate performance with some overestimation in high-rainfall areas. This study demonstrates that while SPI effectively tracks short-term droughts, SPEI’s sensitivity to evapotranspiration enhances its ability to capture cumulative drought impacts, reflecting the growing influence of temperature extremes in drought development. This is particularly relevant for southern and southwestern China, where rising temperatures and changing precipitation patterns exacerbate water deficits
4) The performance of precipitation products varies across different regions of China due to distinct climatic and topographical characteristics, with significant discrepancies observed in complex terrain areas like the Qinghai-Tibet Plateau and southwestern mountainous regions. Products such as GSMaP MVK and ERA5 often display biases—underestimating in arid regions and overestimating in high-rainfall areas—highlighting the limitations of relying on single-source datasets for accurate drought assessment. These inconsistencies underscore the need for fusion and targeted correction of precipitation products to enhance accuracy and reliability. The combination of radar data, high-resolution reanalysis outputs, and machine learning algorithms could enhance bias correction and improve real-time monitoring accuracy.
5) This study assesses multiple precipitation products for drought monitoring across China, examining spatial and temporal precipitation patterns, drought index performance, hotspot analyses, and drought frequency across various severity levels. IMERG Final demonstrates high accuracy; however, products like ERA5 and GSMaP MVK tend to overestimate precipitation and drought frequency, particularly in areas with complex terrain. This highlights the need for improved calibration, especially in arid regions, to enhance data reliability. Observed variations in drought frequency across datasets underscore the importance of selecting regionally appropriate data, and suggest potential benefits of multi-model fusion to develop a more robust, adaptable drought monitoring tool. Additionally, incorporating machine learning or adaptive algorithms could further improve real-time accuracy and adaptability, supporting effective drought assessment and resource management in China’s diverse climate regions. Additionally, expanding ground observation networks in under-monitored areas, such as the Qinghai-Tibet Plateau and western China, is critical for refining precipitation retrievals and improving drought risk assessments. The integration of citizen science data, commercial microwave link measurements, and remote sensing technologies could further strengthen observational capacity in data-scarce regions.
Publicly available datasets were analyzed in this study. This data can be found here: The contribution of the data providers is also greatly appreciated, including the CMPA provider (http://data.cma.cn). The IMERG Final and IMERG Late products for this study can be found in the GES DISC (https://disc.gsfc.nasa.gov/), accessed on 5 January 2024. The ERA5-Land and ERA5 reanalysis datasets for this study can be found in the Copernicus Climate Change Service (C3S) Climate Data Store (CDS) (https://cds.climate.copernicus.eu/), accessed on 5 January 2024. CMORPH CRT datasets for this study can be found in the NOAA (National Oceanic and Atmospheric Administration) (https://www.ncei.noaa.gov/data/cmorph-high-resolution-global-precipitation-estimates/). GSMaP MVK products for this study can be found in the JAXA Global Rainfall Watch (GSMaP) (http://sharaku.eorc.jaxa.jp/GSMaP/index.htm). The PET datasets are provided by the National Tibetan Plateau/Third Pole Environment Data Center (http://data.tpdc.ac.cn).
YY: Conceptualization, Data curation, Formal Analysis, Methodology, Resources, Visualization, Writing–original draft. BL: Conceptualization, Formal Analysis, Funding acquisition, Methodology, Resources, Software, Validation, Visualization, Writing–review and editing.
The author(s) declare that financial support was received for the research, authorship, and/or publication of this article. This research was funded by the National Natural Science Foundation of China (42361074), Provincial Golden Course Funding Project of Guizhou Provincial Department of Education (No. (2023)78), Bijie City Joint Fund Support Project (No. (2023)25), Bijie City Artificial Intelligence Application Innovation Talent Team Funding Project (No. (2023)9).
We are grateful to the providers of operational precipitation products and rain gauge measurements for making data available to us.
The authors declare that the research was conducted in the absence of any commercial or financial relationships that could be construed as a potential conflict of interest.
The author(s) declare that no Generative AI was used in the creation of this manuscript.
All claims expressed in this article are solely those of the authors and do not necessarily represent those of their affiliated organizations, or those of the publisher, the editors and the reviewers. Any product that may be evaluated in this article, or claim that may be made by its manufacturer, is not guaranteed or endorsed by the publisher.
Abbas, A., Bhatti, A. S., Ullah, S., Ullah, W., Waseem, M., Zhao, C., et al. (2023). Projection of precipitation extremes over south Asia from CMIP6 GCMs. J. Arid Land 15 (3), 274–296. doi:10.1007/s40333-023-0050-3
Abbas, A., Zhao, C., Waseem, M., Khan, K. A., and Ahmad, R. (2022). Analysis of energy input–output of farms and assessment of greenhouse gas emissions: a case study of cotton growers. Front. Environ. Sci. 9, 826838. doi:10.3389/fenvs.2021.826838
Battaglia, A., Kollias, P., Dhillon, R., Roy, R., Tanelli, S., Lamer, K., et al. (2020). Spaceborne cloud and precipitation radars: status, challenges, and ways forward. Rev. Geophys. 58 (3), e2019RG000686. doi:10.1029/2019rg000686
Chen, L., Li, K., Chen, S., Wang, X., and Tang, L. (2021). Industrial activity, energy structure, and environmental pollution in China. Energy Econ. 104, 105633. doi:10.1016/j.eneco.2021.105633
Ding, Y., Liang, P., Liu, Y., and Zhang, Y. (2020). Multiscale variability of Meiyu and its prediction: a new review. J. Geophys. Res. Atmos. 125 (7), e2019JD031496. doi:10.1029/2019jd031496
Elahi, E., Abro, M. I., Ali Khaskheli, M., Abbas Kandhro, G., Zehra, T., Ali, S., et al. (2024). Long-term evaluation of rainfall in the arid region of Pakistan using multi-source data. Theor. Appl. Climatol. 155 (4), 2819–2840. doi:10.1007/s00704-023-04797-3
Hersbach, H., Bell, B., Berrisford, P., Hirahara, S., Horányi, A., Muñoz-Sabater, J., et al. (2020). The ERA5 global reanalysis. Q. J. R. Meteorological Soc. 146 (730), 1999–2049. doi:10.1002/qj.3803
Hu, Z., Qi, H., Zhang, C., Chen, Xi, and Li, Q. (2016). Evaluation of reanalysis, spatially interpolated and satellite remotely sensed precipitation data sets in central Asia. J. Geophys. Res. Atmos. 121 (10), 5648–5663. doi:10.1002/2016jd024781
Huang, Y., Elahi, E., You, J., Sheng, Y., Li, J., and Meng, A. (2024). Land use policy implications of demographic shifts: analyzing the impact of aging rural populations on agricultural carbon emissions in China. Land Use Policy 147, 107340. doi:10.1016/j.landusepol.2024.107340
Huffman, G., Bolvin, D., Braithwaite, D., Hsu, K., Joyce, R., Kidd, C., et al. (2015). First results from the integrated multi-satellite retrievals for GPM (IMERG), 7034.
Irannezhad, M., and Liu, J. (2022). Evaluation of six gauge-based gridded climate products for analyzing long-term historical precipitation patterns across the Lancang-Mekong River Basin. Geogr. Sustain. 3 (1), 85–103. doi:10.1016/j.geosus.2022.03.002
Joyce, R. J., Janowiak, J. E., Arkin, P. A., and Xie, P. (2004). CMORPH: a method that produces global precipitation estimates from passive microwave and infrared data at high spatial and temporal resolution. J. Hydrometeorol. 5 (3), 487–503. doi:10.1175/1525-7541(2004)005<0487:camtpg>2.0.co;2
Levizzani, V., and Cattani, E. (2019). Satellite remote sensing of precipitation and the terrestrial water cycle in a changing climate. Remote Sens. 11 (19), 2301. doi:10.3390/rs11192301
Li, L., Chen, X., Ma, Y., Zhao, W., Zuo, H., Liu, Y., et al. (2023). Implications for validation of IMERG satellite precipitation in a complex mountainous region. Remote Sens. 15 (18), 4380. doi:10.3390/rs15184380
Li, Z., Yang, D., and Yang, H. (2013). Multi-scale evaluation of high-resolution multi-sensor blended global precipitation products over the Yangtze River. J. Hydrology 500, 157–169. doi:10.1016/j.jhydrol.2013.07.023
Morrison, H., Lier-Walqui, M., Fridlind, A. M., Grabowski, W. W., Harrington, J. Y., Hoose, C., et al. (2020). Confronting the challenge of modeling cloud and precipitation microphysics. J. Adv. Model. Earth Syst. 12 (8), e2019MS001689. doi:10.1029/2019ms001689
Muñoz-Sabater, J., Dutra, E., Agustí-Panareda, A., Albergel, C., Arduini, G., Balsamo, G., et al. (2021). ERA5-Land: a state-of-the-art global reanalysis dataset for land applications. Earth Syst. Sci. Data 13 (9), 4349–4383. doi:10.5194/essd-13-4349-2021
Nguyen, G. V., Xuan-Hien, L., Nguyen Van, L., Jung, S., Lee, G., and Lee, G. (2023). Machine learning approaches for reconstructing gridded precipitation based on multiple source products. J. Hydrology Regional Stud. 48, 101475. doi:10.1016/j.ejrh.2023.101475
Pandžić, K., Likso, T., Pejić, I., Šarčević, H., Pecina, M., Šestak, I., et al. (2022). Application of the self-calibrated palmer drought severity index and standardized precipitation index for estimation of drought impact on maize grain yield in Pannonian part of Croatia. Nat. Hazards 113 (2), 1237–1262. doi:10.1007/s11069-022-05345-4
Peng, S., Ding, Y., Liu, W., and Li, Z. (2019). 1 km monthly temperature and precipitation dataset for China from 1901 to 2017. Earth Syst. Sci. Data 11, 1931–1946. doi:10.5194/essd-11-1931-2019
Prieler, S. (2005). The impact of temperature and precipitation variability on potential agricultural production in China. na.
Sarwar, A. N., Waseem, M., Azam, M., Abbas, A., Ahmad, I., Lee, J. E., et al. (2022). Shifting of meteorological to hydrological drought risk at regional scale. Appl. Sci. 12 (11), 5560. doi:10.3390/app12115560
Sheffield, J., Wood, E. F., Pan, M., Beck, H., Coccia, G., Serrat-Capdevila, A., et al. (2018). Satellite remote sensing for water resources management: potential for supporting sustainable development in data-poor regions. Water Resour. Res. 54 (12), 9724–9758. doi:10.1029/2017wr022437
Sokol, Z., Szturc, J., Orellana-Alvear, J., Popova, J., Jurczyk, A., and Célleri, R. (2021). The role of weather radar in rainfall estimation and its application in meteorological and hydrological modelling—a review. Remote Sens. 13 (3), 351. doi:10.3390/rs13030351
Stewart, M., Carleton, W. C., and Groucutt, H. S. (2022). Extreme events in biological, societal, and earth sciences: a systematic review of the literature. Front. Earth Sci. 10, 786829. doi:10.3389/feart.2022.786829
Tang, X., Li, H., Qin, G., Huang, Y., and Qi, Y. (2023). Evaluation of satellite-based precipitation products over complex topography in mountainous southwestern China. Remote Sens. 15 (2), 473. doi:10.3390/rs15020473
Thornton, J. M., Pepin, N., Shahgedanova, M., and Adler, C. (2022). Coverage of in situ climatological observations in the world's mountains. Front. Clim. 4, 814181. doi:10.3389/fclim.2022.814181
Ullah, W., Karim, A., Ullah, S., Rehman, A.-U., Bibi, T., Wang, G., et al. (2023). An increasing trend in daily monsoon precipitation extreme indices over Pakistan and its relationship with atmospheric circulations. Front. Environ. Sci. 11, 1228817. doi:10.3389/fenvs.2023.1228817
Ushio, T., Sasashige, K., Kubota, T., Shige, S., Okamoto, K., Aonashi, K., et al. (2009). A kalman filter approach to the global satellite mapping of precipitation (GSMaP) from combined passive microwave and infrared radiometric data. J. Meteorological Soc. Jpn. Ser. II 87A, 137–151. doi:10.2151/jmsj.87A.137
Wijeratne, V. P. I. S., Li, G., Mehmood, M. S., and Abbas, A. (2023). Assessing the impact of long-term ENSO, SST, and IOD dynamics on extreme hydrological events (EHEs) in the kelani River Basin (KRB), Sri Lanka. Atmosphere 14 (1), 79. doi:10.3390/atmos14010079
Wu, Y., Wu, S.-Y., Wen, J., Xu, M., and Tan, J. (2016). Changing characteristics of precipitation in China during 1960-2012. Int. J. Climatol. 36 (3), 1387–1402. doi:10.1002/joc.4432
Xia, W., Apergis, N., Bashir, M. F., Ghosh, S., Doğan, B., and Shahzad, U. (2022). Investigating the role of globalization, and energy consumption for environmental externalities: empirical evidence from developed and developing economies. Renew. Energy 183, 219–228. doi:10.1016/j.renene.2021.10.084
Xu, X., Li, J., and Tolson, B. A. (2014). Progress in integrating remote sensing data and hydrologic modeling. Prog. Phys. Geogr. 38 (4), 464–498. doi:10.1177/0309133314536583
Xu, Y., Jiang, Z., Dai, Y., Li, Z., Liu, Y., and Gu, L. (2024). Ancient wisdom: a new perspective on the past and future Chinese precipitation patterns based on the twenty-four solar terms. J. Hydrology 641, 131873. doi:10.1016/j.jhydrol.2024.131873
Yang, B., Cui, Q., Meng, Y., Zhang, Z., Hong, Z., Hu, F., et al. (2023). Combined multivariate drought index for drought assessment in China from 2003 to 2020. Agric. Water Manag. 281, 108241. doi:10.1016/j.agwat.2023.108241
Ye, Q., Wang, Y., Liu, L., Guo, L., Zhang, X., Dai, L., et al. (2024). Remote sensing and modeling of the cryosphere in high mountain Asia: a multidisciplinary review. Remote Sens. 16 (10), 1709. doi:10.3390/rs16101709
Yu, C., Huang, X., Chen, H., Huang, G., Ni, S., Wright, J. S., et al. (2018). Assessing the impacts of extreme agricultural droughts in China under climate and socioeconomic changes. Earth's Future 6 (5), 689–703. doi:10.1002/2017ef000768
Yu, M., Li, Q., Hayes, M. J., Svoboda, M. D., and Heim, R. R. (2014). Are droughts becoming more frequent or severe in China based on the standardized precipitation evapotranspiration index: 1951–2010? Int. J. Climatol. 34 (3), 545–558. doi:10.1002/joc.3701
Keywords: multi-source precipitation, ground stations, indicators, drought, China, validation capture precipitation’s
Citation: Yuan Y and Liao B (2025) Evaluation of multi-source precipitation products for monitoring drought across China. Front. Environ. Sci. 13:1524937. doi: 10.3389/fenvs.2025.1524937
Received: 11 November 2024; Accepted: 08 January 2025;
Published: 24 January 2025.
Edited by:
Safi Ullah, King Abdullah University of Science and Technology, Saudi ArabiaReviewed by:
Muhammad Shahid, Brunel University London, United KingdomCopyright © 2025 Yuan and Liao. This is an open-access article distributed under the terms of the Creative Commons Attribution License (CC BY). The use, distribution or reproduction in other forums is permitted, provided the original author(s) and the copyright owner(s) are credited and that the original publication in this journal is cited, in accordance with accepted academic practice. No use, distribution or reproduction is permitted which does not comply with these terms.
*Correspondence: Boyi Liao, MjA3NTAzNkBxcS5jb20=
Disclaimer: All claims expressed in this article are solely those of the authors and do not necessarily represent those of their affiliated organizations, or those of the publisher, the editors and the reviewers. Any product that may be evaluated in this article or claim that may be made by its manufacturer is not guaranteed or endorsed by the publisher.
Research integrity at Frontiers
Learn more about the work of our research integrity team to safeguard the quality of each article we publish.