 Zheng Hexiang1
 Han Yujing
 Bao Rongxuan
 Wang Biyu
- 1Yinshanbeilu Grassland Eco-Hydrology National Observation and Research Station, China Institute of Water Resources and Hydropower Research, Beijing, China
- 2Research Center of Fluid Machinery Engineering and Technology, Jiangsu University, Zhenjiang, China
- 3Guangdong Key Laboratory of Integrated Agro-Environmental Pollution Control and Management, National-Regional Joint Engineering Research Center for Soil Pollution Control and Remediation in South China, Institute of Eco-environmental and Soi1 Sciences, Guangdong Academy of Sciences, Guangzhou, China
- 4State Key Laboratory of Hydrology-Water Resources and Hydraulic Engineering, Nanjing Hydraulic Research Institute, Nanjing, China
The simulation of drainage sources in irrigation areas at the watershed scale is of great significance for understanding the characteristics and drainage status of irrigation districts under various water-saving irrigation and climatic conditions. In this study, our focus was on the irrigation areas located on the south bank of the Yellow River in Hangjin Banner. We aimed to analyze and simulate the flow rate and overall drainage volume in the drainage ditch by developing a soil and water assessment tool (SWAT) model. The measured drainage data were utilized to calibrate and validate the model to explore the structure and sources of drainage in the selected study area. The results indicated that the average annual drainage volume of the study area was 4355.65 × 104 m³, and the primary source of drainage was subsurface drainage, which accounted for approximately 68% of the total drainage. Subsurface flow was the second-largest source, contributing approximately 31%, while surface drainage accounted for a negligible proportion, contributing merely 1% to the drainage. Concerning the proportion of drainage relative to the total drainage in each irrigation area, the Balahey irrigation area accounted for approximately 20%, the Jianshe irrigation area for approximately 45%, and the Dugui irrigation area for approximately 35%. Moreover, the model parameters were optimized using SWAT-CUP software to obtain the R2, NSE, Re, and RMSE values of 0.65, 0.60, −8.54%, and 384.65 × 10⁴ m3, respectively, for the model calibration period, and the corresponding values were 0.63, 0.56, −7.82%, and 389.65 × 10⁴ m3, respectively, for the validation period. The traceability simulation results for irrigation drainage are of crucial importance for the efficient utilization of water resources in this study area.
1 Introduction
Drainage problems are prevalent in irrigated areas worldwide (Arslan, 2012). Land drainage is one of the key inputs for improving yields per unit area of farmland. Effective drainage management can enhance field salinity control (Ritzema et al., 2006) by removing excess water, preventing groundwater table rise, and buffering against shallower groundwater tables (Ritzema, 2016). It also contributes to the regulation of groundwater levels in the crop growth season to increase crop production (Fisher et al., 1999; Li P. et al., 2018; Li S. et al., 2018). The development of irrigated agriculture is of vital importance for sustaining the growing world population. Nevertheless, in the absence of appropriate drainage measures, this development may give rise to environmental problems like salinization and waterlogging within irrigated agro-systems. In particular, in arid regions with shallow groundwater tables, the drainage process is critical for controlling waterlogging and salinization problems in irrigation districts (Wen et al., 2022; Disasa et al., 2024). Inappropriate drainage practices typically lead to the elevation of the groundwater table, as reported by Singh (2019a) and Yan et al. (2023). Subsequently, this elevation tends to trigger problems that pose a threat to crop growth in irrigation areas, as indicated by Wichelns and Qadir (2015) and Ren et al. (2017). Therefore, clarifying the drainage structure and determining the total amount of drainage water is essential for formulating an effective drainage management strategy. This is crucial for improving agricultural water use efficiency (Schilling et al., 2012; Yan et al., 2022b) and ensuring the sustainable development of the agricultural economy. Additionally, quantifying discharge is vital for assessing flow paths (Schilling and Zhang, 2004; Zhao et al., 2023).
The drainage problems within irrigated agriculture are significantly impeded by the dearth of high-quality data, posing a particularly serious concern in arid regions (Brunner et al., 2007). Diverse irrigation scheduling results in uncertainties and complexities in the simulation of drainage water at different regional scales (Wen et al., 2020). The optimization of field drainage systems presents a formidable challenge, owing to the requisite management of dynamic groundwater levels. Such fluctuations have the potential to impact soil moisture, thereby complicating the design and operation of drainage systems. The issues faced by irrigated areas have typically been evaluated using traditional methods that require extensive data collection. However, advancements in computer technology now enable us to accurately simulate hydrologic and agricultural processes more easily than conducting costly and time-consuming field trials. Understanding the interaction between surface drainage and groundwater, along with factors like rainfall, irrigation practices, and soil types, is essential. This complexity requires data analysis and innovative strategies to ensure efficient drainage while preserving soil health and preventing waterlogging (Li et al., 2020). Some studies have focused on field and small regional drainage evaluation by performing simulation studies (Zulu et al., 1996; Samani et al., 2004; Singh, 2012). The simulation results derived from their field experiments are typically more reliable and precise compared to those of large-scale simulations. However, the methods used in these studies generally require extensive field experiment data (Jouni et al., 2018; Lakhiar et al., 2024). Complex drainage systems and varying physical conditions increase the uncertainty and complexity of regional-scale drainage estimates (Wu et al., 2019). Regional drainage studies involve the utilization of distributed data, whereas conventional hydrological measurements provide only point data, as indicated by Wondzell et al. (2009). Regional studies are unable to yield reliable outputs, on account of the deficiency in essential and widespread data, as suggested by Kasahara and Hill (2008). These practices mandate substantial amounts of data that are arduous to procure. Recently, researchers have employed numerous simulation models to address water issues globally (Maleki Tirabadi et al., 2021; Knöll et al., 2020; Mainuddin et al., 2020). Some simulation models are used to quantitatively describe drainage management in the complex agro-hydrological process (Jouni et al., 2018). Wen et al. (2020) devised a “semi-distributed model” to scrutinize drainage overflow by considering the surface and subsurface drainage in an irrigated region of China. This model has attained extensive acclaim as a valuable instrument for evaluating the salinity and water-related issues in agricultural areas.
Nevertheless, the majority of these models necessitate inputs of soil properties that pose challenges in quantification. Additionally, they employ small time intervals and demand daily datasets, at a minimum, of hydrologic phenomena. Empirical, statistical, conceptual, and physically based numerical models are available to simulate irrigation-scale drainage. However, in recent years, the most prevalently utilized drainage models encompass drainage coefficient models (Dewandel et al., 2008; Jafari et al., 2012), regression models (Lei et al., 2002), and models based on machine learning algorithms (Mohan and Vijayalakshmi, 2009). These models are commonly used due to their simplicity and applicability. However, these models are less accurate and lack a physical basis (Xing et al., 2017).
The soil and water assessment tool (SWAT) model, as proposed by Gassman et al. (2014), constitutes a potent and flexible interdisciplinary modeling tool capable of simulating a broad spectrum of watershed problems. It operates by first dividing the watershed into sub-watersheds; each subarea is further divided into hydrologic response units (HRUs). Subsequently, the simulations for each HRU in the sub-watershed are aggregated by weighted averages. Neitsch et al. (2011) furnished a detailed account of the model’s functionality. The SWAT can model surface and groundwater volumes (Aouissi et al., 2014; Nikolaidis et al., 2013; Zettam et al., 2020). Addab and Bailey (2022) used the SWAT to simulate the effects of subsurface drainage on watershed salinity and explore the effects of regional-scale implementation of subsurface drainage on salinity transport and export in irrigated semi-arid watersheds. The SWAT model was additionally utilized to mathematically represent tile-drained farmland and watersheds. The successful application of the SWAT model in these studies has furnished a novel tool for elucidating the drainage structure of the watershed and ascertaining the total amount of drainage.
In the arid zone of the Northwestern region, ineffective drainage systems have given rise to substantial land salinization issues that demand urgent attention. These salinization issues result in elevated groundwater levels in irrigation areas, and the shallow depth of the groundwater aggravates soil salinization, leading to a pronounced cycle of deterioration. Farmland situated along the Yellow River and regions with deficient drainage are afflicted by severe waterlogging conditions. It is imperative to manage groundwater levels through improved drainage practices to ensure the protection and productivity of agricultural production. The south bank irrigation area of the Yellow River, located in Hangjin Banner, constitutes a prominent large-scale irrigation system within the arid zone of Northwestern China. However, the drainage structure in this region remains inadequately defined, and the total drainage volume requires further empirical validation and assessment. The complexity of drainage dynamics is augmented by various influencing factors, including irrigation practices, precipitation patterns, evaporation rates, and interactions with groundwater recharge. This intricate interplay complicates the accurate identification of drainage sources and their composition when relying exclusively on conventional monitoring techniques. To enhance our understanding of the hydrological characteristics and drainage conditions of this irrigation area, it is essential to implement advanced simulation methods for a comprehensive analysis of drainage sources. Consequently, this study investigated the drainage traceability of the irrigation area by employing the SWAT model to ascertain the drainage structure. Additionally, it elucidated the drainage volumes from diverse water sources, including precipitation and irrigation water (Yellow River water and groundwater), with the aim of contributing to the formulation of an efficacious drainage strategy for the area.
2 Materials and methods
2.1 Study area
Hangjin Banner is located in the northwestern part of the Ordos Plateau, between 106°55′ and 109°16′ east longitude and 39°22′ and 40°52´ north latitude. The along-river irrigation area of Hangjin Banner, located in the northern part of the banner, is separated from Bayannur City within the Inner Mongolia Autonomous Region. This area administers four towns, namely, Balagong Town, Jirigalangtu Town, Hohhmudu Town, and Dugui Tara Town, arranged in sequence from east to west along the river. The geographical location of the along-river irrigation area of Hangjin Banner is illustrated in Figure 1.
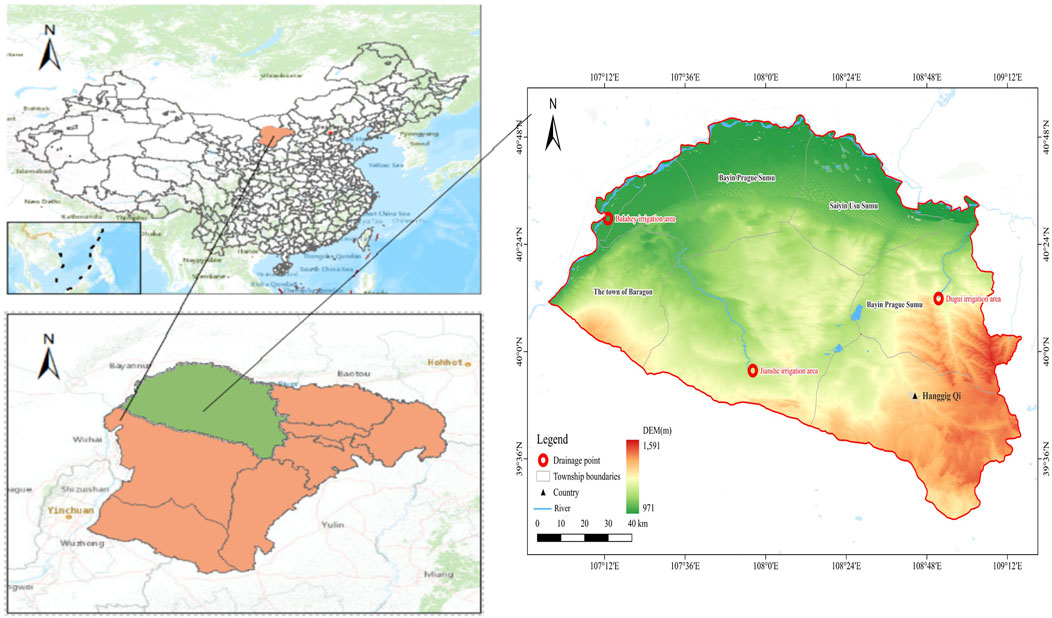
Figure 1. Map of the Hangjin Banner river irrigation district.
Hangjin Banner is characterized by a mesothermal continental climate, and the rainfall is relatively small compared to other regions. The temperature fluctuations during spring and autumn are more pronounced, with a multi-year average air temperature of 7.4°C–7.5°C, a maximum air temperature of 38.3°C to 37.9°C, a minimum air temperature of −5.3 to −30.8°C, and a multi-year average frost-free period of 158 days. Both annual and daily air temperature differences are relatively significant. The average annual rainfall is 145.1–214.9 mm, showing a decreasing trend from east to west. Precipitation is mainly concentrated in July, August, and September. Evapotranspiration (ET) is very strong, with a multi-year average value of 2273.7–2381.4 mm, which is the leading cause of drought and low rainfall in the study area. In the regional distribution, ET is greater in the west than in the east, and the maximum ET occurs in the period from May to June.
Furthermore, the along-river irrigation area of Hangjin Banner is part of the Yellow River alluvial plain, characterized by a relatively flat terrain with elevations ranging from 1,012 to 1,080 m. The landform is dominated by the Yellow River alluvial plain and the accumulation of wind-accumulated sand dunes, and the irrigation plain is a long and narrow strip of land with a width of less than 10 km. Three main soil types are dominant in the area along the river in Hangjin Banner, namely, tidal soil, salt soil, and wind-sand soil. The Yellow River is a transit river along the south bank of Hangjin Banner. However, the mainstream section of the Yellow River in Hangjin Banner starts from Sanshenggong Junction in the west and ends at Maobulakongtui in the east, with a length of approximately 214 km. The Yellow River enters the region from Shizuishan in Ningxia, and its water mainly comes from the mainstream of the Yellow River above Lanzhou. The sand mainly comes from the tributary streams between the Shangxiao and Anning areas. The Shizuishan station is the entry station of Inner Mongolia, with a multi-year average runoff of 260.7 × 10⁸ m3 and a multi-year average sand content of 3.01 kg/m3.
2.2 Construction of the SWAT model
2.2.1 Description of the SWAT model
The SWAT model was selected for its robust ability to simulate land use, hydrology, and water quality processes, making it particularly well-suited for large-scale agricultural systems such as the south bank irrigation area. As a distributed hydrological model operating at the watershed scale, the SWAT primarily focuses on simulating the quality and quantity of both surface water and groundwater. One of its prominent advantages compared to other distributed models, such as the variable infiltration capacity (VIC) model, resides in its efficacy for tracing drainage sources. The SWAT adeptly accounts for the influences of topography, climate, soil, and land use on hydrological processes, enabling detailed simulations of water flow within the basin. Additionally, it can differentiate among various hydrological processes, including surface drainage, subsurface flow, and subsurface drainage, which significantly enhances its capabilities for drainage source tracing. The SWAT is a distributed hydrological model belonging to the watershed scale, which is mostly used to simulate the water quality and quantity of surface water and groundwater. The SWAT model is a distributed physical hydrological model of a long-term watershed simulation, developed based on the Simulator for Water Resources in Rural Basins (SWRRB). The SWRRB conducts simulations predicated on the division of the watershed into several sub-watersheds. Then, each sub-watershed is further divided into several hydrological response units (hydrological response units) according to the watershed’s land use, soil, and slope distribution of the watershed. The hydrologic response unit is the most basic calculation unit of the SWAT model, which represents the subsurface of the watershed and is the aggregate of land use, soil type, and slope. Individual hydrologic response units are modeled using a one-dimensional soil column to simulate soil water and crop processes, and each hydrologic response unit is modeled without spatial information, i.e., the hydrologic response units are independent of each other and no water exchange occurs. After the terrestrial portion of the hydrologic cycle is completed for each hydrologic response unit, the loads from all hydrologic response units in the sub-basin are summed with the lakes, wetlands, and groundwater in the sub-basin to complete the sub-basin loads. The net loads of the sub-region are calculated across the entire basin stream network.
The SWAT model mainly contains the hydrological process sub-model, soil erosion sub-model, and pollution load sub-model. However, this study did not involve the calculation of soil erosion and pollution. This study mainly focuses on the hydrological process model. The hydrological process model is also known as the production and sink flow model, and its simulation process is primarily divided into five parts, namely, hydrological land cycle stage, surface drainage calculation, ET calculation, soil water calculation, and groundwater calculation. Neitsch et al. (2011) provided a detailed model functioning in the extant literature. Figure 2 shows the SWAT model simulation flow chart.
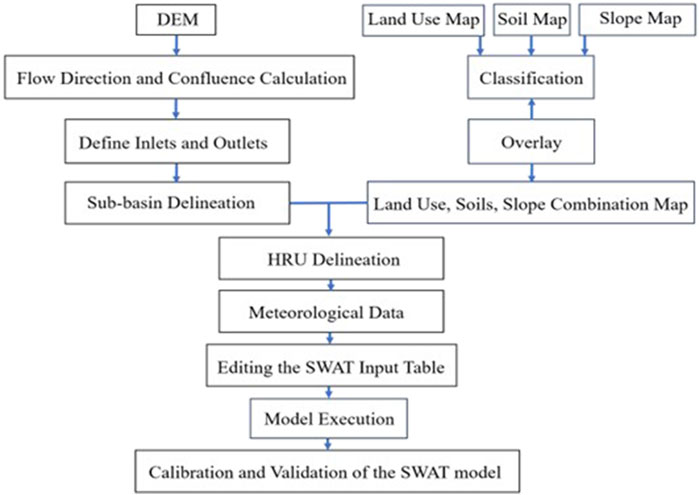
Figure 2. SWAT model simulation flowchart.
2.2.2 Sub-area division
Distributed modeling approaches to watersheds typically divide them into spatially discrete cells and then solve the model equations in the divided cells. Nevertheless, the resolution of the computational cells is typically somewhat superior to the initial spatial resolution of the input data. Therefore, it is necessary to have some aggregation of parameter values in each computational cell. Taking the average or using an overall representative value is the simplest way to obtain the input parameter values in any of the computational units. However, the characteristic relationship between watershed response and watershed characteristics is not linear, and the average value does not truly reflect the impact of the input variables. Utilizing a larger proportion of the overall category as a representative value might overlook a smaller but significant proportion of the category, thus constituting a potential source of uncertainty.
2.2.2.1 Calculation of hydrological parameters based on DEM
The digital elevation model (DEM) includes two information types, namely, ground plane coordinates and elevation data. Automatic extraction of the water system or sub-area from DEM encounters two problems, i.e., the determination of the direction of the water flow in depressions and flats and the determination of the location of the beginning of the river channel. Generally, based on the DEM, the minimum river catchment area threshold method is used to form the basic network structure of the river water system.
During the computation of the grid flow direction, the ARCSWAT is capable of calculating the threshold area range of the cell catchment area. Users can adjust the threshold magnitude, thereby modifying the fineness of the river and the number of sub-areas. Notably, a larger catchment area correlates with a reduced number of sub-areas to be partitioned. According to the results of DEM processing of Hangjin Banner by ArcGIS, the threshold value of Hangjin Banner irrigation district’s catchment area ranges from 0.76 × 10⁴ to 151.01 × 10⁴ acres, and the number of sub-areas divided ranges between 1 and 128.
2.2.2.2 Division of the sub-area
The SWAT model automatically divides rivers and sub-areas by reading the DEM of the watershed from the high terrain as the watershed boundary. It calculates each grid cell’s flow direction and catchment area from the elevation data. It divides the river network of the watershed based on the computed flow direction and catchment area. This method is highly applicable for delineation in natural watersheds.
Due to the limitation of DEM resolution, there is a deviation from the actual situation when calculating the grid cells’ flow direction and catchment area based on DEM alone in plain irrigation areas. In this paper, the burn-in approach was used to import the drainage ditch of the study area as a river into the model, which was used as the basis for the model to divide the river channel. After importing, the catchment area threshold was set to 1,500 ha (according to the local conditions), and after selecting the watershed outlets, the study area was finally delineated into 35 sub-watersheds.
Figure 3 shows the sub-watershed delineation and the correspondence between the sub-watershed delineation results and each irrigation area.
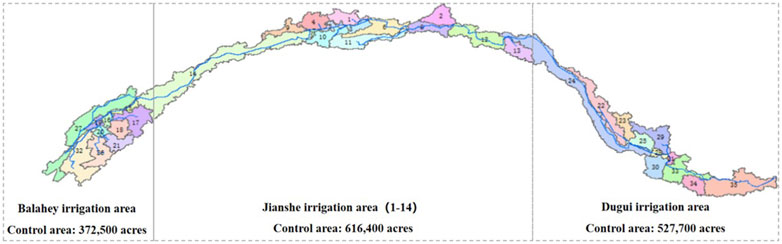
Figure 3. Division map of the Hangjin Banner watershed.
2.2.3 Hydrological response module
The slopes in the watershed were defined into three categories based on the DEM, namely, 0%–8%, 8%–16%, and greater than 16%, and overlaid with the land use and soil type maps to determine an area threshold of 15% for soils, land use, and slopes based on the combination and distribution characteristics of land use, soils, and slopes. Hydrologic response units were delineated, and 239 hydrologic response units were generated throughout the watershed.
2.3 Data collection
The meteorological input files for precipitation, air temperature, humidity, and wind speed were sourced from four stations: Linhe, Hohmudu, Chaokai, and Ertuoqqi. These data were edited and imported into the meteorological database in the format required for the SWAT input files. Additionally, solar radiation data were generated automatically using the WGEN_CFSR_World meteorological generator, which is considered a reliable source. However, the precision and accuracy of these data significantly affect the simulation outcomes of the SWAT model. During the model’s parameter calibration process, it is challenging to fully align the model with the characteristics of the study area, leading to potential limitations in the simulation’s accuracy. These limitations highlight areas that need improvement to enhance the model’s performance and reliability in future applications.
2.4 Methodology for evaluating the model
This study evaluates the applicability of the model using the coefficient of determination from linear regression (R2), Nash–Sutcliffe efficiency (NSE), relative error (Re), and root mean squared error (RMSE), as shown in Equations 1–4.
The linear regression coefficient of determination R2 was calculated as follows:
The Nash efficiency coefficient NSE was calculated as follows:
The relative error Re was calculated as follows:
The root mean square error is calculated as follows:
where
3 Results and discussion
3.1 Sensitivity analysis of model parameters
The SWAT model encompasses hundreds of parameters, among which 14 parameters with a significant impact on runoff were chosen. Table 1 shows the LH-OAT sensitivity analysis method and multiple regression models for sensitivity analysis, and the confidence intervals were determined using the Sufi-2 algorithm in the SWAT-CUP. The sensitivities of the parameters were assessed based on P and t values. Here, P represents the significance level of the parameter’s sensitivity, and t represents the magnitude of sensitivity, such that a larger absolute value of t implies greater sensitivity. Conversely, a value closer to 0 for P indicates a more significant variable. Additionally, the larger the absolute value of t, the more pronounced the sensitivity of the parameter. Among the 14 parameters, 7 exhibited extremely significant effects (P < 0.01), namely, the number of curves of the moisture condition (CN2), the base flow α factor (ALPHA_BF), the number of delayed days of groundwater (GW_DELAY), the soil ET compensation factor (ESCO), soil effective water capacity (SOL_AWC), soil saturated infiltration coefficient (SOL_K), and depth to groundwater where backflow occurs (GWQMN). These parameters were used as the main rate objects during parameter rate determination.
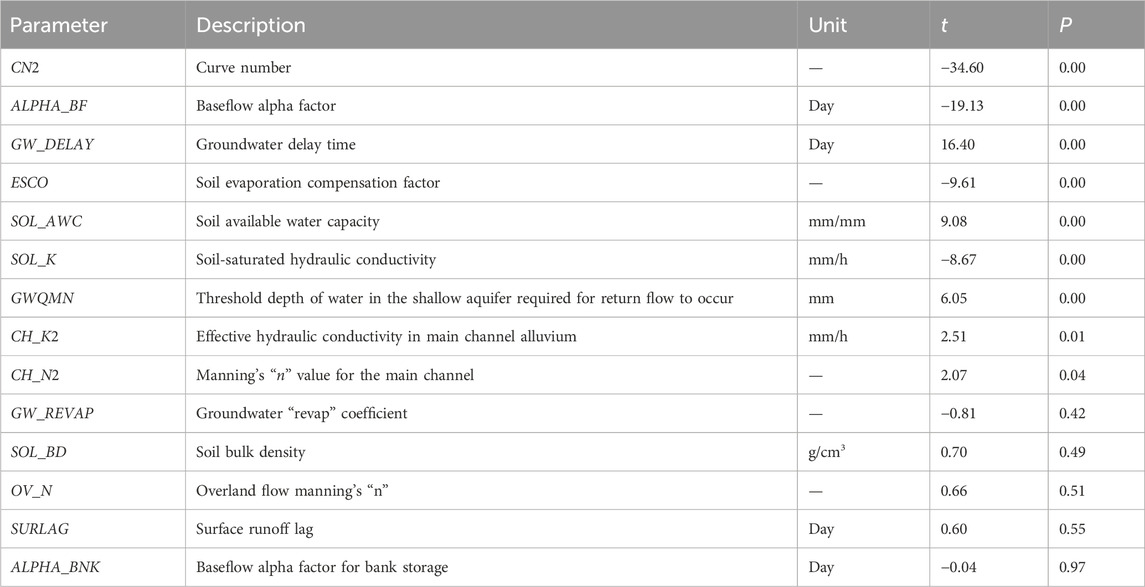
Table 1. Sensitivity analysis of 14 parameters in the SWAT model.
3.2 Calibration and validation of the model
The period spanning from 2017 to 2018 was designated as the calibration period, while the period from 2019 to 2020 was assigned as the validation period. We utilized SWAT-CUP software to calibrate the model parameters, drawing on the actual measured flow of drainage. The Sufi-2 algorithm, included in the model, was employed for this purpose. Based on a sensitivity analysis, we selected seven parameters that showed high significance for calibration, as detailed in Table 2. Additionally, we defined the calibration range for these parameters and determined the calibration methods, according to their specific characteristics.
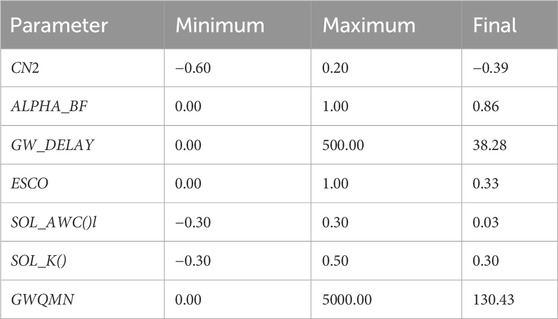
Table 2. Calibration results of the seven most significant parameters in the SWAT model.
Figure 4 presents a comparison between the simulated and measured values of monthly discharges in the study area from 2017 to 2020. The consistency in the trends between these simulated and measured values, as depicted therein, is fairly in line with the research carried out by Liu et al. (2024), in which they simulated the drainage flow at the principal drainage outlets in the Hetao Irrigation District by employing the SWAT-MODFLOW-RT 3D model. Table 3 shows the results of parameter calibration and validation, with R2, NSE, Re, and RMSE values of 0.65, 0.60, −8.54%, and 384.65 × 10⁴ m3, respectively, for the model calibration period, and 0.63, 0.56, −7.82%, and 389.65 × 10⁴ m3, respectively, for the validation period. In accordance with the evaluation guidelines of Moriasi et al. (2015), the NSE coefficient falling between 0.5 and just below 0.65 is deemed to signify an “acceptable” performance of the model. In the context of this study, the analysis of monthly simulated values revealed a satisfactory level of agreement with observed data during both the calibration and validation phases, indicating that the model can reliably capture the underlying patterns in the data. The R2 and NSE values in our study align closely with those obtained from Zafarmomen et al. (2024); Kannan et al. (2010); and Wu et al. (2017). Our findings reveal that the NSE values exceed those reported by Xiao et al. (2023) in their investigation of the Xiaoxingkai Lake Basin in China, which implies a superior model performance in our study. Nevertheless, the R2 values are lower than those of their study, indicating that the explained variance is relatively less compared to their simulation outcomes. However, our results are inferior to those reported by Tan et al. (2022), who employed the SWAT model to simulate riverine phosphorus flux in the Yarlung Zangbo River, yielding higher NSE and R2 values. Zhang S. et al. (2024) calibrated and validated data from drainage outlet monitoring points in the Ningxia Yellow River Irrigation District using the SWAT. The R2 value in the calibration period was 0.72 and that in the validation period was 0.79, which are slightly better than the results obtained in our study. Furthermore, the RMSE for both the calibration and validation periods in our study was comparable to the values noted by Wen et al. (2020) for general drainage ditch command areas in the Hetao Irrigation District. In contrast, our results were less satisfactory than the simulation outcomes put forward by Alakbar and Burgan (2024) in the Antalya Basin. Nevertheless, our simulation results remain generally within an acceptable range and have the potential for further improvement through parameter optimization.
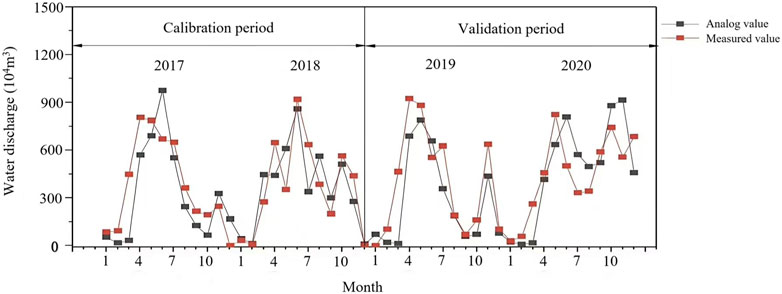
Figure 4. Simulated and measured results of monthly drainage in the south bank irrigation area of the Yellow River in Hangjin Banner during the calibration and validation periods, 2017-2020.
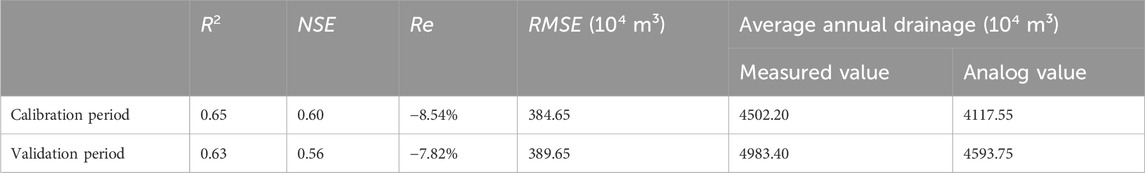
Table 3. Results of calibration and validation of water discharge in the study area.
Based on the simulation results, there were two peaks of drainage per year. The first peak occurred in April–June, which was the pre-fertility period of the crop, with higher irrigation and more drainage generated. The second peak occurred in October–November, which was fall watering, leading to a rise in the groundwater table and increased drainage of the area. These simulation results are in alignment with the findings of Wen et al. (2020), which indicated that the irrigation areas were irrigated with spring irrigation in May and fall irrigation in October. Furthermore, the study revealed that both subsurface drainage and groundwater table depth manifested a delayed response to irrigation, with peak values being observed in May, June, and November. Our findings suggest that the drainage volume attains its peak around June and reaches its lowest point in January during the non-irrigation period. This is highly congruent with the research findings of Guo et al. (2024) regarding the Nukus irrigation area, which is situated downstream of the Amudarya River.
3.3 Water balance analysis
Water balance is the basis for analyzing and researching hydrological phenomena and processes, and it is one of the most important indicators for evaluating the accuracy of hydrological model calculations. The fundamental principle underlying water balance is the law of mass conservation by Equation 5. In the calculation process, the SWAT model adheres to the water balance of each hydrological response unit, which is gradually extended to the sub-area and then to the entire area.
The soil water balance equation in the SWAT model is
where SWt is the final soil water content; SW0 is the pre-soil water content; t is the time step; Rday is the surface input on day i, which includes both precipitation and irrigation components; Ea is ET on day i;
Table 4 shows the results of soil moisture balance calculations.

Table 4. Average water balance in the south bank irrigation area of the Yellow River in Hangjin Banner, 2017-2020 (104 m³).
The data presented in Table 4 demonstrate that the soil water storage within the irrigation area maintained a relatively stable state. Specifically, precipitation contributed 39.4% to the water supply, whereas irrigation accounted for 61.6% within this region. Our findings are in accordance with the study conducted by Wang et al. (2024) in the Hetao Irrigation District of Inner Mongolia, where similar patterns were also observed. However, these values deviate from the findings of the study by Sawyer (2010), who reported that the recharge ought to be 10%–20% of annual rainfall in the South Fork Watershed, Iowa (41°35′N, 93°36′W). This may be because the south bank irrigation area of the Yellow River in Hangjin Banner required more irrigation water recharge due to huge ET caused by climatic conditions and other factors. On the contrary, ET served as the principal output component of water within the irrigation area, accounting for 83.0% of the water output and exceeding the amount of precipitation during the corresponding period. These results generally disagree with the findings of Sawyer (2010) and Green et al. (2006) in Iowa. The simulated ET reported in these two studies accounted for 70% and 74% of the rainfall, respectively. This may be due to the dry and hot summers in our study area; thus, ET was huge (Yan et al., 2021; Yan et al., 2022a; Li et al., 2022). The ET is the major water consumption component in the arid irrigation district. Our results indicate that surface drainage constituted less than 1% of the precipitation, which is significantly lower than the 5% reported by Green et al. (2006). According to their study, surface drainage was identified as 5% of precipitation. Additionally, our study shows that total drainage in the area accounted for 13.2% of the water inputs. Yu et al. (2016) found that the ratio of drainage to water inputs was 11.4% in the Hetao Irrigation District from 2006 to 2012, similar to our results. From 2017 to 2020, the drainage volume in this study area accounted for 22.3% of the irrigation water volume, which is inconsistent with the findings reported by Wen et al. (2020), where the average annual drainage volume in the Hetao Irrigation District constituted 10.5% of the annual irrigation water volume. This discrepancy may be attributed to the loose soil texture and high permeability coefficient in this study area, which facilitates a greater occurrence of drainage.
3.4 Drainage structure analysis
On the basis of the simulated total drainage within the study area and the calculated contributions of surface drainage, subsurface flow, and subsurface drainage via the SWAT model, the drainage type of the south bank irrigation area of the Yellow River in Hangjin Banner was mainly dominated by subsurface drainage. According to Figure 5, it accounted for 74.56%, 63.26%, 76.01%, and 63.84% of the total annual drainage during the period from 2017 to 2020. Wen et al. (2020) found that the subsurface drainage accounted for 67.3% of total drainage in the Hetao Irrigation District from 2008 to 2010 and from 2021 to 2013, which agrees with our results. This is also congruent with the results estimated by Green et al. (2006) within the period from 1994 to 2004 in Iowa, where the proportion was 71%. Our results showed that subsurface drainage accounted for 31% of total drainage, and surface drainage only accounted for 1%. Bailey et al. (2022) reported that from 2006 to 2011, in the South Fork Watershed, Iowa, surface drainage constituted 46% of the total water yield, while the subsurface flow accounted for 7%. This finding contrasts with our study, likely due to the flat terrain and small overall slope of Hangjinqi, which, influenced by gravity, allows ample time for infiltration and the generation of subsurface flow. Nevertheless, this result is in alignment with the findings of Zhang T. et al. (2024), regarding the Ningxia irrigated areas. They reported that, owing to the high water use efficiency within their study area, there was almost no visible surface runoff. The changes in the drainage structure of the irrigation area each year have been relatively minor. Table 5 shows that in both 2017 and 2019, the ratio of subsurface drainage to subsurface flow was approximately 3:1, indicating a similar drainage structure for these years. Similarly, in 2018 and 2020, the ratio of subsurface drainage to subsurface flow was approximately 9:4, reflecting a consistent drainage structure. Despite the fact that the total drainage volume fluctuates from year to year, the proportions of surface drainage, subsurface flow, and subsurface drainage with respect to the total volume remain consistently comparable. This implies that the drainage structure within the area is relatively stable over an extended period.
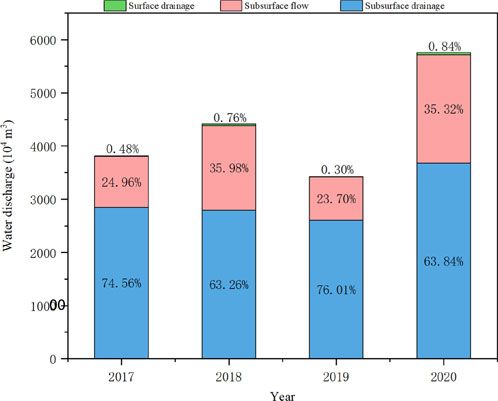
Figure 5. Annual drainage structure of the south bank irrigation area of the Yellow River in Hangjin Banner.
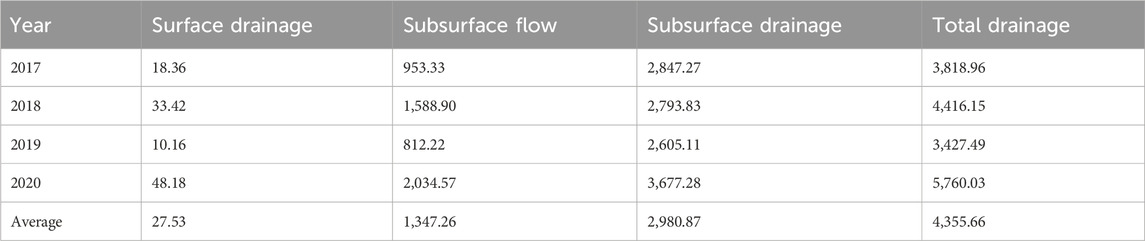
Table 5. Contribution of different types of drainage to total discharge (104 m³).
3.5 Drainage structure analysis for each irrigation area
Table 6 shows the discharge from each irrigation district in relation to the total discharge from the watershed for the period 2017 to 2020, and Figure 6 shows the ratios of drainage to total drainage for each irrigation area. It is observed that the proportion of the drainage volume of each irrigation area to the total drainage volume of the entire irrigation area exhibited minimal variation from year to year. Specifically, from 2017 to 2020, the drainage volume generated by the Balahey irrigation area accounted for approximately 20% of the total drainage volume, that of the Jianshe irrigation area accounted for approximately 45%, and that of the Dugui irrigation area accounted for roughly 35%.
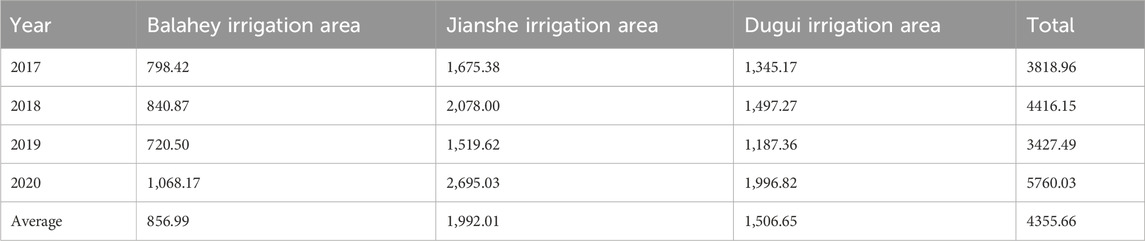
Table 6. Annual discharge of each irrigation area (104 m³).
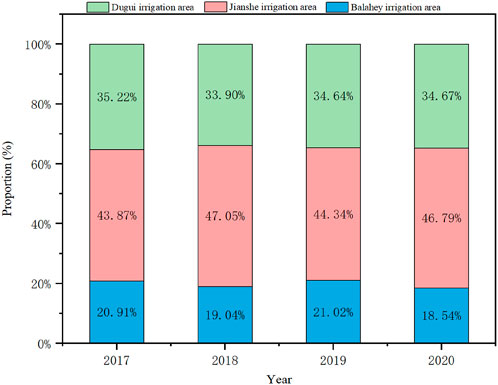
Figure 6. Ratio of drainage to total drainage of irrigation areas in 2017–2020.
Figure 7 shows the drainage structure of each irrigation district. Balahey irrigation area had the smallest annual change in drainage structure. The proportion of all types of drainage fluctuated within 3% each year. The proportion of the loamy medium flow and subsurface drainage each accounted for half of the total drainage and did not produce surface drainage. The relatively high proportion of the loamy medium flow in the Balahey irrigation area might be associated with the predominance of sandy soil within the region, given that sandy soil possesses a larger permeability coefficient. As per the research by Frederiksen and Molina-Navarro (2021), soils with a high clay content are predominantly characterized by subsurface drainage, whereas if the sandy soil content is elevated, it tends to facilitate the subsurface flow. The Jianshe irrigation area demonstrated substantial variations in the proportion of each type of drainage on an annual basis, which was analogous to the variations in the total drainage. In 2017 and 2019, the proportion of loamy medium flow was relatively low, amounting to less than 20%. In contrast, during 2018 and 2020, this proportion was relatively high, accounting for nearly 30%. Nevertheless, on the whole, subsurface drainage continued to play a dominant role in the drainage of the Jianshe irrigation area. The inter-annual variation in the drainage structure of the Dugui irrigation area was within 7%. Although the proportion of surface drainage in the Dugui irrigation area only accounted for about 1% of the total drainage, it was the highest among the three irrigation areas. Overall, the drainage sources in the Dugui irrigation area were still dominated by subsurface drainage, supplemented by the loamy medium flow.
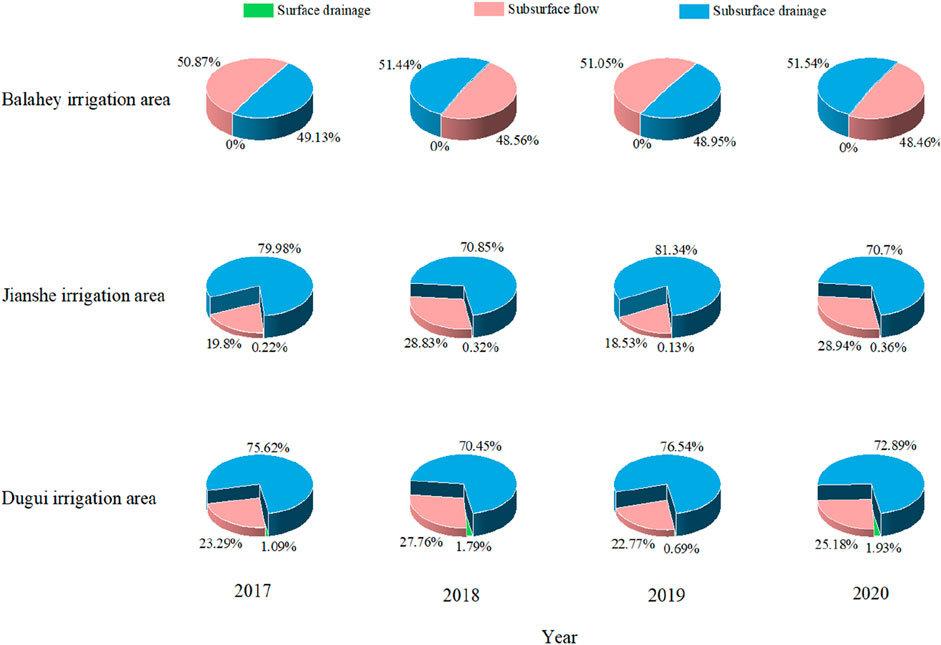
Figure 7. Drainage structure of irrigation districts in 2017–2020.
4 Conclusion
This study utilized the distributed SWAT model to establish a hydrological cycle model that is applicable to the south bank Irrigation Area of Hangjin Banner in Ordos City. The establishment was achieved by collecting the Digital Elevation Model (DEM), soil, land use, meteorological, and irrigation data. The model input process for plain irrigation district drainage ditches was optimized, and the model parameters were calibrated and validated using SWAT-CUP software. The results indicated that the model is capable of effectively simulating the drainage in the study area. Our findings revealed that the average annual drainage of the irrigation area was 4355.65 × 104 m³. The primary source of this drainage was subsurface drainage, which accounted for approximately 68% of the total. In addition, the subsurface flow was identified as the second largest source, contributing approximately 31%, while surface drainage made a minimal contribution, accounting for only 1%. With respect to the distribution of drainage among different irrigation districts, the Balahey irrigation district contributed approximately 20%, the Jianshe irrigation district accounted for approximately 45%, and the Dugui irrigation district constituted approximately 35%.
In this study, we selected 14 parameters for sensitivity analysis, among which only 7 were found to be extremely important and were subjected to verification and validation, but the results were not satisfactory. Therefore, we suggest that future research should consider incorporating additional performance metrics to ensure the reliability of the SWAT model. Moreover, due to objective factors, this study merely focused on the volume and sources of irrigation drainage, failing to precisely quantify agricultural water consumption and irrigation water use efficiency.
For future studies, it is of paramount importance to refine the parameters and, potentially, restructure the SWAT model to attain more precise simulation results. It is advisable to prolong the observation period and validate the performance of the model in light of empirical data. Moreover, a larger dataset should be utilized to augment the precision of the research. Future investigations could utilize various hydrological models to evaluate the impact of different drainage techniques and volumes on soil salinization, helping identify optimal drainage strategies. Furthermore, it is of critical importance to investigate the efficacy of responsible drainage practices in alleviating soil salinization and forestalling its recurrence. It is also necessary to ensure that these practices are customized to suit local climatic and soil conditions. Furthermore, the potential of using groundwater as an alternative water source should be investigated, along with an assessment of how drainage from saline–alkali lands may affect groundwater resources.
Data availability statement
The original contributions presented in the study are included in the article/supplementary material; further inquiries can be directed to the corresponding author.
Author contributions
ZH: funding acquisition and writing–review and editing. HY: writing–original draft. BR: writing–review and editing. WB: writing–review and editing. WJ: writing–review and editing. TD: writing–review and editing. YH: writing–review and editing. HB: writing–review and editing.
Funding
The author(s) declare that financial support was received for the research, authorship, and/or publication of this article. This study was financially supported by the Key Water Science and Technology Project of Ordos City (ESKJ2023-001); the Water Science and Technology Special Projects of the Inner Mongolia Autonomous Region (NSLKJ2024002-04); the Water Saving and Efficient Utilization Technology in West Ordos, (grant No. ZD 20232302); and Yinshanbeilu Grassland Eco-hydrology National Observation and Research Station, Institute of Water Resources and Hydropower Research, Beijing 100038, China (YSS2022011).
Conflict of interest
The authors declare that the research was conducted in the absence of any commercial or financial relationships that could be construed as a potential conflict of interest.
Generative AI statement
The author(s) declare that no Generative AI was used in the creation of this manuscript.
Publisher’s note
All claims expressed in this article are solely those of the authors and do not necessarily represent those of their affiliated organizations, or those of the publisher, the editors and the reviewers. Any product that may be evaluated in this article, or claim that may be made by its manufacturer, is not guaranteed or endorsed by the publisher.
References
Addab, H., and Bailey, R. T. (2022). Simulating the effect of subsurface tile drainage on watershed salinity using swat. Agr. Water manage. 262, 107431. doi:10.1016/j.agwat.2021.107431
Alakbar, T., and Burgan, H. I. (2024). Regional power duration curve model for ungauged intermittent river basins. J. Water Clim. Change 15 (9), 4596–4612. doi:10.2166/wcc.2024.207
Aouissi, J., Benabdallah, S., Acirc, C., Ne, Z. L., and Cudennec, C. (2014). Modeling water quality to improve agricultural practices and land management in a tunisian catchment using the soil and water assessment tool. J. Environ. Qual. 43 (No.1), 18–25. doi:10.2134/jeq2011.0375
Arslan, H. (2012). Spatial and temporal mapping of groundwater salinity using ordinary kriging and indicator kriging: the case of bafra plain, Turkey. Agr. Water manage. 113, 57–63. doi:10.1016/j.agwat.2012.06.015
Bailey, R. T., Bieger, K., Flores, L., and Tomer, M. (2022). Evaluating the contribution of subsurface drainage to watershed water yield using swat+ with groundwater modeling. Sci. Total Environ. 802, 149962. doi:10.1016/j.scitotenv.2021.149962
Brunner, P., Franssen, H. J. H., Kgotlhang, L., Bauer-Gottwein, P., and Kinzelbach, W. (2007). How can remote sensing contribute in groundwater modeling? Hydrogeol. J. 15 (1), 5–18. doi:10.1007/s10040-006-0127-z
Dewandel, B., Gandolfi, J. M., de Condappa, D., and Ahmed, S. (2008). An efficient methodology for estimating irrigation return flow coefficients of irrigated crops at watershed and seasonal scale. Hydrol. Process. 22 (No.11), 1700–1712. doi:10.1002/hyp.6738
Disasa, K. N., Yan, H., Wang, G., Zhang, J., Zhang, C., and Zhu, X. (2024). Projection of future precipitation, air temperature, and solar radiation changes in southeastern China. Theor. Appl. Climatol. 155, 4481–4506. doi:10.1007/s00704-024-04891-0
Fisher, M. J., Fausey, N. R., Subler, S. E., Brown, L. C., and Bierman, P. M. (1999). Water table management, nitrogen dynamics, and yields of corn and soybean. Soil Sci. Soc. Am. J. 63 (NO.6), 1786–1795. doi:10.2136/sssaj1999.6361786x
Frederiksen, R. R., and Molina-Navarro, E. (2001). The importance of subsurface drainage onmodel performance and water balance in an agricultural catchment using SWAT and SWAT-MODFLOW. Agric. Water. Manag. 255, 107058. doi:10.1016/j.agwat.2021.107058
Gassman, P. W., Sadeghi, A. M., and Srinivasan, R. (2014). Applications of the swat model special section: overview and insights. J. Environ. Qual. 43 (1), 1–8. doi:10.2134/jeq2013.11.0466
Green, C. H., Tomer, M. D., Di Luzio, M., and Arnold, J. G. (2006). Hydrologic evaluation of the soil and water assessment tool for a large tile-drained watershed in Iowa. Trans. ASABE 49 (2), 413–422. doi:10.13031/2013.20415
Guo, C., Liu, T., Huang, Y., Niu, Y., Kmalov, S., and Guo, F. (2024). Sustainable groundwater regulation in typical irrigation areas of inland river basins based on ecological indicators and the MIKE-SHE hydrological model. J. Hydrology Regional Stud. 56, 102000. doi:10.1016/j.ejrh.2024.102000
Jafari, H., Raeisi, E., Zare, M., and Haghighi, A. A. K. (2012). Time series analysis of irrigation return flow in a semi-arid agricultural region, Iran. Arch. Agron. Soil Sci. 58 (6), 673–689. doi:10.1080/03650340.2010.535204
Jouni, H. J., Liaghat, A., Hassanoghli, A., and Henk, R. (2018). Managing controlled drainage in irrigated farmers’fields: a case study in the moghan plain, Iran. Agr. Water manage. 208, 393–405. doi:10.1016/j.agwat.2018.06.037
Kannan, N., Jeong, J., and Srinivasan, R. (2010). Hydrologic modeling of a canal-irrigated agricultural watershed with irrigation best management practices: case study. J.Hydrol. Eng. 16 (9), 746–757. doi:10.1061/(asce)he.1943-5584.0000364
Kasahara, T., and Hill, A. R. (2008). Hyporheic exchange flows induced by constructed riffles and steps in lowland streams in southern ontario, Canada. Hydrol. Process. 20 (20), 4287–4305. doi:10.1002/hyp.6174
Knöll, P., Zirlewagen, J., and Scheytt, T. (2020). Using radar-based quantitative precipitation data with coupled soil- and groundwater balance models for stream flow simulation in a karst area. J. Hydrol. 586, 124884. doi:10.1016/j.jhydrol.2020.124884
Lakhiar, I. A., Yan, H., Zhang, J., Wang, G., Deng, S., Bao, R., et al. (2024). Plastic pollution in agriculture as a threat to food security, the ecosystem, and the environment:an overview. Agronomy 14, 548. doi:10.3390/agronomy14030548
Lei, Z., Su, L., Yang, S., and Ha, A. (2002). Balance analysis of water resources in qingtongxia irrigation area. J. Hydraul. Eng. 6, 9–14. doi:10.13243/i.cnki.slxb.2002.06.002
Li, M., Yan, H., Zhang, C., Zhang, J., Wang, G., and Acquah, J. (2022). A review on greenhouse crop evapotranspiration models: current deficiencies and needed enhancements. J. Irrig. Drain. Eng. 148. doi:10.1061/(asce)ir.1943-4774.0001660
Li, P., Qian, H., and Wu, J. (2018). Conjunctive use of groundwater and surface water to reduce soil salinization in the yinchuan plain, north-west China. Abingdon, Oxfordshire: Routledge Journals, Taylor and Francis Ltd, 337–353.
Li, S., Luo, W., Jia, Z., Tang, S., and Chen, C. (2018). The pros and cons of encouraging shallow groundwater use through controlled drainage in a salt-impacted irrigation area. Water Resour. Manag. 32 (7), 2475–2487. doi:10.1007/s11269-018-1940-6
Li, X., Zhang, C., and Huo, Z. (2020). Optimizing irrigation and drainage by considering agricultural hydrological process in arid farmland with shallow groundwater. J. Hydrol. 585, 124785. doi:10.1016/j.jhydrol.2020.124785
Liu, Y., Zeng, W., Ao, C., Liu, Z., and Hu, X. (2024). Optimizing irrigation and planting strategies to prevent non-point source pollution in the Hetao Irrigation District using SWAT-MODFLOW-RT3D model. Sci. Total Environ. 957, 177757. doi:10.1016/j.scitotenv.2024.177757
Mainuddin, M., Maniruzzaman, M., Gaydon, D. S., Sarkar, S., Rahman, M. A., Sarangi, S. K., et al. (2020). A water and salt balance model for the polders and islands in the ganges delta. J. Hydrol. 587, 125008. doi:10.1016/j.jhydrol.2020.125008
Maleki Tirabadi, M. S., Banihabib, M. E., and Randhir, T. O. (2021). Swat-s: a swat-salinity module for watershed-scale modeling of natural salinity. Environ. Modell. Softw. 135, 104906. doi:10.1016/j.envsoft.2020.104906
Mohan, S., and Vijayalakshmi, D. P. (2009). Prediction of irrigation return flows through a hierarchical modeling approach. Agr. Water manage. 96 (2), 233–246. doi:10.1016/j.agwat.2008.07.013
Moriasi, D. N., Gitau, M. W., Pai, N., and Daggupati, P. (2015). Hydrologic and water quality models: performance measures and evaluation criteria. Trans. ASABE 58 (6), 1763–1785. doi:10.13031/TRANS.58.10715
Neitsch, S. L., Arnold, J. G., Kiniry, J. R., and Williams, J. R. (2011). Soil and water assessment tool theoretical documentation. College Station, TX, USA: Texas Water Re-search Institute.
Nikolaidis, N. P., Bouraoui, F., and Bidoglio, G. (2013). Hydrologic and geochemical modeling of a karstic mediterranean watershed. J. Hydrol. 477, 129–138. doi:10.1016/j.jhydrol.2012.11.018
Ren, D. Y., Xu, X., Ramos, T. B., Huang, Q. Z., Huo, Z. L., and Huang, G. H. (2017). Modeling and assessing the function and sustainability of natural patches in salt-affected agroecosystems: application to tamarisk (Tamarix chinensis Lour.) in Hetao, upper Yellow River basin. J. Hydrol. 552, 490–504. doi:10.1016/j.jhydrol.2017.04.054
Ritzema, H. P. (2016). Drain for gain: managing salinity in irrigated lands—a review. Agr. Water manage. 176, 18–28. doi:10.1016/j.agwat.2016.05.014
Ritzema, H. P., Nijland, H. J., and Croon, F. W. (2006). Subsurface drainage practices: from manual installation to large-scale implementation. Agr. Water manage. 86 (1), 60–71. doi:10.1016/j.agwat.2006.06.026
Samani, N., Kompani-Zare, M., Seyyedian, H., and Barry, D. A. (2004). “Flow to horizontal and slanted drains in anisotropic unconfined aquifers,” in Developments in water science. Editors C. T. Miller, M. W. Farthing, W. G. Gray, and G. F. Pinder (Elsevier), 427–440.
Sawyer, L. M. (2010). Comparison of a watershed model (SWAT) and a subsurface drainage model (GFLOW) to simulate the hydrology of two agricultural watersheds in Iowa. Ames, Iowa: Iowa State University.
Schilling, K., and Zhang, Y. (2004). Baseflow contribution to nitrate-nitrogen export from a large, agricultural watershed, USA. J. Hydrol. 295 (1), 305–316. doi:10.1016/j.jhydrol.2004.03.010
Schilling, K. E., Jindal, P., Basu, N. B., and Helmers, M. J. (2012). Impact of artificial subsurface drainage on groundwater travel times and baseflow discharge in an agricultural watershed, Iowa (USA). Hydrol. Process. 26 (20), 3092–3100. doi:10.1002/hyp.8337
Singh, A. (2019a). Environmental problems of salinization and poor drainage in irrigated areas: management through the mathematical models. J. Clean. Prod. 206, 572–579. doi:10.1016/j.jclepro.2018.09.211
Singh, S. K. (2012). Closure to“generalized analytical solutions for groundwater head in inclined aquifers in the presence of subsurface drains”by sushil k. Singh. J. Irrig. Drain. Eng. 138 (5), 490–491. doi:10.1061/(asce)ir.1943-4774.0000443
Tan, Y., Chen, M., Zhang, L., Li, J., Nan, S., and Peng, T. (2022). Flux and spatial pattern of phosphorus in the shigatse section of the Yarlung Zangbo River, China. Ecol. Indic. 135, 108552. doi:10.1016/j.ecolind.2022.108552
Wang, Y., Yang, W., Jiao, Y., Ma, X., and Qi, W. (2024). Quantitative analysis of dissolved carbon sources in the farmland artificial ditch drainage-Lake UlanSuhai continuum in the Hetao Irrigation District's, Inner Mongolia. J. Hydrology Regional Stud. 55 (2024), 101910. doi:10.1016/j.ejrh.2024.101910
Wen, Y., Shang, S., Rahman, K. U., Xia, Y., and Ren, D. (2020). A semi-distributed drainage model for monthly drainage water and salinity simulation in a large irrigation district in arid region. Agr. Water manage. 230, 105962. doi:10.1016/j.agwat.2019.105962
Wen, Y., Wan, H., Shang, S., and Rahman, K. U. (2022). A monthly distributed agrohydrological model for irrigation district in arid region with shallow groundwater table. J. Hydrol. 609, 127746. doi:10.1016/j.jhydrol.2022.127746
Wichelns, D., and Qadir, M. (2015). Achieving sustainable irrigation requires effective management of salts, soil salinity, and shallow groundwater. Agric. Water Manag. 157, 31–38. doi:10.1016/j.agwat.2014.08.016
Wondzell, S. M., Lanier, J., and Haggerty, R. (2009). Evaluation of alternative groundwater flow models for simulating hyporheic exchange in a small mountain stream. J. Hydrol. 364 (1), 142–151. doi:10.1016/j.jhydrol.2008.10.011
Wu, D., Cui, Y., Wang, Y., Chen, M., Luo, Y., and Zhang, L. (2019). Reuse of return flows and its scale effect in irrigation systems based on modified swat model. Agr. Water manage. 213, 280–288. doi:10.1016/j.agwat.2018.10.025
Wu, Y., Shi, X., Li, C., Zhao, S., Pen, F., and Green, T. R. (2017). Simulation of hydrology and nutrient transport in the Hetao irrigation district, inner Mongolia, China. China. Water 9 (3), 169. doi:10.3390/w9030169
Xiao, F., Wang, X., and Fu, C. (2023). Impacts of land use/land cover and climate change on hydrological cycle in the Xiaoxingkai Lake Basin. J. Hydrology Regional Stud. 47, 101422. doi:10.1016/j.ejrh.2023.101422
Xing, Z., Liu, S., and Yan, D. (2017). Advance in the study of the impacting factors and analysis methods of irrigation return flows. China Rural Water Hydropower 8, 1–4.
Yan, H., Deng, S., Zhang, C., Wang, G., Zhao, S., Li, M., et al. (2023). Determination of energy partition of a cucumber grown Venlo-type greenhouse in southeast China. Agric. Water Manag. 276, 108047. doi:10.1016/j.agwat.2022.108047
Yan, H., Huang, S., Zhang, J., Zhang, C., Wang, G., Li, L., et al. (2022a). Comparison of shuttleworth-wallace and dual crop coefficient method for estimating evapotranspiration of a tea field in southeast China. Agric 12 (9), 1392. doi:10.3390/agriculture12091392
Yan, H., Li, M., Zhang, C., Zhang, J., Wang, G., Yu, J., et al. (2022b). Comparison of evapotranspiration upscaling methods from instantaneous to daytime scale for tea and wheat in southeast China. Agric. Water Manag. 264, 107464. doi:10.1016/j.agwat.2022.107464
Yan, H., Yu, J., Zhang, C., Wang, G., Huang, S., and Ma, J. (2021). Comparison of two canopy resistance models to estimate evapotranspiration for tea and wheat in southeast China. Agric. Water Manag. 245, 106581. doi:10.1016/j.agwat.2020.106581
Yu, B., Jiang, L., and Shang, S. (2016). Dry drainage effect of Hetao irrigation district based on remote sensing evapotranspiration. T. Chin. Soc. Agric. Eng. 32 (18), 1–8. doi:10.11975/j.issn.1002-6819.2016.18.001
Zafarmomen, N., Alizadeh, H., Bayat, M., Ehtiat, M., and Moradkhani, H. (2024). Assimilation of sentinel-based leaf area index for modeling surface-ground water interactions in irrigation districts. Water Resour. Res. 60 (10), e2023WR036080. doi:10.1029/2023wr036080
Zettam, A., Taleb, A., Belaidi, N., Sauvage, S., Sanchez-Perez, J. M., and Boithias, L. (2020). Applications of a swat model to evaluate the contribution of the tafna catchment (north-west africa) to the nitrate load entering the mediterranean sea. Environ. Monit. Assess. 192 (8), 510–517. doi:10.1007/s10661-020-08482-0
Zhang, S., Zhang, L., Meng, Q., Wang, C., Ma, J., Li, H., et al. (2024). Evaluating agricultural non-point source pollution with high-resolution remote sensing technology and SWAT model: a case study in Ningxia Yellow River Irrigation District, China. Ecol. Indic. 166, 112578. doi:10.1016/j.ecolind.2024.112578
Zhang, T., Xu, Q., Liu, X., Lei, Q., Luo, J., An, M., et al. (2024). Sources, fate and influencing factors of nitrate in farmland drainage ditches of the irrigation area. J. Environ. Manag. 367 (2024), 122113. doi:10.1016/j.jenvman.2024.122113
Zhao, S., Yan, H., Zhang, C., Li, M., Deng, S., and Jiang, J. (2023). The parameters modification of the dual crop coefficient model and Priestley-Taylor model for estimating greenhouse cucumber evapotranspiration. J. Irrig. Drain. Eng. doi:10.3969/j.issn.1674-8530.22.0046
Keywords: drainage traceability, surface drainage, subsurface flow, subsurface drainage, the SWAT model
Citation: Hexiang Z, Yujing H, Rongxuan B, Biyu W, Jiabin W, Delong T, Haofang Y and Beibei H (2025) Traceability simulation of drainage in irrigation areas along the south bank of the Yellow River based on the SWAT model. Front. Environ. Sci. 13:1517836. doi: 10.3389/fenvs.2025.1517836
Received: 28 October 2024; Accepted: 02 January 2025;
Published: 23 January 2025.
Edited by:
Rajendra Prasad Singh, Southeast University, ChinaReviewed by:
Halil Ibrahim Burgan, Akdeniz University, TürkiyeAnina James, Chinese Academy of Agricultural Sciences (CAAS), China
Copyright © 2025 Hexiang, Yujing, Rongxuan, Biyu, Jiabin, Delong, Haofang and Beibei. This is an open-access article distributed under the terms of the Creative Commons Attribution License (CC BY). The use, distribution or reproduction in other forums is permitted, provided the original author(s) and the copyright owner(s) are credited and that the original publication in this journal is cited, in accordance with accepted academic practice. No use, distribution or reproduction is permitted which does not comply with these terms.
*Correspondence: Yan Haofang, eWFuaGFvZmFuZ3loZkAxNjMuY29t