
94% of researchers rate our articles as excellent or good
Learn more about the work of our research integrity team to safeguard the quality of each article we publish.
Find out more
ORIGINAL RESEARCH article
Front. Environ. Sci., 11 February 2025
Sec. Land Use Dynamics
Volume 13 - 2025 | https://doi.org/10.3389/fenvs.2025.1514008
 Shuangfu Shi1,2
 Shuangyun Peng1,2*
 Zhiqiang Lin1,2*Bangmei Huang3Dongling Ma1,2Ziyi Zhu1,2Yilin Zhu1,2
 Rui Zhang1Ting Li1
Facing the challenges brought about by global climate change and biodiversity loss, accurately assessing ecological environmental quality (EEQ), and its driving factors are crucial for formulating effective strategies for ecological protection and restoration. However, there remains limited understanding of the interactions and causal relationships between multiple factors, with existing studies mainly focusing on the impact of individual factors on EEQ and their correlations. This study took Myanmar as the research area, employing a Remote Sensing Ecological Index (RSEI) model and spatial autocorrelation analysis to quantitatively evaluate the spatial distribution characteristics of Myanmar’s EEQ in 2020 and reveal its spatial dependence. Furthermore, by innovatively integrating the Geodetector and Geographical Convergent Cross Mapping (GCCM) methods, this study systematically analyzed the impacts and causal relationships of various factors on the spatiotemporal differentiation of EEQ. The results indicate that: (1) Myanmar’s overall EEQ was relatively good, but there is significant spatial heterogeneity; (2) Local spatial autocorrelation analysis revealed a clear spatial clustering pattern of EEQ in Myanmar; (3) Geodetector analysis identified DEM, slope, Net Primary Productivity (NPP), land use, and human footprint as the dominant factors influencing EEQ, with significant interactions among these factors; (4) GCCM analysis further verified the significant causal effects of DEM, slope, NPP, and human footprint on EEQ, while the causal effects of temperature, precipitation, and land use are relatively weaker. This study established a technical framework for analyzing the spatial differentiation and causes of EEQ, unveiling the mechanisms of ecological evolution driven by natural and human factors. It enriched the understanding of human-environment interactions within coupled systems and delved into the complex mechanisms and causal effects among multiple factors within the ecological system. These insights enhanced our understanding of the intricate relationships between EEQ and its influencing factors, providing valuable references for ecological protection and sustainable development in Myanmar.
The world’s ecological environment faces unprecedented challenges. Climate change (Wilkes et al., 2024), population growth (Xiao et al., 2022), overexploitation of resources (Yang et al., 2022) and the intensification of human activities have increased the vulnerability of ecosystems. The degradation of natural ecosystems not only affects biodiversity but also threatens human sustainable development and ecological security (Zhu et al., 2023; Huang C. et al., 2024). Globally, many regions experience continuous deterioration in water resources, soil, and air quality, making the assessment and protection of EEQ urgent priorities (Reed et al., 2015; Vasseur et al., 2017). Against this backdrop, the scientific community has increasingly recognized the importance of timely assessing the current state of EEQ, revealing its spatiotemporal variation patterns, and exploring the driving mechanisms of ecological changes. However, despite a substantial amount of existing research, there are still many shortcomings in EEQ assessment, particularly in the analysis of causal relationships between EEQ and its influencing factors, which urgently require more in-depth exploration (Geng et al., 2022; Duo et al., 2023). This work is essential in order to develop strategies to protect and restore the environment and to achieve a harmonious relationship between humans and nature.
EEQ assessment is a key topic in both ecological and geographical research. Traditional approaches to EEQ assessment often rely on single indicators or simplistic index systems, such as environmental quality indices and ecological footprints, which fail to fully capture the structure and function of ecosystems (Zhang L. et al., 2022; Sun et al., 2023). These traditional methods struggle to fully reveal complex ecological relationships and to comprehensively assess ecosystems and their dynamic evolution (Wang et al., 2024). Since the 1990s, new tools for large-scale EEQ assessment have been made available through the rapid development of remote sensing technology. To effectively characterise the spatio-temporal patterns of EEQ, Xu et al. introduced the Remote Sensing Ecological Index (RSEI), which is based on remote sensing data and integrates four indicators (Xu et al., 2019). Since then, many scholars have applied the RSEI model in regional EEQ assessments, producing promising results. For example, Liu et al. applied the RSEI model to analyse the spatio-temporal evolution of EEQ in grassland areas in Xinjiang, China, and found that grassland ecological environments showed improving trends with significant spatial differentiation and clustering characteristics (Liu et al., 2023). Similarly, Wan et al. used the RSEI model to evaluate the EEQ of the Yangtze River Economic Belt, revealing regional disparities in EEQ and their driving factors (Wang et al., 2024). Zhang J. et al. (2024) using the RSEI model, analyzed the spatiotemporal patterns of EEQ in the Yellow River Basin, finding a fluctuating improvement in EEQ, with significant regional differences closely related to human activities. These studies indicate that remote sensing data provides higher spatial resolution and temporal continuity for EEQ assessment at both regional and global scales, facilitating dynamic monitoring of ecological changes (Pettorelli et al., 2014; Wu et al., 2021). It also enables more accurate identification of ecological changes and stressors in different regions, offering support for the formulation of regional ecological protection policies.
The formation of the spatiotemporal patterns of EEQ is the result of long-term interactions between natural factors and human activities (Li et al., 2022; Bai et al., 2023). Existing studies show that topography, climate, vegetation, and land use are important factors affecting EEQ (He and Shi, 2022; Lu et al., 2022; Xiao et al., 2022). Zhang X. et al. (2024) found that topographic complexity and vegetation cover are key determinants of EEQ in the Heilongjiang region of China (Li et al., 2021). Demonstrated that temperature and precipitation exert stable effects on production, living spaces, and ecological spaces, and these effects vary spatially. Yu et al. (2023) analysed the impact of land use on EEQ, identifying urban expansion and agricultural development as the main drivers of ecosystem degradation, using a geographically weighted regression model. This series of studies highlights the interactive effects between natural factors and human activities, emphasizing the importance of local differences in influencing EEQ (Shi et al., 2024). Previous research has typically focused on single factors or localized impacts, while in cross-regional and multi-scale comparisons, how to comprehensively consider whether causal relationships exist between different factors and EEQ remains a challenge in current research (Liang L. et al., 2024). However, most studies to date have focused on the individual impacts of natural factors or human activities, or their interactions, while the analysis of the complex interactions and causal mechanisms between these factors remains relatively insufficient (Li et al., 2022; Xiao et al., 2023; Lin et al., 2024). In reality, ecosystems are complex, coupled human-environment systems, characterised by complex interactions and feedbacks between natural factors and human activities (Franzke et al., 2022; Reed et al., 2022; Tan et al., 2023). This understanding has prompted researchers to shift towards more dynamic and systematic analytical frameworks, promoting the application of interdisciplinary methods to gain a more comprehensive understanding of complex ecological relationships and mechanisms of ecological change (Liang L. et al., 2024). Therefore, the analysis of EEQ driving factors must consider both the independent effects of natural and socio-economic factors, as well as their interactions and causal mechanisms.
Although scholars worldwide have made substantial progress in assessing EEQ and its driving mechanisms, several shortcomings still exist. First, most studies focus on the correlation between EEQ and influencing factors, but there is limited exploration of causal relationships (Liang C. et al., 2024). While correlation analysis can reveal the strength and direction of relationships between variables, it cannot determine causal dependencies or pathways of influence (Huang Z. et al., 2024; Li et al., 2024; Tang et al., 2024). Relying solely on correlation analysis makes it difficult to address the root causes of EEQ changes and may lead to biased decision-making in ecological management. Second, many studies rely on traditional statistical models, such as multiple linear regression, which are often based on the assumption of linear relationships between variables. These models often fail to capture the nonlinear relationships and complex interactions between EEQ and its influencing factors (Wang et al., 2015; Ankori-Karlinsky et al., 2024; Ma et al., 2024). In reality, the ecological environment system is a complex nonlinear system characterized by multi-scale interactions and feedback mechanisms among its elements. Traditional linear models cannot accurately reveal the evolutionary patterns and driving mechanisms. Therefore, combining the Geodetector and GCCM models to overcome the limitations of traditional statistical models has become an important trend in current research (Yang S. et al., 2024). These models can more accurately reveal the nonlinear relationships and causal mechanisms between factors, providing more effective tools for future ecological and environmental management.
In order to address these limitations, this study selects Myanmar as the area of study. Based on the quantitative assessment of Myanmar’s EEQ spatiotemporal patterns in 2020, this study applies the Geodetector and GCCM models to systematically analyze the influencing factors of EEQ and their interactions. This study reveals the nonlinear relationships and causal mechanisms between various factors and EEQ. The Geodetector method effectively identifies the interactions between influencing factors, while the GCCM model reveals the nonlinear causal dependencies between variables. A broader and deeper understanding of the spatial differentiation mechanisms of EEQ is gained by combining these two methods.
Myanmar was located on the central southern peninsula, stretching from 92°20′to 101°11′east longitude and 9°58′to 28°31′north latitude (Figure 1). The country had a complex geography with rich ecosystems and extensive biodiversity. Myanmar had a diverse climate, dominated by a tropical monsoon climate with marked seasonal variations in rainfall and temperature. It was important for ecological and environmental protection, agricultural development and climate change research because of its unique geographical location and rich natural resources. However, Myanmar’s environment had been severely degraded by increasing deforestation, air pollution, land degradation and water pollution as a result of accelerated urbanisation and rapid economic development. Therefore, there was an urgent need for a systematic assessment of the quality of Myanmar’s ecological environment and research into the causal relationships behind these environmental problems.
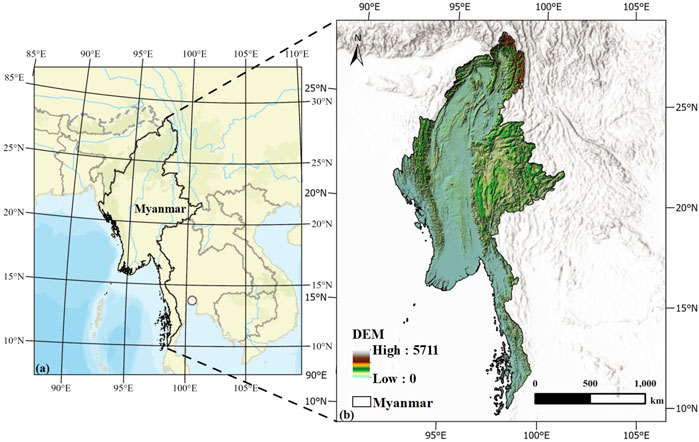
Figure 1. Myanmar study area.
The data used in this study can be divided into two parts, one of which is used to evaluate the EEQ of Myanmar. The relevant data are based on MODIS datasets provided by the United States Geological Survey (USGS), with a spatial resolution of 500 m. These datasets include three types of data from 2020: MOD13A1 (vegetation index products, reflecting vegetation cover), MOD11A2 (land surface temperature products, monitoring temperature variations), and MOD09A1 (surface reflectance products, representing surface spectral characteristics). These datasets were acquired and processed using the Google Earth Engine (GEE) platform, which enables efficient handling of long-term series and large-scale datasets, facilitating the rapid generation of EEQ assessments for Myanmar. The other part of the data focuses on analyzing the driving factors of EEQ changes in Myanmar, encompassing both natural and social factors. These factors include nightlight (X1), temperature (X2), human footprint (X3), population density (X4), precipitation (X5), slope (X6), NPP (X7), land use (X8), GDP (X9), and DEM (X10). Temperature and precipitation data were mainly obtained from the University of East Aaglia (https://crudata.uea.ac.uk); slope, slope direction and elevation data were obtained from Geospatial Data Cloud (https://www.gscloud.cn); NPP data were obtained from the GEE platform MODIS/006/MOD17A3HGF dataset; human footprint data were obtained from the 2020 global human footprint data provided by the Urban Environmental Monitoring and Modelling (UEMM) team of the School of Land Science and Technology, China Agricultural University; nighttime lighting data were obtained from the National Geosystems Science Data Centre (http://nnu.geodata.cn); GDP data were obtained from the Jiandong Chen and other scholars pub. All TIF format data used in the study were resampled with a uniform spatial resolution of 5 km and projected to the GCS_WGS_1984 coordinate system.
In this paper, we constructed an integrated technical framework for spatial and temporal differentiation of EEQ and causal analysis (Figure 2). First, the spatial distribution characteristics of EEQ in Myanmar were quantitatively assessed using the RSEI model by acquiring MODIS image data of the study area in 2020 based on the GEE platform. The local spatial autocorrelation technique has been used to reveal the spatial dependence and clustering pattern of EEQ and to identify the spatial differentiation pattern of EEQ. Then, the intensity of influence and contribution of each factor and their interactions on the spatial and temporal variability of EEQ were quantitatively analysed using the geodetector model for 10 key influencing factors such as climate, topography, vegetation, land use and human activities. Finally, the GCCM model was used to reveal the causal dependence and direction of action between the influencing factors and the EEQ, and to explore the intrinsic driving mechanism of the ecological environment evolution.
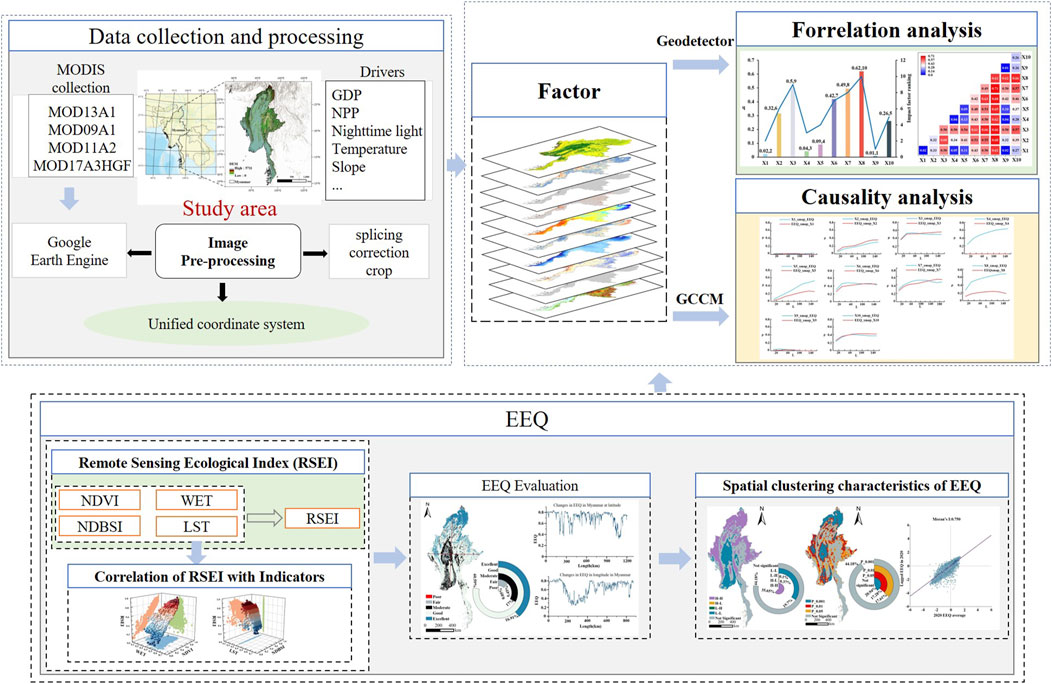
Figure 2. Research framework.
The Remote Sensing Ecological Index (RSEI) was a comprehensive method for evaluating the EEQ, which differed from the traditional ecological index. It coupled four natural indicators, namely, NDVI, WET, LST and NDBSI, through principal component analysis to objectively reflect the EEQ, with the value ranging from 0 to 1, and the larger the value represented the better the EEQ; moreover, the method removed the influence of subjective anthropogenic factors, and it was a kind of objective monitoring and evaluation of the regional EEQ (Xu et al., 2019; Zhou et al., 2024). Among them, two indicators, greenness and dryness, could reflect the land cover changes caused by human activities, and humidity and heat could reveal the response of EEQ to climate change, therefore, by combining these four ecological and natural factors that are closely related to human survival, the strengths and weaknesses of regional EEQ were intuitively reflected (Du et al., 2024). Initially, it was been used as an assessment index for the evaluation of the status of the urban ecological environment and, in the course of its development, it was been widely used in the assessment of the ecological environment.
The Normalised Vegetation Index (NDVI) reflects the vegetation cover in the region and can be used to provide a comprehensive understanding of the spatial distribution of vegetation and vegetation density across the study area from remote sensing data. The formula is calculated as in Equation 1 below:
In the formula:
Moisture can reflect the ecological environment in the soil moisture, through the soil moisture composition characterisation of surface water body conditions, to reflect the degree of EEQ, so it is an important indicator for monitoring the environment, which is inverted by remote sensing tassel cap transformation. The formula is as in Equation 2:
Dryness characterized the dryness of the land and consisted of the normalized building bare soil index and the normalized building index. Calculate the formula as in Equations 3–5:
Heat is represented by surface temperature, which plays an important role in vegetation growth and is also an extremely important part of measuring environmental change, and surface temperature inversion provides insight into the spatial distribution of surface temperature and changes in surface temperature across the region. The formula is calculated as in Equation 6 below:
Local spatial autocorrelation analysis explored the spatial similarities and distribution characteristics of geographic phenomena (Ding et al., 2024). Commonly used metrics were Moran’s I and Local Moran’s I. Local Moran’s I could reveal the degree of autocorrelation between each geographic unit and its neighbouring units, helped to identify agglomeration or discrete patterns, and accurately identified the spatial location and extent of agglomerations, thus revealing spatial heterogeneity. The method consisted mainly of the following steps: firstly, identifying the study area and its geographical units; secondly, calculating the local autocorrelation value of each unit; and finally, identifying areas with significant autocorrelation through the significance test (Ai et al., 2024). This analysis provided a scientific basis for spatial planning and policy-making by providing an in-depth understanding of the structure and distribution of spatial data. The formula is calculated as in Equation 7 below:
In the formula: S is the standard deviation of each individual observation,
The geographically convergent cross-mapping model was a method for the identification of causal relationships and the estimation of causal effects on the basis of spatial cross-sectional data by integrating the theory of dynamical systems and the generalised embedding theory (Gao et al., 2023). Based on dynamical systems theory, if the independent variable X and the dependent variable Y were observed from the same dynamical system and controlled by the same manifold M, then the relationship of one-to-one mapping between Mx and My could be obtained.
In Equations 8–10, s is the spatial unit in which the value of Y is predicted;
The cross-mapping prediction effect is measured by the Pearson’s correlation coefficient ρ between the true observations and the corresponding predicted values with the following formula:
In Equation 11, Cov(Y, Ŷ); Var(Y) is the variance of Y; Var(Ŷ) is the variance of Ŷ.
Geodetector was an exploratory method based on spatial heterogeneity to analyze the impact of driving factors on indicators (Wang and Xu, 2017). This method was based on the similarity in the spatial distribution of independent and dependent variables. The advantage of this method was that it could analyze both categorical and qualitative data and identify interactions between two factors. It was widely used in the study of spatial differentiation of geographic elements. The formula is calculated as in Equation 12 below:
In the formula, q is the size of the influence of the driver factor on the indicator, the value is between 0 and 1, the larger the value, the stronger the influence; N is the sample of the study area; is the variance of the indicator; h is the grading, L is the number of grading strata, h = 1, 2, 3, … , L.
To verify the effectiveness of the RSEI in assessing EEQ, this study analyzed the correlation between the RSEI and its component indices. The principal component analysis (PCA) results indicated that the four principal components for Myanmar in 2020 were 79.08%, 15.93%, 4.95%, and 0.03%, respectively. The first principal component (PC1) had a variance contribution rate of 79.08%, showing that it effectively integrated the information from the four indicators: NDVI, WET, NDBSI, and LST, thus providing a comprehensive reflection of the EEQ. Correlation analysis (Figure 3) further revealed the quantitative relationships between the RSEI and each of the indices. NDVI and WET were found to be significantly positively correlated with the RSEI, while NDBSI and LST were significantly negatively correlated with it. This indicated that indices with positive effects on EEQ (such as vegetation coverage) increased as the RSEI value rose, whereas indices with negative effects (such as built-up land) decreased as the RSEI value rose. The strong correlations between the RSEI and its component indices confirmed the reliability and effectiveness of the RSEI in providing a comprehensive assessment of EEQ.
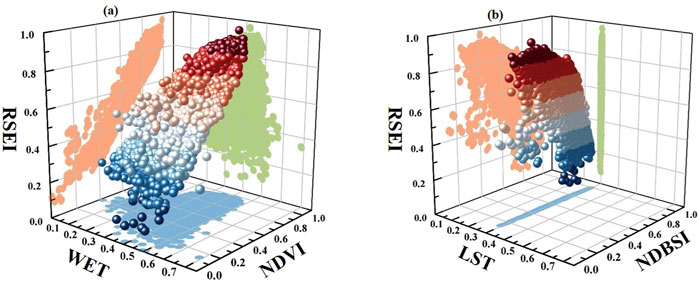
Figure 3. Correlation of components with RSEI. (A) is the correlation between WET and NDVI RSEI, (B) is the correlation between LST and NDBSI RSEI.
To more accurately assess and quantify the spatial distribution characteristics of Myanmar’s EEQ in 2020, the RSEI model was used for evaluation. The EEQ values were divided into five categories with an interval of 0.2: Excellent (0.8–1), Good (0.6–0.8), Moderate (0.4–0.6), Fair (0.2–0.4), and Poor (0–0.2) (Figure 4). The results indicated that Myanmar’s EEQ exhibited significant spatial heterogeneity. Overall, the EEQ was higher in the eastern and western mountainous regions and the northern areas, while it was lower in the central plains and southern coastal regions. The “Excellent” and “Good” categories accounted for 16.91% and 60.05% of the total land area, respectively, while the “Moderate,” “Fair,” and “Poor” categories accounted for 17.00%, 5.45%, and 0.05%, respectively. This suggests that Myanmar’s overall ecological environment was relatively good, with areas of high-quality EEQ significantly larger than those of low-quality EEQ.
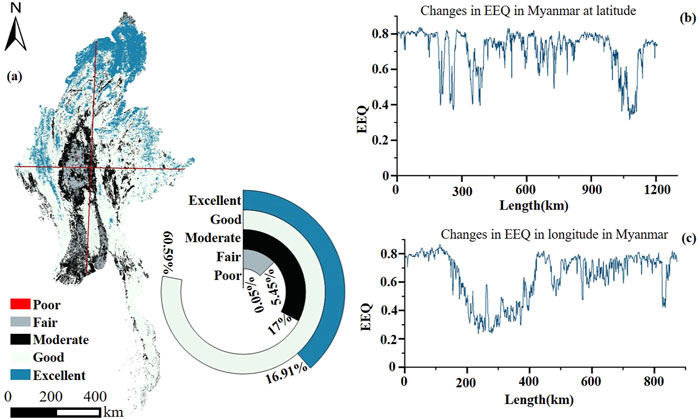
Figure 4. Myanmar EEQ Assessment (A). Spatial distribution of Myanmar EEQ at various levels, (B). Variation of Myanmar EEQs in latitude, (C). Variation of Myanmar EEQs in longitude.
To further explore the spatial variation of EEQ, latitude and longitude profile analyses were conducted. The latitude profile analysis (from north to south) showed a complex fluctuating trend in EEQ. The northern regions generally had higher EEQ values, but two areas with relatively low EEQ are observed at 150–450 km and 1,000–1,100 km from the northern border. These areas might be associated with higher population density and dense industrial and agricultural activities. In contrast, the regions between 600–900 km from the northern border showed relatively stable EEQ values, likely due to less human interference and favorable natural conditions. The longitude profile analysis (from west to east) revealed that the EEQ values in the range of 100–400 km from the western border were relatively low, while those between 0–100 km and 400–900 km maintained higher EEQ levels. The lower EEQ in the central region might be attributed to high population density, frequent human activities, and rapid urban expansion. Conversely, the eastern and western regions, dominated by mountains and plateaus, exhibited higher EEQ, which could be attributed to extensive forest cover, favorable natural conditions, and stable ecosystems.
The spatial clustering characteristics of Myanmar’s EEQ showed significant positive spatial correlation (Moran’s I = 0.75, P < 0.001), indicating a strong clustering trend (Figure 5). Specifically, high-high clusters were mainly distributed in the eastern, western, and northern mountainous regions, accounting for 35.65% of the total land area, while low-low clusters are primarily concentrated in the central plains and southern coastal areas, covering 19.70% of the total land area. Additionally, at the 0.001 significance level, 44.18% of the area exhibited spatial autocorrelation; at the 0.01 significance level, 17.61% of the area showed spatial autocorrelation; and at the 0.05 significance level, 17.28% of the area demonstrated spatial autocorrelation. This indicates that the spatial clustering pattern of Myanmar’s EEQ was statistically significant. High clustering areas were mainly located in the complex terrain regions of the eastern, western, and northern parts of Myanmar, where forest cover was high. These regions were subject to minimal human disturbance, which helped maintain ecological stability. In contrast, low clustering areas were concentrated in the central plains and southern coastal regions, where human activities were more frequent, and the areas were heavily influenced by agricultural expansion and urbanization. These regions have sparse vegetation and fragile ecosystems, leading to lower EEQ values.
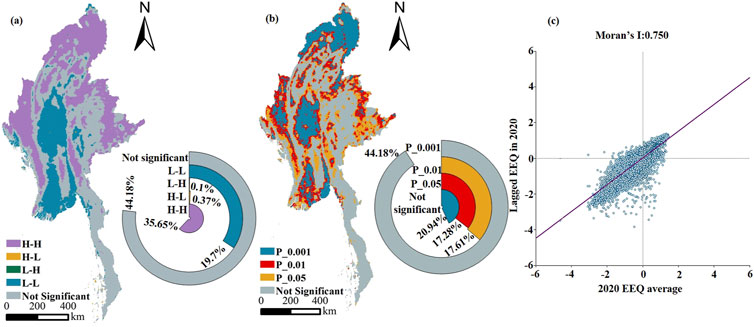
Figure 5. Myanmar EEQ spatial clustering characteristics (A). Myanmar EEQ various spatial clusters and their share, (B). Myanmar EEQ clustering characteristics significance, (C). Myanmar EEQ clustering characteristics scatter plot.
The study used the Geodetector model to analyse the correlation and interaction between these factors in order to quantitatively assess the impact of various factors on Myanmar’s EEQ (Figure 6). The results showed that the explanatory power of the different factors differed significantly from each other. X8 (q = 0.62), X3 (q = 0.50), X7 (q = 0.49), and X6 (q = 0.42) were identified as the dominant factors influencing Myanmar’s EEQ, with q-values all greater than 0.40. X2 (q = 0.32) and X10 (q = 0.26) also demonstrated some explanatory power, whereas X5 (q = 0.09), X4 (q = 0.04), X1 (q = 0.02), and X9 (q = 0.01) had relatively weaker influences. This suggests that land use, human footprint, NPP, and slope are the key drivers of the spatial and temporal variations in Myanmar’s EEQ.
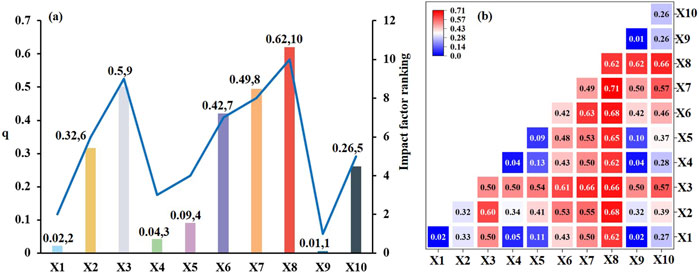
Figure 6. Influences affecting EEQ in Myanmar (A). Contribution, ranking of influences, (B). Interactions.
Additionally, the Geodetector analysis revealed significant interactions between the influencing factors. X2∩X3 (q = 0.60), X6∩X3 (q = 0.61), X7∩X3 (q = 0.66), X8∩X7 (q = 0.71), X8∩X3 (q = 0.71), and X10∩X3 (q = 0.61) exhibited notable bivariate enhancement effects, indicating synergistic effects between these factors that jointly influence EEQ. On the other hand, X2∩X5 (q = 0.41) and X5∩X10 (q = 0.37) showed significant nonlinear enhancement effects, uncovering potential interactive influences of climate and topography on the ecological environment. These findings from the Geodetector model highlight the complex driving mechanisms behind the changes in Myanmar’s EEQ, revealing significant correlations and interactions between natural and socio-economic factors.
To further investigate the causal relationships between EEQ and its influencing factors, the study employed the GCCM model for causal inference and estimation of causal strength (Figure 7). The results showed significant causal relationships between EEQ and factors such as X10 (ρ = 0.43, P < 0.001), X7 (ρ = 0.54, P < 0.001), X6 (ρ = 0.46, P < 0.001), and X3 (ρ = 0.56, P < 0.001), with causal strength (ρ) values exceeding 0.40. These findings suggested that these factors were the key drivers of changes in Myanmar’s EEQ. Additionally, X2 (ρ = 0.30, P < 0.001), X5 (ρ = 0.26, P < 0.001), and X8 (ρ = 0.23, P < 0.001) also showed some causal relationships with EEQ, with ρ values ranging between 0.20 and 0.30. However, X9 (ρ = 0.02, P < 0.001), X1 (ρ = 0.20, P < 0.001), and X4 (ρ = 0.00, P > 0.05) exhibited weak or insignificant causal relationships with EEQ.
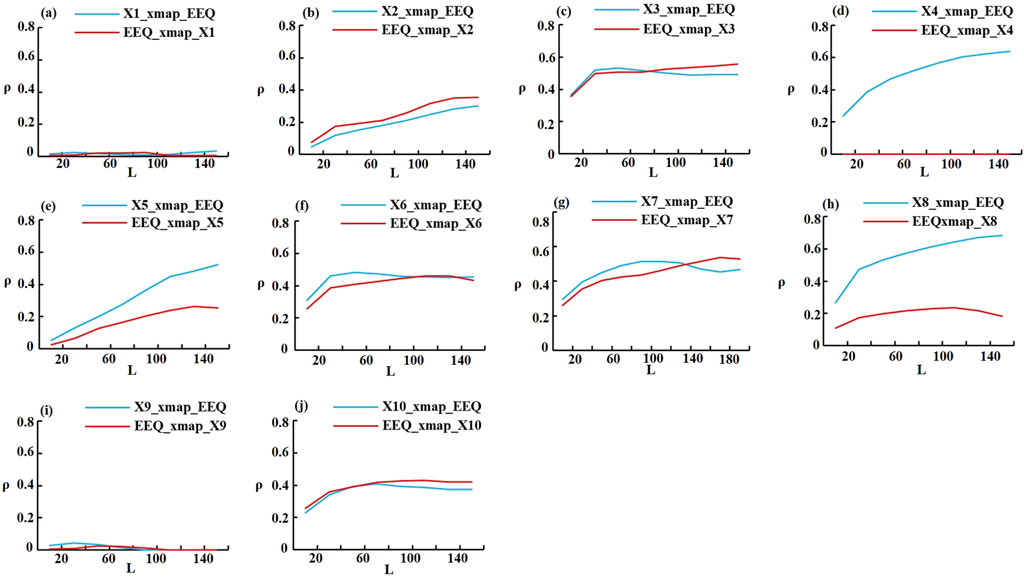
Figure 7. Causal relationship between influencing factors and EEQ. (A–J represent the causal relationship between influences X1∼X10 and EEQ).
Overall, factors such as DEM, slope, NPP, and human footprint were identified as the primary drivers influencing Myanmar’s EEQ, with significant causal relationships. Temperature, precipitation, and land use also had some causal effects on EEQ, but their impact strength was relatively weaker. Meanwhile, socio-economic factors (X9 and X4) showed either weak causal links or no direct causal relationships with EEQ. The causal relationships revealed by the GCCM model corroborated the findings from the Geodetector analysis, highlighting the crucial roles of both natural environmental factors and human activities in shaping the spatiotemporal patterns of Myanmar’s EEQ.
This study, based on the RSEI model, quantitatively assesses Myanmar’s EEQ in 2020, revealing its spatial differentiation characteristics and clustering patterns. The results show that Myanmar’s overall EEQ is relatively good but exhibits significant spatial heterogeneity. The EEQ is higher in the eastern, western, and northern mountainous areas, while it is lower in the central plains and southern coastal regions. This spatial differentiation pattern is closely related to the region’s natural geographic conditions and the intensity of human activities. The EEQ differences across regions reflect the spatial imbalance of natural resource endowments and socioeconomic development levels. Specifically, the complex terrain and good vegetation cover in mountainous areas provide a superior ecological background, whereas the intense agricultural development and urbanization processes in the plains and coastal areas lead to environmental degradation. This differential distribution is closely related to the terrain, vegetation coverage, population distribution, and socioeconomic development levels of different regions. Wang et al. (2022) research in northern Anhui finds that areas with higher terrain complexity and vegetation cover tend to have better EEQ. Zhang Y. et al. (2022) demonstrated in metropolitan areas demonstrates that regions with higher population density, higher levels of urbanization, and stronger economic development typically exhibited lower EEQ due to the intensity of human activities. Similarly, Hui et al. found in their study of Hunan that natural conditions were extremely important factors influencing EEQ, while human activities were the primary drivers of its degradation (Hui and Cheng, 2024). These findings align with the results of this study, demonstrating that both natural geographic features and human activities jointly shape the spatial pattern of regional EEQ. Additionally, Liao used an improved RSEI with information granulation to assess the spatiotemporal changes of EEQ in the ASEAN countries from 2000 to 2021 (Liao, 2022). The results showed that the overall EEQ was relatively good, with 40.36% of the areas being in a good condition, and the areas with extremely poor or extremely good EEQ were relatively small. Similarly, Jin et al. monitored the EEQ of coastal East Asia and Southeast Asia using the Continuous Remote Sensing Ecological Index (CRSEI) (Jin et al., 2023). They found that the overall EEQ remained stable, with the EEQ in Myanmar’s coastal regions staying relatively stable, while the EEQ of some Southeast Asian countries, especially the continental coasts of Vietnam and Cambodia, had significantly declined. The findings of these studies are both similar and different to those of this research. The similarity lies in the overall good EEQ, with some coastal areas having relatively poor EEQ, and the areas with extremely poor or poor EEQ occupying a smaller proportion. The difference, however, is that the proportion of areas with extremely good EEQ in Myanmar is relatively high.
Spatial autocorrelation analysis further reveals the spatial dependence characteristics of Myanmar’s EEQ. Local spatial autocorrelation analysis not only identifies the spatial clustering trend of EEQ but also identifies the high-high and low-low clustering areas, corresponding to regions with relatively good and poor EEQ, respectively. The high-high clustering pattern is found to be concentrated in the eastern, western, and northern mountainous areas, while the low-low clustering pattern is concentrated in the central plains and southern coastal areas. This spatial clustering pattern reflects, on the one hand, the controlling effect of stable natural environments on EEQ and, on the other hand, shows that similar natural conditions and human activity intensity lead to convergence in the EEQ of adjacent regions. Xiong et al. (2021) pointed out that the spatial autocorrelation of EEQ reflected the spatial spillover effects of ecosystem services, with high-quality ecological environments typically concentrated in regions with superior natural environments and less human interference, while low-quality environments were commonly found in areas of frequent human activity. Zhang et al. (2023) also found in their study of northeastern China that regions with high and low EEQ exhibited significant spatial clustering, closely related to regional development imbalances. Therefore, the spatial pattern of EEQ is not only determined by local natural conditions and human activities but is also significantly influenced by surrounding areas. This highlights the importance of considering spatial relationships and differences when formulating ecological protection and restoration policies and suggests that tailored ecological management measures should be implemented based on local conditions.
Overall, the RSEI model effectively assesses and characterizes regional EEQ, and through local spatial autocorrelation analysis, provides empirical support for a deeper understanding of the interaction between human activities and the natural environment in Myanmar’s spatiotemporal patterns.
The results from the Geodetector and GCCM models indicate that land use, human footprint, NPP, and slope are the dominant factors influencing the spatial pattern of EEQ in Myanmar. Factors such as temperature, precipitation, and land use patterns also have some influence, while socioeconomic factors like population density, nighttime light, and GDP show a relatively weak relationship with EEQ. These findings are similar to the study conducted by Xu et al. in China, which highlighted the significant impact of terrain complexity and vegetation cover on EEQ, followed by the intensity of human activities and land use patterns (Xin et al., 2014). Similarly, Zhao et al. found in their research on northeast China that natural factors (terrain, climate, and vegetation) primarily determined the spatial differentiation of EEQ, while human factors (land use and urbanization levels) had a relatively smaller impact (Zhao et al., 2025). These studies suggest that the spatiotemporal patterns of EEQ exhibit certain universality across regions, though the relative importance of influencing factors may vary based on regional natural endowments and human activity characteristics.
It is noteworthy that the Geodetector analysis revealed significant interactions among the driving factors of EEQ, indicating that these factors do not operate independently but are interrelated and mutually constrained. This aligns with the complexity and nonlinearity of ecosystems. Some studies have shown that natural elements such as terrain, climate, vegetation, and soil exhibit intricate interactions and feedback mechanisms that collectively affect ecosystem structure and function. Simultaneously, human activities, through changes in land use, resource exploitation, and environmental pollution, directly or indirectly influence natural ecological processes, thus affecting EEQ. This finding is similar to Waseem et al.'s study, which found that urban expansion degraded natural vegetation, affecting local microclimates and hydrological processes, ultimately reducing EEQ (Waseem et al., 2021). At the same time, the study by Li et al. is similar, as they found that urban expansion led to the degradation of natural vegetation, which affected local microclimates and hydrological processes, ultimately reducing EEQ (Li et al., 2013). Additionally, Yu et al. emphasized in their study in Beijing, China, that urban expansion is one of the main causes of many ecological and environmental issues in urban and surrounding areas, pointing out the complex interactions between socioeconomic factors and natural factors (Yu et al., 2023).
The causal relationships revealed by the GCCM model further validate the results of the Geodetector analysis, confirming that terrain (elevation, slope), NPP, and human activities are key factors driving the spatial pattern of EEQ in Myanmar, while temperature, precipitation, and land use show strong causal relationships with EEQ. This finding is supported by Guo et al. based on the GCCM model, which identified vegetation cover, climate, and GDP as key factors driving regional ecological changes. The causal relationships between population density, NPP, and ecosystem health are found to be weaker (Guo et al., 2024). Similar to this finding, Yang et al. also reached a similar conclusion in their study on ecosystem services, stating that vegetation cover, climate, and GDP are key drivers of regional ecological changes, while the causal relationships between population density, net primary productivity, and ecosystem health are relatively weak (Yang Y. et al., 2024).
Additionally, the study finds that correlation analysis and causal analysis reveal different aspects of the human-environment relationship. Correlation analysis focuses on describing the strength and direction of the relationship between variables but cannot determine causality. Causal analysis, on the other hand, identifies the causal dependencies and direction of influence between variables, though it is somewhat limited in depicting the interactions and feedback effects within complex systems. Therefore, combining correlation and causal analyses, while considering the complexity and nonlinearity of human-environment systems, is crucial for understanding the mechanisms behind the formation of EEQ. In future studies, there is a need to expand the applicability of causal inference models like GCCM, enhancing their ability to represent complex interactions and feedback effects. Furthermore, the integration of data-driven analysis with mechanistic models should be strengthened to simulate the dynamic evolution of human-environment systems at multiple spatiotemporal scales, more comprehensively revealing the mechanisms and driving processes behind the spatiotemporal patterns of EEQ.
The spatial differentiation patterns and driving mechanisms of Myanmar’s EEQ provide important scientific evidence for regional ecological management. Targeted ecological protection and restoration strategies should be developed for areas with different EEQ levels. In regions with “Excellent” and “Good” EEQ, such as the eastern, western, and northern mountainous areas, ecological protection should be prioritized, with strict restrictions on human activities to maintain a strong natural ecological baseline. In contrast, for areas with “Poor” and “Very Poor” EEQ, such as the central plains and southern coastal regions, ecological restoration should be carried out through measures such as adjusting land use structure, increasing vegetation cover, controlling pollution, and improving the stability and resilience of ecosystems. For areas with “Moderate” EEQ, regional coordination should be strengthened, with a focus on protecting native vegetation, increasing plant cover, and prioritizing ecological restoration to maintain ecosystem integrity. Additionally, the interactions between various influencing factors and regional differences should be fully considered. For example, in areas with complex terrain and rich vegetation, the protection of native vegetation and the maintenance of ecosystem integrity should be prioritized. In densely populated and highly developed areas, land use management should be strengthened, with strict adherence to ecological red-line policies, aiming to improve land use efficiency. Furthermore, ecological protection and socio-economic development are not mutually exclusive, but rather complementary and mutually reinforcing. A healthy ecological environment is the foundation for sustainable socio-economic development, while the green transformation of the economy helps improve environmental and economic quality. Therefore, while promoting ecological civilization construction, Myanmar should also accelerate economic structural adjustment, vigorously develop green industries, adopt clean production technologies, and implement energy-saving and emission-reduction technologies. By exploring mechanisms for realizing the value of ecological products, a win-win outcome for both environmental protection and socio-economic development can be achieved.
This study establishes a comprehensive technical framework for spatial differentiation and attribution analysis of EEQ. Based on revealing the spatial pattern of EEQ, it further explores the interactive effects and causal mechanisms of natural and socio-economic factors on EEQ, providing a new perspective for the study of human-environment interactions. This comprehensive framework is not only applicable to exploring EEQ in Myanmar or a specific region, but can also be extended to other countries and regions to study the spatial patterns of EEQ in these areas, uncovering the interactions and causal relationships between factors influencing EEQ, and gaining a deeper understanding of their driving mechanisms. Furthermore, although this study innovatively combines the Geodetector model and the GCCM model to quantitatively express the interactions and causal relationships between the factors influencing EEQ, thereby overcoming the limitations of traditional statistical models and effectively identifying non-linear relationships and complex interactions among variables, some limitations still exist.
Firstly, this study only evaluates the EEQ of Myanmar for the year 2020 and analyzes its driving mechanisms, without conducting a comprehensive analysis over a longer time scale. The study lacks an investigation into temporal changes. Secondly, the interactions and feedback mechanisms within ecosystems are highly complex. In this study, only 10 key factors, such as topography, climate, vegetation, land use, and human activities, were selected. However, this does not mean that other factors do not affect EEQ. Additionally, although this study innovatively combines the Geodetector model with the GCCM model, the Geodetector model can only analyze the interactions between two factors and cannot assess the interactions among multiple factors. Therefore, future research could extend across multiple temporal and spatial scales, incorporate multi-source data, and use interdisciplinary methods. Further inclusion of more natural and socio-economic factors would help explore long-term changes in EEQ and their driving mechanisms, thus enhancing the applicability of this framework. Furthermore, future studies could consider using more advanced statistical methods, machine learning models, or improving existing models to enhance the accuracy of EEQ assessments and further explore the interactions and causal relationships between influencing factors and EEQ. Improving the accuracy and reliability of EEQ evaluation and prediction would provide more comprehensive and reliable decision-making support for regional sustainable development.
This study focuses on Myanmar as the research area and constructs a comprehensive technical framework for EEQ assessment, using the RSEI model, spatial autocorrelation, geographic detector, and GCCM model, as well as the quantitative expression of multi-factor interactions and causal relationships. This framework is applied to analyze the spatial differentiation of EEQ and its driving factors. The main conclusions of the study can be summarized as follows.
1) The distribution of EEQ exhibits significant spatial heterogeneity and regional differences. Areas with intensive human activity have poorer EEQ, while regions with complex terrain and higher vegetation cover have better EEQ.
2) EEQ exhibits spatial dependence and significant geographic regionality. High-quality areas are concentrated in regions with complex terrain and good vegetation, while low-quality areas are located in regions with frequent human activity.
3) DEM, slope, NPP, land use, and human footprint are the key drivers of spatial differentiation in EEQ. Significant interactions exist between these factors, revealing the complex mechanisms driving ecological and environmental changes, emphasizing the importance of comprehensively analyzing the interrelationships of various driving factors.
4) DEM, slope, NPP, and human footprint have significant causal effects on EEQ, indicating that both natural and socio-economic factors have a significant impact on EEQ.
In conclusion, this study proposes a comprehensive technical framework for analyzing the spatial differentiation of EEQ and its causal mechanisms, expanding traditional ecological environment assessment methods. The framework allows for the quantitative expression of multi-factor interactions and causal relationships, thereby broadening the research paradigm of human-environment interactions.
The raw data supporting the conclusions of this article will be made available by the authors, without undue reservation.
SS: Conceptualization, Data curation, Methodology, Visualization, Writing–original draft, Writing–review and editing. SP: Conceptualization, Writing–review and editing. ZL: Investigation, Writing–review and editing. BH: Data curation, Writing–original draft. DM: Supervision, Writing–original draft. ZZ: Formal Analysis, Writing–original draft. YZ: Formal Analysis, Writing–original draft. RZ: Visualization, Writing–review and editing. TL: Resources, Writing–review and editing.
The author(s) declare that financial support was received for the research, authorship, and/or publication of this article. The National Natural Science Foundation of China (42261073, 41971369), Yunnan Province Reserve Talent Program for Young and Middle-aged Academic and Technical Leaders (202305AC160083, 202205AC160014), Major Scientific and Technological Projects of Yunnan Province (No: 202202AD080010), Yunnan Provincial Basic Research Project (202401AT070103, 202201AS070024, 202001AS070032).
The authors declare that the research was conducted in the absence of any commercial or financial relationships that could be construed as a potential conflict of interest.
The author(s) declare that no Generative AI was used in the creation of this manuscript.
All claims expressed in this article are solely those of the authors and do not necessarily represent those of their affiliated organizations, or those of the publisher, the editors and the reviewers. Any product that may be evaluated in this article, or claim that may be made by its manufacturer, is not guaranteed or endorsed by the publisher.
Ai, M., Chen, X., and Yu, Q. (2024). Spatial correlation analysis between human disturbance intensity (HDI) and ecosystem services value (ESV) in the Chengdu-Chongqing urban agglomeration. Ecol. Indic. 158, 111555. doi:10.1016/j.ecolind.2024.111555
Ankori-Karlinsky, R., Hall, J., Murphy, L., Muscarella, R., Martinuzzi, S., Fahey, R., et al. (2024). Chronic winds reduce tropical forest structural complexity regardless of climate, topography, or forest age. Ecosystems 27, 479–491. doi:10.1007/s10021-024-00900-5
Bai, T., Cheng, J., Zheng, Z., Zhang, Q., Li, Z., and Xu, D. (2023). Drivers of eco-environmental quality in China from 2000 to 2017. J. Clean. Prod. 396, 136408. doi:10.1016/j.jclepro.2023.136408
Ding, Y., Wang, H., Liu, Y., Chai, B., and Bin, C. (2024). The spatial overlay effect of urban waterlogging risk and land use value. Sci. Total Environ. 947, 174290. doi:10.1016/j.scitotenv.2024.174290
Du, Z., Ji, X., Liu, J., Zhao, W., He, Z., Jiang, J., et al. (2024). Ecological health assessment of Tibetan alpine grasslands in Gannan using remote sensed ecological indicators. Geo-spatial Inf. Sci., 1–19. doi:10.1080/10095020.2024.2311862
Duo, L., Wang, J., Zhang, F., Xia, Y., Xiao, S., and He, B.-J. (2023). Assessing the spatiotemporal evolution and drivers of ecological environment quality using an enhanced remote sensing ecological index in lanzhou city, China. Remote Sens. 15 (19), 4704. doi:10.3390/rs15194704
Franzke, C. L., Ciullo, A., Gilmore, E. A., Matias, D. M., Nagabhatla, N., Orlov, A., et al. (2022). Perspectives on tipping points in integrated models of the natural and human Earth system: cascading effects and telecoupling. Environ. Res. Lett. 17 (1), 015004. doi:10.1088/1748-9326/ac42fd
Gao, B., Yang, J., Chen, Z., Sugihara, G., Li, M., Stein, A., et al. (2023). Causal inference from cross-sectional earth system data with geographical convergent cross mapping. Nat. Commun. 14, 5875. doi:10.1038/s41467-023-41619-6
Geng, J., Yu, K., Xie, Z., Zhao, G., Ai, J., Yang, L., et al. (2022). Analysis of spatiotemporal variation and drivers of ecological quality in Fuzhou based on RSEI. Remote Sens. 14 (19), 4900. doi:10.3390/rs14194900
Guo, J., Wei, X., Zhang, F., Cai, J., and Ding, Y. (2024). Remote sensing assessment of ecosystem health and its key driving factors: a case study of the urban agglomeration in the Middle reaches of the Yangtze River. Environ. Sci., 1–15. doi:10.13227/j.hjkx.202406285
He, J., and Shi, X. (2022). Detection of social-ecological drivers and impact thresholds of ecological degradation and ecological restoration in the last three decades. J. Environ. Manag. 318, 115513. doi:10.1016/j.jenvman.2022.115513
Huang, C., Cheng, J., Liu, S., Wan, Y., Zhou, J., Liu, Z., et al. (2024a). Impacts of landscape dynamics on terrestrial ecosystem health in the Three Gorges Reservoir Area, China. J. Clean. Prod. 467, 142928. doi:10.1016/j.jclepro.2024.142928
Huang, Z., Li, S., Peng, J., Ma, X., Ding, H., Cheng, F., et al. (2024b). Assessing ecosystem service dynamics and drivers for sustainable management in the Agro-pastoral ecotone of northern China: a spatiotemporal analysis. Ecol. Indic. 165, 112213. doi:10.1016/j.ecolind.2024.112213
Hui, J., and Cheng, Y. (2024). Evolution and spatiotemporal response of ecological environment quality to human activities and climate: case study of hunan province, China. Remote Sens. 16 (13), 2380. doi:10.3390/rs16132380
Jin, W., Li, H., Wang, J., Zhao, L., Li, X., Fan, W., et al. (2023). Continuous remote sensing ecological index (CRSEI): a novel approach for multitemporal monitoring of eco-environmental changes on large scale. Ecol. Indic. 154, 110739. doi:10.1016/j.ecolind.2023.110739
Li, J., Sun, W., Li, M., and Meng, L. (2021). Coupling coordination degree of production, living and ecological spaces and its influencing factors in the Yellow River Basin. J. Clean. Prod. 298, 126803. doi:10.1016/j.jclepro.2021.126803
Li, S., Qu, S., Zhang, G., Zhou, Y., Sun, X., Li, J., et al. (2024). Spatiotemporal pattern and drivers of ecological quality in inner Mongolia. Land 13 (5), 568. doi:10.3390/land13050568
Li, W., Wang, L., Yang, X., Liang, T., Zhang, Q., Liao, X., et al. (2022). Interactive influences of meteorological and socioeconomic factors on ecosystem service values in a river basin with different geomorphic features. Sci. Total Environ. 829, 154595. doi:10.1016/j.scitotenv.2022.154595
Li, X., Zhou, W., and Ouyang, Z. (2013). Forty years of urban expansion in Beijing: what is the relative importance of physical, socioeconomic, and neighborhood factors? Appl. Geogr. 38, 1–10. doi:10.1016/j.apgeog.2012.11.004
Liang, C., Zhang, M., Wang, Z., Xiang, X., Gong, H., Wang, K., et al. (2024). The strengthened impact of water availability at interannual and decadal time scales on vegetation GPP. Glob. Change Biol. 30 (1), e17138. doi:10.1111/gcb.17138
Liang, L., Song, Y., Shao, Z., Zheng, C., Liu, X., and Li, Y. (2024). Exploring the causal relationships and pathways between ecological environmental quality and influencing Factors: a comprehensive analysis. Ecol. Indic. 165, 112192. doi:10.1016/j.ecolind.2024.112192
Liao, W. (2022). Temporal and spatial variations of eco-environment in Association of Southeast Asian Nations from 2000 to 2021 based on information granulation. J. Clean. Prod. 373, 133890. doi:10.1016/j.jclepro.2022.133890
Lin, Y., Zhang, X., Zhu, H., and Li, R. (2024). Spatiotemporal evolution and mechanisms of habitat quality in nature Reserve land: a case study of 18 nature reserves in hubei province. Land 13 (3), 363. doi:10.3390/land13030363
Liu, Y., Peng, J., Li, G., Han, W., Liu, L., Guan, J., et al. (2023). Eco-environmental assessment of kurustai grassland based on Google earth engine. Chin. J. Ecol. 42 (11), 2776–2785. doi:10.13292/j.1000-4890.202311.010
Lu, D., Wang, Y., Yang, Q., Wang, Z., Lin, A., Tang, Y., et al. (2022). Effects of population spatial redistribution on vegetation greenness: a case study of Chongqing, China. Ecol. Indic. 138, 108803. doi:10.1016/j.ecolind.2022.108803
Ma, J., Shen, Z., Jiang, Y., Liu, P., Sun, J., Li, M., et al. (2024). Potential ecological risk assessment for trace metal (loid) s in soil surrounding coal gangue heaps based on source-oriented. Sci. Total Environ. 954, 176465. doi:10.1016/j.scitotenv.2024.176465
Pettorelli, N., Laurance, W. F., O'brien, T. G., Wegmann, M., Nagendra, H., and Turner, W. (2014). Satellite remote sensing for applied ecologists: opportunities and challenges. J. Appl. Ecol. 51 (4), 839–848. doi:10.1111/1365-2664.12261
Reed, M. S., Stringer, L., Dougill, A., Perkins, J., Atlhopheng, J., Mulale, K., et al. (2015). Reorienting land degradation towards sustainable land management: linking sustainable livelihoods with ecosystem services in rangeland systems. J. Environ. Manag. 151, 472–485. doi:10.1016/j.jenvman.2014.11.010
Reed, P., Hadjimichael, A., Moss, R., Brelsford, C., Burleyson, C., Cohen, S., et al. (2022). Multisector dynamics: advancing the science of complex adaptive human-earth systems. Earths Future 10, e2021EF002621. doi:10.1029/2021ef002621
Shi, S., Peng, S., Lin, Z., Zhu, Z., Ma, D., Yin, Y., et al. (2024). Analysis of ecological environment quality heterogeneity across different landform types in Myanmar and its driving forces. Ecol. Indic. 168, 112755. doi:10.1016/j.ecolind.2024.112755
Sun, J., Hu, Y., Li, Y., Weng, L., Bai, H., Meng, F., et al. (2023). A temporospatial assessment of environmental quality in urbanizing Ethiopia. J. Environ. Manag. 332, 117431. doi:10.1016/j.jenvman.2023.117431
Tan, J., Duan, Q., Xiao, C., He, C., and Yan, X. (2023). A brief review of the coupled human-Earth system modeling: current state and challenges. Anthropocene Rev. 10 (3), 664–684. doi:10.1177/20530196221149121
Tang, Q., Hua, L., Tang, J., Jiang, L., Wang, Q., Cao, Y., et al. (2024). Advancing ecological quality assessment in China: introducing the ARSEI and identifying key regional drivers. Ecol. Indic. 163, 112109. doi:10.1016/j.ecolind.2024.112109
Vasseur, L., Horning, D., Thornbush, M., Cohen-Shacham, E., Andrade, A., Barrow, E., et al. (2017). Complex problems and unchallenged solutions: bringing ecosystem governance to the forefront of the UN sustainable development goals. Ambio 46, 731–742. doi:10.1007/s13280-017-0918-6
Wang, J., Wang, T., Skidmore, A. K., Shi, T., and Wu, G. (2015). Evaluating different methods for grass nutrient estimation from canopy hyperspectral reflectance. Remote Sens. 7 (5), 5901–5917. doi:10.3390/rs70505901
Wang, J., and Xu, C. (2017). Geodetector: principle and prospective. Acta Geogr. Sin. 72 (1). doi:10.11821/dlxb201701010
Wang, R., Wang, L., Dai, W., Cao, Q., and Niiu, Z. (2024). Spatial–temporal evolution and driving force analysis of eco-quality in Yangtze River Basin. Resour. Environ. Yangtze Basin, 1–17.
Wang, X., Yao, X., Jiang, C., and Duan, W. (2022). Dynamic monitoring and analysis of factors influencing ecological environment quality in northern Anhui, China, based on the Google Earth Engine. Sci. Rep. 12 (1), 20307. doi:10.1038/s41598-022-24413-0
Waseem, L. A., Khokhar, M. a. H., Naqvi, S. a. A., Hussain, D., Javed, Z. H., and Awan, H. B. H. (2021). Influence of urban sprawl on microclimate of abbottabad, Pakistan. Land 10 (2), 95. doi:10.3390/land10020095
Wilkes, L. N., Barner, A. K., Keyes, A. A., Morton, D., Byrnes, J. E., and Dee, L. E. (2024). Quantifying co-extinctions and ecosystem service vulnerability in coastal ecosystems experiencing climate warming. Glob. Change Biol. 30 (7), e17422. doi:10.1111/gcb.17422
Wu, P., Yin, Z., Zeng, C., Duan, S.-B., Göttsche, F.-M., Ma, X., et al. (2021). Spatially continuous and high-resolution land surface temperature product generation: a review of reconstruction and spatiotemporal fusion techniques. IEEE Geoscience Remote Sens. Mag. 9 (3), 112–137. doi:10.1109/mgrs.2021.3050782
Xiao, J., Song, F., Su, F., Song, S., and Wei, C. (2023). Exploring the interaction mechanism of natural conditions and human activities on wetland ecosystem services value. J. Clean. Prod. 426, 139161. doi:10.1016/j.jclepro.2023.139161
Xiao, Z., Liu, R., Gao, Y., Yang, Q., and Chen, J. (2022). Spatiotemporal variation characteristics of ecosystem health and its driving mechanism in the mountains of southwest China. J. Clean. Prod. 345, 131138. doi:10.1016/j.jclepro.2022.131138
Xin, Z., Xiao, Y., Wang, D., Li, Y., Ren, Y., and Li, Q. (2014). Spatial patterns of riparian vegetations and its optimization in Lijiang River: an intensive tourism karsts river in the southern subtropical China. Ecol. Sci. 33, 631–641. doi:10.14108/j.cnki.1008-8873.2014.04.002
Xiong, Y., Xu, W., Lu, N., Huang, S., Wu, C., Wang, L., et al. (2021). Assessment of spatial–temporal changes of ecological environment quality based on RSEI and GEE: a case study in Erhai Lake Basin, Yunnan province, China. Ecol. Indic. 125, 107518. doi:10.1016/j.ecolind.2021.107518
Xu, H., Wang, Y., Guan, H., Shi, T., and Hu, X. (2019). Detecting ecological changes with a remote sensing based ecological index (RSEI) produced time series and change vector analysis. Remote Sens. 11 (20), 2345. doi:10.3390/rs11202345
Yang, S., Peng, S., Li, X., Wei, X., Pan, Y., and Jiao, Y. (2024a). Spatial heterogeneity and interacting intensity of drivers for trade-offs and synergies between carbon sequestration and biodiversity. Glob. Ecol. Conservation 56, e03256. doi:10.1016/j.gecco.2024.e03256
Yang, Y., Yuan, X., An, J., Su, Q., and Chen, B. (2024b). Drivers of ecosystem services and their trade-offs and synergies in different land use policy zones of Shaanxi Province, China. J. Clean. Prod. 452, 142077. doi:10.1016/j.jclepro.2024.142077
Yang, Z., Zhan, J., Wang, C., and Twumasi-Ankrah, M. J. (2022). Coupling coordination analysis and spatiotemporal heterogeneity between sustainable development and ecosystem services in Shanxi Province, China. Sci. Total Environ. 836, 155625. doi:10.1016/j.scitotenv.2022.155625
Yu, P., Zhang, S., Yung, E. H., Chan, E. H., Luan, B., and Chen, Y. (2023). On the urban compactness to ecosystem services in a rapidly urbanising metropolitan area: highlighting scale effects and spatial non–stationary. Environ. Impact Assess. Rev. 98, 106975. doi:10.1016/j.eiar.2022.106975
Zhang, J., Gu, Y., Shen, J., Zhang, M., Cong, M., Sun, Y., et al. (2024a). Analysis of spatiotemporal changes and driving factors of ecological environment quality in the Yellow River Basin. Environ. Sci., 1–23. doi:10.13227/j.hjkx.202401141
Zhang, L., Wang, X. C., Dzakpasu, M., Cao, T., Zhang, H., Liu, Y., et al. (2022a). Integrated environmental influences quantification of pilot-scale constructed wetlands based on modified ecological footprint assessment. Sci. Total Environ. 843, 157039. doi:10.1016/j.scitotenv.2022.157039
Zhang, X., Jia, W., and He, J. (2023). Spatial and temporal variation of ecological quality in northeastern China and analysis of influencing factors. J. Clean. Prod. 423, 138650. doi:10.1016/j.jclepro.2023.138650
Zhang, X., Jia, W., Lu, S., and He, J. (2024b). Ecological assessment and driver analysis of high vegetation cover areas based on new remote sensing index. Ecol. Inf. 82, 102786. doi:10.1016/j.ecoinf.2024.102786
Zhang, Y., She, J., Long, X., and Zhang, M. (2022b). Spatio-temporal evolution and driving factors of eco-environmental quality based on RSEI in Chang-Zhu-Tan metropolitan circle, central China. Ecol. Indic. 144, 109436. doi:10.1016/j.ecolind.2022.109436
Zhao, X., Li, Y., Tan, S., Liu, L., and Liu, F. (2025). Analyse of spatial and temporal evolution patterns and driving forces of ecological environment quality in Chengdu-Chongqing Economic Circle. Acta Ecol. Sin. (01), 1–15. doi:10.20103/j.stxb.202403210585
Zhou, M., Li, Z., Gao, M., Zhu, W., Zhang, S., Ma, J., et al. (2024). Revealing the eco-environmental quality of the Yellow River Basin: trends and drivers. Remote Sens. 16 (11), 2018. doi:10.3390/rs16112018
Keywords: GCCM, causation, RSEI, spatial heterogeneity, Myanmar
Citation: Shi S, Peng S, Lin Z, Huang B, Ma D, Zhu Z, Zhu Y, Zhang R and Li T (2025) Analysis of the spatial pattern and causes of ecological environmental quality in Myanmar based on the RSEI model and the Geodetector-GCCM method. Front. Environ. Sci. 13:1514008. doi: 10.3389/fenvs.2025.1514008
Received: 21 October 2024; Accepted: 17 January 2025;
Published: 11 February 2025.
Edited by:
Salvador García-Ayllón Veintimilla, Polytechnic University of Cartagena, SpainReviewed by:
Beibei Niu, Shandong Agricultural University, ChinaCopyright © 2025 Shi, Peng, Lin, Huang, Ma, Zhu, Zhu, Zhang and Li. This is an open-access article distributed under the terms of the Creative Commons Attribution License (CC BY). The use, distribution or reproduction in other forums is permitted, provided the original author(s) and the copyright owner(s) are credited and that the original publication in this journal is cited, in accordance with accepted academic practice. No use, distribution or reproduction is permitted which does not comply with these terms.
*Correspondence: Shuangyun Peng, ZnJhbmttZWlAMTI2LmNvbQ==; Zhiqiang Lin, MTkyMzEzMDA2NUB5bm51LmVkdS5jbg==
Disclaimer: All claims expressed in this article are solely those of the authors and do not necessarily represent those of their affiliated organizations, or those of the publisher, the editors and the reviewers. Any product that may be evaluated in this article or claim that may be made by its manufacturer is not guaranteed or endorsed by the publisher.
Research integrity at Frontiers
Learn more about the work of our research integrity team to safeguard the quality of each article we publish.