 Jiwei Zhao1
 Luyao Wang
95% of researchers rate our articles as excellent or good
Learn more about the work of our research integrity team to safeguard the quality of each article we publish.
Find out more
ORIGINAL RESEARCH article
Front. Environ. Sci. , 29 January 2025
Sec. Land Use Dynamics
Volume 13 - 2025 | https://doi.org/10.3389/fenvs.2025.1505178
Habitat quality (HQ) is a critical factor for regional ecosystem health and sustainable development, as well as an important basis for formulating ecological protection and land-use planning. The Qin-Mang River Basin, as an integral part of the biodiversity conservation area in the Yellow River Basin, plays a significant role in maintaining the balance and stability of the regional ecosystem. This study is based on land use/land cover changes (LUCC) data from 1992, 2002, 2012, and 2022. It employs a land use transfer matrix to analyze the dynamic trends and patterns of LUCC. HQ changes are evaluated using the InVEST model, and the GeoDetector model is used to identify the key driving factors and their interactions. Additionally, spatial autocorrelation analysis is applied to explore the spatial clustering characteristics of HQ. The results indicate that between 1992 and 2022, the cumulative area of land transfer in the study area exceeded 600 km2, primarily characterized by the conversion of cultivated land to built-up areas. The HQ index decreased from 0.3409 in 1992 to 0.2896 in 2022, with a significant increase in spatial heterogeneity. Altitude, vegetation coverage, temperature, precipitation, and slope are the main driving factors influencing HQ, with natural factors dominating, but human activities gradually playing an increasingly significant role. Furthermore, HQ exhibits significant spatial clustering characteristics, with hotspot and coldspot areas providing scientific evidence for ecological protection and restoration measures. To improve HQ, it is recommended to strictly enforce ecological protection red lines, control the expansion of built-up areas, improve ecological compensation mechanisms, and promote ecological restoration measures such as returning farmland to forest and grassland.
Habitat quality (HQ) is a critical indicator of ecosystem services, reflecting an ecosystem’s ability to provide favorable conditions for the survival and growth of species over time and space. It captures the overall health and suitability of the environment in supporting biodiversity (Costanza et al., 1997). It holds significant importance in biodiversity conservation, balancing the supply and demand of ecosystem services, and constructing ecological security patterns (Mace et al., 2012; Hillard et al., 2017). HQ assessment not only reveals ecological environmental changes and their driving factors but also provides scientific evidence for ecological restoration and biodiversity conservation, thereby promoting the stability and health of ecosystems. With the increasing severity of global environmental issues, ecological environmental protection has become a shared challenge worldwide. LUCC, particularly urbanization and agricultural expansion, has had a profound impact on ecosystem functions and wildlife habitats, severely threatening ecological security (Watson et al., 2019; Ellis et al., 2019). In this context, HQ, as a key indicator of ecosystem health and stability, is directly linked to the maintenance of ecosystem service functions and the protection of biodiversity (Nelson et al., 2009).
In China, changes in HQ are particularly significant, especially in the Yellow River Basin, which is a crucial ecological and economic region. The HQ in this region directly affects the national ecological security and sustainable development (Xu et al., 2024). As land use/land cover changes (LUCC), particularly urbanization and agricultural expansion, the ecosystems of the Yellow River Basin face unprecedented pressures, making the study of HQ changes in this region urgent (Yang et al., 2022). The Qin-Mang River Basin, located at the core of the Yellow River Basin, plays a critical role in China’s ecological security strategy. This basin is rich in vegetation resources, home to 1,609 species of higher plants, many of which are nationally protected species. The Qin-Mang River Basin is not only a biodiversity conservation area but also plays a key role in the economic development of Central China, contributing to food production, energy supply, food processing, and the development of new industries. According to the “Ecological Protection and Restoration Plan for Mountains, Rivers, Forests, Farmlands, Lakes, Grasslands, and Deserts in Henan Province,” the Qin-Mang River Basin has been identified as a key area for ecological restoration. Implementing measures such as forest protection, soil and water conservation, and wetland restoration is crucial for maintaining the ecological functions of the basin and ensuring the region’s sustainable development.
Currently, significant progress has been made in HQ assessment methods, which can be broadly classified into two categories: the landscape pattern-based indicator system and the ecological assessment model-based approach. Although landscape pattern-based methods are easy to implement, they are limited by data scarcity when applied to large-scale regions (Oliveira et al., 2022; Alaniz et al., 2021). In contrast, ecological assessment models, such as the HIS model (Liu et al., 2006), SoLVES model (Zhao et al., 2018), and InVEST model, have been widely used for large-scale ecological assessments. Among these, the InVEST model has become one of the core tools in global ecosystem research due to its ability to quickly assess LUCC and their impacts on biodiversity (Yang et al., 2021; Sharp et al., 2018). Despite the achievements of existing models, there is still room for improvement in identifying driving factors and exploring spatial heterogeneity (Qing et al., 2021; Gong et al., 2019; Zhang et al., 2020).
In recent years, GeoDetector, as an emerging statistical analysis method, has been widely applied in ecological research, particularly for identifying ecosystem service driving factors and their spatial differentiation mechanisms (Wang and Xu, 2017). This method effectively overcomes the limitations of traditional methods, revealing the interactions between driving factors and providing scientific support for ecological protection (Fu et al., 2013). Additionally, spatial autocorrelation analysis (SAA), combining powerful statistical tools such as global Moran’s I, local Moran’s I, and Getis-Ord Gi*, has played an important role in revealing the spatial distribution characteristics of HQ and exploring the spatial clustering and dispersion patterns of ecological changes (Huang et al., 2022; Sallustio et al., 2017).
This study focuses on the Qin-Mang River Basin, a key area for ecological protection in the Yellow River Basin, with the aim of revealing the impacts of land use transformation on HQ and its driving mechanisms. By integrating the InVEST model, GeoDetector model, and SAA, a multi-model framework for assessment was constructed. The spatiotemporal changes in HQ were quantitatively evaluated, and the roles of driving factors and their spatial differentiation characteristics were systematically explored. This research not only fills the gap in HQ studies in the region but also uses the GeoDetector model to quantitatively reveal the interactions among driving factors, offering new methods and perspectives for advancing research on the complexity of ecosystem services.
The results indicate that HQ changes in the Qin-Mang River Basin are influenced by multiple factors, including land use transformation and its driving forces. Based on the scientific evaluation results, this study proposes targeted ecological restoration and protection strategies, providing scientific evidence for regional ecological environmental management and offering theoretical support and practical guidance for ecological protection and sustainable development in similar regions worldwide. In summary, this study systematically assesses the spatiotemporal changes in HQ and their driving mechanisms in the Qin-Mang River Basin, highlighting the ecological, economic, and social value of the region, and providing important references for the formulation of precise ecological protection and restoration policies, as well as promoting the health and sustainable development of regional ecosystems.
The Qin-Mang River Basin is located in the northwest of Henan Province, in the southwestern part of the ecological protection and restoration area of the Mountains, Rivers, Forests, Farmlands, Lakes, Grasslands, and Deserts in the South Taihang region. Its geographical coordinates range from 112°20′to 113°39′E longitude and 34°49′to 35°21′N latitude. The Qin-Mang River Basin is a biodiversity conservation area along the Yellow River wetlands, covering a total area of approximately 3,062.4 km2. The basin lies within the South Taihang region, which is a key node in the construction of China’s ecological security strategy. It forms the watershed between the North China Plain and the Loess Plateau and serves as a transition zone between the second and third geomorphic steps of China, playing a critical role as an ecological barrier in the central region. The geographical location of the Qin-Mang River Basin is shown in Figure 1.
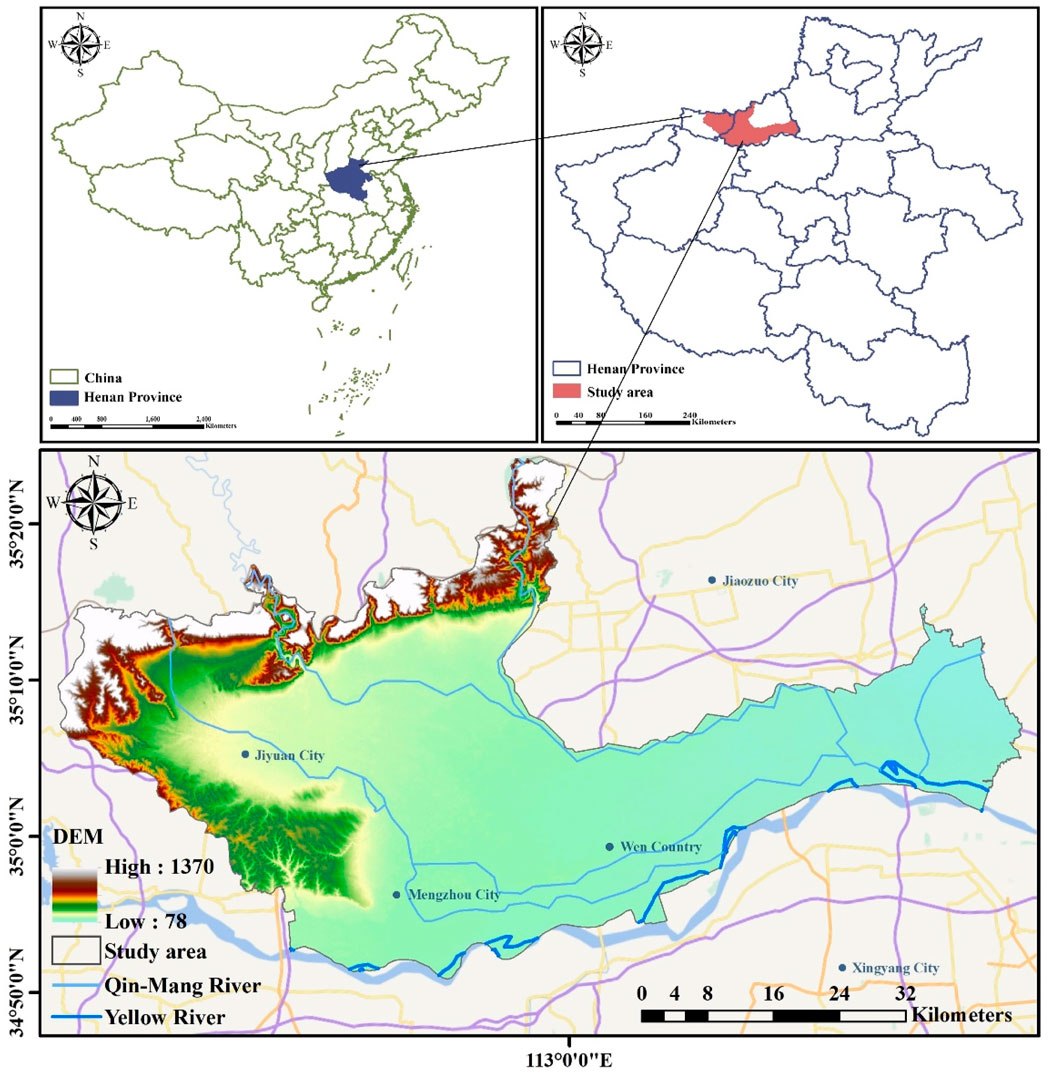
Figure 1. Geographic Location and Elevation Map of the Study area.
This study’s analysis primarily relies on land use/land cover change (LUCC) data, digital elevation model (DEM) data, administrative boundaries, as well as socio-economic and natural environmental datasets. The DEM data were sourced from the Geospatial Data Cloud (http://www.gscloud.cn), while the annual precipitation and temperature data were obtained from the National Meteorological Science Data Center (http://data.cma.cn). Soil type, vegetation type, and NDVI data were also sourced from the Geospatial Data Cloud (http://www.gscloud.cn). Socio-economic indicators, including nighttime light, GDP, and population data, were retrieved from the Global Change Research Data Publishing and Sharing Platform (http://www.geodoi.ac.cn). Road, railway, water systems, and vector boundary data were similarly acquired from this platform. Slope and aspect raster data were extracted from the DEM data using ArcGIS 10.8, and data for GeoDetector analysis were discretized using the same software.
During the data preprocessing phase, the following measures were adopted to ensure the consistency and accuracy of value units across different data sources:
(1) Data Resampling and Unit Standardization: Considering differences in resolution and units across various datasets, resampling was performed on remote sensing images and raster data. For remote sensing images with different resolutions, the nearest neighbor method was used to resample, reducing spatial errors while maintaining the original data characteristics. Additionally, the units and scales of all raster data were standardized, such as converting precipitation and temperature data to millimeters per year and degrees Celsius, respectively.
(2) Coordinate System Standardization: All datasets were transformed into the WGS_1984_UTM_Zone_49N coordinate system to ensure consistency in geographical location and accurate spatial alignment, avoiding spatial discrepancies caused by differing coordinate systems.
(3) Spatial Analysis and Reclassification: During spatial analysis and reclassification, all data underwent standardization processes, including clipping, reclassification, and reprojection, to ensure a comprehensive analysis within a unified spatial framework, considering differences in data source formats and processing requirements.
The LUTM is used to quantitatively analyze the transitions between different land use types (LUTs) during different periods, reflecting the dynamic changes in land use. By comparing land use data at different time points, the LUTM reveals the transformation patterns of land use, which is of significant importance for understanding the driving factors of LUCC and its impact on the ecological environment. The formula is as follows (Equation 1) (Long et al., 2014):
In this context,
The InVEST model is a comprehensive tool widely used for ecosystem services and their change assessments, with significant value in HQ and ecological service evaluations. This model calculates regional HQ indices and their spatial distribution by analyzing land use/cover maps and threat factors. In this study, the InVEST model particularly focuses on the interaction between natural environmental factors and landscape structure, adopting a comprehensive perspective to evaluate the ecological service benefits. From the natural environment perspective, HQ assessment involves factors such as climate, soil types, and topography, all of which directly affect ecosystem functions and service capabilities. From the landscape perspective, dynamic changes in land use and landscape patterns play a key role in habitat suitability and ecological connectivity (Yang et al., 2024).
The HQ index, as a comprehensive indicator, is used to assess the habitat suitability and degradation degree of LUTs. By combining natural environmental and socio-economic factors, the InVEST model can intuitively assess the comprehensive benefits of LUCC on ecosystem services, providing a scientific basis for regional ecological service protection and management. The calculation formula is as follows (Equation 2) (Sharp et al., 2018):
In the formula,
Based on previous research and the InVEST model user guide, and considering the actual conditions of the Qin-Mang River Basin, this study constructed a habitat threat factor and threat degree evaluation table (Table 1), as well as a sensitivity evaluation table for LUTs to threat factors (Table 2) (Guo et al., 2024; Chen et al., 2021; Hu et al., 2022).
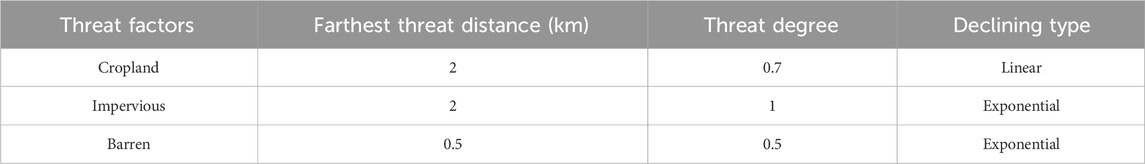
Table 1. Habitat threat factors and severity.
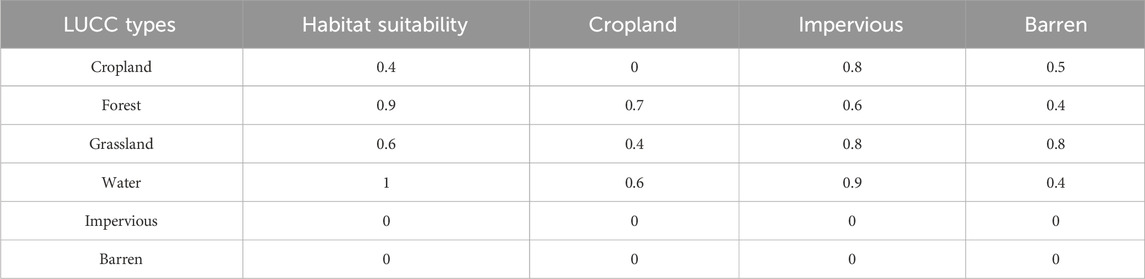
Table 2. Sensitivity of LUCC types to threat factors.
The GeoDetector model is a tool used for spatial data analysis, widely applied to identify the driving factors of ecological phenomena and their mechanisms. This model analyzes the impact of natural factors, socio-economic factors, and LUTs on HQ changes, effectively identifying the main driving factors and their interactions. GeoDetector is based on geographic spatial data and reveals the influence of factors on ecological phenomena by quantifying the explanatory power of these factors over spatial data. Its advantage lies in assessing the interaction effects between factors, providing a scientific basis for ecological protection and land use planning (Zhang et al., 2023).
In the GeoDetector model, the q value reflects the explanatory power of independent variables on the dependent variable, where q ∈ [0, 1]. A larger q value indicates a stronger explanatory ability of the independent variable on the dependent variable. The model not only identifies the impact of individual factors on HQ changes but also reveals their combined influence by calculating the interaction between different factors. Specifically, GeoDetector can compute the interaction term q (X1∩X2), which helps determine whether the joint effect of factors X1 and X2 strengthens or weakens the influence of the dependent variable Y. If q (X1∩X2) is greater than q (X1) and q (X2), it indicates that the interaction between the two factors has a stronger influence on the dependent variable; conversely, the interaction is weaker. The calculation formula is as follows (Equations 3, 4) (Wang and Xu, 2017):
where
SAA is used to study the spatial distribution characteristics of geographic features and reveal the clustering or dispersion patterns of data. Moran’s I is used to measure overall spatial autocorrelation, while the Getis-Ord Gi* is used to identify local hotspots and cold spots, revealing anomalous areas in spatial distribution. This study employs the global Moran’s I, local Moran’s I, and Getis-Ord Gi* as primary analytical tools, respectively, for the SAA of HQ in the Qin-Mang River Basin at both the global and local scales (Chen et al., 2022).
The GMI, proposed by Patrick Alfred Pierce Moran, is used to measure the spatial autocorrelation of features across the entire study area. Its value ranges from −1 to 1: when Moran’s I > 0, the data exhibit positive spatial autocorrelation (similar values tend to cluster); when Moran’s I < 0, the data exhibit negative spatial autocorrelation (dissimilar values tend to cluster); when Moran’s I = 0, the data are randomly distributed in space. The calculation formula is as follows (Equation 5) (Moran, 1950):
In the equation,
LMI, proposed by Luc Anselin, is used to reveal the spatial clustering patterns of local regions. By comparing each unit with its neighboring units, this method identifies local hotspots (high-high clustering, HH), cold spots (low-low clustering, LL), high-low outliers (HL), and low-high outliers (LH). The LMI is suitable for further analyzing the clustering patterns in specific local areas within the study region, supporting localized strategies for ecological priority protection or restoration. The calculation formula is as follows (Equation 6) (Anselin, 1995):
In the equation,
The Getis-Ord Gi* is used to identify significant hotspots and cold spots of HQ and is an important tool for analyzing the spatial distribution of ecosystem services. In this study, in addition to using the Getis-Ord Gi* to analyze the spatial distribution of HQ, we also combine the spatial patterns of urbanization processes to assess the impact of urban expansion on ecosystem services. Urbanization intensifies LUCC, and its impact on ecosystem services is not only reflected in the spatial distribution differences of hotspots and cold spots but also in the potential disruption of habitat connectivity and suitability due to land use patterns. By integrating the Getis-Ord Gi* with land use data, this study reveals the spatial interactions between urban expansion and ecosystem services, providing scientific evidence for ecological planning and restoration in urbanized areas. The calculation formula is as follows (Equation 7) (Getis and Ord, 1992):
In the equation,
In the study of the driving factors of HQ, this research selects key factors that comprehensively reflect the influence of both the natural environment and human activities. HQ is not only driven by natural factors such as climate and topography but is also heavily influenced by human social activities, including population density, economic development, and urbanization. Although human activities play an important role in HQ, this study focuses on the role of the natural environment and socio-economic conditions in land use transformation, particularly in the Qin-Mang River Basin, which has unique geographical and ecological characteristics. Therefore, this study selects 9 types of natural environmental factors (annual precipitation, mean annual temperature, DEM, slope, aspect, soil type, vegetation type, NDVI, distance to water systems) and 4 types of socio-economic factors (GDP, residential population, nighttime light index, distance to railways) as the main driving factors.
The specific selection criteria are as follows:
(1) Natural Driving Factors: Natural factors such as climate, topography, and vegetation type directly affect ecological functions. Annual precipitation and mean annual temperature are the core factors of climate change, determining the productivity and stability of ecosystems. They especially have significant impacts on ecological processes such as vegetation growth, HQ, and hydrological cycles. The climate diversity of the Qin-Mang River Basin provides a unique context for studying the influence of climate on HQ. Topographic factors (e.g., slope, aspect, and DEM) affect land use patterns and water flow direction, further determining the distribution of habitat spaces and the evolution of ecosystems.
(2) Soil and Vegetation Factors: Soil type and vegetation cover are key factors influencing HQ. Different soil types offer varying levels of support for crop growth, carbon fixation, and nutrient cycling, directly affecting ecosystem carbon storage and soil health. NDVI, as a standardized index of vegetation cover, can effectively reflect the health status and productivity of an ecosystem, thereby influencing HQ.
(3) Socio-economic Driving Factors: Although this study mainly focuses on natural environmental factors, the impact of socio-economic factors on HQ changes cannot be ignored. Population density and residential population reflect the intensity and spatial distribution of human activities, especially in urbanized and densely populated areas, where the pressure on land use is more pronounced, and the impact on the ecological environment is more direct. GDP represents the level of regional economic development, which directly influences land use patterns, resource demands, and changes in ecosystem services. The nighttime light index effectively indicates the intensity and distribution of economic activities. Transportation (e.g., distance to railways) influences the development potential of a region and land use patterns, thereby affecting HQ.
Land use/land cover changes (LUCC) in the Qin-Mang River Basin between 1992 and 2022 has significantly affected HQ. Studies show that the reduction of cultivated land and the expansion of built-up land are the primary drivers of HQ degradation, particularly in the context of rapid urbanization, which has exerted significant pressure on the ecosystem. The expansion of built-up land not only occupies a large amount of arable and forest land but also weakens habitat connectivity and ecological diversity. Additionally, the reduction of forest land has impacted the region’s carbon storage capacity and hydrological regulation functions. Although the area of water bodies remained relatively stable, their support for ecosystem services was limited. LUCC analysis reveals the differential impacts of various LUTs on ecosystem services, especially the negative effect of built-up land expansion on HQ, emphasizing the need to address ecological losses in urbanization processes within ecological protection policies.
LUCC shows significant variations across different periods. By analyzing the LUT distribution maps for 1992, 2002, 2012, and 2022 (as shown in Figure 2), land use transfer matrices (Table 3), and transfer chord diagrams (Figure 3), it is evident that the conversion of cultivated land to built-up land and the reduction of forest land were the primary trends. Specifically, from 1992 to 2002, the total area of land conversion was 207.35 km2, accounting for 6.78% of the total study area, with the most significant expansion of built-up land, continuing over the subsequent decade. From 2002 to 2012, the total area of land conversion was 211.32 km2, accounting for 6.91% of the study area. Built-up land continued to expand, while cultivated and forest lands gradually decreased. From 2012 to 2022, the total area of land conversion was 182.56 km2, accounting for 5.97% of the study area. Although the rate of change slowed, the expansion of built-up land remained the dominant trend. These changes reflect the negative impact of built-up land expansion on HQ, particularly the significant negative effect of converting cultivated land to built-up land on HQ.
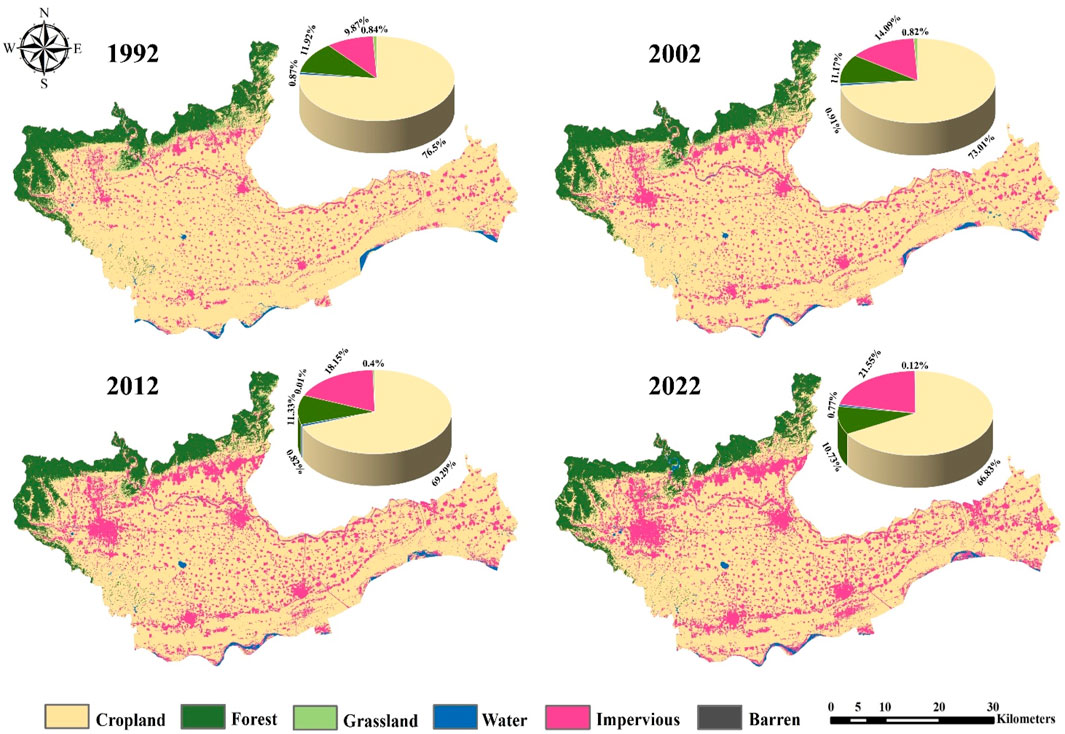
Figure 2. LUTs distribution maps of the study area from 1992 to 2022.
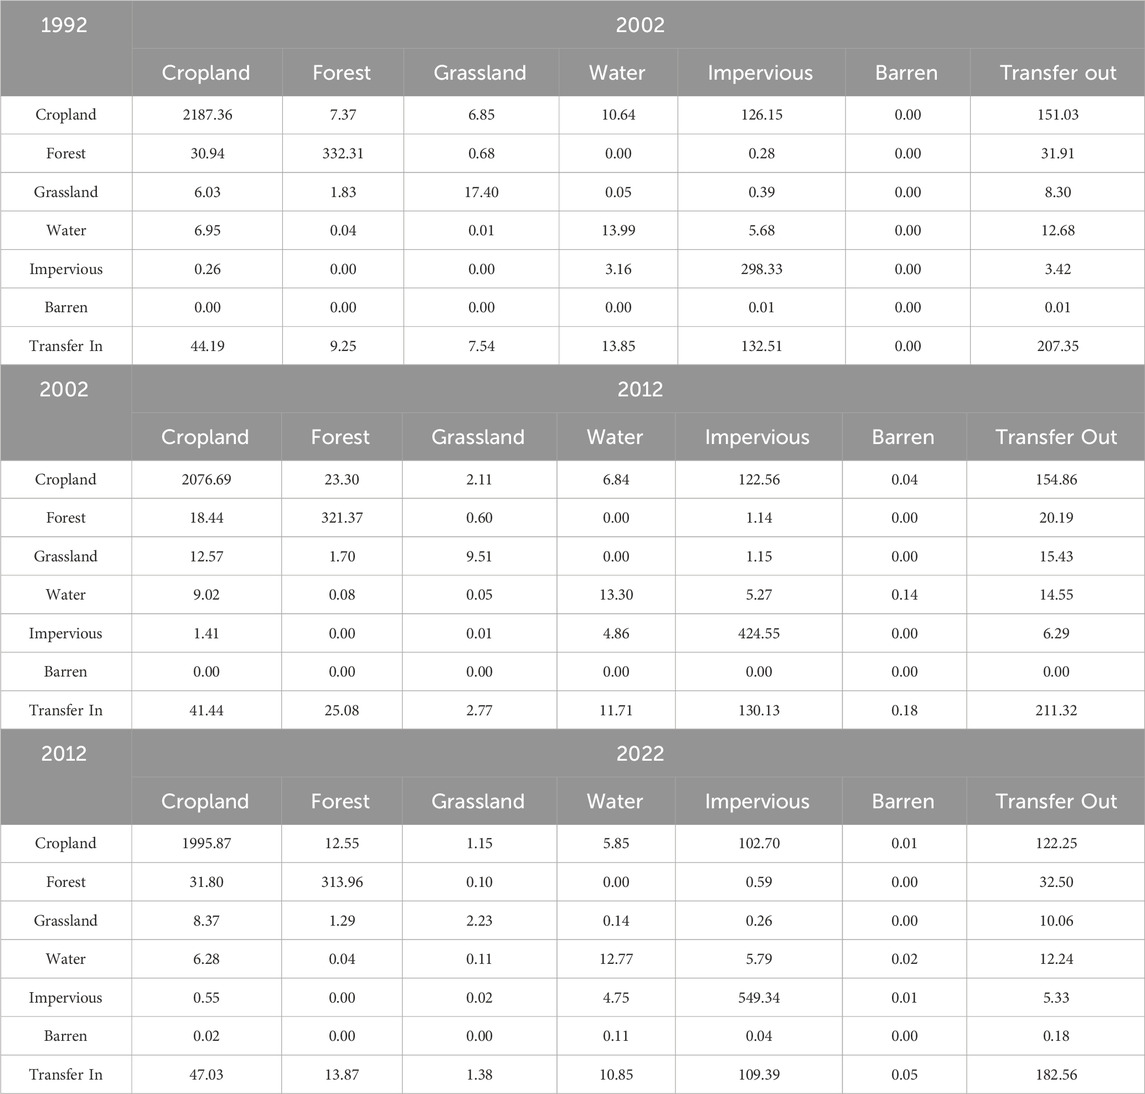
Table 3. LUTM from 1992 to 2022 (km2).
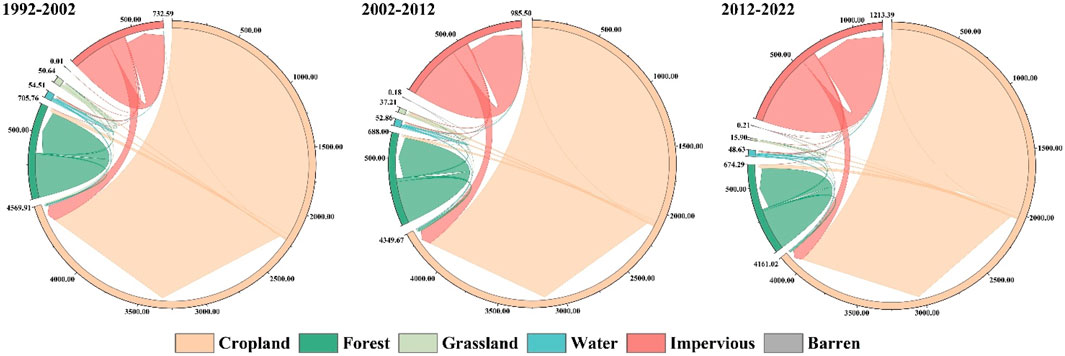
Figure 3. Chord diagram of LUTs transitions in the study area from 1992 to 2022.
The spatiotemporal analysis of LUCC indicates that the expansion of built-up land not only directly occupied a large amount of cultivated and forest land, leading to habitat fragmentation, but also severely weakened the critical service functions of regional ecosystems, particularly in carbon storage and hydrological regulation. The reduction of cultivated land and the increase in built-up land have formed a vicious cycle, significantly affecting biodiversity and ecosystem health. This trend underscores the severity of HQ degradation and provides an urgent practical need for future ecological protection and restoration efforts. To address this challenge, future protection policies should strengthen responses to ecological losses caused by rapid urbanization, particularly in land resource management and urban expansion, promoting sustainable land use development and avoiding unreasonable development and excessive expansion.
In the HQ module of the InVEST model, the HQ index is represented by values between 0 and 1, where values closer to 1 indicate better HQ, and values closer to 0 indicate poorer quality. This index not only reflects the quality of biological habitats within the region but also represents the region’s ability to resist habitat-threatening factors. This study used ArcGIS 10.8 software to extract data on cultivated land, built-up land, distance from railways, and unused land for the Qin-Mang River Basin for the years 1992, 2002, 2012, and 2022. These data, combined with land use maps and threat source data, were input into the InVEST 3.9.0 model to generate HQ distribution maps for each year (Figure 4).
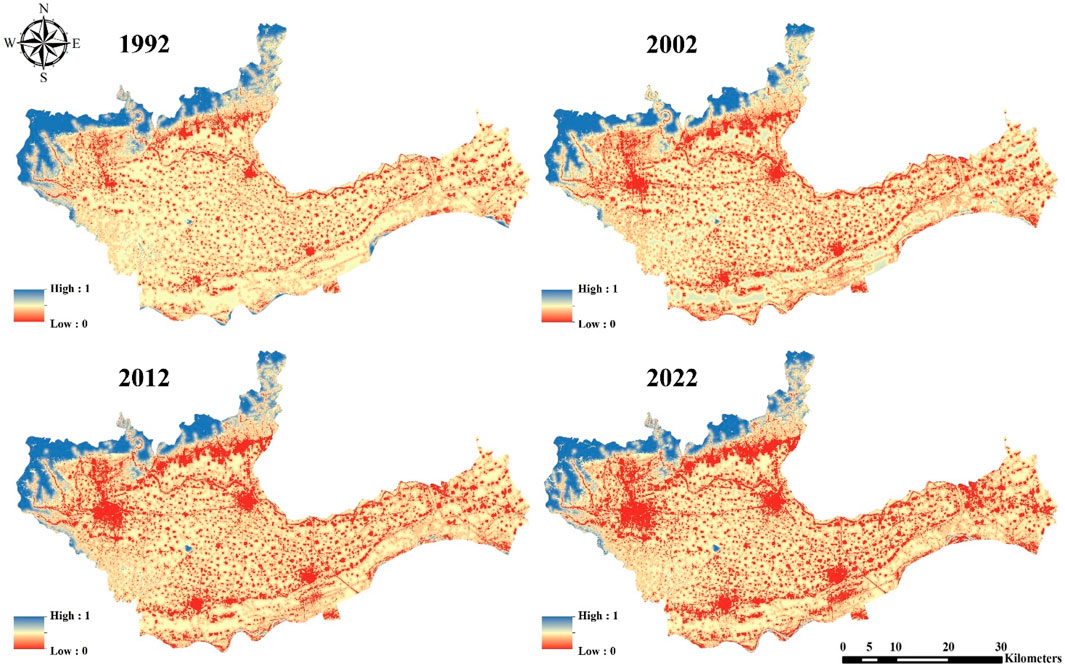
Figure 4. Spatial distribution map of HQ index.
The evaluation results from the InVEST model show that the average HQ index for different land-use landscapes in the Qin-Mang River Basin for the years 1992, 2002, 2012, and 2022 were 0.3409, 0.3167, 0.3055, and 0.2896, respectively, with standard deviations of 0.1675, 0.1724, 0.1887, and 0.1912. These results indicate a year-on-year decline in HQ, with an increasing disparity between regions. The increase in standard deviation suggests that the spatial distribution of HQ degradation has become more dispersed.
Overall, the HQ index in the Qin-Mang River Basin has been decreasing year by year, with regional disparities gradually widening. This trend reflects the deterioration of ecosystem health, particularly in the context of urbanization and land-use change. The degradation of HQ and the widening spatial differences highlight the need for differentiated protection and restoration strategies based on the ecological conditions of different regions. Future ecological protection measures should focus on regions with poorer or severely degraded HQ and implement targeted protection and restoration efforts based on regional characteristics.
The habitat degradation index measures the extent and likelihood of HQ decline due to threatening factors. This study evaluated the habitat degradation index for the study area from 1992 to 2022 using the InVEST model, and the results were reclassified using the natural breaks classification method in ArcGIS. This method, proposed by Jenks, objectively reflects the statistical characteristics of data distribution and exhibits significant spatial variability. Based on this method, habitat degradation was classified into five levels: slight degradation, mild degradation, moderate degradation, severe degradation, and very severe degradation (Figure 5).
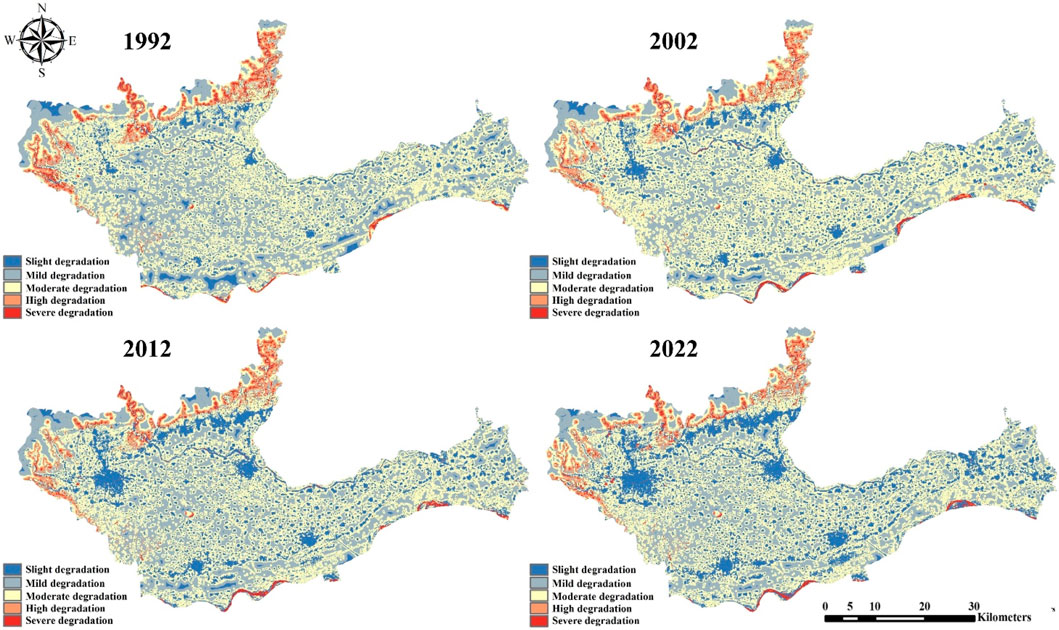
Figure 5. Spatial distribution map of habitat degradation index.
The evaluation results from the InVEST model show that the average habitat degradation index for different land-use landscapes in the study area for the years 1992, 2002, 2012, and 2022 were 0.2412, 0.2379, 0.2306, and 0.2250, respectively, with standard deviations of 0.1107, 0.1205, 0.1286, and 0.1340. The results show a general decrease in the habitat degradation index year by year, indicating a reduction in degradation intensity. However, the increasing standard deviation year after year reflects an expanding difference in degradation across regions, with the spatial distribution of degradation becoming more dispersed.
Despite the overall reduction in degradation intensity, the spatial differences in habitat degradation in the Qin-Mang River Basin have been increasing. This suggests that some regions have seen improvements in ecological conditions, but some areas still face serious ecological degradation issues. Therefore, future ecological restoration and protection efforts should focus on areas with higher degradation levels and uneven changes, and adopt differentiated and localized management strategies to address the spatial variability of habitat degradation.
HQ is influenced by multiple factors, including both natural environments and human activities. In terms of natural environment factors, climate affects vegetation growth by regulating water and heat conditions, which in turn changes biological growth patterns and habitat spatial characteristics. In terms of human activities, factors such as population density, economic development level, and urbanization process have varying degrees of impact and destruction on HQ. Therefore, this study selected 9 types of natural environmental factors (such as DEM, annual average temperature, annual precipitation, slope, aspect, soil type, vegetation type, NDVI, and distance to water systems) and 4 types of socioeconomic factors (such as GDP, residential population, nighttime light index, and distance to railways) for analysis.
In terms of data processing, the Euclidean distance tool in ArcGIS was used to calculate the distances to railways and water systems. Combined with other factor data, a 1 km × 1 km fishnet sampling method was used to extract the factor values and HQ values at the center of each grid. After removing outliers, the data were input into the GeoDetector model for quantitative analysis (Figures 6, 7).
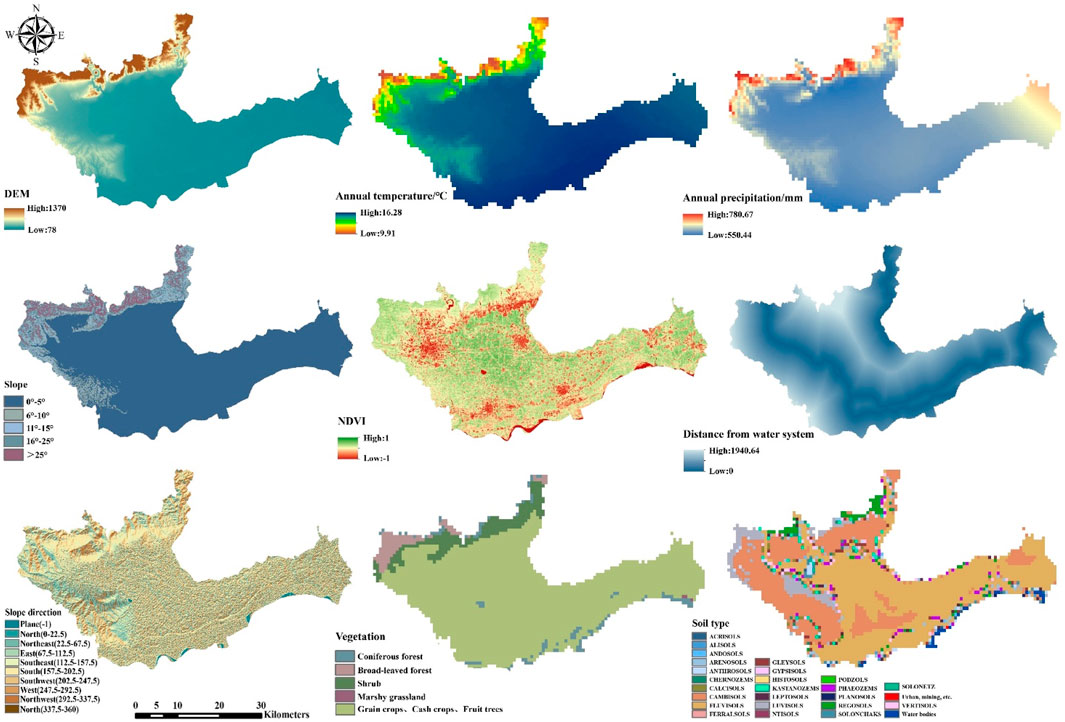
Figure 6. Spatial visualization of natural driving factors.
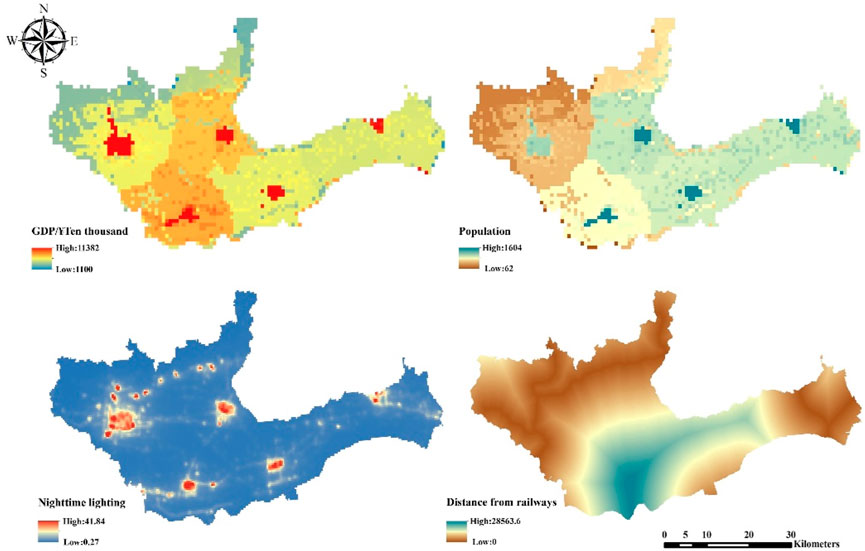
Figure 7. Spatial visualization of socioeconomic driving factors.
Quantitative analysis of the influence of driving factors on HQ is essential. The GeoDetector model quantifies the influence of driving factors through the q-value, where a higher q-value indicates a more significant driving force. Table 4 presents the results of the driving factor detection in the study area from 1992 to 2022. The analysis reveals that the key driving factors affecting HQ include DEM, mean annual temperature, slope, and vegetation. Natural factors have always been the dominant drivers, but with the reduction of forest area and the expansion of construction land, the influence of human activities has gradually increased, weakening the natural driving force. This suggests that, although natural factors remain dominant in determining HQ, human activities are significantly intensifying their impact on ecosystems, indicating the need for timely adjustments in ecological protection policies to address the effects of human activities.
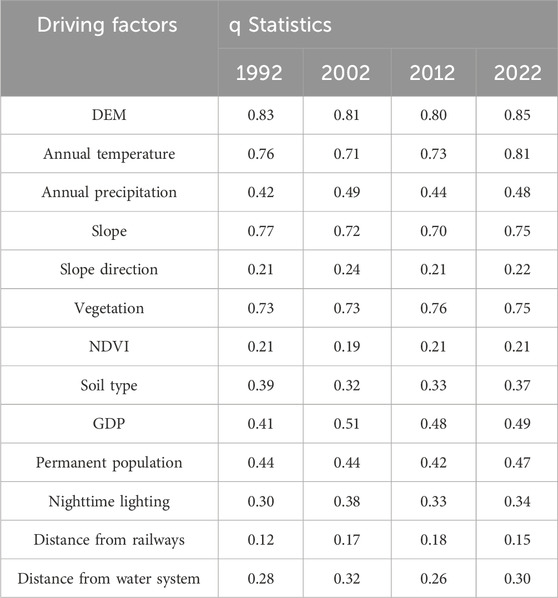
Table 4. Results of driving factor detection.
Driving factors in ecosystems are interconnected and interact with each other. The interaction detection module is used to analyze the impact of interactions between two factors on the explanatory power of HQ. This module processes spatial data using ArcGIS 10.8 and analyzes the data using the GeoDetector model. The results show that the interactions between driving factors significantly affect HQ (Figure 8). Specifically, the nonlinear enhancement in 1992, 2002, 2012, and 2022 was 22.17%, 23.08%, 25.04%, and 27.47%, respectively. Bidirectional interactions generally have a stronger driving force than single-factor drivers, confirming the validity of the driving factors.
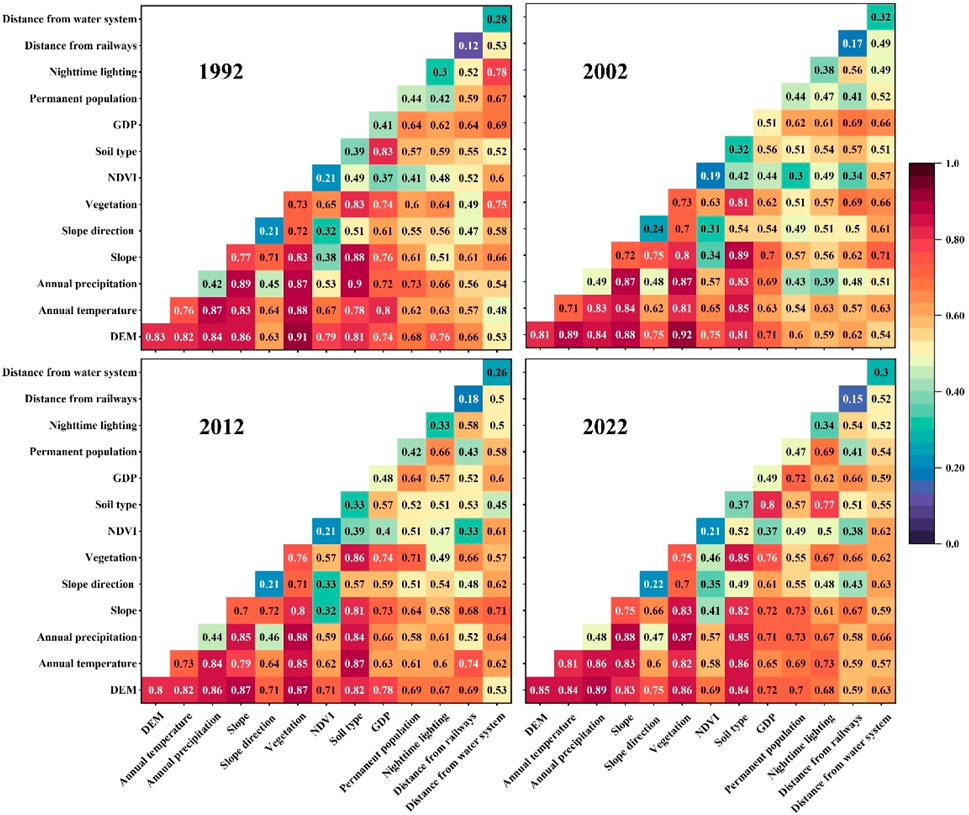
Figure 8. Interaction detection of HQ driving factors.
In 1992, the most significant interactions were DEM ∩ Vegetation (q-value 0.91), Annual Precipitation ∩ Soil Type (q-value 0.90), and Annual Precipitation ∩ Slope (q-value 0.89). In 2002, the most significant interactions were DEM ∩ Vegetation (q-value 0.92), DEM ∩ Mean Annual Temperature (q-value 0.89), and Slope ∩ Soil Type (q-value 0.89). In 2012, the most significant interactions were Annual Precipitation ∩ Vegetation (q-value 0.88), DEM ∩ Vegetation (q-value 0.87), DEM ∩ Slope (q-value 0.87), and Mean Annual Temperature ∩ Soil Type (q-value 0.87). In 2022, the most significant interactions were DEM ∩ Annual Precipitation (q-value 0.89), Annual Precipitation ∩ Slope (q-value 0.88), and Annual Precipitation ∩ Vegetation (q-value 0.87). The results indicate that the interactions among DEM, vegetation, annual precipitation, and slope are the most influential driving forces on HQ. Combining the divergence factor detection, the study identifies five key driving factors—DEM, mean annual temperature, annual precipitation, slope, and vegetation—that have the most significant cumulative impact on the HQ of the study area. This suggests that the combined effect of multiple factors better explains the spatial variation in HQ.
In summary, through the quantitative analysis of natural and socio-economic factors, this study reveals their comprehensive influence on HQ. The findings indicate that DEM, mean annual temperature, annual precipitation, slope, and vegetation are the primary driving factors, while the expansion of human activities is gradually exerting a significant impact on ecosystems. Interaction detection shows that the combined effects of multiple factors are more effective in explaining the spatial variation of HQ than individual factors. Therefore, future ecological protection policies should prioritize these key driving factors and their interactions to ensure the sustainability and effective conservation of ecosystems.
This study utilizes the GMI, LMI, and Getis-Ord Gi* to analyze the spatial distribution characteristics of HQ in the study area from 1992 to 2022, in order to quantify its spatial aggregation and dispersion characteristics. The analysis shows significant spatial positive correlation in HQ, and the changes in hotspot and coldspot areas provide a scientific basis for further optimizing ecological protection strategies.
The GMI analysis indicates that the spatial distribution of HQ in the study area has a significant positive correlation. The Moran’s I values for 1992, 2002, 2012, and 2022 were 0.699, 0.679, 0.725, and 0.726, respectively. The corresponding z-values were all higher than the critical value, and the p-values were less than 0.05, indicating that the results are statistically significant. This suggests that the spatial distribution of HQ exhibits strong spatial aggregation, rather than random distribution. The scatter plot in Figure 9 shows that most data points are concentrated in the first and third quadrants, indicating that high-quality habitat areas are surrounded by other high-quality areas, and low-quality areas are surrounded by other low-quality areas, presenting a strong positive correlation. The Moran’s I values gradually approach 1, indicating that the spatial aggregation effect of HQ is enhanced. This stable spatial positive correlation reflects the separation trend between high and low HQ areas, providing an important basis for ecological restoration and management.
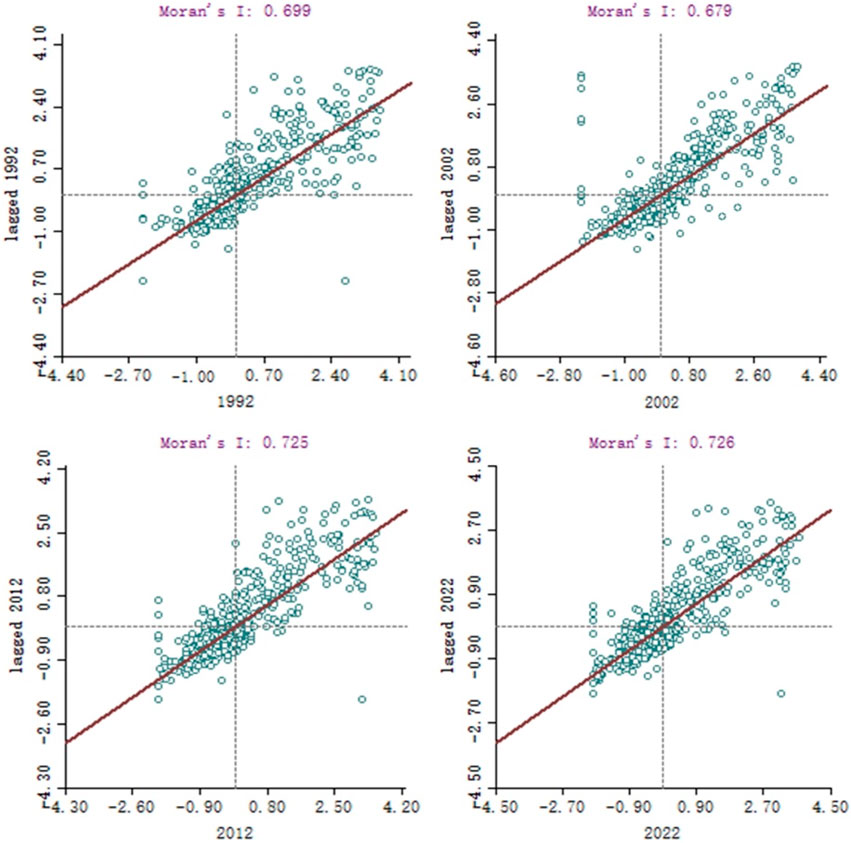
Figure 9. Scatter plot of HQ in the study area.
The LMI (Figure 10) clearly delineates high HQ hotspots (red, high-high clustering), low HQ coldspot areas (blue, low-low clustering), and spatial outlier regions that significantly differ from their surroundings (light yellow and light green, representing high-low and low-high clustering, respectively). The hotspot areas are concentrated in the central and southern parts of the basin, indicating that these regions have superior HQ, good ecological environments, and rich biodiversity, and should be continuously protected. In contrast, the coldspot areas in the northern and southeastern parts reflect HQ degradation, likely associated with unreasonable development and pollution during urbanization, and urgently require ecological restoration. Furthermore, although spatial outlier regions occupy a smaller proportion, their uniqueness suggests that local ecological anomalies, such as heavily polluting industries or densely developed areas, should be specifically monitored to prevent further deterioration of HQ.
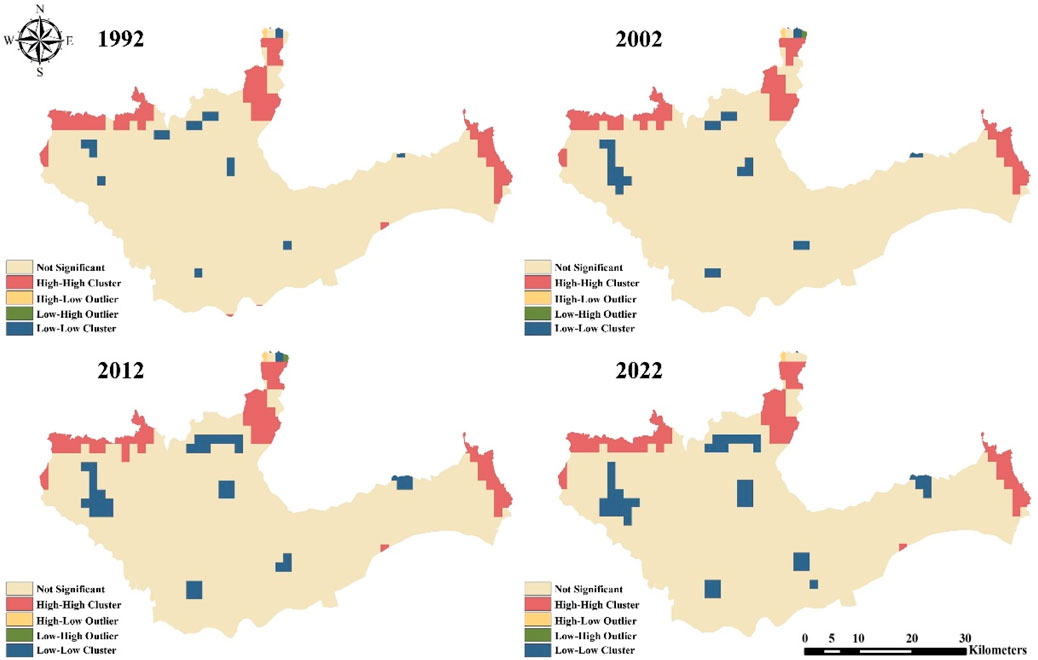
Figure 10. LMI clustering map of HQ in the study area.
The Getis-Ord Gi* analysis further validates the spatial distribution characteristics of significant HQ hotspots (red) and coldspot areas (blue) (Figure 11). Hotspot areas represent regions of high HQ concentration, with strong ecosystem service functions and rich biodiversity, and should be prioritized for protection. Conversely, coldspot areas show lower HQ, with impaired ecosystem functions, requiring urgent restoration. The analysis results show that the hotspot areas are highly consistent with the high-high clustering areas in Figure 10, further confirming the superiority of HQ in these areas and their long-term protection value. Similarly, the coldspot areas align with the low-low clustering areas in Figure 10, once again confirming the low state of HQ in these regions, emphasizing the urgency of taking effective measures to improve these areas.
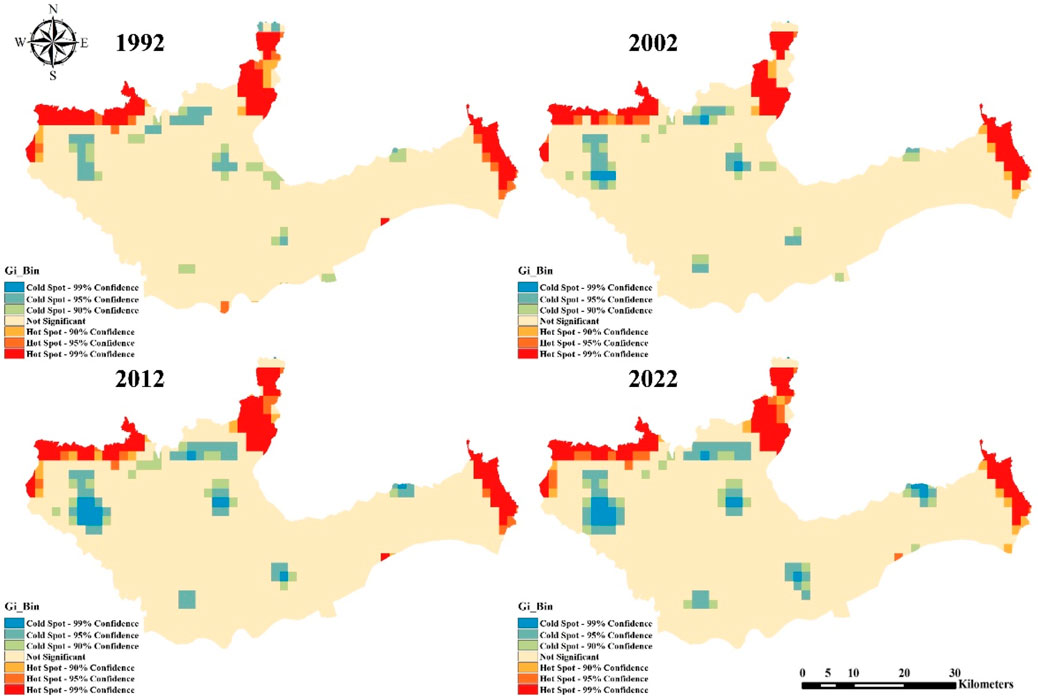
Figure 11. Hotspot and coldspot map of HQ in the study area.
The SAA shows that the spatial distribution of HQ in the study area exhibits significant positive correlation, and the aggregation effect has gradually strengthened over time. Both global and local analyses reveal the spatial migration characteristics of high- and low-quality ecological areas, particularly emphasizing the need for attention to low-value aggregation in rapidly urbanizing areas.
The study reveals a continuous decline in the HQ Index of the Qin-Mang River Basin, accompanied by increasing regional disparities. The primary factors driving this trend are urbanization and economic development, which have resulted in the conversion of arable land and the reduction of natural habitats. Additionally, environmental pollution and the overexploitation of resources have exacerbated the deterioration of HQ. Specifically, pollutant emissions, unsustainable water resource utilization, and agricultural activities have significantly impacted wetlands and forests, contributing to habitat degradation.
Using the InVEST model, the study assessed ecosystem service functions to analyze the natural and anthropogenic drivers of HQ. Results indicate that rising temperatures are a major driver of wetland ecosystem degradation in the study area, particularly affecting water retention capacity. Persistent temperature increases have accelerated water evaporation, hindering the growth of herbaceous marsh wetlands. Simultaneously, urbanization-driven excessive water consumption, along with industrial and agricultural expansion, has further degraded the ecological functions of wetlands. From a natural and landscape perspective, the ecological service benefits estimated by the InVEST model primarily reflect the direct impacts of complex factors such as LUCC and production interactions. Future research should delve deeper into the interplay of these factors and their cumulative effects on HQ, particularly the role of natural factors like soil carbon storage, to enhance the evaluation framework. Changes in soil carbon storage have a direct impact on HQ. The intensification of urbanization and agricultural activities has led to a decline in soil carbon storage, potentially accelerating ecological degradation and further impairing HQ (Liu et al., 2024).
Empirical data indicate severe water quality issues in the Qin-Mang River Basin. Among the monitored river sections, the water quality in the Qin River’s Wulongkou and Mang River’s Quyang Lake sections is classified as Grade II. The Qin River’s Wuzhi canal head section is classified as Grade III, Ji River’s section as Grade IV, and the Mang River’s Nanguanzhuang and Wenxian Sisuitan sections are classified as inferior to Grade V. Only 57% of the monitored sections meet the Grade III standard or above. Furthermore, riverine wetlands and biodiversity have been significantly affected. Nearly half of the 14 city-controlled rivers in Jiaozuo City are classified as inferior to Grade V, failing to meet provincial and municipal water quality standards. The primary causes of these issues include overexploitation of water resources, sewage discharge, waste accumulation, and insufficient water volume.
The Qin-Mang River Basin, as a national grain production core area, has achieved nearly full coverage of land consolidation and high-standard farmland construction in its plains. The region’s advanced economy, dense population, and numerous industrial enterprises have resulted in severe environmental challenges. Excessive emissions of the “three wastes” (waste gas, wastewater, and solid waste) and irrigation with untreated wastewater have led to significant soil pollution. Furthermore, the overuse of chemical fertilizers and pesticides, combined with continuous cropping, has aggravated soil-borne diseases, reduced soil fertility, and diminished microbial activity, gradually deteriorating the ecological environment. In the coal mining area of Jiyuan City, the polluted soil area is approximately 117.19 km2, with severe cadmium (Cd) and arsenic (As) contamination. The pollution severity decreases with increasing distance from coal gangue piles and soil depth. Major contributing factors include industrial activities, agricultural practices, lifestyle habits, and natural environmental conditions.
Land use transformation profoundly reflects the influence of socio-economic development on land-use patterns, directly altering the structure and function of natural ecosystems. This study systematically analyzes the impact of land use transformation on HQ from both natural ecological and socio-economic perspectives, while exploring the underlying driving mechanisms (Tang et al., 2023; Tang et al., 2021).
In natural ecosystems, ecological background factors are crucial to HQ. Dense forests provide habitats for wildlife, while sufficient precipitation and suitable temperatures supply essential food resources (Bai et al., 2019). High altitudes and steep mountains, due to limited human activity, serve as ideal habitats for flora and fauna (Meyfroidt, 2013). Analysis using the GeoDetector model reveals that LUT is the core factor influencing changes in HQ, directly reflecting the impact of land use transformation. Additionally, natural factors such as elevation, slope, and annual mean temperature significantly affect HQ, showing spatial variability. Vegetation types and annual precipitation play key roles in the spatial differentiation of HQ, highlighting their importance in habitat suitability (Zhang et al., 2022; Qin et al., 2024). The role of soil carbon storage in HQ changes is also notable, especially in wetland and forest ecosystems. Declines in soil carbon storage can exacerbate habitat suitability deterioration, affecting the stability of wildlife habitats. Soil carbon dynamics not only mirror land use transformation but also drive changes in HQ (Liang et al., 2023).
From the socio-economic perspective, advancements in socio-economic levels significantly alter LUTs, thereby influencing HQ. The urbanization process accelerates the demand for construction land, leading to the conversion of arable land and other less suitable land types, further affecting HQ. Population growth and the rising demand for agricultural products drive changes in land use systems, accelerating shifts in land-use patterns (Fang et al., 2022). Socio-economic activities influence natural ecosystems by altering land-use structures and spatial distributions, with these changes evolving over time. In areas with rapid urbanization, the impact of LUCC on HQ is particularly pronounced, especially at the urban fringes where expansion is most rapid. Intensified urbanization and agricultural activities reduce soil carbon storage, potentially exacerbating ecological degradation. Low-suitability LUTs not only decrease their own HQ but may also negatively affect adjacent areas. For instance, forested areas neighboring construction land exhibit significant differences in HQ compared to those neighboring grasslands, even if their habitat suitability appears similar, due to differing potential threats (Huang et al., 2020).
The study also reveals significant spatial heterogeneity in the distribution of HQ and the Human Development Index. Regions with high HQ are generally located in less-disturbed natural environments, whereas highly urbanized areas exhibit lower HQ. This indicates that the impact of natural environmental changes on HQ intensifies during urbanization. To better understand these spatial heterogeneity changes, future research should strengthen spatial autocorrelation analyses to explore the interactions between natural and socio-economic factors across different regions and their effects on HQ.
Driving factor analysis indicates that natural factors such as temperature, precipitation, and LUT significantly influence changes in HQ, showing consistent trends across regions. The GeoDetector model identified the roles of these factors in the Qin-Mang River Basin’s HQ changes, with comparisons to existing studies. The findings confirm that temperature, slope, and LUCC have similar impacts on HQ as reported in previous research. However, this study highlights the pronounced influence of LUCC driven by urbanization, particularly in urban fringe areas where HQ decline is strongly associated with urban expansion rates. Unlike studies in certain other regions, this research underscores the profound impact of urbanization on HQ, especially in areas undergoing rapid urbanization. By comparing with existing literature, this study further confirms the deep association between land use transformation and HQ, providing scientific evidence for policy development (Li et al., 2019; Qiao et al., 2023; Wu et al., 2018).
To address the decline in HQ and the growing regional disparities, this study proposes the following recommendations aimed at improving habitat suitability in the region:
Regions with significantly higher HQ (as indicated by the red areas in Figures 10, 11) should be designated as priority ecological conservation zones. Strict ecological redlines should be established to restrict human activities, particularly to curb the unregulated expansion of construction land. Scientific conservation plans should be implemented to ensure the stability of ecosystems within these regions.
Areas with low HQ (as indicated by the blue areas in Figures 10, 11) should be prioritized for ecological restoration. Restoration measures include pollution control, wetland and vegetation restoration, and the promotion of ecological agriculture. Specifically, agricultural structures should be adjusted according to natural factors such as slope to minimize ecological damage.
Spatial outlier areas require detailed investigations to analyze the causes of anomalies in HQ. Targeted protection and restoration measures should be developed, considering geological and climatic factors, to ensure the scientific and effective implementation of these strategies.
Scientific research and technological advancements are crucial for enhancing habitat suitability. A comprehensive ecological monitoring network should be established to track changes in HQ in real time. Additionally, advanced ecological protection technologies should be employed to ensure effective and practical conservation efforts, promoting the overall progress of ecological protection initiatives.
Policies and regulations related to ecological conservation should be formulated and refined to ensure effective implementation and improvement of HQ. Public participation should be encouraged to raise environmental awareness, advocate for green lifestyles, and reduce negative impacts on the environment.
From the perspective of economics and sustainable development, this study holds substantial theoretical and practical significance. It demonstrates that the rational management of ecosystem services can not only improve HQ but also promote sustainable regional economic development. By establishing a scientific ecological management framework, policymakers can achieve economic growth while effectively protecting the environment. Striking a balance between ecological resource utilization and conservation, particularly during agricultural, urbanization, and industrialization processes, has become a critical factor for sustainable regional development. This study provides theoretical support for future ecological conservation policies and land use planning, particularly in addressing ecological degradation and achieving the dual goals of ecological and economic sustainability.
This study conducts an in-depth analysis of the impacts of LUCC on HQ in the Qin-Mang River Basin, revealing the complex interactions among urbanization, economic development, and ecosystem services. Theoretically, this study makes several significant contributions: firstly, it introduces a novel perspective to understand the relationship between LUCC and ecosystem services; secondly, by integrating natural ecological systems with socio-economic systems, the study expands the theoretical framework for evaluating HQ. This comprehensive analytical approach not only deepens the understanding of HQ dynamics but also provides a robust theoretical foundation for future research.
Future studies should further explore the interactions among driving factors, particularly their temporal and spatial dynamics. This will help reveal how various factors collectively influence HQ and ecosystem service functions across different regions and periods. Additionally, under the dual pressures of global land use and climate change, future research should investigate the feedback mechanisms between LUCC, climate change, and ecosystem services. Enhancing ecosystem service assessment models to accurately reflect the relationship between LUCC and ecological functions will also be a key focus for future research.
This study systematically analyzes the impact of land use transformation on HQ in the Qin-Mang River Basin using various methods and models. The main conclusions are as follows:
(1) Against the backdrop of rapid urbanization and economic development, the land use pattern in the study area has undergone significant changes. From 1992 to 2002, 2002 to 2012, and 2012 to 2022, the total land transfer area was 207.35 km2, 211.32 km2, and 182.56 km2, respectively, mainly characterized by the conversion of farmland and some forest land to built-up areas. Farmland area has been decreasing year by year, forest land has remained stable, and water areas have shown little change, overall remaining stable. The urbanization process has significantly intensified land use transformation, particularly the expansion of built-up areas.
(2) The InVEST model evaluation results show that the HQ index in the study area has declined year by year, from 0.3409 in 1992 to 0.2896 in 2022, with the habitat degradation index showing a slow decline. LUCC, particularly the expansion of built-up areas, are the main driving factors of HQ changes. As urbanization progresses, spatial differences in HQ have gradually increased, showing a more dispersed trend.
(3) The GeoDetector model reveals that five driving factors, including DEM, vegetation, annual average temperature, annual precipitation, and slope, significantly influence HQ changes. Although natural factors remain the dominant driving forces, as human activities intensify, the impact of LUCC on HQ has gradually surpassed natural factors. The reduction of forests and the expansion of built-up areas have accelerated the degradation of HQ.
(4) SAA shows that HQ in the study area exhibits significant positive spatial autocorrelation, indicating spatial clustering characteristics. Hotspot and cold spot analysis further reveals the spatial clustering patterns of high and low HQ areas, providing regional scientific evidence for future ecological protection and restoration.
In conclusion, this study deeply explores the interaction between LUCC and HQ, particularly under the dynamic changes of natural environmental and human activity driving factors. The research not only advances the development of ecological economics theory but also provides data support for policy making, especially in balancing economic development and ecological protection during urbanization, contributing to the achievement of sustainable regional ecosystem development goals.
This is an original research article, aiming to investigate the changes in habitat quality and their driving factors through the analysis of land use/land cover change data from 1992, 2002, 2012, and 2022. This study employs methods such as land use transfer matrix, the InVEST model, the GeoDetector model, and spatial autocorrelation analysis to provide a comprehensive analysis of habitat quality changes in the Qin-Mang River Basin.
The raw data supporting the conclusions of this article will be made available by the authors, without undue reservation.
JZ: Conceptualization, Data curation, Formal Analysis, Funding acquisition, Investigation, Methodology, Project administration, Resources, Visualization, Writing–original draft, Writing–review and editing. LW: Conceptualization, Data curation, Formal Analysis, Investigation, Methodology, Project administration, Software, Supervision, Writing–original draft, Writing–review and editing. DJ: Conceptualization, Data curation, Formal Analysis, Methodology, Software, Supervision, Validation, Writing–review and editing. YW: Conceptualization, Formal Analysis, Methodology, Supervision, Validation, Writing–review and editing.
The author(s) declare that financial support was received for the research, authorship, and/or publication of this article. This study was funded by the Henan Provincial Key R&D and Promotion Special Project (Science and Technology Tackling) (182102210066), the National Natural Science Foundation of China (51709115).
The authors would like to thank the reviewers and the editors for their profound comments, which helped us improve the quality of this paper.
The authors declare that the research was conducted in the absence of any commercial or financial relationships that could be construed as a potential conflict of interest.
The author(s) declare that no Generative AI was used in the creation of this manuscript.
All claims expressed in this article are solely those of the authors and do not necessarily represent those of their affiliated organizations, or those of the publisher, the editors and the reviewers. Any product that may be evaluated in this article, or claim that may be made by its manufacturer, is not guaranteed or endorsed by the publisher.
Alaniz, A. J., Carvajal, M. A., Fierro, A., Vergara-Rodríguez, V., Toledo, G., Ansaldo, D., et al. (2021). Remote-sensing estimates of forest structure and dynamics as indicators of habitat quality for Magellanic woodpeckers. Ecol. Indic. 126, 107634. doi:10.1016/j.ecolind.2021.107634
Anselin, L. (1995). Local indicators of spatial association—LISA. Geogr. Anal. 27 (2), 93–115. doi:10.1111/j.1538-4632.1995.tb00338.x
Bai, L., Xiu, C., Feng, X., and Liu, D. (2019). Influence of urbanization on regional habitat quality: a case study of Changchun City. Habitat Int. 93, 102042. doi:10.1016/j.habitatint.2019.102042
Chen, M., Bai, Z., Wang, Q., and Shi, Z. (2021). Habitat quality effect and driving mechanism of land use transitions: a case study of Henan water source area of the middle route of the south-to-north water transfer project. Land 10 (8), 796. doi:10.3390/land10080796
Chen, Y., Shan, B., and Yu, X. (2022). Study on the spatial heterogeneity of urban heat islands and influencing factors. Build. Environ. 208, 108604. doi:10.1016/j.buildenv.2021.108604
Costanza, R., d'Arge, R., De Groot, R., Farber, S., Grasso, M., Hannon, B., et al. (1997). The value of the world's ecosystem services and natural capital. nature 387 (6630), 253–260. doi:10.1038/387253a0
Ellis, E. C., Pascual, U., and Mertz, O. (2019). Ecosystem services and nature’s contribution to people: negotiating diverse values and trade-offs in land systems. Curr. Opin. Environ. Sustain. 38, 86–94. doi:10.1016/j.cosust.2019.05.001
Fang, Z., Ding, T., Chen, J., Xue, S., Zhou, Q., Wang, Y., et al. (2022). Impacts of land use/land cover changes on ecosystem services in ecologically fragile regions. Sci. Total Environ. 831, 154967. doi:10.1016/j.scitotenv.2022.154967
Feng, J. M., Li, C., and Feng, Y. F. (2024). Evolution of watershed habitat quality based on ISODATA spatial mosaic clustering: a case study of urban areas surrounding the Yellow River Basin in Henan Province. Chin. Landsc. Archit. 50 (4), 89–95.
Fu, B., Wang, S., Su, C., and Forsius, M. (2013). Linking ecosystem processes and ecosystem services. Curr. Opin. Environ. Sustain. 5 (1), 4–10. doi:10.1016/j.cosust.2012.12.002
Getis, A., and Ord, J. K. (1992). The analysis of spatial association by use of distance statistics. Geogr. Anal. 24 (3), 189–206. doi:10.1111/j.1538-4632.1992.tb00261.x
Gong, J., Liu, D., Zhang, J., Xie, Y., Cao, E., and Li, H. (2019). Tradeoffs/synergies of multiple ecosystem services based on land use simulation in a mountain-basin area, western China. Ecol. Indic. 99, 283–293. doi:10.1016/j.ecolind.2018.12.027
Guo, F. Y., Liu, X. H., Zhang, W. B., Xing, L. Y., Wang, R., Zu, P. Y. M., et al. (2024). Spatiotemporal pattern evolution and driving force analysis of habitat quality in the Yellow River Basin (Henan section) from 2000 to 2040. Mod. Geol. 38 (3), 599–611.
Hillard, E. M., Nielsen, C. K., and Groninger, J. W. (2017). Swamp rabbits as indicators of wildlife habitat quality in bottomland hardwood forest ecosystems. Ecol. Indic. 79, 47–53. doi:10.1016/j.ecolind.2017.03.024
Hu, J., He, R. H., Liu, N., and Ye, M. Y. (2022). Spatiotemporal evolution characteristics and influencing factors of habitat quality in Henan Province. J. Anhui Agric. Univ. 49 (6), 961–970.
Huang, J., Tang, Z., Liu, D., and He, J. (2020). Ecological response to urban development in a changing socio-economic and climate context: policy implications for balancing regional development and habitat conservation. Land Use Policy 97, 104772. doi:10.1016/j.landusepol.2020.104772
Huang, Y., Lin, T., Zhang, G., Jones, L., Xue, X., Ye, H., et al. (2022). Spatiotemporal patterns and inequity of urban green space accessibility and its relationship with urban spatial expansion in China during rapid urbanization period. Sci. Total Environ. 809, 151123. doi:10.1016/j.scitotenv.2021.151123
Li, Z., Sun, Z., Tian, Y., Zhong, J., and Yang, W. (2019). Impact of land use/cover change on Yangtze River Delta urban agglomeration ecosystem services value: temporal-spatial patterns and cold/hot spots ecosystem services value change brought by urbanization. Int. J. Environ. Res. Public Health 16 (1), 123. doi:10.3390/ijerph16010123
Liang, Y., Wang, B., Hashimoto, S., Peng, S., Yin, Z., and Huang, J. (2023). Habitat quality assessment provides indicators for socio-ecological management: a case study of the Chinese Loess Plateau. Environ. Monit. Assess. 195 (1), 101. doi:10.1007/s10661-022-10714-4
Liu, H. Y., Li, Z. F., and Bai, Y. F. (2006). Landscape simulating of habitat quality change for oriental white stork in Naoli River Watershed. Acta Ecol. Sin. 26 (12), 4007–4013.
Liu, Z., Chang, Y., Pan, S., Zhang, P., Tian, L., and Chen, Z. (2024). Unfolding the spatial spillover effect of urbanization on composite ecosystem services: a case study in cities of Yellow River Basin. Ecol. Indic. 158, 111521. doi:10.1016/j.ecolind.2023.111521
Long, H., Liu, Y., Hou, X., Li, T., and Li, Y. (2014). Effects of land use transitions due to rapid urbanization on ecosystem services: implications for urban planning in the new developing area of China. Habitat Int. 44, 536–544. doi:10.1016/j.habitatint.2014.10.011
Mace, G. M., Norris, K., and Fitter, A. H. (2012). Biodiversity and ecosystem services: a multilayered relationship. Trends Ecol. and Evol. 27 (1), 19–26. doi:10.1016/j.tree.2011.08.006
Meyfroidt, P. (2013). Environmental cognitions, land change, and social–ecological feedbacks: an overview. J. Land Use Sci. 8 (3), 341–367. doi:10.1080/1747423X.2012.667452
Moran, P. A. (1950). Notes on continuous stochastic phenomena. Biometrika 37 (1/2), 17–23. doi:10.2307/2332142
Nelson, E., Mendoza, G., Regetz, J., Polasky, S., Tallis, H., Cameron, D., et al. (2009). Modeling multiple ecosystem services, biodiversity conservation, commodity production, and tradeoffs at landscape scales. Front. Ecol. Environ. 7 (1), 4–11. doi:10.1890/080023
Oliveira, S. L., Flaspohler, D. J., Knowlton, J. L., and Wolfe, J. D. (2022). Do oil palm plantations provide quality habitat for migratory birds? A case study from Mexico. Ecol. Indic. 139, 108964. doi:10.1016/j.ecolind.2022.108964
Qiao, Q., Zhen, Z., Liu, L., and Luo, P. (2023). The construction of ecological security pattern under rapid urbanization in the Loess Plateau: a case study of Taiyuan city. Remote Sens. 15 (6), 1523. doi:10.3390/rs15061523
Qin, X., Yang, Q., and Wang, L. (2024). The evolution of habitat quality and its response to land use change in the coastal China, 1985–2020. Sci. Total Environ. 952, 175930. doi:10.1016/j.scitotenv.2024.175930
Qing, L., Yong, Z., Cunningham, M. A., and Tao, X. (2021). Spatio-temporal changes in wildlife habitat quality in the middle and lower reaches of the yangtze river from 1980 to 2100 based on the InVEST model. J. Resour. Ecol. 12 (1), 43–55. doi:10.5814/j.issn.1674-764x.2021.01.005
Sallustio, L., De Toni, A., Strollo, A., Di Febbraro, M., Gissi, E., Casella, L., et al. (2017). Assessing habitat quality in relation to the spatial distribution of protected areas in Italy. J. Environ. Manag. 201, 129–137. doi:10.1016/j.jenvman.2017.06.031
Sharp, R., Tallis, H. T., Ricketts, T., Guerry, A. D., Wood, S. A., Chaplin-Kramer, R., et al. (2018). InVEST 3.7.0 user’s guide. Standford, CA: The natural capital project. doi:10.13140/RG.2.2.32693.78567
Tang, F., Fu, M., Wang, L., Song, W., Yu, J., and Wu, Y. (2021). Dynamic evolution and scenario simulation of habitat quality under the impact of land-use change in the Huaihe River Economic Belt, China. PloS one 16 (4), e0249566. doi:10.1371/journal.pone.0249566
Tang, J., Zhou, L., Dang, X., Hu, F., Yuan, B., Yuan, Z., et al. (2023). Impacts and predictions of urban expansion on habitat quality in the densely populated areas: a case study of the Yellow River Basin, China. Ecol. Indic. 151, 110320. doi:10.1016/j.ecolind.2023.110320
Wang, J. F., and Xu, C. D. (2017). Geodetectors: principles and prospective. J. Geogr. 72 (1), 116–134.
Watson, K. B., Galford, G. L., Sonter, L. J., Koh, I., and Ricketts, T. H. (2019). Effects of human demand on conservation planning for biodiversity and ecosystem services. Conserv. Biol. 33 (4), 942–952. doi:10.1111/cobi.13276
Wu, Y., Zhu, X., Gao, W., and Qian, F. (2018). The spatial characteristics of coupling relationship between urbanization and eco-environment in the Pan Yangtze River Delta. Energy Procedia 152, 1121–1126. doi:10.1016/j.egypro.2018.09.136
Xu, Z., Chang, J., Wang, Z., Li, Z., Liu, X., Chen, Y., et al. (2024). Regional urban shrinkage can enhance ecosystem services—evidence from China’s rust belt. Remote Sens. 16 (16), 3040. doi:10.3390/rs16163040
Yang, H., Zhong, X., Deng, S., and Nie, S. (2022). Impact of LUCC on landscape pattern in the yangtze River Basin during 2001–2019. Ecol. Inf. 69, 101631. doi:10.1016/j.ecoinf.2022.101631
Yang, K., Han, Q., and de Vries, B. (2024). Urbanization effects on the food-water-energy nexus within ecosystem services: a case study of the Beijing-Tianjin-Hebei urban agglomeration in China. Ecol. Indic. 160, 111845. doi:10.1016/j.ecolind.2024.111845
Yang, W. X., Li, S. H., Peng, S. Y., Li, Y. X., Zhao, S. L., and Qiu, L. D. (2021). Identification of important biodiversity areas by InVEST model considering opographic relief: a case study of Yunnan Province, China. Ying Yong Sheng tai xue bao= J. Appl. Ecol. 32 (12), 4339–4348. doi:10.13287/j.1001-9332.202112.004
Zhang, D., Wang, J., Wang, Y., Xu, L., Zheng, L., Zhang, B., et al. (2022). Is there a spatial relationship between urban landscape pattern and habitat quality? Implication for landscape planning of the yellow river basin. Int. J. Environ. Res. Public Health 19 (19), 11974. doi:10.3390/ijerph191911974
Zhang, S., Wang, Y., Wang, Y., Li, Z., and Hou, Y. (2023). Spatiotemporal evolution and influencing mechanisms of ecosystem service value in the Tarim River Basin, Northwest China. Remote Sens. 15 (3), 591. doi:10.3390/rs15030591
Zhang, X., Zhou, J., Li, G., Chen, C., Li, M., and Luo, J. (2020). Spatial pattern reconstruction of regional habitat quality based on the simulation of land use changes from 1975 to 2010. J. Geogr. Sci. 30, 601–620. doi:10.1007/s11442-020-1745-4
Keywords: land use transition, habitat quality, driving mechanisms, spatial autocorrelation analysis, InVEST model
Citation: Zhao J, Wang L, Jia D and Wang Y (2025) Study on the effects of land use transformation on habitat quality and its driving mechanisms: a case study of the Qin-Mang River Basin. Front. Environ. Sci. 13:1505178. doi: 10.3389/fenvs.2025.1505178
Received: 03 October 2024; Accepted: 14 January 2025;
Published: 29 January 2025.
Edited by:
Merja H. Tölle, University of Kassel, GermanyReviewed by:
Voltaire Alvarado Peterson, University of Concepcion, ChileCopyright © 2025 Zhao, Wang, Jia and Wang. This is an open-access article distributed under the terms of the Creative Commons Attribution License (CC BY). The use, distribution or reproduction in other forums is permitted, provided the original author(s) and the copyright owner(s) are credited and that the original publication in this journal is cited, in accordance with accepted academic practice. No use, distribution or reproduction is permitted which does not comply with these terms.
*Correspondence: Luyao Wang, ejIwMjIxMDAxMDA3NUBzdHUubmN3dS5lZHUuY24=
Disclaimer: All claims expressed in this article are solely those of the authors and do not necessarily represent those of their affiliated organizations, or those of the publisher, the editors and the reviewers. Any product that may be evaluated in this article or claim that may be made by its manufacturer is not guaranteed or endorsed by the publisher.
Research integrity at Frontiers
Learn more about the work of our research integrity team to safeguard the quality of each article we publish.