- 1School of Arts and Communication, China University of Geosciences, Wuhan, China
- 2School of Civil Engineering and Architecture, Wuhan Institute of Technology, Wuhan, China
Achieving synergistic effects in pollution reduction and carbon mitigation is a major national strategy for China. Given the common origins and processes of air pollutants and greenhouse gases, this study constructs a theoretical framework for the study of the synergistic effects of air pollution and carbon emissions. Based on the coupling coordination degree model and the geographically and temporally weighted regression model, it identifies significant factors influencing the synergistic effects of air pollution and carbon emissions and their varying mechanisms of action. Results are as follows: 1) The spatial and temporal trends of PM2.5 pollution and carbon emissions in the Wuhan metropolitan area exhibit homogeneity. The coupling coordination degree between air pollution and carbon emissions shows an initial increase followed by a decrease over time and a spatial pattern of “local clustering of areas with medium–high-level coupling coordination”. 2) Twelve factors significantly impact the synergistic effects of air pollution and carbon emissions at the county level in the Wuhan metropolitan area: number of inversion days, precipitation, temperature, vegetation coverage, number of green patents, total population, regional GDP, per capita regional GDP, proportion of secondary industry, total nighttime light, energy consumption efficiency and built-up area. 3) The impact intensity of these factors on the synergistic effects of air pollution and carbon emissions varies not only over time but also across different regions within the same year. Regions with strong impact forces shift over time. This manuscript provides a solid foundation for theoretical research on and practical strategies for advancing differentiated pollution reduction and carbon mitigation coordination.
1 Introduction
Under the guidance of the development goals of the new era, global and China’s environmental protection strategies are needed. With the increasingly severe global climate change, countries around the world face the urgent task of addressing the challenge of carbon emissions. As a member of the international community, China actively fulfils its international responsibilities. In September 2020, China proposed the goal of “striving to peak carbon dioxide emissions by 2030 and achieving carbon neutrality by 2060”, making a significant contribution to global climate governance.
The feasibility of coordinated efforts in pollution and carbon reduction lies in the fact that environmental pollutants and greenhouse gas emissions essentially originate from the same processes. They share similar sources, such as fossil fuel consumption, industrial production, transportation and residential activities, and exhibit consistency in terms of emission time and space. Accordingly, pollution and carbon reduction can target the same control objects, enabling coordinated progress in many aspects. Reviewing the research achievements in the field of pollution and carbon reduction, we find that scholars domestically and internationally have conducted extensive research on PM2.5 pollution and carbon emissions. These studies cover various dimensions, including spatiotemporal distribution characteristics (Wang et al., 2013; Guan et al., 2014; Peng et al., 2016; Gregg et al., 2009; VandeWeghe and Kennedy, 2007; Wang et al., 2017), influencing factors (Kola and Ganda, 2024; Zhang et al., 2019; Nam et al., 2014; Cheng et al., 2017; Talukdar and Meisner, 2001; Jiang et al., 2018), policy research (Andrée et al., 2019; Yue et al., 2020; Luo et al., 2018; Pal and Mitra, 2017) and source apportionment (Wei et al., 2021; Thurston et al., 2011; Wu et al., 2018; Geng et al., 2013; Coelho et al., 2022; Wang et al., 2006). Preliminary theoretical system and research paradigm have been formed in the field of PM2.5 and carbon emission research, and practical applications have been implemented at national, provincial, prefectural and county levels. These achievements provide a solid theoretical foundation and practical support for pollution control and the attainment of carbon neutrality goals in China.
Existing research primarily investigates the spatiotemporal distribution characteristics of PM2.5 on various scales, including national, provincial, city, river basin and urban agglomeration levels. Most studies indicate that PM2.5 pollution is influenced by a combination of meteorological and socioeconomic factors (Lim et al., 2020; Ji et al., 2018; Yang et al., 2018; Xu et al., 2020; Ding et al., 2019; Wu et al., 2020; Lin et al., 2013). In 2021 Guo et al. (2021) explored the spatial evolution trends and influencing factors of PM2.5 in the cities of the Yangtze River Delta using methods such as spatial autocorrelation, standard deviational ellipse and panel regression models. They found that from 2000 to 2017, the spatiotemporal heterogeneity of PM2.5 in such cities was the result of the cumulative effects of various factors, with socioeconomic factors being the predominant ones. Yun et al. (2019) focused on meteorological elements and studied the impact of factors such as wind direction, air pressure, temperature and humidity in the Yangtze River Delta region on PM2.5.
Most studies analyse the spatiotemporal distribution differences and influencing factors of carbon emissions, primarily focusing on national, provincial and city scales. Research on carbon emissions on a microscale is lacking, mainly due to the difficulty in obtaining data for smaller administrative regions. The influencing factors of carbon emissions mainly include socioeconomic factors (population density, government fiscal expenditure, economic development, production efficiency, industrial structure, labour force, etc.), energy factors (energy structure, energy intensity, etc.), land use factors (land use scale, structure, spatial patterns, etc.), green technology innovation (green patents, regional innovation index, etc.) and transportation usage (public transportation, fuel-powered vehicles, electric vehicle ownership, etc.).
Currently, research on the spatiotemporal distribution and influencing factors of coordinated pollution and carbon reduction is still relatively scarce domestically and internationally. Many studies exploring the common roots and origins of these two aspects use spatial regression models to examine the influencing factors of air pollution and carbon emissions separately and then identify common factors to validate their shared origins empirically. A few studies have utilised coupling coordination models to assess the synergistic effects of pollution and carbon reduction. These studies have found that energy consumption, land use, urbanisation, economic and industrial structure and transportation networks significantly influence the coordination effects of pollution and carbon reduction. Tang et al. (2019) analysed the spatiotemporal characteristics and influencing mechanisms of the synergistic effects of pollution and carbon reduction in 30 provinces in China from 2011 to 2019. They used a coupling coordination model to analyse the spatiotemporal characteristics of these effects in different regions and a spatiotemporal geographically weighted regression (GWR) model to analyse the spatial evolution and mechanisms of influencing factors. The study concluded that total energy consumption, energy consumption intensity and energy consumption structure are major influencing factors of the synergistic effects. Wang et al. (2023), from the perspective of spatial spillover, found that the spatial clustering and co-occurrence of carbon emissions and air pollution exhibit similarities, showing strong spatial lock-in and path dependence. The clustering of carbon emissions and pollution demonstrates significant spatial spillover effects, manifesting a “beggar-thy-neighbor” effect on adjacent regions. Liu et al. (2022) studied the synergistic effects of pollution and carbon reduction in Tianjin, finding that the primary sources of air pollution and greenhouse gas emissions are industrial sources. To achieve a high level of synergistic effects, Tianjin must reasonably control urbanisation rates, population size and regional GDP, increase the share of tertiary and high-tech industries and continuously reduce energy intensity. Xian et al., (2024) found that the implementation of China’s current emission reduction policies has significantly reduced major air pollutants and slowed the growth rate of CO₂ emissions. The synergistic effects of carbon reduction and pollution reduction policies vary across different sectors, with pollution reduction policies having a stronger suppressive effect on controlling air pollution and carbon emissions.
However, in the face of the challenges of air pollution prevention and control in China and the dual pressure of achieving carbon peaking and neutrality, the need for synergistic and efficient governance of pollution and carbon reduction is particularly urgent. Existing research on the synergy of pollution and carbon reduction is still insufficient, with most studies focusing on policy formulation and pathway exploration (Bai et al., 2022; Dong et al., 2022; Xian et al., 2024; Nam et al., 2014; Chen X. H. et al., 2023), lacking comprehensive analysis of the differences and driving factors of regional air pollution and carbon emissions in spatiotemporal distribution. Moreover, most studies are conducted at the agglomeration or provincial levels (Zhu et al., 2023; Chen X. et al., 2023; Jiang et al., 2023; Chen S. et al., 2023; Xian et al., 2024), with limited research at the county level. Consequently, the suggestions put forward are mostly based on macrolevel coordination and control, which cannot meet the differentiated and individual requirements of policy implementation at the county level, thus failing to effectively achieve the synergistic and efficient governance of pollution and carbon reduction.
Therefore, based on the current state of pollution reduction and carbon mitigation research, this study aims to explore the synergistic effects of pollution and carbon within a coupled system framework. Employing spatiotemporal data mining techniques, coupling coordination models and the geographically and temporally weighted regression (GTWR) model, we analyse the spatiotemporal evolution characteristics and key drivers of these synergistic effects at a county level within the Wuhan metropolitan area. Specifically, we aim to identify critical areas and differing influencing factors, such as meteorology and climate, population and economic dynamics, land use, nighttime light emissions and green patents. The findings will provide theoretical support and practical guidance for implementing differentiated strategies for pollution reduction and carbon mitigation across the regions within the Wuhan metropolitan area.
2 Materials and methods
2.1 Study area
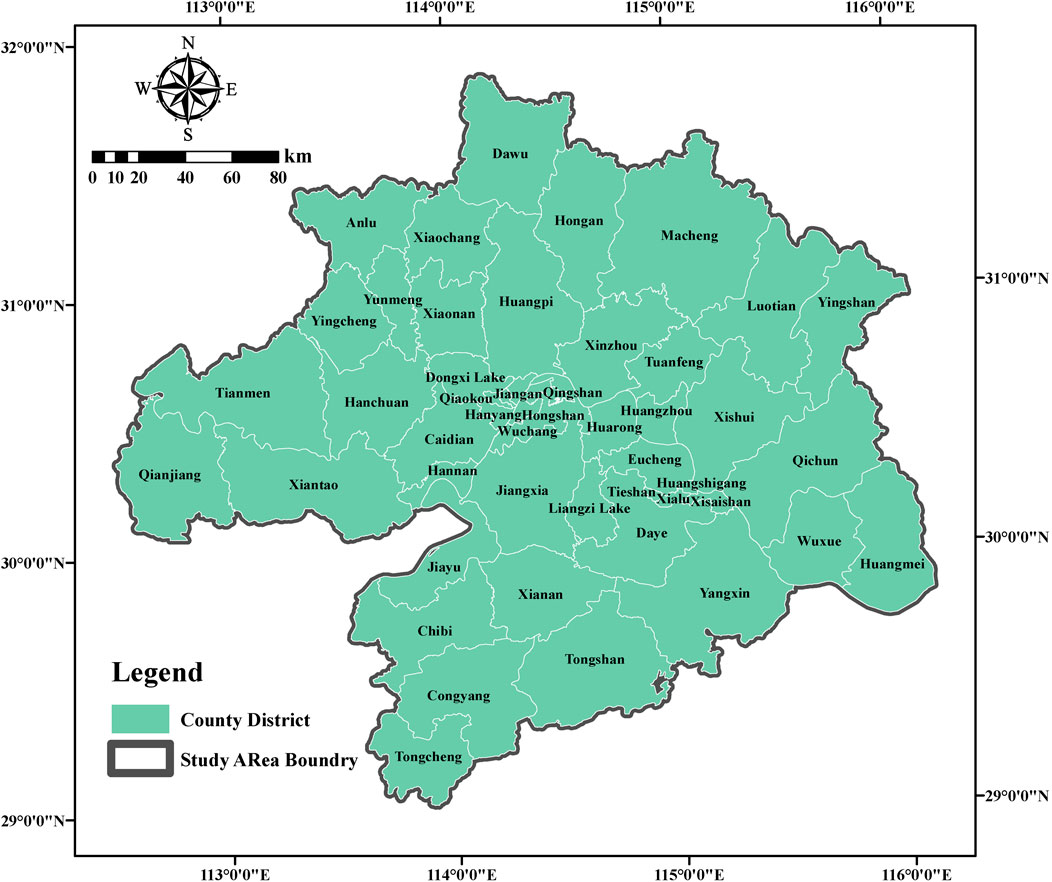
The Wuhan metropolitan area (Figure 1) is the largest city cluster in “central China”, located in its economic hinterland, focusing on domestic demand. With its exemplary economic development, the Wuhan metropolitan area serves as an important carrier for central China to undertake the integrated development of the Yangtze River Delta and a strategic link for the delta to drive the upper reaches of the Yangtze River and even the vast central and western parts of China. Furthermore, as the centre of the superposition of the Yangtze River Economic Belt and the rise of the central part of two national strategic regions, it is an important growth pole of China. Whether from the point of view of economy or strategic position, the Wuhan metropolitan area has a strong regional linkage and a national support role and is a key node and an important pivot point in the construction of a new development pattern.
From an ecological perspective, the Wuhan metropolitan area is a core region of the middle Yangtze River urban agglomeration, bearing significant responsibility for the protection of the Yangtze River. The Wuhan metropolitan area faces multiple environmental pressures, including air pollution, water pollution, soil contamination, and solid waste management, while also being affected by climate change impacts such as extreme weather and flooding. Promoting the coordinated and synergistic effects of pollution reduction and carbon reduction will help improve the ecological environment quality of the Wuhan metropolitan area, protect and restore the Yangtze River ecosystem, enhance urban climate resilience, and create a green, livable environment for residents.
2.2 Theoretical framework
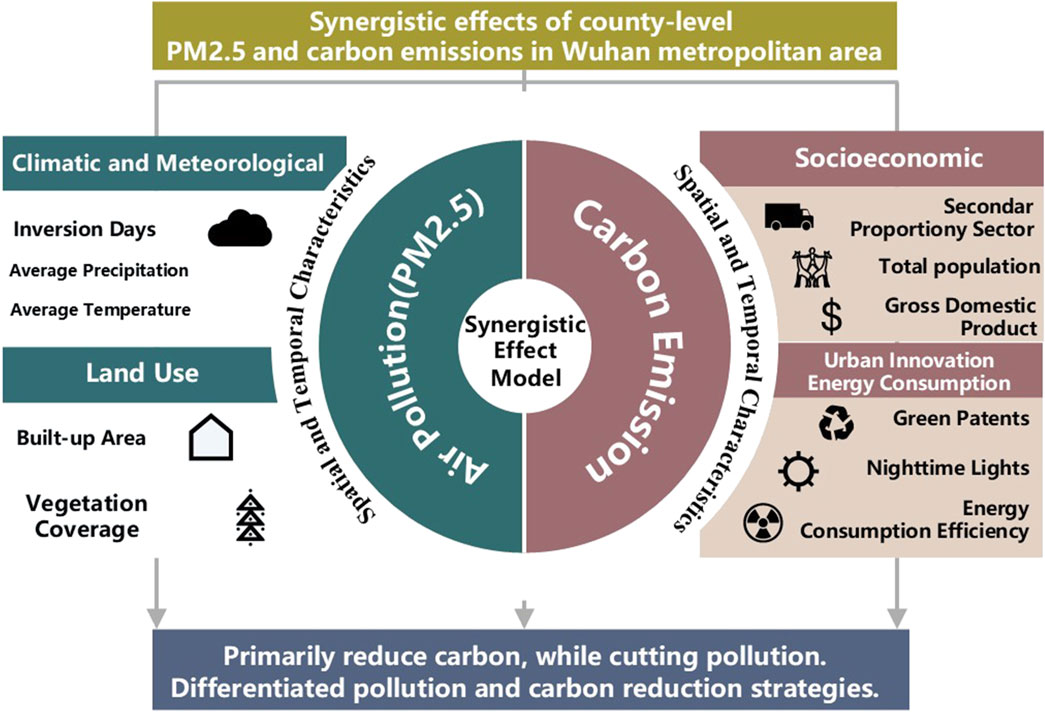
In the context of global climate change and China’s “carbon peak and carbon neutrality” goals, this study focuses on the synergistic effects of pollution reduction and carbon emissions mitigation at the county level within the Wuhan metropolitan area (Figure 2). By analyzing the homology and synergy between pollution and carbon emissions, and drawing on existing research concerning the spatiotemporal distribution characteristics and influencing factors (such as climate, economy, land use, and green technology), this study employs global spatial autocorrelation tests and the GTWR model to explore the spatiotemporal evolution and driving factors of synergy within this region. The research aims to provide a foundation for the development of differentiated pollution and carbon reduction strategies for each county, thereby enhancing the practical application of theoretical insights and the scientific basis of local policies.
2.3 Research methods
2.3.1 Synergistic effect model
To effectively evaluate the synergistic effects and development status of the two subsystems of carbon emissions and atmospheric pollutant emissions, this study employs the coupling coordination degree model. This model reveals the coordination differences amongst different regions in terms of CO2 reduction and PM2.5 control. Based on the methodology of Wang et al. (2021), the model has been further optimised to enhance its predictive accuracy and practicality. The specific calculation steps of the model are as follows (Formulas 1–3):
where U1 represents the level of the atmospheric pollutant system, expressed by the standardised value of pollutant emission concentration; U2 indicates the level of the carbon reduction system, expressed by the standardised value of carbon emissions. Standardisation is applied to eliminate the impact of different dimensions. In this model, C represents the coupling degree between the two systems, and T denotes a comprehensive coordination index. Parameters a and b are adjustable weight coefficients. This research assumes that carbon reduction and air pollution control are equally important processes, so a = b = 0.5 is set. D represents the degree of coupling coordination between the two systems, with a value range from 0 to 1. A value of D approaching 1 indicates good coordination between the carbon reduction and air pollution control systems, signifying significant synergistic effects. Conversely, a value of D approaching 0 suggests poor coordination between the two systems and weak synergistic effects. The rating standards for coupling degree C and coupling coordination degree D are based on the research of Wang et al. (2021).
2.3.2 Global spatial autocorrelation test
This study aims to verify whether a spatial correlation exists in the synergistic effects between PM2.5 and carbon emissions. The global Moran’s index (Moran’s I) is used as the tool for detecting global spatial autocorrelation. The specific calculation formula is as follows (Formula 4):
where N represents the number of research subjects,
2.3.3 Spatiotemporal GWR model
The GWR model performs localised regression analysis on spatial cross-sectional data, allowing the identification of spatial heterogeneity within spatial data. However, this model primarily focuses on the spatial nonstationarity of sample data and does not adequately consider the nonstationarity of time series, which may limit its effectiveness and accuracy in modelling and predicting actual economic activities. Therefore Huang et al. (2010), introduced temporal characteristics into the original GWR model, constructing a spatiotemporal GWR (i.e., GTWR) model that considers temporal and spatial nonstationarities.
By processing panel data, this model can effectively reduce model error and parameter estimation error. The formula is as follows (Formula 5):
where
where
The selection of bandwidth affects the establishment of spatiotemporal weights. The corrected Akaike information criterion (AICc) is used to adopt an adaptive bandwidth.
2.4 Data sources
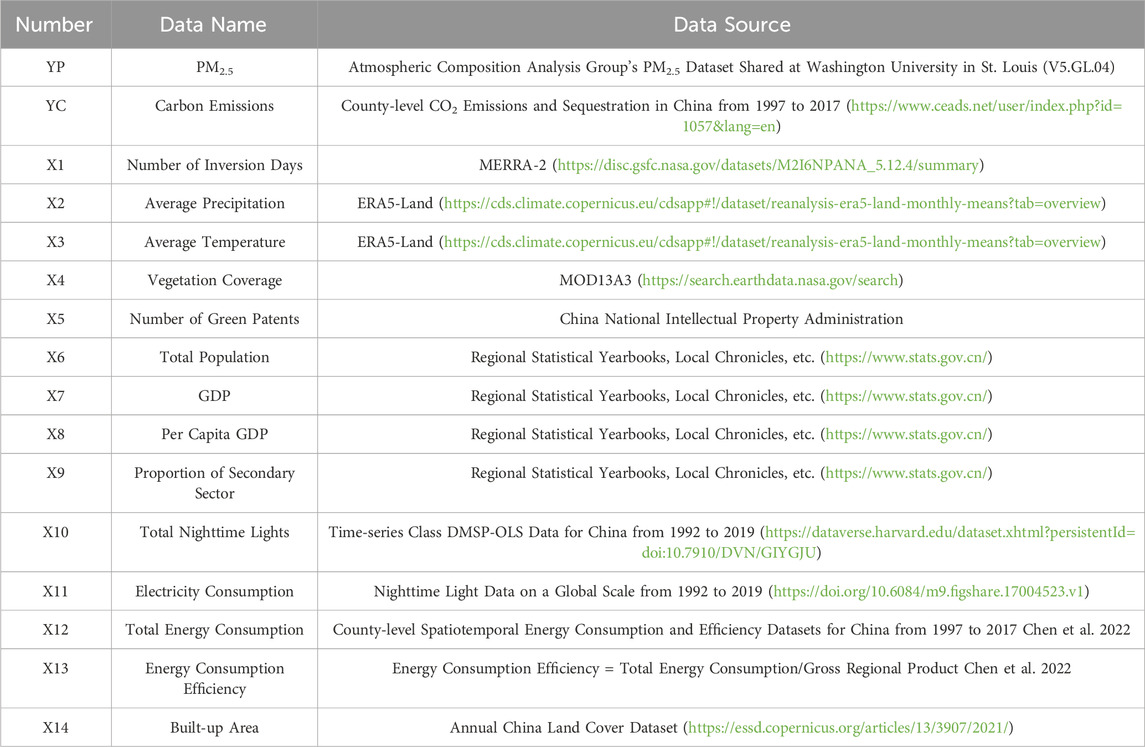
The data sources for this study are mainly divided into the following parts (Table 1):
This study uses the PM2.5 dataset shared by the Atmospheric Composition Analysis Group at Washington University in St. Louis (Canada Dalhousie University Atmospheric Composition Analysis Group PM2.5 dataset). It also utilises the county-level carbon emission data for China from 1997 to 2017 provided by the China Emission Accounts and Datasets. Specifically, it employs the carbon emission data for the 48 county-level units in the Wuhan metropolitan area from 2000 to 2017.
Natural environment data include the number of inversion days, average precipitation, average temperature and vegetation cover. Socioeconomic data consist of total population, GDP, per capita GDP, the proportion of secondary industry, the number of green patents, total nighttime light, electricity consumption, built-up area, total energy consumption and energy consumption efficiency. For administrative boundary data, according to the National Administrative Division Inquiry Platform of the Ministry of Civil Affairs, the administrative boundaries of the county-level units in the Wuhan metropolitan area have not changed since 2000. Therefore, this research uses the 1:1,000,000-scale public basic geographic information data (2021) provided by the National Geographic Information Resources Catalogue Service System as the source for county-level administrative boundary data.
2.5 Technology roadmap
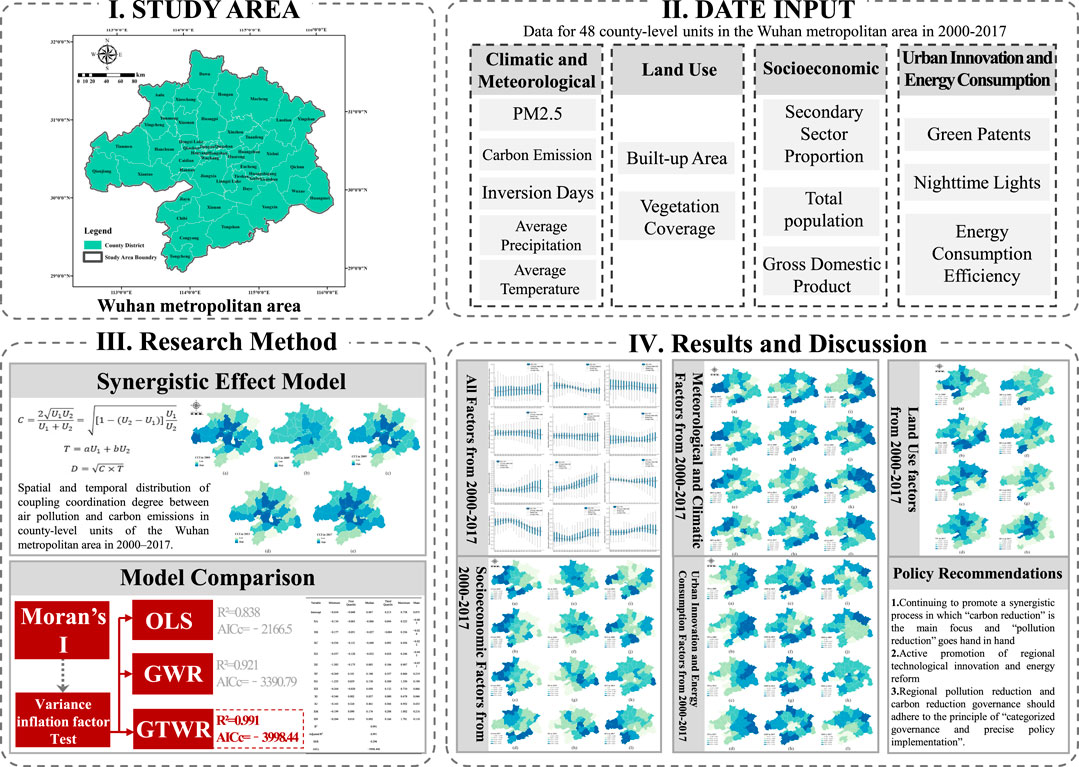
Existing county-level research is limited, failing to address the diverse needs of micro-scale policy implementation. The Wuhan Metropolitan Area, central China’s largest urban cluster, faces significant environmental pressures, including air, water, and soil pollution, as well as waste management challenges. Therefore, this study selects the Wuhan Metropolitan Area as the research object. By analyzing the homology and synergy between pollution and carbon emissions, along with their spatiotemporal distribution characteristics and influencing factors (e.g., climate, economy, land use, and green technology), this study compares the fitting performance of multiple regression models. A global spatial autocorrelation test and a GTWR (Geographically and Temporally Weighted Regression) model are employed to explore the spatiotemporal evolution and influencing factors of pollution and carbon emissions. Finally, the study identifies the trends in regression coefficients of various influencing factors from 2000 to 2017 and analyzes the spatiotemporal heterogeneity of four part factors—climate, economy, land use, and technological innovation—between 2005 and 2017. Based on these findings, the study proposes control strategies and policy recommendations tailored to the county-level scale (Figure 3).
3 Analysis and results
3.1 Spatiotemporal characteristics of the coupling coordination degree between air pollution and carbon emissions in the Wuhan metropolitan area
On the basis of the coupling coordination degree calculation methods (Formulas 1–3), this study calculates the coupling coordination index (D), coupling index (C) and coordination index (T) for PM2.5 pollution and CO2 emissions in the Wuhan metropolitan area from 2000 to 2017. The coordination coupling levels are preliminarily classified as follows: 0–0.3 for low, 0.3–0.7 for moderate and 0.7–1 for high. Here, U1 and U2 represent the normalised data for PM2.5 concentration and CO2 emissions, respectively, with a range of [0–1].
According to Figure 4, the temporal variation characteristics of the coupling coordination degree between air pollution and carbon emissions (D) in the Wuhan metropolitan area from 2000 to 2017 can be divided into two main phases: an increasing phase and a decreasing phase.
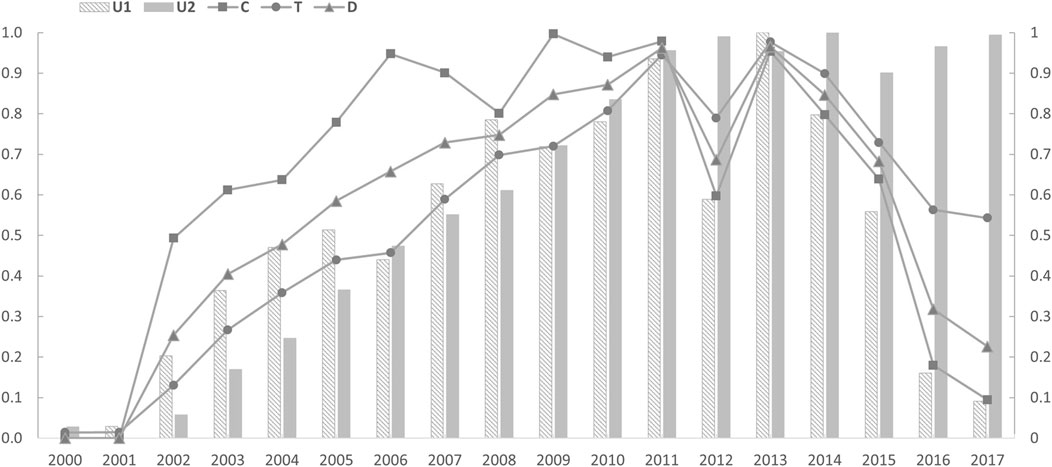
Figure 4. Spatiotemporal characteristics of the coupling coordination degree between air pollution and carbon emissions in the Wuhan metropolitan area (2000–2017).
The first phase, from 2000 to 2011, saw an increase in the coupling coordination degree between PM2.5 pollution and CO2 emissions. It rose from a low-intensity low-coupling state in 2000 to a high-intensity high-coupling state in 2011, with the D value reaching 0.962. During this period, the coupling degree was consistently higher than the coordination degree, indicating that the levels of air pollution and carbon emissions were in a state of coordinated development but with a relatively low intensity. Specifically, the coupling degree reached 0.948, 0.997 and 0.979 in 2006, 2009 and 2011, respectively, showing that the coupling coordination degree between air pollution and carbon emissions was highest in these years, with the two intensities being closest. Meanwhile, the coordination degree steadily increased, reaching 0.946 in 2011, indicating an overall rise in the coordination strength as carbon emissions and PM2.5 concentrations continued to rise.
The second phase spanned from 2013 to 2017, during which the coupling coordination degree between PM2.5 pollution and CO2 emissions continuously decreased, transitioning from high intensity and high coupling in 2013 to medium intensity and low coupling in 2017. The coupling coordination index dropped to 0.226, indicating that during this period, the coordination level was higher than the coupling level, and the rate of decline in coupling was much greater than that in coordination. In 2017, the coordination level reached a moderate level at 0.543, whilst the coupling level dropped to a low level at 0.094. That is, a significant misalignment in the air pollution and carbon emission coupling occurred during this time, with a rapid increase in the disparity between their intensities, specifically characterised by stable CO2 emissions and a rapid decrease in PM2.5 pollution concentrations.
3.2 Analysis of the spatiotemporal evolution characteristics of the air pollution and carbon emission synergistic effects at a county level
To investigate the synergistic evolution of air pollution and carbon emissions at a county level in the Wuhan metropolitan area, this study refers to the findings of Wang et al. (2021) and performs detailed rating and grouping of the coupling coordination degree (with high levels indicating great coupling and coordination between the air pollution and carbon emission systems, i.e., small differences and high emission intensity between the systems). The changes in the coupling coordination degree between PM2.5 pollution and CO2 emissions at the county level from 2000 to 2017 are analysed separately.
From the spatiotemporal distribution of the coupling coordination degree between PM2.5 pollution and CO2 emissions for county-level units in the Wuhan metropolitan area from 2000 to 2017 (Figure 5), most counties were at a moderate coupling coordination level. In 2000, 65% of counties were at this moderate level, and the proportion decreased to 60% in 2007.
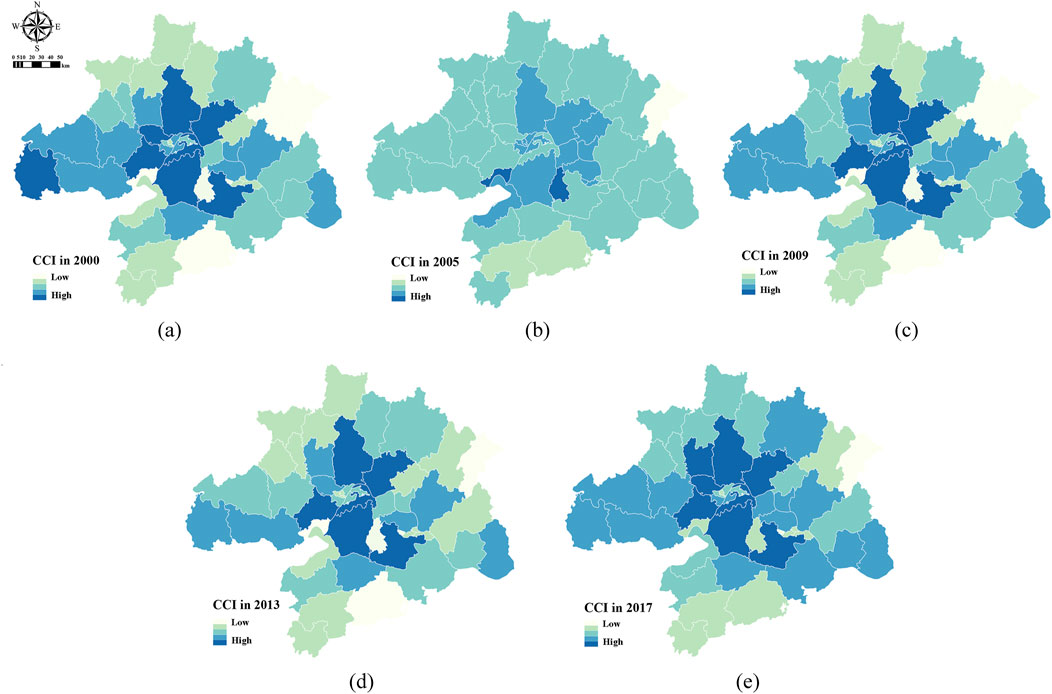
Figure 5. Spatial and temporal distribution of coupling coordination degree between air pollution and carbon emissions in county-level units of the Wuhan metropolitan area in 2000–2017. CCI, the coupling coordination degree between air pollution and carbon emissions. (A–E), from 2000 to 2017.
The areas with the highest coupling coordination degree between PM2.5 pollution and CO2 emissions were primarily concentrated within the Wuhan urban area. Hongshan District consistently maintained the highest level of coupling coordination from 2000 to 2017, indicating that the PM2.5 pollution concentration and carbon emissions in Hongshan District were not only higher than those in other areas but also highly synchronised.
The analysis of the coupling coordination degree between PM2.5 pollution and CO2 emissions for county-level units outside Wuhan reveals that the levels of coordination varied significantly. Counties with moderate to high coupling coordination levels were predominantly located in economically developed and densely populated areas. However, the specific characteristics and interannual variations of the coupling coordination degree between air pollution and carbon emissions differed amongst these units, indicating that the synergistic effects of pollution and carbon were influenced by various factors.
3.3 Analysis of the influencing factors based on GTWR
Based on Moran’s I test results from Stata software, the global Moran’s I index for the synergistic effect of air pollution and carbon emissions in the Wuhan metropolitan area during the study period was positive and generally remained around 0.21, with minimal fluctuations. This result indicates that the spatial aggregation of the synergistic effect was stable. The normality statistic Z-values all passed the 0.01 significance level test (P < 0.01), suggesting a significant spatial autocorrelation in the coupling coordination index of the synergistic effect of air pollution and carbon emissions in the Wuhan metropolitan area during the study period.
The previous section provided a preliminary explanation of the data indicators used in this study. Coupling coordination degree is employed as the dependent variable, with 14 potential explanatory variables considered. Variance inflation factor (VIF) is a statistical measure used to detect multicollinearity in regression analysis. Multicollinearity occurs when two or more independent variables in a regression model are highly correlated. After collinear indicators are excluded, 12 indicators are integrated into the model (Table 2): temperature inversion days, precipitation, temperature, vegetation coverage, number of green patents, total population, GDP, per capita regional GDP, proportion of secondary industry, total nighttime lights, energy consumption efficiency and built-up area.
3.3.1 Model construction and comparison
Based on the previous spatial correlation analysis results, the synergistic effects of PM2.5 and CO2 emissions in different regions of the Wuhan metropolitan area exhibited significant spatial heterogeneity. Ignoring such spatial differences in subsequent analyses could compromise the accuracy of the research findings. Therefore, this study employs the GTWR model to conduct an in-depth investigation into the factors influencing the intensity of the synergistic effects of PM2.5 pollution and CO2 emissions in the Wuhan metropolitan area from 2000 to 2017.
On the basis of the above dependent and independent variables, this research constructs Ordinary Least Squares (OLS) regression, GWR and GTWR models. The reasonableness of the selected GTWR model is validated by comparing the estimation results of the three regression models.
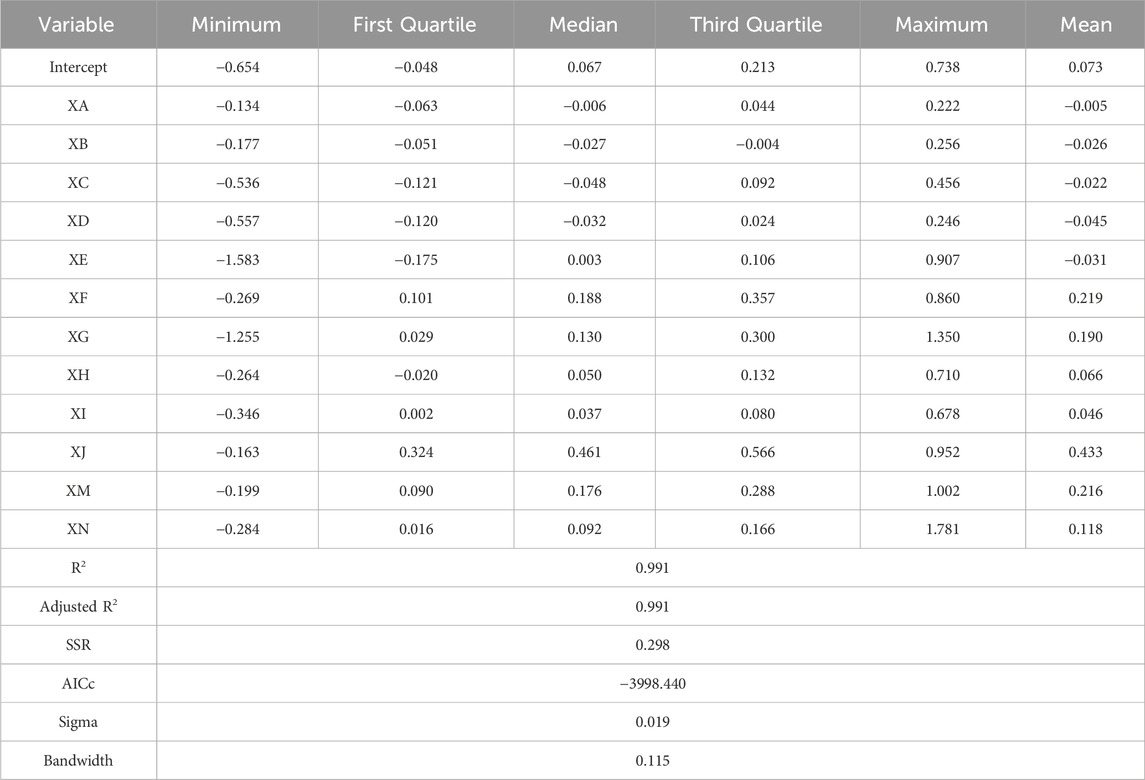
The results of the OLS, GWR and GTWR models for analysing the factors affecting the PM2.5–CO2 synergistic effect in county-level units of the Wuhan metropolitan area are shown in Table 3. The OLS model has an R2 of 0.838 and an adjusted R2 of 0.837, which indicates the lowest fit amongst the three models. The OLS model can only represent the variable relationships at a global average level, ignoring the spatial nonstationarity between different regions, and thus cannot effectively capture local features. The GWR model, which accounts for spatial nonstationarity, has an R2 of 0.921 and an adjusted R2 of 0.922, indicating a better fit compared with the OLS model. The GTWR model, which considers spatial and temporal nonstationarities, has an R2 of 0.991 and an adjusted R2 of 0.991, significantly outperforming the OLS and GWR models. Additionally, the GTWR model has the lowest AICc value of −3,998.44, further demonstrating that the GTWR model, which accounts for spatiotemporal nonstationarity, is the optimal choice. Therefore, this study uses the GTWR model to analyse the spatiotemporal heterogeneity of factors influencing the air pollution and carbon emission synergistic effect in county-level units.
3.3.2 GTWR statistical description
Through regression analysis, this research evaluates the impact of different factors on the strength of the PM2.5 pollution and CO2 emission synergistic effect in various county-level units within the Wuhan metropolitan area at different times. To provide a detailed statistical description of the GTWR model coefficients, we use the following metrics: minimum value, first quartile (Q1), median (Q2), third quartile (Q3), maximum value and mean value. These metrics help understand the distribution and central tendencies of the regression coefficients for different factors affecting the spatiotemporal coupling and coordination of air pollution and carbon emissions.
Based on Table 4, various factors, such as temperature inversion days, average precipitation, average temperature, vegetation coverage, number of green patents, total population, GDP, per capita GDP, proportion of secondary sector, total nighttime lights, energy consumption efficiency and built-up area, exhibited different effects on the PM2.5 and CO2 emission coupling coordination strength of the county-level units in the Wuhan metropolitan area over different periods. For specific single influencing factors, their impact on the coupling coordination strength showed significant variability in time and space dimensions.
Specifically, temperature inversion days, average precipitation, average temperature, vegetation coverage and number of green patents had negative average values, suggesting that these five indicators generally exerted a negative effect on the coupling coordination strength. Amongst them, vegetation coverage and green patents had the most significant negative impacts, with average regression coefficients of −0.045 and −0.031, respectively. By contrast, total population, GDP, per capita GDP, proportion of secondary sector, total nighttime lights, energy consumption efficiency and built-up area demonstrated positive average coefficients. Amongst these factors, total nighttime lights had the highest coefficient at 0.433, followed by total population and energy consumption efficiency with coefficients of 0.219 and 0.216, respectively. The proportion of secondary sector had the lowest positive coefficient of 0.046.
Regarding maximum values, the factors with the most significant positive effects on the coupling coordination strength were built-up area, GDP and energy consumption efficiency, with coefficients of 1.781, 1.350 and 1.002, respectively. Conversely, the most significant negative effects came from green patents, GDP and vegetation coverage, with regression coefficients of −1.583, −1.255 and −0.557, respectively.
These results indicate that different factors could have positive and negative impacts on the coupling coordination strength of PM2.5 pollution and CO2 emissions. Additionally, the effects of these factors varied significantly across different times and locations. Therefore, this research will adopt a comprehensive approach that incorporates temporal and spatial dimensions to systematically explore how these factors differentially influence the strength of coupling coordination between air pollution and carbon emissions under varying conditions.
4 Discussion
4.1 Temporal trends of GTWR regression coefficients for influencing factors
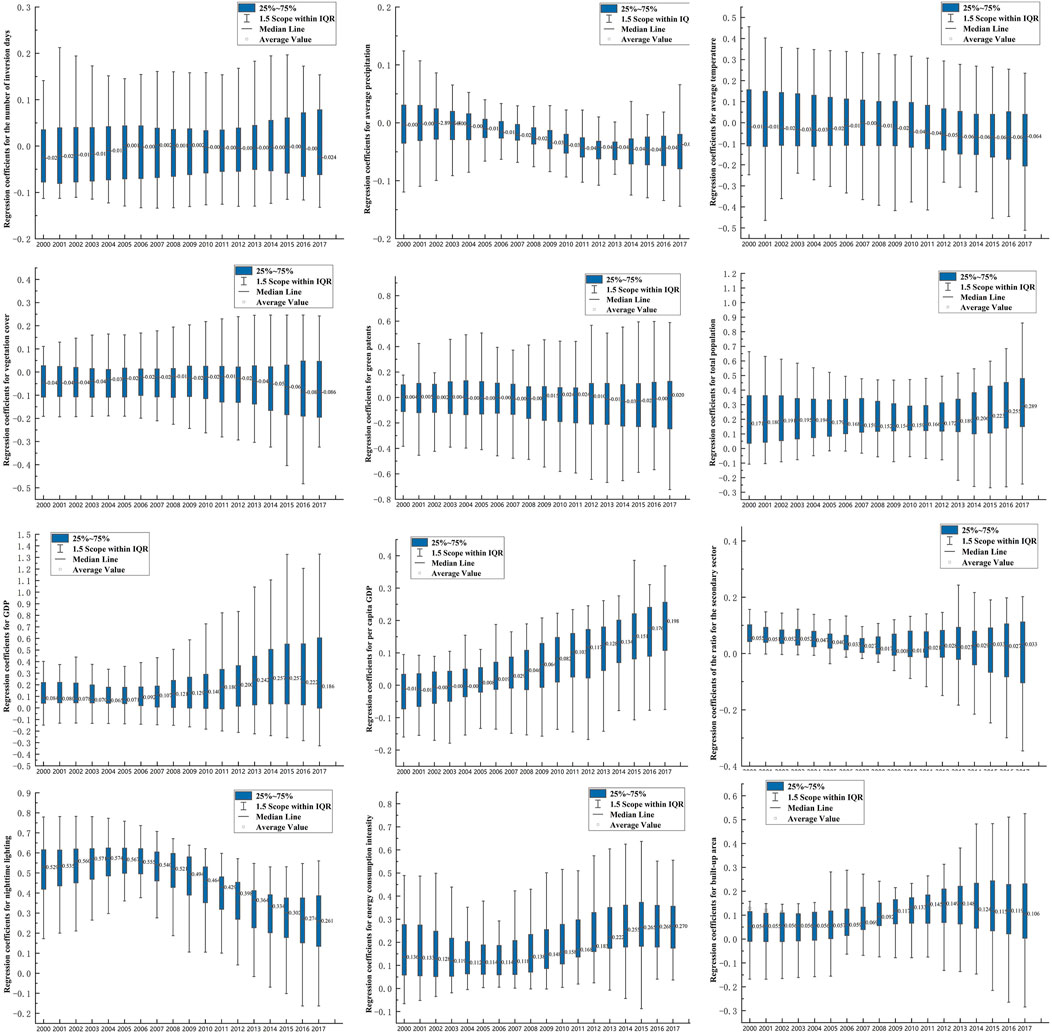
Figure 6 illustrates the time variation trends of the regression coefficients for different influencing factors through box plots.
Regarding specific factors, the effect of temperature inversion days on the strength of PM2.5 pollution and CO2 emission coupling showed a minimal fluctuation over time. The regression coefficients were positive and negative with stable dispersion, manifesting that the differences in the impact of temperature inversion days across regions were relatively stable and did not change significantly over time.
The regression coefficients for average precipitation gradually decreased over time, with the mean coefficient dropping from −0.001 in 2000 to a minimum of −0.04 in 2016. At the same time, the dispersion of the coefficients initially decreased and then increased. That is, the negative impact of average precipitation on the PM2.5 pollution and CO2 emission coupling effect gradually intensified, with the spatial differences first decreasing and then increasing.
The dispersion of the regression coefficients for average temperature remained relatively stable, but the overall values decreased year by year, indicating that the negative impact of average temperature on the air pollution and carbon emission coupling effect gradually increased. The regression coefficients for vegetation coverage were primarily negative, with the mean coefficient continuously decreasing and the dispersion increasing. This result suggests that the negative impact of vegetation coverage on the air pollution and carbon emission coupling effect intensified between county-level units, with increasing regional differences, possibly due to variations in the predominant vegetation types across different areas.
The mean regression coefficient for green patents remained relatively stable, with a balanced distribution of positive and negative values. Green patents had positive and negative effects on the coupling effect of PM2.5 pollution and CO2 emissions across different regions. The dispersion of the coefficients showed a gradual increase, suggesting that the differences in the impact of green patents on the coupling across various areas became pronounced.
Total population and the PM2.5 pollution and CO2 emission coupling effect is positively correlated, meaning that a high population typically results in a great level of coupling intensity. The positive impact of GDP and per capita GDP on air pollution and carbon emission coupling continuously increased. The mean regression coefficient for GDP reached its peak of 0.257 in 2015 before gradually declining, whilst the mean coefficient for per capita GDP steadily rose from −0.01 in 2000 to 0.196 in 2017. The dispersion of these coefficients also increased year by year. The influence of GDP and per capita GDP on PM2.5–CO2 coupling strengthened over time, with the heterogeneity between regions growing because of varying policies, technological levels and energy structures.
The average coefficient for the secondary sector proportion remained relatively stable, but the dispersion of the coefficient significantly increased. Meanwhile, the negative values increased annually since 2010, indicating that some regions achieved notable progress in industrial park renovation and upgrades, as well as the application of green technologies.
The total amount of nighttime lighting is often closely related to total energy consumption. The coefficients for nighttime lighting and energy consumption intensity were positive, indicating a positive correlation between them and the PM2.5–CO2 coupling effect. The average coefficient for nighttime lighting attained its peak of 0.574 in 2004 and then declined annually, reaching 0.261 by 2017. The average coefficient for energy consumption intensity increased from 0.136 to 0.270 by 2017. The variation in coefficients for energy consumption intensity and total energy consumption remained relatively small, indicating that the impact of total energy consumption on the PM2.5 pollution and CO2 emission coordination effect gradually decreased, whilst the influence of energy consumption intensity increased. The coefficient for built-up area showed a minimal change with a slight increase in dispersion, suggesting that regional differences in the impact on air pollution and carbon emission coordination gradually intensified.
4.2 Analysis of the spatiotemporal heterogeneity of meteorological and climatic factors in air pollution and carbon emission coordination effects
Figure 7 depicts that the positive effect of temperature inversion days was primarily concentrated in the northwestern part of the Wuhan metropolitan area, particularly around Tianxianqian and Yunmeng counties. The regression coefficients for temperature inversion days exhibited significant spatiotemporal variability, showing a clear distribution pattern of “high–low–secondary high” from northwest to southeast. Temperature inversion weather conditions can lead to poor atmospheric flow and hinder air convection, resulting in the accumulation and concentration of pollutants and carbon emissions in specific areas.
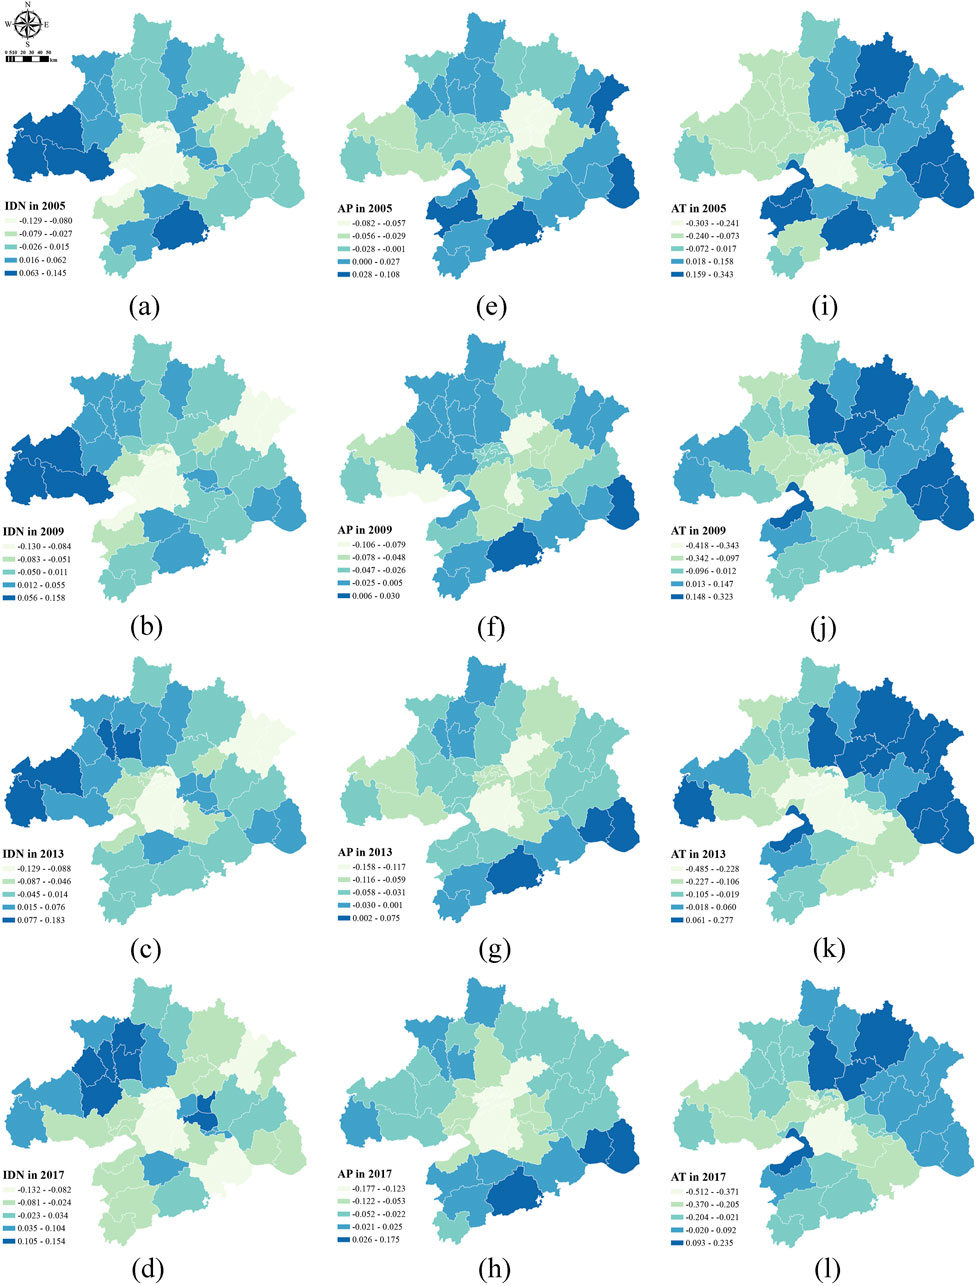
Figure 7. Regression coefficients for meteorological and climatic factors in 2005–2017. IDN, the number of inversion days, (A–D) from 2005 to 2017; AP, the average precipitation, (E–H), from 2005 to 2017; AT, the average temperature, (I–L), from 2005 to 2017.
The regression coefficients for precipitation at the county level were generally negative, indicating that precipitation had a significant negative effect on the synergy between PM2.5 pollution and CO2 emissions. Precipitation effectively mitigated the PM2.5 pollution and CO2 emission levels in the Wuhan metropolitan area. The cleaning effect of precipitation was more pronounced under polluted conditions than that under clean conditions, in which precipitation helped remove pollutants more effectively.
The impact of temperature on the synergy between PM2.5 pollution and CO2 emissions exhibited a spatial distribution pattern of ‘high in the northeast, low in the southwest’. In the southwestern part of the Wuhan metropolitan area, the regression coefficients for temperature were predominantly negative. This result reveals that elevated temperatures tended to reduce the synergy between PM2.5 pollution and CO2 emissions in these areas. The rationale is that high surface temperatures promote air convection, which effectively disperses pollutants and lowers atmospheric pollution levels.
Based on the above conclusions, this study reveals that climatic and meteorological factors—such as temperature, inversion, and precipitation—exert a significant influence on the synergy between pollution mitigation and carbon reduction. The impacts of temperature and inversion demonstrate notable spatial heterogeneity, whereas precipitation exhibits an overall negative spatial effect. Furthermore, research by Chen et al. (2020) illustrates that the effects of inversion and temperature on PM2.5 concentrations in Beijing vary regionally with distinct operative mechanisms. Negative impacts are primarily attributed to temperature-induced atmospheric convection and PM2.5 evaporation losses, while positive impacts arise largely from temperature anomalies influencing PM2.5 dispersion and temperature effects on precursor and secondary pollutant generation. This confirms that temperature and inversion effects on pollution-carbon synergy are significantly influenced by spatial heterogeneity, a pattern broadly observed in major Chinese cities like Beijing and Wuhan.
4.3 Temporal and spatial heterogeneity of land use factors in air pollution and carbon emission synergy
Figure 8 presents the regression coefficients for vegetation coverage and built-up area factors at the county level for the years 2005, 2009, 2013 and 2017. The regression coefficients for vegetation coverage across most counties were predominantly negative, revealing that vegetation coverage generally contributed to effective PM2.5 pollution reduction and CO2 emission mitigation. However, the coefficients for Huangpi District, Xinzhou District, Hannan District and Jiayu County were positive, ranging from 0.08 to 0.2. That is, the vegetation coverage in these areas had a positive impact on the PM2.5–CO2 synergy. This positive effect was likely influenced by local agricultural activities, such as burning and field machinery operations. Additionally, different types of vegetation could impact pollution levels through factors such as carbon sequestration and biogenic volatile organic compound emissions.
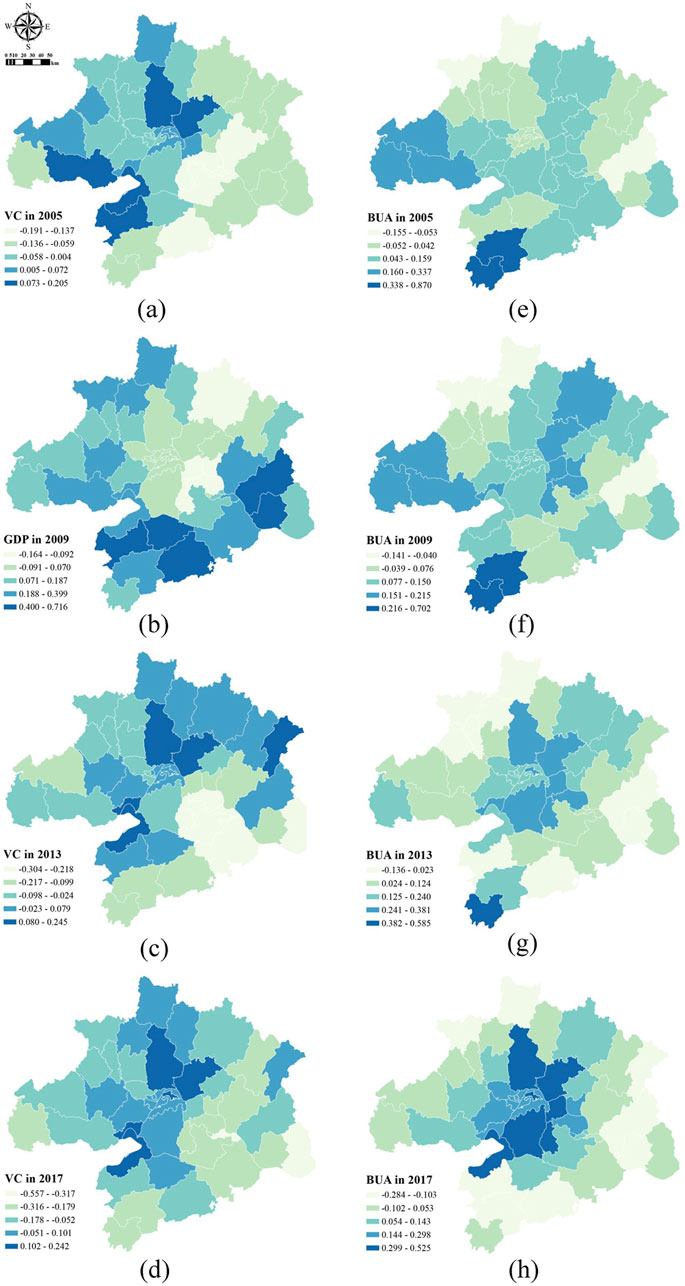
Figure 8. Regression coefficients for land use factors in 2005–2017. VC, the vegetation coverage, (A–D), from 2005 to 2017; BUA, the built-up area, (E–H) is from 2005 to 2017.
The regression coefficients for built-up area varied between positive and negative values, but positive values were predominant, indicating that an increase in built-up area generally had a positive effect on the air pollution and carbon emission synergy. Specifically, the regression coefficients for Huangpi, Xinzhou, Huarong and Jiangxia districts increased each year, rising from a range of 0.04–0.16 in 2005 to 0.30–0.53 in 2017, making them areas with the highest values. Conversely, the regression coefficients for Chongyang and Tongcheng decreased from 0.8 in 2005 to −0.1 in 2017. This trend is attributed to the relatively small annual increase in built-up area in Chongyang and Tongcheng, coupled with the reduced positive impacts on the PM2.5 pollution and CO2 emission synergy due to technological advancements and policy controls. By contrast, areas such as Huangpi and Xinzhou saw significant increases in built-up areas over the years. The rapid urbanisation, changes in lifestyles and consumption patterns and increased emissions from industries and transportation led to a growing impact on the synergistic effects of PM2.5 pollution and CO2 emissions. This impact was reflected in the annually increasing regression coefficients.
The findings of this study indicate that land use factors, such as vegetation coverage and built-up area, play significant roles in affecting pollution-carbon synergy, with spatial heterogeneity evident in both factors’ effects. Previous studies by other scholars provide strong support for these conclusions. For instance, research by Jia et al. (2024) confirms that NDVI and forest cover (FCR) are crucial in reducing PM2.5 and CO2 emissions, suggesting that at the county level, vegetation coverage has varying effects based on plant and crop types. Studies by Feng et al. (2017) and Wang and Shi (2019) validate that the expansion of built-up and urban areas intensifies PM2.5 and CO2 emissions, with built-up area often linked to urbanization, thus affirming that urbanization broadly promotes pollution-carbon synergy.
4.4 Analysis of the spatiotemporal heterogeneity of socioeconomic factors in the synergy of air pollution and carbon emissions
Figure 9 illustrates the regression coefficients for the population size, GDP and secondary industry proportion across different counties for the years 2005, 2009, 2013 and 2017. The regression coefficients for population were generally positive, indicating that population had a positive effect on the synergy of PM2.5 pollution and CO2 emissions. Population activities generate substantial carbon emissions and atmospheric pollutants. A large population often represents high energy consumption and increased transportation emissions, leading to an enhanced pollution–carbon effect.

Figure 9. Regression coefficients for socioeconomic factors in 2005–2017. TP, the total population, (A–D), from 2005 to 2017; GDP, Gross Domestic Product, (E–H), from 2005 to 2017; SSR, the proportion of secondary sector, (I–L), from 2005 to 2017.
In general, a noticeable regional variation in the GDP regression coefficients occurred. In the urban areas of Wuhan and Ezhou, the regression coefficients decreased annually, transitioning from positive to negative values. This shift indicates that the effect of GDP on the PM2.5 pollution and CO2 emission effect changed from a positive influence on a negative suppression effect in these regions, suggesting that the developed economies reached the turning point of the environmental Kuznets curve. By contrast, less developed areas continued to experience higher levels of PM2.5 pollution and CO2 emissions, given that they have not yet reached the scale of agglomeration effects.
The dispersion of the regression coefficients of secondary industry proportion increased annually, with the minimum value decreasing from −0.036 in 2005 to −0.346 in 2017 and the maximum value rising from 0.212 in 2005 to 0.678 in 2017. However, the number of regions with negative values increased year by year, growing from 5 in 2005 to 25 in 2017, indicating an overall shift towards negative coefficients. High-value areas were mainly in Luotian County and Yingshan County, with regression coefficients ranging from 0.2 to 0.6, showing a strong positive impact of the secondary industry proportion on the regional PM2.5 pollution and CO2 emission effect in these areas. The next highest-value areas were primarily in Macheng City, Hong’an County, Huangpi District and the Xiaogan region, with Huangpi District and the Xiaogan region showing annual increases in their coefficients, ranging between 0.07 and 0.2. Because industrial production is often accompanied with substantial PM2.5 pollution and CO2 emissions, these areas urgently need to advance industrial structure adjustments and promote green transformation of their industries.
This study identifies total population, regional GDP, and the proportion of secondary industry as key factors influencing pollution-carbon synergy. The effects of regional GDP and the proportion of secondary industry exhibit spatial heterogeneity, while total population shows a consistent positive effect across the study area. Additionally, research by Dong et al. (2019) uncovers a nonlinear, inverted-U relationship between per capita GDP and PM2.5 reduction, where economic growth initially promotes PM2.5 reduction but, at a certain economic level, the reduction potential declines, resulting in reduced emissions mitigation. This underscores that the spatial heterogeneity in regional GDP has a significant and widespread impact on pollution-carbon synergy.
4.5 Analysis of the spatial and temporal heterogeneity of urban innovation and energy consumption in air pollution and carbon emission synergy
Figure 10 displays the regression coefficients of green patents, nighttime lighting and energy consumption intensity factors for each county-level unit in 2005, 2009, 2013 and 2017. Overall, the regression coefficients for green patents varied between positive and negative values. In most areas, green patents had a negative impact on the PM2.5 pollution and CO2 emission synergy, indicating that the achievements in green patents effectively promoted the synergistic improvement of pollution and carbon reduction. The inhibitory effect of green patents on the pollution–carbon synergy was most pronounced in the Huanggang region, followed by the Ezhou and Tianxianqian regions. These regions were in a period of economic development, with their main economic activities relying on the secondary and tertiary industries. During the process of promoting the green transformation of the industrial structure in these areas, the innovative technologies introduced by green patents effectively reduced the PM2.5 pollutant and CO2 emissions in production and daily life, resulting in a high level of inhibition on the PM2.5–CO2 synergy in these regions. However, a small number of areas (e.g., Xianning, Tianxianqian, Anlu and Yingcheng) showed positive regression coefficients, i.e., green patents did not significantly inhibit PM2.5–CO2 levels. The low quality of technological resources in these areas during the study period did not contribute significantly to the suppression of PM2.5 pollution and CO2 emissions levels. Additionally, urban technological development is often accompanied with increased economic activities and enhanced PM2.5–CO2 emissions, leading to a positive effect of green patents on pollution–carbon levels in these regions.
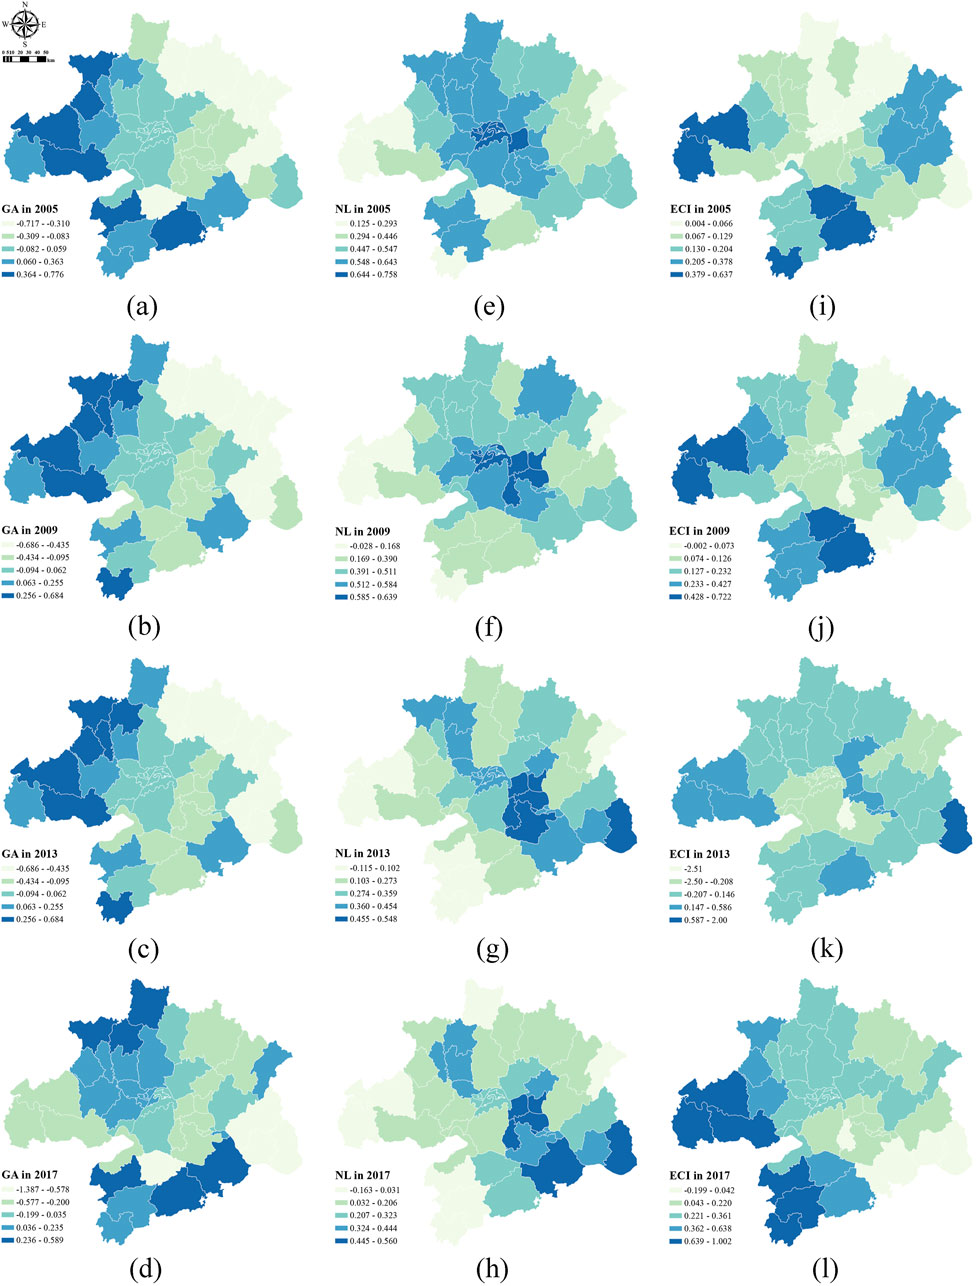
Figure 10. Regression coefficients for urban innovation and energy consumption factors in 2005–2017. GA, the number of green patents, (A–D), from 2005 to 2017; NL, the nighttime lights, (E–H), from 2005 to 2017; ECI, the energy consumption efficiency, (I–L), from 2005 to 2017.
The total amount of nighttime lighting is closely related to the total energy consumption. In the study period, the regression coefficients were predominantly positive, indicating that nighttime lighting exerted a positive effect on the PM2.5 pollution and CO2 emission synergy in most regions. High nighttime lighting intensity reflects great energy consumption in the area, leading to high levels of PM2.5–CO2.
The regression coefficients for energy consumption intensity were predominantly positive, indicating that the energy consumption intensity had a positive effect on the PM2.5 pollution and CO2 emission synergy. However, significant regional differences occurred. High-value areas were mainly concentrated in Tianxianqian, Chibi, Chongyang, Tongshan and Xian’an districts, with the regression coefficients increasing from 0.38 to 0.64 in 2005 to 0.64–1.0 in 2017. This finding indicates that the positive impact of energy consumption intensity on PM2.5–CO2 synergy had been growing annually in these areas. By contrast, regions such as Dongxihu, Jiangxia and Xiaonan, despite having high energy consumption intensity, exhibited lower regression coefficients. Consequently, the effect of energy consumption intensity on local PM2.5–CO2 synergy was weaker, potentially due to factors such as energy structure, production technology and policy controls.
This study highlights that green patents, nighttime light intensity, and energy intensity significantly influence pollution-carbon synergy. The innovative inclusion of green patents reveals spatial heterogeneity in their effect on pollution-carbon synergy, with predominantly negative impacts and some positive effects. Similar conclusions are supported by other studies; Dong et al. (2019) demonstrate that technological innovation generally weakens pollution-carbon synergy, while Wang et al. (2024) find that technological innovation increases CO2 emissions but has heterogeneous effects on PM2.5 pollution, with most instances reducing pollution and some causing an increase. This confirms a prevalent trend of significant negative spatial heterogeneity for green patent effects on pollution-carbon synergy. In contrast, nighttime light intensity and energy intensity generally exhibit positive impacts. Research by Dong et al. (2019) further indicates that improvements in energy efficiency may lower the marginal cost of energy services, potentially leading to a rebound effect in energy consumption. Consequently, enhanced energy efficiency may inadvertently increase energy use, hindering PM2.5 reduction efforts. This reinforces the widespread negative impact of energy intensity on pollution-carbon synergy.
4.6 Policies and recommendations
4.6.1 Continuously promote the synergistic process of “carbon reduction” as the primary goal and “pollution reduction” in parallel
Based on the interannual trends of PM2.5 pollution and CO2 emissions in the Wuhan Metropolitan Area, it is evident that while significant progress has been made in PM2.5 pollution control, CO2 emissions remain high. The Wuhan Metropolitan Area needs to build on existing PM2.5 pollution reduction achievements and further strengthen governance, fully leveraging the synergistic effects of air pollution and carbon emissions. Priority should be given to regions with high carbon emission levels for reduction efforts, constructing a governance system that emphasizes “carbon reduction as the primary goal, with pollution reduction in parallel.” There is a need to enhance regional monitoring capabilities for pollution and carbon emissions, improve the integrated monitoring and evaluation system for PM2.5 pollution and CO2 emissions, and strengthen collaborative management. Coordination between carbon reduction measures and pollution control policies should be established, along with unified planning objectives and assessment systems. Additionally, successful experiences from various regions in PM2.5 pollution reduction and CO2 emissions should be actively summarized, and regional exchanges and learning should be encouraged to continuously advance the synergistic process of pollution reduction and carbon reduction.
4.6.2 Actively promote regional technological innovation and energy reform
Research on influencing factors indicates that total energy consumption and energy efficiency significantly impact the synergistic level of PM2.5 pollution and CO2 emissions in the Wuhan Metropolitan Area. As the population grows and the economy continues to develop, social activities will inevitably lead to increased energy consumption, resulting in higher levels of PM2.5 pollution and CO2 emissions. The Wuhan Metropolitan Area should leverage the population and economic agglomeration effects to enhance resource sharing while actively adjusting the energy structure. This includes increasing the use of clean energy, promoting the development of green low-carbon industries, and strengthening the supply of green low-carbon technologies to establish a green low-carbon energy system.
4.6.3 Regional pollution reduction and carbon reduction governance should adhere to the principles of “targeted governance and precise policy implementation”
Exploration of the spatial and temporal heterogeneity of PM2.5 pollution and CO2 emission influencing factors at the county level in the Wuhan Metropolitan Area indicates that PM2.5 pollution and CO2 governance must deeply analyze the dominant factors and adopt different approaches to achieve a “one policy for one area” strategy.
In regions like Hongshan and Jiangxia, where population and economic development factors have a significant impact, it is essential to actively utilize agglomeration effects by controlling population growth in a planned manner, optimizing urban planning and spatial layout, and rationally controlling construction land to reduce environmental pressure caused by overdevelopment. Strengthening public transportation systems and promoting green travel modes, such as subways, buses, and bicycles, can reduce private car usage and traffic congestion. Additionally, optimizing transportation structures, accelerating green economic transformation, improving energy efficiency, and promoting energy-saving buildings, green construction, and low-carbon communities will enhance residents’ levels of green consumption and sustainable living.
In regions such as Xinzhou, Huangpi, and Caidian, which are more influenced by industrial and technological factors, the following measures can be implemented: adjusting industrial structures to gradually eliminate high-pollution and high-energy-consuming outdated production capacity, closing or transforming enterprises that do not meet environmental protection standards, and encouraging the development of a circular economy to promote the green upgrading of industrial parks, achieving effective resource recycling. Support should be provided for the development of low-carbon, clean, and high-tech industries, such as new energy, new materials, and information technology. Furthermore, investment in green technology research and development should be increased, particularly in areas like energy efficiency improvement, pollutant treatment, and carbon capture and storage (CCS). Collaboration between enterprises and research institutions should be promoted to accelerate the application and industrialization of green technologies, while providing policy and financial support to help enterprises upgrade technologies and reduce carbon emissions.
Strengthening environmental management and supervision involves enhancing the enforcement of environmental regulations to ensure that all enterprises comply with environmental protection standards and laws. A comprehensive environmental monitoring system should be established to monitor pollutant emissions in real time and address violations promptly. Stricter environmental impact assessment systems should be implemented for new projects to conduct scientific assessments and prevent potential future environmental issues. Optimizing the energy structure means adjusting energy consumption patterns to reduce reliance on fossil fuels and increase the proportion of clean energy. Promoting energy-saving and emission-reduction technologies, improving energy efficiency, and reducing energy waste are also essential, alongside supporting the development and utilization of renewable energy sources such as solar, wind, and biomass energy.
Regional cooperation and collaboration should be strengthened to jointly address regional environmental issues. Participation in regional environmental protection projects and initiatives, sharing green technologies and management experiences, and integrating resources through regional cooperation can collectively promote the construction and management of green infrastructure. A diversified strategy should be adopted, emphasizing both industrial structure adjustments and technological innovation, as well as strengthening environmental management and optimizing energy structures, to collectively tackle the challenges of pollution reduction and carbon reduction.
5 Conclusion
Based on the PM2.5 pollution and carbon emission data from county-level units in the Wuhan metropolitan area between 2000 and 2017, this study employs spatial correlation analysis and standard deviation ellipses to describe the spatiotemporal distribution and dynamic evolution of air pollution and carbon emission synergy from multiple perspectives. Furthermore, a GTWR model is constructed to explore the factors influencing the intensity of PM2.5–CO2 synergy and its spatiotemporal heterogeneity. The main conclusions are as follows:
(1) From the perspective of their individual evolutionary characteristics, PM2.5 pollution and CO2 emissions in the Wuhan metropolitan area exhibited different trends in 2000–2017. PM2.5 levels initially increased and then decreased, whilst CO2 emissions increased and then stabilised, with a turning point around 2013. The PM2.5 pollution in the Wuhan metropolitan area was significantly higher than national standards. Areas such as Qingshan District, Dongxihu District and Jiang’an District had the highest PM2.5 concentrations, whilst Hongshan District, Jiangxia District and Huangpi District had the highest carbon emissions. The centroid and standard deviation ellipse analyses indicate that PM2.5 and carbon emission centroids were located northwest of the geographic centre of the Wuhan metropolitan area. PM2.5 pollution showed a spatial pattern shifting from southeast–northwest to east–west, whilst carbon emissions demonstrated a southeast–northwest pattern with a contraction trend.
(2) From the perspective of the coevolutionary characteristics of pollution and carbon emissions, the whole coupling coordination degree between PM2.5 pollution and CO2 emissions in the Wuhan metropolitan area displayed two phases, an increase and a decrease, with a turning point around 2012. Initially, the synergy level improved as the coupling degree increased. However, with the reduction in PM2.5 pollution levels in the later period, the coupling degree decreased, leading to a decline in overall coordination levels. Detailed analysis of county-level units reveals that areas such as Hongshan District, Jiangxia District, Huangpi District and Caidian District within Wuhan, as well as Daya City, Xiaonan District, Qianjiang City, Echeng District, Huangmei County, Huangzhou District, Xianyang City and Tianmen City outside Wuhan, have higher levels of synergistic coordination and should be prioritised for collaborative pollution and carbon reduction efforts.
(3) In terms of the effectiveness of various factors on the synergistic effects of PM2.5 pollution and CO2 emissions, the factors including temperature inversion days, precipitation, temperature, vegetation coverage, green patents, population, GDP, per capita GDP, secondary industry ratio, nighttime lights, energy consumption intensity and built-up area exhibited varying effects on the PM2.5 pollution and CO2 emission synergy in county-level units of the Wuhan metropolitan area. Factors such as population, GDP, secondary industry ratio, nighttime lights, energy consumption intensity and built-up area generally had positive effects, leading to increased air pollution and carbon emission synergy. Conversely, precipitation and vegetation coverage generally exerted negative suppressive effects. The effects of temperature inversion, temperature, green patents and per capita GDP were mixed. For example, green patents positively influenced the air pollution and carbon emission synergy in regions such as Xiaogan and Xianning but showed a suppressive effect in Huanggang, Tianxianqian and central Wuhan metropolitan areas.
(4) From the perspective of the spatiotemporal differences in influencing factors, the impact of various factors on air pollution and carbon emission synergy showed significant spatiotemporal heterogeneity. Temperature inversion primarily affected the northwest part of the metropolitan area, with strong effects shifting from Tianxianqian to the vicinity of Yunmeng. Precipitation had a significant negative effect on the overall PM2.5 pollution and CO2 emission synergy, with the most pronounced effects in Xinzhou and Jiangxia. Temperature effects displayed a northeast–southwest pattern, with noticeable positive impacts on the northeastern regions. Vegetation coverage generally showed a negative suppressive effect on the air pollution and carbon emission synergy across most regions. Green patents predominantly exerted a negative effect on pollution levels, although a few areas showed no suppression. Population growth showed a positive effect, which was particularly strong in Huanggang; in regions such as Yingshan and Xishui, it significantly promoted PM2.5 pollution levels. GDP effects varied, with negative impacts in Wuhan and Ezhou and increasing positive impacts in Xiaogan, Xishui and Wuxue. Per capita GDP showed a pronounced positive effect in Tianmen and Qianjiang. The secondary industry ratio had high positive impacts in Luotian County and Yingshan County. Energy consumption intensity showed a strong effect, shifting from northwest to southeast over time. Energy consumption efficiency mainly affected Tianxianqian, Chibi, Chongyang, Tongshan and Xian’an. Built-up area effects showed a trend of receding to the central regions, with high values in Huangpi and Xinzhou.
Owing to limitations in data availability and accessibility, the influencing factors selected in this study may not be comprehensive. Future research could incorporate variables related to transportation and policy to construct a more accurate model and further explore the mechanisms of influence.
Data availability statement
The original contributions presented in the study are included in the article/supplementary material, further inquiries can be directed to the corresponding author.
Author contributions
TC: Conceptualization, Data curation, Formal Analysis, Funding acquisition, Investigation, Methodology, Project administration, Resources, Software, Supervision, Validation, Visualization, Writing–original draft, Writing–review and editing. AC: Conceptualization, Data curation, Formal Analysis, Funding acquisition, Investigation, Methodology, Project administration, Resources, Software, Supervision, Validation, Visualization, Writing–original draft, Writing–review and editing. LL: Conceptualization, Data curation, Formal Analysis, Funding acquisition, Investigation, Methodology, Project administration, Resources, Software, Supervision, Validation, Visualization, Writing–review and editing. CS: Conceptualization, Data curation, Formal Analysis, Funding acquisition, Investigation, Methodology, Project administration, Resources, Software, Supervision, Validation, Visualization, Writing–original draft. JZ: Writing–review and editing, Conceptualization, Data curation, Formal Analysis, Funding acquisition, Investigation, Methodology, Project administration, Resources, Software, Supervision, Validation, Visualization.
Funding
The author(s) declare that no financial support was received for the research, authorship, and/or publication of this article.
Conflict of interest
The authors declare that the research was conducted in the absence of any commercial or financial relationships that could be construed as a potential conflict of interest.
Generative AI statement
The author(s) declare that no Generative AI was used in the creation of this manuscript.
Publisher’s note
All claims expressed in this article are solely those of the authors and do not necessarily represent those of their affiliated organizations, or those of the publisher, the editors and the reviewers. Any product that may be evaluated in this article, or claim that may be made by its manufacturer, is not guaranteed or endorsed by the publisher.
References
Andrée, B. P. J., Chamorro, A., Spencer, P., Koomen, E., and Dogo, H. (2019). Revisiting the relation between economic growth and the environment; a global assessment of deforestation, pollution and carbon emission. Renew. Sustain. Energy Rev. 114, 109221. doi:10.1016/j.rser.2019.06.028
Bai, Z.-H., Lü, L., Zhao, M., Zhang, N., and Luo, H. (2022). Pollution and carbon reduction effect of OFDI in China and its mechanism. PubMed 43 (10), 4408–4418. doi:10.13227/j.hjkx.202201283
Chen, J., Liu, J., Qi, J., Gao, M., Cheng, S., Li, K., et al. (2022). City- and county-level spatio-temporal energy consumption and efficiency datasets for China from 1997 to 2017. Sci. Data 9 (1), 101. doi:10.1038/s41597-022-01240-6
Chen, S., Tan, Z., Wang, J. Y., Zhang, L., He, X., and Mu, S. (2023). Spatial and temporal evolution of synergizing the reduction of pollution and carbon emissions and examination on comprehensive pilot effects–evidence from the national eco-industrial demonstration parks in China. Environ. Impact Assess. Rev. 101, 107147. doi:10.1016/j.eiar.2023.107147
Chen, X., Di, Q., Jia, W., and Hou, Z. (2023). Spatial correlation network of pollution and carbon emission reductions coupled with high-quality economic development in three Chinese urban agglomerations. Sustain. cities Soc. 94, 104552. doi:10.1016/j.scs.2023.104552
Chen, X. H., Tee, K., Elnahass, M., and Ahmed, R. (2023). Assessing the environmental impacts of renewable energy sources: a case study on air pollution and carbon emissions in China. J. Environ. Manag. 345 (118525), 118525. doi:10.1016/j.jenvman.2023.118525
Chen, Z., Chen, D., Zhao, C., Kwan, M. P., Cai, J., Zhuang, Y., et al. (2020). Influence of meteorological conditions on PM2.5 concentrations across China: a review of methodology and mechanism. Environ. Int. 139, 105558. doi:10.1016/j.envint.2020.105558
Cheng, Z., Li, L., and Liu, J. (2017). Identifying the spatial effects and driving factors of urban PM2.5 pollution in China. Ecol. Indic. 82, 61–75. doi:10.1016/j.ecolind.2017.06.043
Coelho, S., Ferreira, J., Rodrigues, V., and Lopes, M. (2022). Source apportionment of air pollution in European urban areas: lessons from the ClairCity project. J. Environ. Manag. 320, 115899. doi:10.1016/j.jenvman.2022.115899
Ding, Y., Zhang, M., Qian, X., Li, C., Chen, S., and Wang, W. (2019). Using the geographical detector technique to explore the impact of socioeconomic factors on PM2.5 concentrations in China. J. Clean. Prod. 211, 1480–1490. doi:10.1016/j.jclepro.2018.11.159
Dong, F., Yu, B., and Pan, Y. (2019). Examining the synergistic effect of CO2 emissions on PM2.5 emissions reduction: evidence from China. J. Clean. Prod. 223, 759–771. doi:10.1016/j.jclepro.2019.03.152
Dong, Z., Xia, C., Fang, K., and Zhang, W. (2022). Effect of the carbon emissions trading policy on the co-benefits of carbon emissions reduction and air pollution control. Energy Policy 165, 112998. doi:10.1016/j.enpol.2022.112998
Feng, H., Zou, B., and Tang, Y. (2017). Scale- and region-dependence in landscape-PM2.5 correlation: implications for urban planning. Remote Sens. 9 (9), 918. doi:10.3390/rs9090918
Geng, N., Wang, J., Xu, Y., Zhang, W., Chen, C., and Zhang, R. (2013). PM2.5 in an industrial district of Zhengzhou, China: chemical composition and source apportionment. Particuology 11 (1), 99–109. doi:10.1016/j.partic.2012.08.004
Gregg, J. S., Losey, L. M., Andres, R. J., Blasing, T. J., and Marland, G. (2009). The temporal and spatial distribution of carbon dioxide emissions from fossil-fuel use in north America. J. Appl. Meteorology Climatol. 48 (12), 2528–2542. doi:10.1175/2009jamc2115.1
Guan, D., Su, X., Zhang, Q., Peters, G. P., Liu, Z., Lei, Y., et al. (2014). The socioeconomic drivers of China’s primary PM2.5 emissions. Environ. Res. Lett. 9 (2), 024010. doi:10.1088/1748-9326/9/2/024010
Guo, X., Mu, X., Ding, Z., and Qin, D. (2021). Nonlinear effects and driving mechanism of multidimensional urbanization on PM2.5 concentrations in the Yangtze River Delta. Acta Geogr. Sin. 76(5), 1274–1293. doi:10.11821/dlxb202105017
Huang, B., Wu, B., and Barry, M. (2010). Geographically and temporally weighted regression for modeling spatio-temporal variation in house prices. Int. J. Geogr. Inf. Sci. 24 (3), 383–401. doi:10.1080/13658810802672469
Ji, X., Yao, Y., and Long, X. (2018). What causes PM2.5 pollution? Cross-economy empirical analysis from socioeconomic perspective. Energy Policy 119, 458–472. doi:10.1016/j.enpol.2018.04.040
Jia, Z., Zhao, D., Y, B. O., and Wang, Z. (2024). Study on spatial effects of influencing factors and zoning strategies for PM2.5 and CO2 synergistic reduction. Toxics 12 (7), 498. doi:10.3390/toxics12070498
Jiang, F., Chen, B., Li, P., Jiang, J., Zhang, Q., Wang, J., et al. (2023). Spatio-temporal evolution and influencing factors of synergizing the reduction of pollution and carbon emissions - utilizing multi-source remote sensing data and GTWR model. Environ. Res. 229, 115775. doi:10.1016/j.envres.2023.115775
Jiang, P., Yang, J., Huang, C., and Liu, H. (2018). The contribution of socioeconomic factors to PM2.5 pollution in urban China. Environ. Pollut. 233, 977–985. doi:10.1016/j.envpol.2017.09.090
Kola, B. A., and Ganda, F. (2024). The impact of pollution and carbon emission control on financial development, environmental quality, and economic growth: a global analysis. Sustainability 16 (20), 8748. doi:10.3390/su16208748
Lim, C.-H., Ryu, J., Choi, Y., Jeon, S. W., and Lee, W.-K. (2020). Understanding global PM2.5 concentrations and their drivers in recent decades (1998–2016). Environ. Int. 144, 106011. doi:10.1016/j.envint.2020.106011
Lin, G., Fu, J., Jiang, D., Hu, W., Dong, D., Huang, Y., et al. (2013). Spatio-temporal variation of PM2.5 concentrations and their relationship with geographic and socioeconomic factors in China. Int. J. Environ. Res. Public Health 11 (1), 173–186. doi:10.3390/ijerph110100173
Liu, M., Liu, S., Li, J., Sun, M., and Chen, K. (2022). Evaluation and prediction of the synergistic effect of pollution reduction and carbon reduction in Tianjin. China Environ. Sci. 42 (8), 3940–3949. doi:10.3969/j.issn.1000-6923.2022.08.053
Luo, K., Li, G., Fang, C., and Sun, S. (2018). PM2.5 mitigation in China: socioeconomic determinants of concentrations and differential control policies. J. Environ. Manag. 213, 47–55. doi:10.1016/j.jenvman.2018.02.044
Nam, K.-M., Waugh, C. J., Paltsev, S., Reilly, J. M., and Karplus, V. J. (2014). Synergy between pollution and carbon emissions control: comparing China and the United States. Energy Econ. 46, 186–201. doi:10.1016/j.eneco.2014.08.013
Pal, D., and Mitra, S. K. (2017). The environmental Kuznets curve for carbon dioxide in India and China: growth and pollution at crossroad. J. Policy Model. 39 (2), 371–385. doi:10.1016/j.jpolmod.2017.03.005
Peng, J., Chen, S., Lü, H., Liu, Y., and Wu, J. (2016). Spatiotemporal patterns of remotely sensed PM2.5 concentration in China from 1999 to 2011. Remote Sens. Environ. 174, 109–121. doi:10.1016/j.rse.2015.12.008
Talukdar, D., and Meisner, C. M. (2001). Does the private sector help or hurt the environment? Evidence from carbon dioxide pollution in developing countries. World Dev. 29 (5), 827–840. doi:10.1016/s0305-750x(01)00008-0
Tang, X., Zhang, Y., Cao, L., Zhang, J., and Chen, X. (2019). Spatio-temporal characteristics and influencing mechanism of synergistic effect of pollution and carbon emission reduction in China. Res. Environ. Sci., 35(10), 2252–2263. doi:10.13198/j.issn.1001-6929.2022.08.10
Thurston, G. D., Ito, K., and Lall, R. (2011). A source apportionment of U.S. fine particulate matter air pollution. Atmos. Environ. 45 (24), 3924–3936. doi:10.1016/j.atmosenv.2011.04.070
VandeWeghe, J. R., and Kennedy, C. (2007). A spatial analysis of residential greenhouse gas emissions in the Toronto census metropolitan area. J. Industrial Ecol. 11 (2), 133–144. doi:10.1162/jie.2007.1220
Wang, H., Gu, K., Sun, H., and Xiao, H. (2023). Reconfirmation of the symbiosis on carbon emissions and air pollution: a spatial spillover perspective. Sci. Total Environ. 858, 159906. doi:10.1016/j.scitotenv.2022.159906
Wang, J., Hu, Z., Chen, Y., Chen, Z., and Xu, S. (2013). Contamination characteristics and possible sources of PM10 and PM2.5 in different functional areas of Shanghai, China. Atmos. Environ. 68, 221–229. doi:10.1016/j.atmosenv.2012.10.070
Wang, L., and Shi, K. (2019). What are the driving forces of urban CO2 emissions in China? A refined scale analysis between national and urban agglomeration levels. Int. J. Environ. Res. Public Health 16 (19), 3692. doi:10.3390/ijerph16193692
Wang, S., Zhou, C., Wang, Z., Feng, K., and Hubacek, K. (2017). The characteristics and drivers of fine particulate matter (PM2.5) distribution in China. J. Clean. Prod. 142, 1800–1809. doi:10.1016/j.jclepro.2016.11.104
Wang, X., Bi, X., Sheng, G., and Fu, J. (2006). Chemical composition and sources of PM10 and PM2.5 aerosols in guangzhou, China. Environ. Monit. Assess. 119 (1-3), 425–439. doi:10.1007/s10661-005-9034-3
Wang, Y., Ni, J., Xu, K., Zhang, H., and He, C. (2024). Intricate synergistic effects between air pollution and carbon emission: an emerging evidence from China. Environ. Pollut. 349, 123851. doi:10.1016/j.envpol.2024.123851
Wang, S., Kong, W., Ren, L., Zhi, D., and Dai, B. (2021). Research on misuses and modification of coupling coordination degree model in China. J. Nat. Resour. 36 (3), 793. doi:10.31497/zrzyxb.20210319
Wei, J., Li, Z., Lyapustin, A., Sun, L., Peng, Y., Xue, W., et al. (2021). Reconstructing 1-km-resolution high-quality PM2.5 data records from 2000 to 2018 in China: spatiotemporal variations and policy implications. Remote Sens. Environ. 252, 112136. doi:10.1016/j.rse.2020.112136
Wu, W., Zhang, M., and Ding, Y. (2020). Exploring the effect of economic and environment factors on PM2.5 concentration: a case study of the Beijing-Tianjin-Hebei region. J. Environ. Manag. 268, 110703. doi:10.1016/j.jenvman.2020.110703
Wu, X., Nguyen, C. V., Shi, Z., Harrison, R. M., Liu, D., and Cen, K. (2018). Characterization and source apportionment of carbonaceous PM2.5 particles in China - a review. Atmos. Environ. 189, 187–212. doi:10.1016/j.atmosenv.2018.06.025
Xian, B., Xu, Y., Chen, W., Wang, Y., and Qiu, L. (2024). Co-benefits of policies to reduce air pollution and carbon emissions in China. Environ. Impact Assess. Rev. 104, 107301. doi:10.1016/j.eiar.2023.107301
Xu, G., Ren, X., Xiong, K., Li, L., Bi, X., and Wu, Q. (2020). Analysis of the driving factors of PM2.5 concentration in the air: a case study of the Yangtze River Delta, China. Ecol. Indic. 110, 105889. doi:10.1016/j.ecolind.2019.105889
Yang, D., Wang, X., Xu, J., Xu, C., Lu, D., Ye, C., et al. (2018). Quantifying the influence of natural and socioeconomic factors and their interactive impact on PM2.5 pollution in China. Environ. Pollut. 241, 475–483. doi:10.1016/j.envpol.2018.05.043
Yue, H., He, C., Huang, Q., Yin, D., and Bryan, B. A. (2020). Stronger policy required to substantially reduce deaths from PM2.5 pollution in China. Nat. Commun. 11 (1), 1462. doi:10.1038/s41467-020-15319-4
Yun, G., He, Y., Jiang, Y., Dou, P., and Dai, S. (2019). PM2.5 spatiotemporal evolution and drivers in the Yangtze River Delta between 2005 and 2015. Atmosphere 10 (2), 55. doi:10.3390/atmos10020055
Zhang, Q., Zheng, Y., Tong, D., Shao, M., Wang, S., Zhang, Y., et al. (2019). Drivers of improved PM2.5 air quality in China from 2013 to 2017. Proc. Natl. Acad. Sci. 116 (49), 24463–24469. doi:10.1073/pnas.1907956116
Keywords: Wuhan metropolitan area, pollution reduction and carbon mitigation, synergistic effects, coupling coordination degree model, geographically and temporally weighted regression model
Citation: Chen T, Chen A, Liu L, Shi C and Zhang J (2024) Synergistic effects of pollution reduction and carbon mitigation from socioeconomic factors, land use and urban innovation: a case study of Wuhan metropolitan area. Front. Environ. Sci. 12:1511026. doi: 10.3389/fenvs.2024.1511026
Received: 14 October 2024; Accepted: 28 November 2024;
Published: 24 December 2024.
Edited by:
Hui Wang, Hunan University, ChinaReviewed by:
Qingsong He, Huazhong University of Science and Technology, ChinaHoutian Tang, Xiamen University, China
Copyright © 2024 Chen, Chen, Liu, Shi and Zhang. This is an open-access article distributed under the terms of the Creative Commons Attribution License (CC BY). The use, distribution or reproduction in other forums is permitted, provided the original author(s) and the copyright owner(s) are credited and that the original publication in this journal is cited, in accordance with accepted academic practice. No use, distribution or reproduction is permitted which does not comply with these terms.
*Correspondence: Lanjun Liu, MTEwOTAxMDFAd2l0LmVkdS5jbg==
†These authors have contributed equally to this work and share first authorship
 Tao Chen1†
 An Chen
 Chenxi Shi