- College of Economics and Management, Heilongjiang Bayi Agricultural University, Daqing, Heilongjiang, China
In light of global climate change and environmental challenges, reducing agricultural carbon emissions while maintaining food security has become a critical concern for sustainable agricultural development. This study examines 13 provinces in primary grain-producing regions, utilising data from 1999 to 2022 to analyse the spatio-temporal heterogeneity and driving factors of the coupled and coordinated development of agricultural carbon emission efficiency and food security. The findings indicate that: 1) The proportion of carbon emissions from agricultural inputs in primary grain-producing regions exceeds 80%, whereas the contribution of carbon sinks from rice, maise, and wheat surpasses 95%. Both agricultural carbon emissions and carbon sinks in the Yellow River Basin are significantly elevated; 2) The general trend of agricultural carbon emission efficiency and food security is increasing, spatially characterised by a pattern of high levels in the north and south, and low levels in the south and high levels in the north, respectively. The integration of the two systems is progressing positively, and the trailing form of food security has emerged as a developmental trend, with the degree of food security limiting the coordinated advancement of both. 3) The overall spatial disparity exhibits a declining tendency, with hypervariable density being the primary contributor to this spatial difference. The overall polarisation of the primary grain-producing regions has diminished. The level of heterogeneity in the Songhua River basin progressively intensifies; 4) Rural human capital and financial support for agriculture, urbanisation rate and soil erosion control, agricultural machinery power and soil erosion control are the main interaction factors. The economic status and rural human capital will facilitate the integrated and harmonious development of the two systems, while the agricultural disaster rate will impede this integrated and harmonious development. Ultimately, policy solutions are proposed to optimise agricultural inputs and raise their utilisation efficiency, adopt diversified regional development strategies, promote regional connection and coordinated development, and reinforce the management of drivers and policy support.
1 Introduction
Access to sufficient and reliable food supplies is paramount to the nation’s security. China has solemnly committed to reducing carbon emissions significantly around the globe. China, a country with a long history of agriculture, has consistently seen food security as the fundamental basis of its economy. China’s capacity to ensure food security has dramatically improved since the 18th National Congress of the Communist Party of China (CPC). With 9% of the world’s arable land and 6% of its freshwater resources, China can provide food for almost 20% of the global population (Lee et al., 2024). In the current era of unprecedented upheavals, including a chaotic international situation, severe global climate change, frequent natural disasters, and other dangerous issues, the strategic importance of food security has grown more prominent as we enter a new stage of growth.
The climate environment has significantly influenced agriculture. The effects of climate change, such as extreme weather events, limited resources, and energy challenges, will affect food production. The Emissions Gap Report 2023, released by the United Nations Environment Programme (UNEP), states that to achieve the 1.5°C temperature control objective, global greenhouse gas emissions must be reduced by 42% annually by 2030 (Nabernegg et al., 2019). Tackling the climate catastrophe has become a universal and pressing challenge for the entire planet. The China Greenhouse Gas Inventory 2018 Circular reveals that agriculture contributes 870 million tonnes of carbon dioxide, equivalent to the country’s greenhouse gas emissions. This accounts for approximately 15% of the total emissions, making agriculture the second largest source of greenhouse gases after industry (Chen et al., 2022). Consequently, the agricultural sector has emerged as a crucial battleground in the fight against climate change. Hence, by thoroughly examining the connection between agricultural carbon emission efficiency and food security, it is feasible to decrease the unnecessary duplication of agricultural carbon emissions and enhance the effectiveness of agricultural carbon emissions, all while ensuring food security. A meticulous evaluation of the variations in regional disparities, dynamic shifts, and influencing factors between agricultural carbon emission efficiency and food security will offer a scientific foundation for developing more accurate regional policies.
Most scholars’ research is primarily based on quantifying agricultural carbon emissions and carbon sinks. Agricultural carbon emissions encompass the greenhouse gas emissions from using fertilisers, pesticides, fossil fuels, and waste disposal in agricultural production (Zhao et al., 2018). Scholars have employed various methods, such as the emission factor method, actual measurement method, and mass balance method (Li et al., 2023), to quantify carbon emissions in different aspects of agriculture, including agricultural waste, livestock breeding, plantation production, and straw incineration (Yang et al., 2022; Guo et al., 2022). Furthermore, scientists quantify carbon emissions from agricultural land usage by considering factors such as fertilisers, pesticides, agricultural plastic film, diesel fuel, ploughing, and irrigation (Guo and Zhang, 2023; Cui et al., 2022). The research on measuring agricultural carbon sinks encompasses four main areas: agricultural inputs, crop cultivation, carbon emissions from animal husbandry, and crop carbon absorption (Chopra et al., 2022; Wang and Qiu, 2024).
Research is conducted on agricultural carbon emission efficiency, primarily focusing on measuring efficiency (Khatri-Chhetri et al., 2023), identifying influencing factors (WU et al., 2021), and analysing regional variations (Zhang et al., 2020) based on measurements of agricultural carbon emissions and carbon sinks. Two main methods for measuring agricultural carbon emission efficiency are single-factor and total-factor. The single-factor perspective measures agricultural carbon productivity, while the total-factor perspective uses the Malmquist index model (Jiang et al., 2020) and the super-efficient SBM-DEA model (Kuang et al., 2020; Chen et al., 2021). The study primarily examines the factors influencing agricultural carbon emission efficiency, explicitly focusing on industry, aspects, and the environment. It reveals that the agricultural industry’s structure, chemical factors’ inputs, and the occurrence of agricultural disasters negatively impact agricultural carbon emission efficiency (Shan et al., 2022). Conversely, economic development, urbanisation, and financial support for agriculture have a positive influence (Li et al., 2022). Furthermore, researchers have conducted regional analyses comparing agricultural carbon emissions across national, provincial, and county boundaries, highlighting notable variations in efficiency among different regions (Su et al., 2023).
The academic community has consistently prioritised the issue of food security, leading to numerous research exploring its meaning (Mbow et al., 2020), developmental levels (Irtyshcheva et al., 2019), spatial and temporal distribution (Cooper et al., 2020), and the influencing factors (Tushar et al., 2023). The examination of the interconnection between the food security system and other systems has primarily concentrated on water, soil, urbanisation, ecological efficiency, and food security (Clapp, 2023). Several scientists have identified contradictory and mutually beneficial connections between agricultural carbon emissions and food security regarding yield increase and carbon sequestration, yield increase and emission reduction (Kong et al., 2022), carbon sequestration and emission reduction, and policy (Sun et al., 2024a). Enhancing agricultural carbon emission efficiency involves moving away from the conventional “three highs and one low” crude agricultural production methods and effectively utilising resources and energy (Elahi et al., 2024). This is beneficial for augmenting food output and improving its quality. The implementation programme of the national food security strategy aims to conserve fertilisers, water, and medicines in agricultural production (Liu and Ren, 2023). It also focuses on improving crops to achieve higher yields of new food varieties and reduce greenhouse gas emissions. This will enhance the efficiency of agricultural carbon emissions and create synergies between the two goals (Adesete et al., 2023). However, suppose a region excessively depends on chemical fertilisers, pesticides, and other agricultural substances to boost food production. This can lead to higher carbon emissions from paddy fields and N2O emissions from drylands (Khan et al., 2024). Consequently, inefficient agricultural carbon emissions can occur, which in turn can reduce future crop yields and pose a threat to food security. In such a scenario, there is a conflict between the two.
The primary regions for grain production serve the dual purposes of ensuring consistent food production and availability and promoting environmentally friendly and low-carbon agricultural practices (Wang et al., 2018). These locations have garnered significant interest from the academic community. On the one hand, the policy impact in the primary grain-producing regions can simultaneously decrease agricultural surface pollution and enhance grain production (Wei et al., 2017). It can also boost farmers’ income and ensure the stability of grain cultivation areas (Zhan et al., 2012). Additionally, there are variations in the fairness of agricultural carbon emissions among different regions in the primary grain-producing areas (Tian et al., 2021). However, implementing policies in significant grain-producing regions specifically impacts reducing carbon emissions. Additionally, combining large-scale operations (Zhu et al., 2018) and technological advancements (Wang et al., 2022) can facilitate major grain-producing areas in achieving a mutually beneficial outcome of increasing production while simultaneously reducing carbon emissions. Consequently, the majority of researchers hold the view that the impact of decreasing carbon emissions from agriculture while also guaranteeing food security (Wu Z. et al., 2024) is particularly noteworthy in regions that produce large quantities of grains.
Based on comprehensive studies regarding agricultural carbon efficiency and food security, current scholars integrate both into a unified analytical framework. Cao et al. (2024) carefully examines the correlation between agricultural carbon emission efficiency and food security in Hebei province at the regional level. Gu et al. (2023) analyses the interrelation between agricultural carbon emission efficiency and food security in Henan province, emphasising the urgent necessity to address the coordination between these two factors. At the national level, Sun et al. (2024b) modelled several government priority scenarios by modifying the model parameters and determined a stage relationship between agricultural carbon emission efficiency and food security. Wang et al. (2024) employed a systematic generalised method of moments estimation model to examine the bi-directional causality between agricultural carbon emission efficiency and food security. He et al. (2024) used a dynamic fuzzy set qualitative comparison method to explore the correlation between agricultural carbon emission efficiency and the level of coordinated growth in food security. He also identified the driving mechanisms of technology, finance, and urbanisation. Researchers have conducted extensive studies on the relationship between the two. Nevertheless, most extant research originates from provincial or national levels, with fewer investigations concentrating on primary grain-producing regions. Examining agricultural carbon efficiency and food security in key food-producing regions is particularly representative and significant to China’s agriculture. Secondly, while current research has explored the bidirectional relationship between agricultural carbon efficiency and food security, it is deficient in analyses of the nature of coordination. It has not undertaken comprehensive investigations into the regional variability of their coordinated development. Studying the origins of spatial disparities and their dynamic growth is essential for fostering coordinated development. Furthermore, the determinants and regional variability of their coordinated evolution require more investigation.
The potential marginal contributions of this study are as follows. Initially, by examining the spatial attributes of agricultural carbon emissions and sinks in primary grain-producing regions, the carbon sequestration of farmland is incorporated into the agricultural carbon emission efficiency assessment framework, utilising the Super-SBM model to enhance the scientific rigour of the measurement outcomes. Secondly, using the synergistic characteristics of both factors, the coupling coordination degree model is employed to assess the nature of the coordination between agricultural carbon emission efficiency and food security in primary grain-producing regions. The research region encompasses the Yangtze River Basin, Songhua River Basin, and Yellow River Basin. The spatial and temporal disparities and the dynamic evolution of the coupling between the two are examined utilising the Dagum Gini coefficient and the kernel density function, thereby offering a reference for future studies. Ultimately, the geo-detector and spatio-temporal geographically weighted regression model are used to examine the interaction intensity of the factors influencing the coordination of the two couplings, together with the spatial heterogeneity of these factors.
The remaining sections of the paper are structured in the following manner: Section 2 presents the theoretical analysis, Section 3 describes the material and methodology, Section 4 provides a comprehensive analysis of the findings, Section 5 offers a thorough discussion of the findings, Section 6 contains the conclusions and recommendations, and the final section addresses the limitations of the study.
2 Theoretical analysis
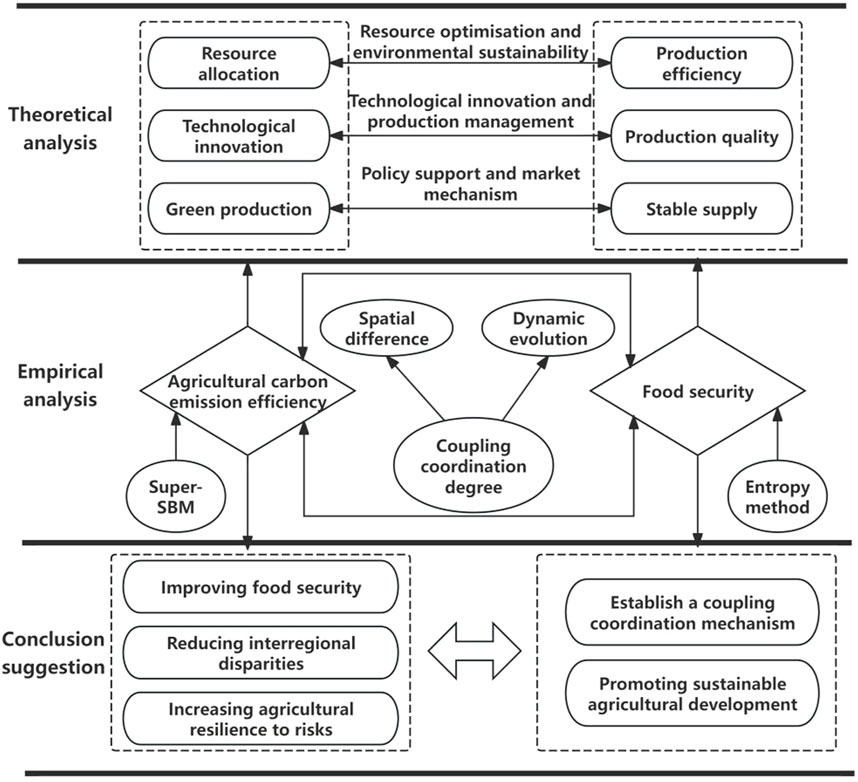
The degree of coupling coordination, also known as the degree of coordinated development, is a measure used to evaluate and research the entire system. It assesses the status of coordinated development and the virtuous cycle interaction between systems (Dong et al., 2023). The efficiency of carbon emissions in agriculture and the systems that provide food security have a mutually beneficial relationship, restricting and stimulating effects on each other.
Firstly, the focus is on optimising resources and ensuring environmental sustainability. Enhancing agricultural carbon emission efficiency often involves implementing optimal resource management strategies for water, land, fertiliser, and energy (Sun et al., 2024a). Optimisation techniques contribute to the attainment of environmental sustainability in agricultural production while simultaneously preserving the efficiency and stability of food production and maintaining food security.
Secondly, the focus is on technological advancement and efficient production management. By implementing technological advancements and adopting efficient production strategies, such as precision farming, integrated pest management, crop rotation, and intercropping systems, it is feasible to decrease carbon emissions in agricultural production significantly (Zhang Z. et al., 2022). Moreover, these practices can simultaneously enhance crop yields and quality and promote food production’s sustainability.
Thirdly, the implementation of policy support and market processes is crucial. The efficacy of agricultural carbon emissions reduction and the assurance of food security relies heavily on the combination of government policy assistance and market mechanisms. Policy incentives, financial subsidies, tax concessions, and carbon trading markets can encourage farmers and agribusinesses to adopt environmentally friendly production practices (Tushar et al., 2023). These measures also help maintain the stability of food production and supply.
Simultaneously, there are evident variations in the levels of agricultural carbon emission efficiency and food security across different regions. These disparities have resulted in noticeable regional differences in the interdependent relationship between the two factors, exhibiting distinct characteristics and patterns of coupling in each area. Hence, it is vital to thoroughly contemplate these disparities during the policy creation and execution stages and adopt specific strategies to facilitate the comprehensive amalgamation and synchronised advancement of agricultural carbon emission efficiency and food security.
Based on the findings above, the theoretical framework of this study has been established, as depicted in Figure 1:
3 Materials and methods
3.1 Study area and data sources
This study focusses on the primary grain-producing regions, encompassing 13 provinces: Heilongjiang, Henan, Shandong, Anhui, Jilin, Hebei, Jiangsu, Inner Mongolia, Sichuan, Hunan, Hubei, Liaoning, and Jiangxi. The rationale for selecting the study sample is as follows: Firstly, the primary grain-producing regions are crucial agricultural hubs in China, significantly contributing to national food security. The agricultural sector in principal grain-producing regions is highly developed. Since 2019, each province’s annual grain production has attained 20 million tonnes, culminating in exceeding 500 million tonnes, constituting 78% of the nation’s overall grain output, ensuring robust food security for China. The region’s advanced agricultural production results in considerable negative externalities, as its consumption of agricultural inputs, including chemical fertilisers, pesticides, and agricultural films, surpasses 70% of the national total. Therefore, agricultural carbon emissions in the region are markedly higher than those in other provinces in China, significantly influencing national and global food production and climate change through their agricultural carbon emission efficiency and food security status. Secondly, significant grain-producing regions are typically situated across various provinces, encompassing diverse geographic, meteorological, and soil characteristics. These regions vary in agricultural production techniques, crop varieties, and degrees of agricultural technology. Selecting primary grain-producing regions as samples can more accurately represent the overall state of agricultural carbon emission efficiency and food security in China while also being geographically representative.
This paper selects the period from 1999 to 2022 as the chronological sequence and focuses on studying 13 provincial-level administrative districts located in the primary grain-producing regions as the research samples. The data on grain output, crop planting area, irrigated area, urbanisation rate, forest coverage rate, gross domestic product, and employment in the primary industry are sourced from the China Statistical Yearbook. The information on pesticides, agricultural film, diesel fuel, ploughing, financial expenditure, crop-affected area, the total power of agricultural machinery, electricity consumption in agriculture, and the per capita income of rural inhabitants are obtained from the China Rural Statistical Yearbook. The data on cultivated land area was obtained from the China Statistical Yearbook on Land and Resources. At the same time, the information on the number of years of education of the rural labour force was sourced from the China Statistical Yearbook on Population and Employment. In cases with missing data, the linear interpolation method was employed to fill in the gaps and ensure the completeness of the data.
3.2 Research methods
3.2.1 Agricultural carbon emission efficiency model
3.2.1.1 Emission factor approach
This method fundamentally involves calculating greenhouse gas emissions by integrating activity data with emission variables, which are predominantly utilised in agriculture and other industries. This paper examines the relationship between the efficiency of carbon emissions in agriculture and food security. The focus of agricultural carbon emissions is on the plantation industry. The sources of carbon emissions include various materials used in agriculture, such as fertilisers, pesticides, agricultural films, agricultural diesel, agricultural ploughing, and irrigation (Zhao et al., 2018). Additionally, concerning the IPCC, carbon emissions from rice cultivation and nitrous oxide (N2O) emissions from the cultivation of significant grains like wheat, maise, beans, and potatoes are considered. According to the Fourth Assessment Report, N2O is transformed into standard carbon using a conversion factor 81.27 (Wu D. et al., 2024). The precise formula is as follows (see Equation 1):
where E represents the overall amount of carbon emissions from agriculture, Ei represents the specific carbon emissions from agricultural sources, Xi represents the degree of activity that produces carbon, and ɑi represents the factor determining the amount of carbon emitted (Table 1).
3.2.1.2 Agricultural carbon sink modelling
This strategy is fundamentally grounded in the theory of the carbon cycle. Plants assimilate atmospheric carbon dioxide via photosynthesis in agricultural production, transforming it into organic carbon for storage in the plant structure and soil, creating agricultural carbon sinks. Carbon sinks are simulated using a model that considers the carbon sequestration process during the growth cycle of crops in farmland systems. In this study, carbon sequestration in farmland is estimated by considering the dry mass of food crops (Ding et al., 2024; Han C. Y. et al., 2023) using the following equation (see Equation 2):
where C represents the overall amount of carbon stored in farms, Ci represents the rate at which food crops absorb carbon, Yi represents the number of crops produced, Wi represents the water content in the soil, Ri represents the coefficient that relates to the ratio of roots to crowns in plants, and Hi represents the coefficient that relates to economic factors (Table 2).
3.2.1.3 Super-SBM model
Data Envelopment Analysis is a technique employed to evaluate relative efficiency by juxtaposing input and output metrics of analogous units to ascertain the efficiency value of each unit. Nonetheless, the conventional DEA model is hindered by the issue of positioning effective decision-making units without a comprehensive ranking, and it fails to assess the efficiency value that includes undesirable outputs appropriately. Tone introduced the Super-SBM model in 2001, incorporating undesired outputs (Chen et al., 2021). This model retains the fundamental principles of the DEA model for evaluating relative efficiency while enhancing it by developing a linear programming model that includes a stochastic error term, thereby assessing the efficiency value of the decision unit within the stochastic frontier framework (Shan et al., 2022). This model is selected to determine agricultural carbon emission efficiency, with carbon emission treated as an unintended outcome. The formula used is as follows (see Equations 3, 4):
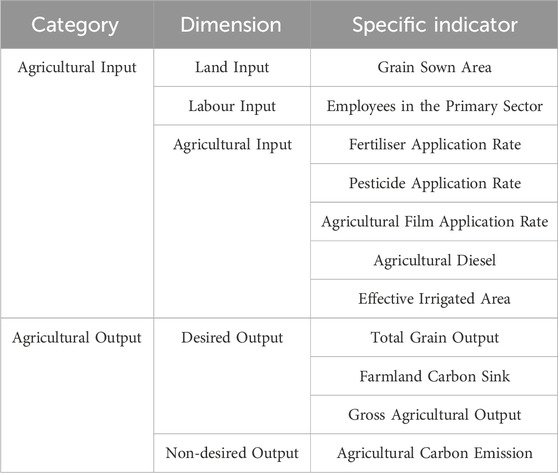
where n represents unit, m represents unit input, r1 represents expected output, and r2 represents undesired output; x, yb, and yg represent the corresponding elements in the matrix composed of input, desired output and undesired output respectively; λ represents the weight vector; CEE represents the carbon emission efficiency of agriculture. The input indicators for agricultural carbon emission efficiency are determined based on three dimensions: land, labour, and agricultural resources. The output indicators consider desired outcomes such as food production, farmland carbon sinks, total agricultural output value, and undesired outcomes of agricultural carbon emissions (Table 3).
3.2.2 Food security model
3.2.2.1 Entropy method
The entropy value method evaluates a system’s overall level by analysing the degree of dispersion. Its fundamental principle involves assessing the weight of an indicator by examining its overall relative change, resulting in a more objective and scientific assessment of the overall level compared to other methods. The degree of dispersion of these indicators is considered to assess the impact of food security indicators on the comprehensive evaluation (Bao et al., 2022). A higher degree of dispersion indicates a more significant impact on the evaluation. The precise formula is as follows (see Equations 5–9):
Standardisation of positive indicator data:
Standardisation of negative indicator data:
Determine the value of the indicator weight Pij and compute the information entropy ej:
Determine the redundancy of information entropy dj and the weight of entropy for each indication Wj:
Computation of a composite food security index FS:
where Sij represents the standardized value and Xij represents the actual value.
3.2.2.2 Construction of food security indicator system
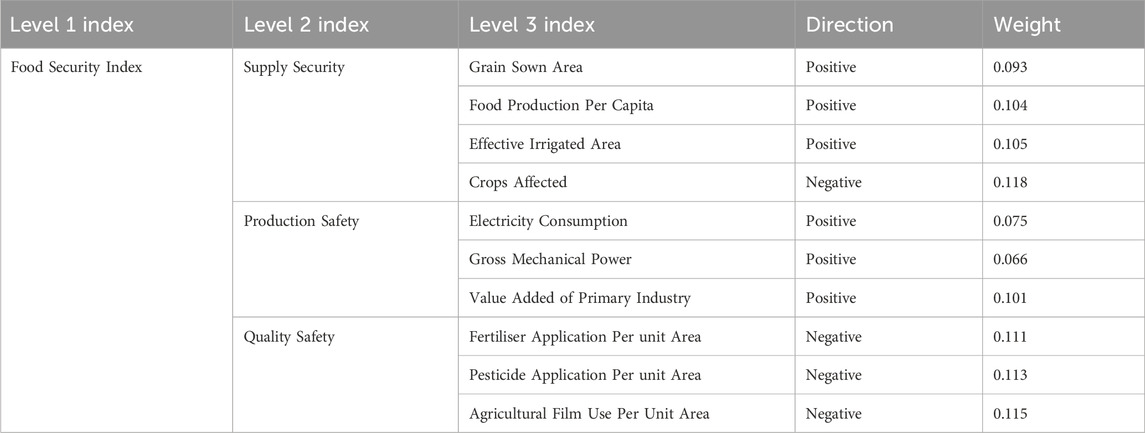
The paper’s food security index methodology considers food supply security, food production security, and food quality security. The weight of each indicator is calculated using the entropy weight approach (Irtyshcheva et al., 2019), as shown in Table 4. There is a direct correlation between the size of the cultivated land for grain, the amount of grain produced per person, the extent of irrigated land, and the level of food security. Additionally, the greater the impacted area of crops, the more detrimental it is to food security. The rise in agricultural electricity usage, the overall power of agricultural machinery, and the added value of the primary industry suggest that enhancing technological proficiency and efficiency in agricultural production contributes to food security. Increasing the usage of chemical fertilisers, pesticides, and agricultural films per unit area leads to more chemical residues in food, resulting in decreased food quality and reduced food security.
3.2.3 Coupled coordination degree model
System theory posits complex systems comprise interrelated subsystems or elements characterised by intricate coupling relationships. The coupling coordination degree model is founded on system theory, which perceives the internal components of a system as an interconnected and interactive organic entity, facilitating quantitative analysis and evaluation. The coupling coordination model is extensively employed across various domains, including regional economics, industrial growth, social management, and ecological environments. Using the coupling coordination degree model, the interaction intensity among elements can be measured, allowing for a more comprehensive analysis of the system’s operational state. This establishes a foundation for system optimisation and facilitates the identification of issues within the system, enabling the implementation of specific enhancement strategies (Sun et al., 2024a). This paper utilises the coupling coordination degree model to examine the interplay between agricultural carbon emission efficiency and food security. The particular formulas employed are as follows (see Equations 10–12):
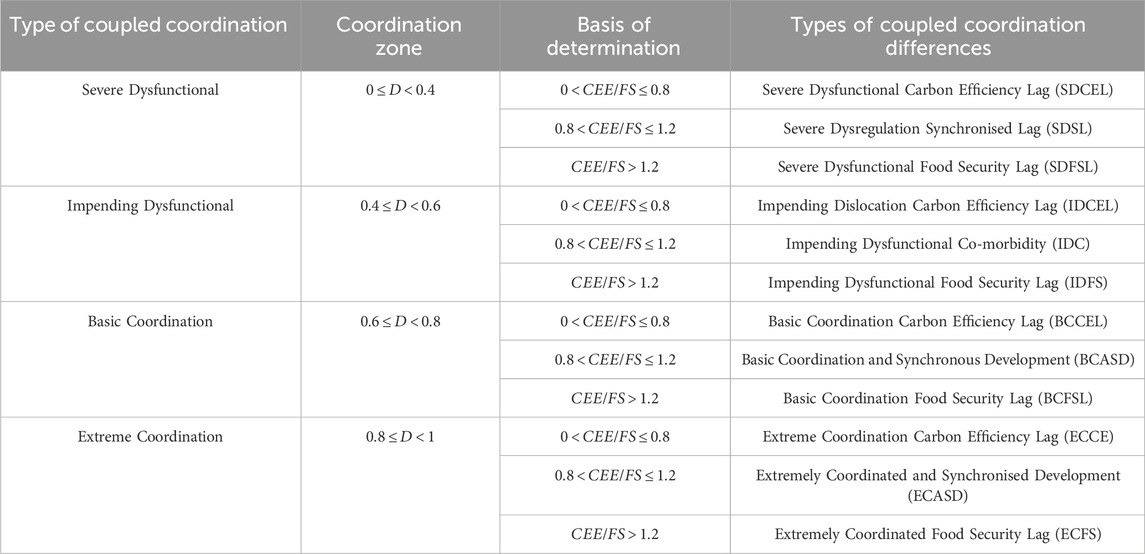
where C represents the coupling degree, and the value range is [0,1]; α and β represent coefficients to be determined. This paper believes that carbon emission efficiency and food security are equally important, so α and β are assigned the value of 0.5; D represents the coupling coordination degree. Based on previous research findings (Gu et al., 2023), the level of coupled coordination is classified into four categories: severe dysfunction, impending dysfunction, essential coordination, and extreme coordination. The coupling coordination degree is split into 12 subcategories based on the two primary characteristics of synchronous coordination and lagging dysfunction, together with the composite index of the two systems (CEE, FS) (Table 5).
3.2.4 Dagum Gini coefficient decomposition
The Gini coefficient is a conventional metric for assessing income or resource distribution inequality. In contrast, the Dagum Gini coefficient enhances and refines the Gini coefficient by employing the probability distribution function of the Dagum distribution. In comparison to the conventional Gini coefficient method, the Dagum Gini coefficient decomposition method adeptly addresses the issue of cross overlap among subsamples, allowing for the disaggregation of spatial disparities into intra-regional differences, inter-regional differences, and hypervariable density, thereby yielding more rigorous and precise measurement outcomes (Zhang L. et al., 2022). This method is primarily employed to analyse the distribution of resources across several countries, regions, or historical periods, thereby elucidating developmental disparities and imbalances among regions. This paper uses the Dagum Gini coefficient decomposition approach to examine the regional disparities and their origins in the interconnected coordination of agricultural carbon emission efficiency and food security. The specific formulas used are as follows (see Equation 13):
where n represents the number of provinces, k represents the number of total regions, nj, nh represent the number of provinces within regions j and h, yji, yhr represent the degree of coupled coordination of the two systems in any province within regions j and h, μ represents the mean value of the degree of coupled coordination of the two systems. The method decomposes the Gini coefficient G into three components: intra-regional variations Gw, inter-regional variations Gb, and hypervariance density Gt. This decomposition fulfils the equation G = Gw + Gb + Gt.
3.2.5 Non-parametric kernel density estimation
Kernel density estimation is a non-parametric method that approximates the probability density function of a dataset by applying a kernel function to each data point and aggregating the results. In cases where the distribution form of the data is unknown or intricate, non-parametric kernel density estimation serves as an effective method for estimation that does not necessitate assumptions regarding the data distribution, instead deriving inferences directly from the data samples and is suitable for distributions of all shapes and types (Han X. et al., 2023). Consequently, it effectively represents the overall distribution of the coupled coordination degree of agricultural carbon emission efficiency and food security in the main food-producing areas. Furthermore, it can capture the dynamic characteristics of this distribution over time. The specific formulas used are as follows (see Equations 14, 15):
where n represents the number of observations, xj represents the independent and identically distributed observations,
3.2.6 Geo-detector
Geodetector is a statistical tool that relies on spatial autocorrelation in the distribution of geographic phenomena. It aims to identify the causal relationship between an independent and dependent variable by examining the degree of similarity in their spatial patterns. Geodetector is extensively employed in various disciplines, including ecology, environment, and economic development. The geodetector can identify the interaction between two elements affecting the dependent variable. By computing and contrasting the q-value of each factor with the q-value of the two factors combined, one may ascertain the presence of an interaction between the two factors, as well as the nature of that interaction—whether it is strong, weak, directional, linear, or non-linear, among other characteristics (Cai et al., 2023). This paper utilises factor detection and interaction detection in geodetector to identify the driving factors and their interactions that affect the coupled coordination degree of agro-ecological efficiency and food security in the main grain-producing areas. The formulated driving factors and their interactions are as follows (see Equation 16):
where L represents the stratification of the coupling coordination degree driver X, Nh and N represent the number of samples in a specific stratum h and the entire study region, respectively;
On the basis of single-factor analysis, by comparing the q values q(Xi) and q(Xj) of the coupling and coordination degrees of pairs Xi and Xj and the q-value
3.2.7 Spatio-temporal geographically weighted regression
The GTWR model is a regression analysis technique that integrates the temporal dimension with the GWR model, which emphasises data variations in geospatial contexts and illustrates the relationships between variables across diverse geographic locations by incorporating geographic location weights. The GTWR model additionally incorporates the temporal dimension, allowing it to account for spatial and temporal variation (Zhao et al., 2023). This work presents the construction of the GTWR model utilising ArcGIS software to analyse the spatial heterogeneity of the factors influencing the linked coordination degree of agro-ecological efficiency and food security, represented by the following formula (see Equation 17):
where Di represents the degree of coupling coordination; Xij represents the driving factors;
4 Results and analyses
4.1 Agricultural carbon emissions and sinks
4.1.1 Agricultural carbon emission
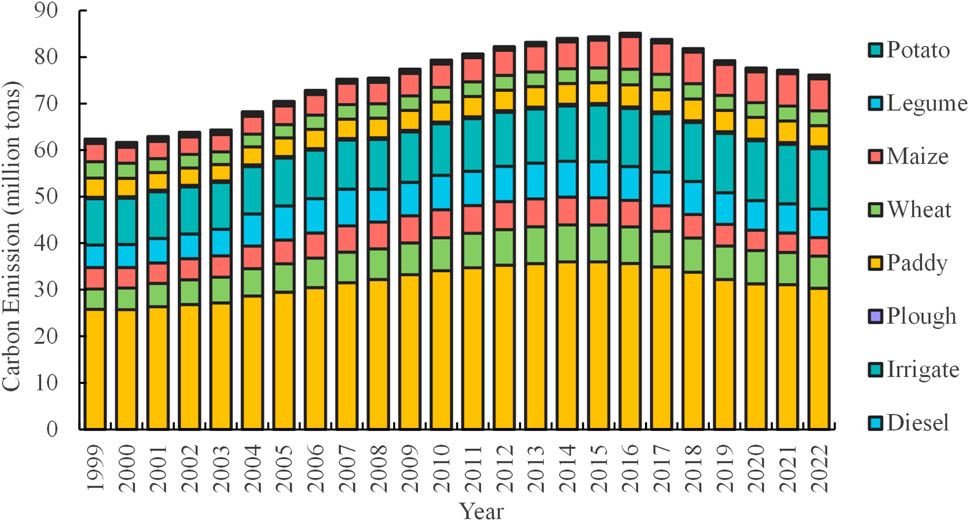
Agricultural carbon emissions in the primary grain-producing regions from 1999 to 2022 exhibit two “increase and decrease phases,” as illustrated in Figure 2. Between 1999 and 2016, overall carbon emissions rose annually due to the contribution of numerous production factors, resulting in agricultural carbon emissions reaching 85.12 million tonnes in 2016, a 36.49% increase compared to 1999. From 2016 to 2022, influenced by national policy control and the international “Carbon Emission, Carbon Peak” initiative, agricultural carbon emissions have progressively decreased, reaching 76.16 million tonnes in 2022. Agricultural input carbon emissions constituted 82.09% of total carbon emissions, with contributions from fertiliser, irrigation, diesel, agricultural film, pesticides, and ploughing in descending order. Overall emissions exhibited a trend of initially increasing, followed by a decline, with fertiliser emissions representing 41.88% of the total. Carbon emissions from agricultural soils exhibit three phases: decrease, stabilisation, and resurgence. These emissions constitute 17.91% of the total, with maise and rice contributing significantly at 6.92% and 5.68%, respectively.
4.1.2 Agricultural carbon sink
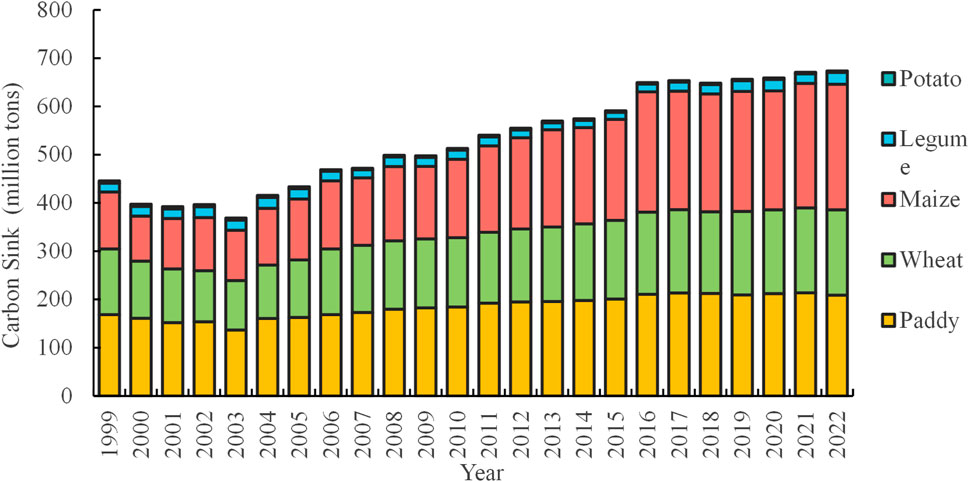
The agricultural carbon sink in primary food-producing regions from 1999 to 2022 exhibits a consistent annual increase, with a more rapid growth rate before 2016, averaging 2.39%, as illustrated in Figure 3. The overall agricultural carbon sink rose from 445.73 million tonnes in 1999 to 673.60 million tonnes in 2022, reflecting a 51.13% increase. This may pertain to the annual enhancement of soil carbon sequestration in primary grain-producing regions, the augmentation of plant growth efficiency, and the restoration and conservation of ecosystems. The composition of carbon sinks predominantly consists of rice, maise, and wheat, contributing 34.87%, 33.37%, and 27.44%, respectively, collectively exceeding 95% of the total carbon sinks, with maise exhibiting a superior average growth rate of 3.82%.
4.1.3 Spatial characterisation of inter-provincial agricultural carbon emissions and sinks
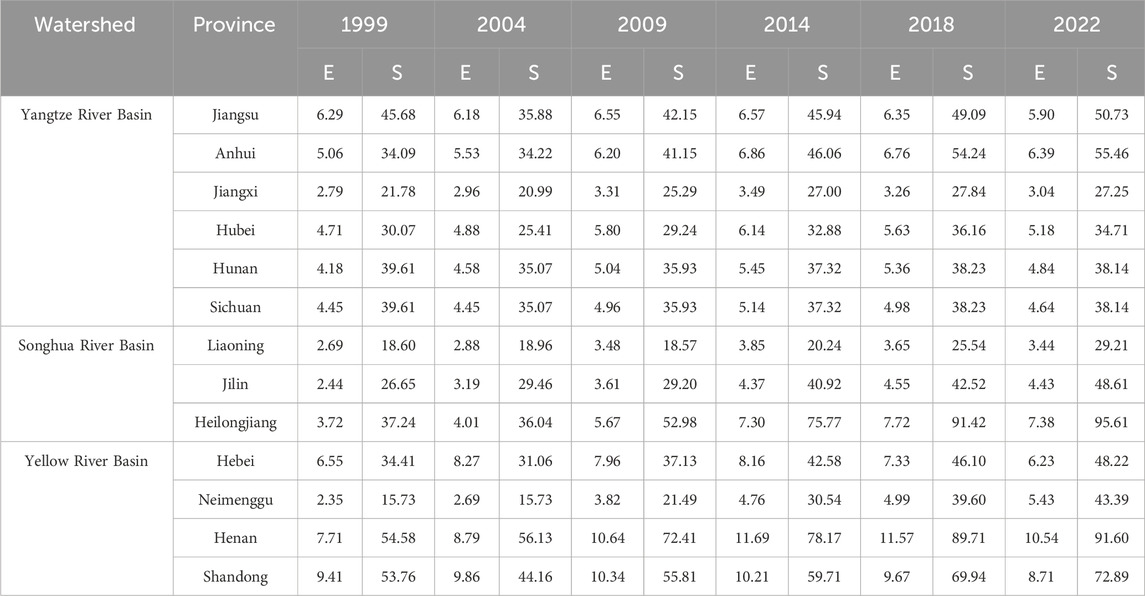
The primary grain-producing regions are categorised into the Yangtze River Basin, Songhua River Basin, and Yellow River Basin based on watershed delineations, as illustrated in Table 7. Agricultural carbon emissions in the Yangtze River Basin are moderate, exhibiting the lowest average growth rate of about 1.99%. Jiangsu Province accounts for the most agricultural carbon emissions, averaging 6.31 million tonnes. Agricultural carbon emissions in the Songhua River Basin are relatively modest, although the average growth rate is 12.09%. Notably, Heilongjiang Province exhibits the most rapid increase, with an average growth rate of 15.84%. Agricultural carbon emissions in the Yellow River Basin are elevated, demonstrating a substantial increase from 1999 to 2014, followed by a declining trend from 2014 to 2022, with an average growth rate of 3.84%. Henan Province and Shandong Province are the primary contributors, with average emissions of 10.16 million tonnes and 9.70 million tonnes, respectively. Agricultural carbon sinks in the Yangtze River basin are low, exhibiting the lowest average growth rate of merely 3.36%. In contrast, agricultural carbon sinks in the Songhua River basin are at a medium level but demonstrate a high average growth rate of 16.56%. Agricultural carbon sinks in the Yellow River basin consistently maintain a high level, with an average growth rate of 10.69%.
4.2 Spatial and temporal evolution
4.2.1 Agricultural carbon emission efficiency
From 1999 to 2022, the agricultural carbon emission efficiency in major grain-producing regions improved annually, with the average efficiency rising from 0.589 in 1999 to 0.990 in 2022, reflecting an increase of 0.401. This substantial enhancement indicates significant potential for further carbon emission reductions through technological advancements and the optimisation of input factors.
The regional and temporal distribution of agricultural carbon emission efficiency in the primary grain-producing regions is illustrated in Figure 4, revealing a pattern of elevated efficiency in the north and south, with diminished efficiency in the central area. In 1999, four provinces—Jilin, Sichuan, Hunan, and Jiangxi—exhibited no redundancy in agricultural production carbon emissions, whereas the other provinces’ agricultural carbon emission efficiencies were below 0.8. From 1999 to 2004, the agricultural carbon emission efficiencies of five provinces—Heilongjiang, Henan, Shandong, Hubei, and Liaoning—increased. From 2004 to 2014, the majority of provinces exhibited an upward trend. From 2014 to 2022, all provinces in the primary grain-producing regions showed a notable efficiency enhancement. Hubei and Inner Mongolia saw substantial improvements in agricultural carbon emission efficiency, increasing by 0.455 and 0.520, respectively. The grain cultivation structure has undergone substantial alterations, evidenced by a notable increase in the area dedicated to rice and beans, alongside a significant reduction in the area allocated for potatoes, which decreased by 58.11%. In Hubei Province, the grain farming pattern remained unchanged; nevertheless, agricultural inputs experienced a significant decline, with pesticide application decreasing by 32.59%.
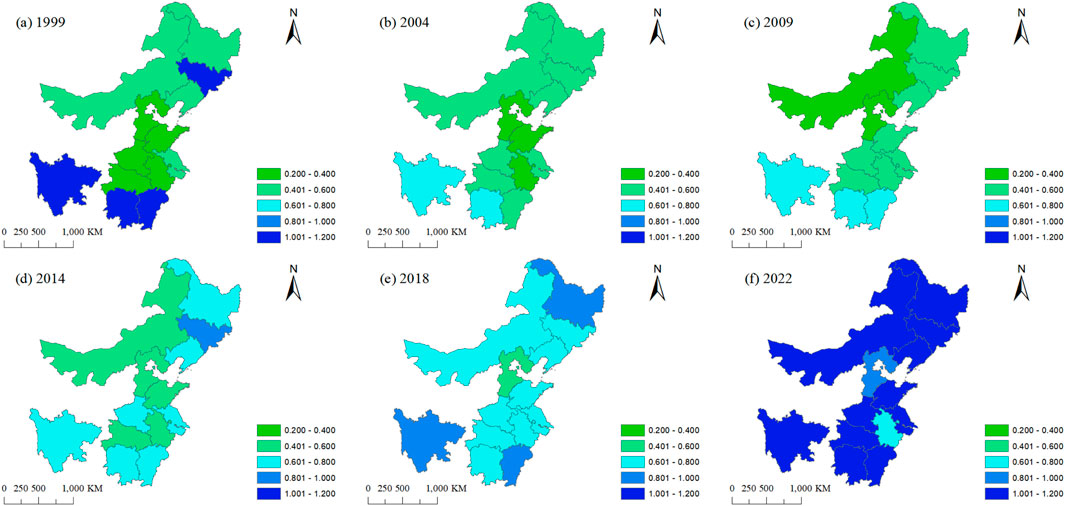
Figure 4. Spatial and temporal patterns of agricultural carbon emission efficiency. The map is obtained from Natural Earth (https://www.naturalearthdata.com/). (A) 1999; (B) 2004; (C) 2009; (D) 2014; (E) 2018; (F) 2022.
4.2.2 Food security levels
From 1999 to 2022, the food security level in primary grain-producing regions exhibited a gradual upward trajectory, with the average food security index increasing from 0.397 to 0.527, reflecting a 32.71% rise. This improvement was propelled by the medium- and long-term national food security planning initiatives, indicating further potential for enhancement in food security levels.
The regional and temporal distribution of food security levels in primary food-producing areas is illustrated in Figure 5, indicating a gradual increase in food security from the south to the north of the region. In 1999, the food security levels in most provinces were inadequate, with Heilongjiang being the sole exception exhibiting considerable safety. From 1999 to 2009, the food security levels in most provinces exhibited a fluctuating rising trend. From 2009 to 2022, food security levels in primary food-producing regions experienced substantial enhancement, with Heilongjiang, Hubei, Shandong, and Liaoning provinces exhibiting the highest average growth rates of 20.55%, 19.25%, 17.55%, and 14.86%, respectively. However, Liaoning’s food security level remains low at 0.335, significantly inferior to the other provinces. Heilongjiang Province consistently maintains high food security, achieving a score of 0.857 in 2022 because of its advantageous flat terrain, fertile black soil, and low population density.
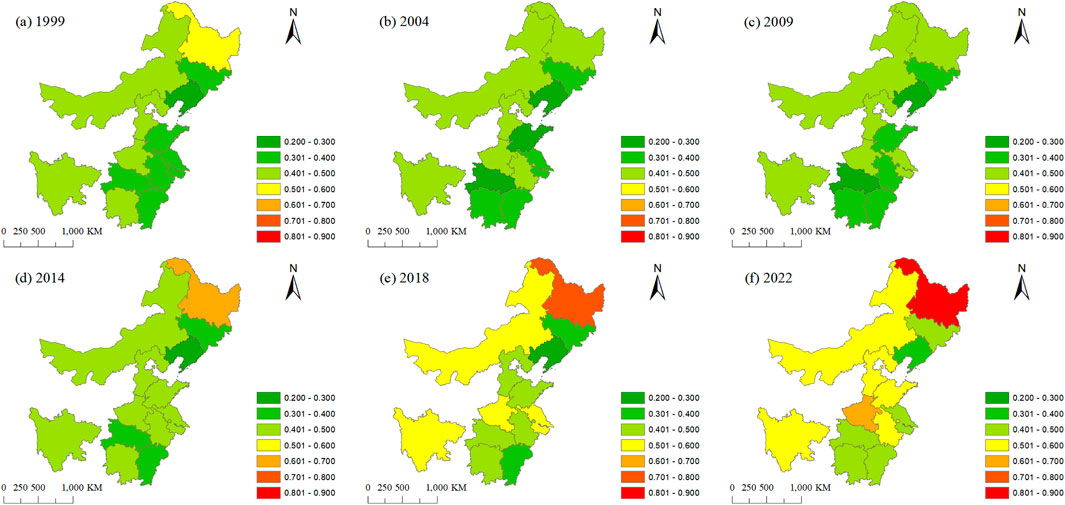
Figure 5. Spatial and temporal patterns of food security levels. The map is obtained from Natural Earth (https://www.naturalearthdata.com/). (A) 1999; (B) 2004; (C) 2009; (D) 2014; (E) 2018; (F) 2022.
4.2.3 Coupling coordination
To elucidate the characteristics of the relationship between agricultural carbon emissions efficiency and food security levels in primary food-producing regions, the coupling coordination degree model was employed to classify and analyse the coupling coordination degree. This approach identified 10 distinct coupling coordination types by integrating agricultural carbon emissions data with food security development in these areas. From 1999 to 2022, the temporal conflict between agricultural carbon emissions and food security diminishes in the provinces of primary food-producing regions, as severe dislocation virtually vanishes, imminent dislocation persists in declining, and areas of fundamental and extreme coordination consistently expand. From 1999 to 2022, the food security lagging coupling type constituted 67.95% of the total, signifying that the degree of food security is the primary factor impeding their synergistic development.
The regional and temporal patterns of the interrelationship between agricultural carbon emission efficiency and food security levels in principal grain-producing regions are illustrated in Figure 6. From 1999 to 2009, the average value of the linked coordination degree decreased from 0.530 to 0.502. Nine provinces were in a dysfunctional state in 1999, of which three provinces—Liaoning, Shandong, and Henan—were in a severe dysfunctional stage, exhibiting a significantly low level of coordination. In 2009, most provinces were categorised as near-dislocation co-loss type and near-dislocation food security lagging type, with only Heilongjiang and Sichuan advancing to the bare coordination stage. From 2009 to 2022, the coupling coordination had significant advancement, with an average growth rate of 16.34%. In 2014, the average value of the coupling coordination degree attained 0.596, indicating a favourable progression in the coordination between the efficiency of agricultural carbon emissions and food security. In 2018, the number of provinces exhibiting severe food security discrepancies decreased to zero, with only Liaoning nearing a lagging food security status. Most provinces were in essential coordination, including ten provinces such as Henan and Shandong, which were categorised as lagging in food security coordination. Meanwhile, Heilongjiang province emerged as the frontrunner, advancing into a highly coordinated and synchronous development phase. In 2022, the average coupling coordination degree attained 0.796, with five provinces—Heilongjiang, Henan, Shandong, Inner Mongolia, and Sichuan—entering the stage of highly coordinated development. However, only Heilongjiang sustains the significantly coordinated and synchronous development model, while the other provinces exhibit a lag in food security. Sichuan Province has achieved a high level of coordinated development in agricultural carbon emission efficiency and food security from 1999 to 2022. Consequently, all regions within primary food-producing areas must enhance the safeguarding of arable land, bolster scientific and technological innovation, and establish a diversified food supply system to improve food security levels consistently.
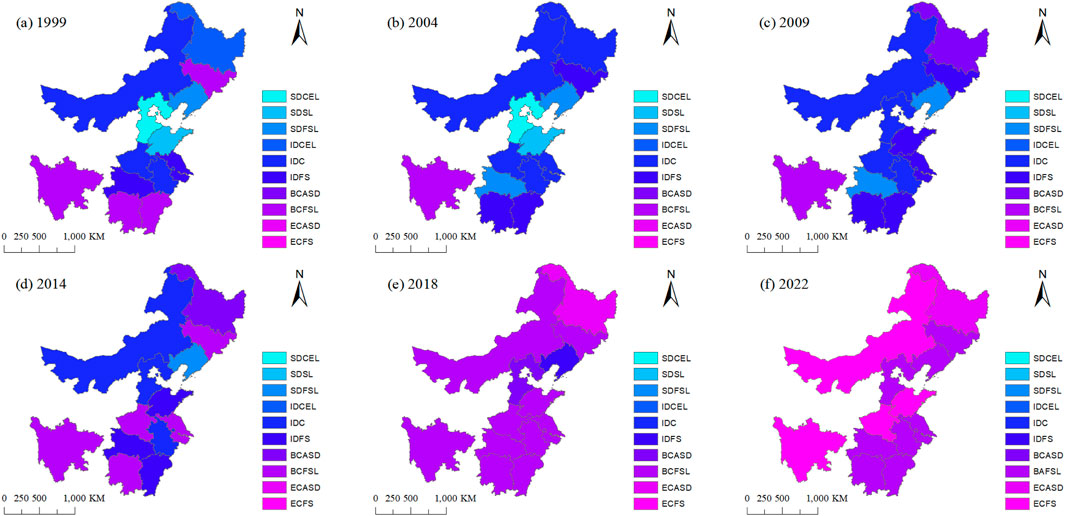
Figure 6. Spatial and temporal distribution of types of coupled coordination of agricultural carbon emission efficiency and food security. The map is obtained from Natural Earth (https://www.naturalearthdata.com/). (A) 1999; (B) 2004; (C) 2009; (D) 2014; (E) 2018; (F) 2022.
4.3 Spatial differences in coupled coordination
4.3.1 Analysis of overall spatial variation
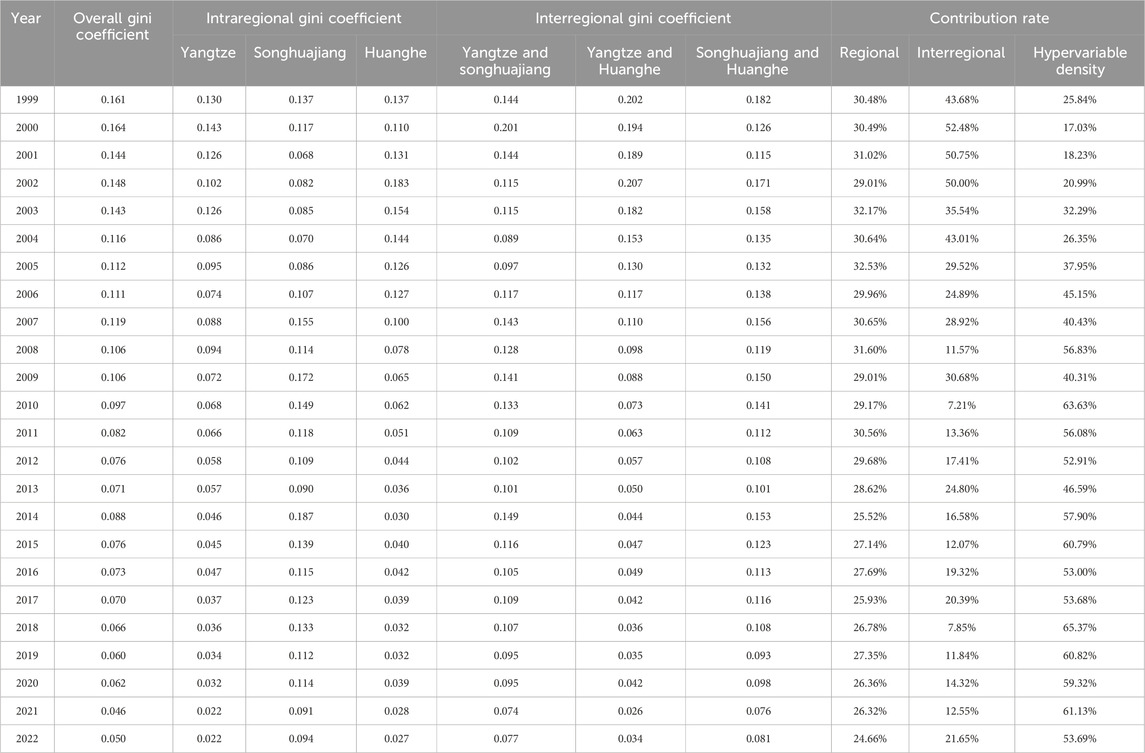
The primary grain-producing regions were categorised based on watersheds, and the Dagum Gini coefficient was utilised to assess the overall disparities in the coupled coordination of agricultural carbon emission efficiency and food security, along with the decomposition results presented in Table 8. The overall Gini coefficient indicates that the spatial disparity in the coupling and coordination of agricultural carbon emission efficiency and food security from 1999 to 2022 exhibits a fluctuating downward trend, with the Gini coefficient in 2022 decreasing by 68.94% compared to 1999, signifying a gradual reduction in regional inequality. This results from the regional coordinated development strategy enacted by the state to effectively mitigate regional development disparities, significantly contributing to the decrease in overall spatial discrepancies in the integration and synchronisation of agricultural carbon emission efficiency and food security.
4.3.2 Analysis of spatial differences in three regions
(1) Disparities within a region. Table 8 illustrates that relative to 1999, the intra-regional Gini coefficients of coupled coordination in the Yangtze River Basin, the Songhua River Basin, and the Yellow River Basin decreased by 83.08%, 31.39%, and 80.29%, respectively, indicating an improvement in the equilibrium of coupled coordination among the three significant basins due to the comprehensive execution of the coordinated regional development strategy. The mean intra-regional difference in the Songhua River basin is 0.115, characterised by a notable alternating rise and fall during 2014–2015, followed by a fluctuating decline from 2015–2022, rendering it the region with the most substantial intra-regional difference among the three principal basins. The average intra-regional disparity in coupling coordination within the Yangtze River Basin is 0.071, exhibiting a generally declining trend. The average intra-regional disparity in the Yellow River basin is 0.077, having increased from 2000 to 2002, followed by a drop from 2002 to 2022 at an average rate of 8.08%.
(2) Regional disparities. Table 8 illustrates that the Gini coefficient for the Songhua River and Yellow River Basin is the highest, averaging 0.125, while the Gini coefficient for the Yangtze River and Yellow River Basin is the lowest, averaging 0.095. The interregional Gini coefficients of the Yangtze River and Songhua River Basins, as well as those of the Yellow River and Songhua River Basins, exhibit comparable temporal trends, characterised by varying downward trajectories from 2006 to 2022, with an improvement noted in 2014. The Yangtze and Yellow River Basins consistently decline at an average rate of 6.49%. Addressing the stabilisation of inter-regional disparities among the three principal river basins in the low-level category is critical for advancing green and low-carbon agricultural growth.
(3) Factors that cause variations in space and their respective contribution rates. Table 8 illustrates that the average contribution of hypervariable density to the spatial variation of coupled coordination is 46.09%, signifying it as the principal source of the spatial variance in coupled coordination and demonstrating a significant degree of regional overlap in coordinated development. The mean contribution of intra-regional and inter-regional disparities is 28.89% and 25.02%, respectively.
4.4 Dynamic evolution in coupled coordination
4.4.1 Analysis of overall spatial evolution
Figure 7 illustrates the outcomes of the Kernel density estimation about the integrated coordination of agricultural carbon emission efficiency and food security throughout the primary food-producing regions. Figure 7A illustrates that the coupling coordination degree distribution curve in major grain-producing areas from 1999 to 2022 exhibits a consistent rightward shift, signifying a continual optimisation of the coupling coordination mode. The right-dragging tail characteristic of the coupling coordination degree distribution progressively enhances throughout the examination period, culminating in an observable increase in the central peak height and a reduction in wave width, indicating a declining trend in the differentiation of coupling coordination degree across the primary grain-producing regions.
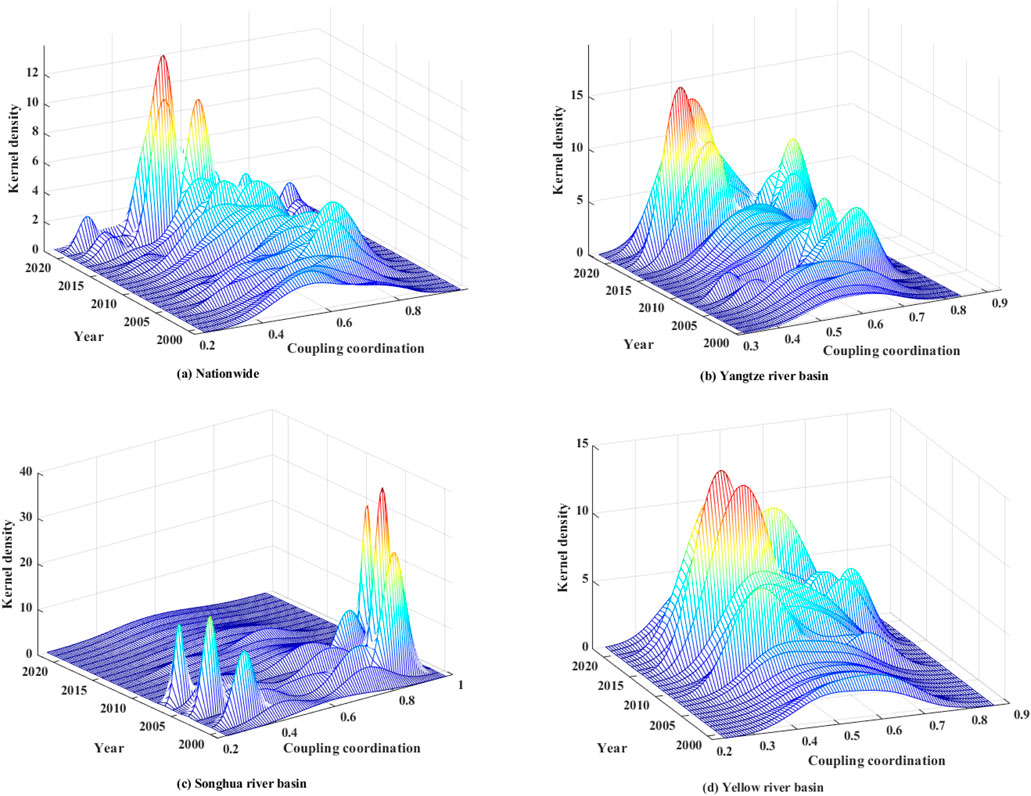
Figure 7. Kernel density estimation for coupled coordination. (A) Nation wide; (B) Yangtze river basin; (C) Songhua river basin; (D) Yellow river basin.
4.4.2 Analysis of spatial evolution in three regions
Figure 7B illustrates the Kernel density estimation findings for the coupling coordination degree of the Yangtze River Basin. The trajectory of the Yangtze River Basin from 1999 to 2022 has a multi-peak distribution, signifying multi-polar polarisation phenomena, necessitating rapid resolution of the spatial imbalance issue. Over time, the position of the wave peak exhibits a consistent rightward shift, with a notable increase in the peak since 2018, accompanied by a narrowing of the wave peak’s width. This indicates an enhancement in the coupling coordination of the Yangtze River Basin, as evidenced by a reduction in the absolute difference of the coupling coordination. Figure 7C illustrates that the primary peak of the Songhua River basin distribution curve consistently shifted to the right from 1999 to 2009, exhibiting an overall upward trend, while the width of the primary peak progressively narrowed. The elevation of the primary peak diminished considerably from 2009 to 2022. Still, the breadth expanded greatly, suggesting that the coupling coordination degree of the Songhua River basin has progressively enhanced in terms of differentiation. Figure 7D illustrates that the primary peak of the kernel density of the coupling coordination degree in the Yellow River Basin exhibits a general rightward shift over the examination period, signifying an overall increase in the coupling coordination degree of the Yellow River Basin. The data showed a bimodal distribution that transitioned to an unimodal peak between 2018 and 2019, signifying a gradual diminishment of two-level differentiation in the Yellow River Basin. Concurrently, the wave peaks exhibited enhancement while their widths contracted, suggesting a trend towards reduced disparities.
4.5 Analysis of drivers of coupled coordination
4.5.1 Driver selection
The synergistic enhancement of agricultural carbon emission efficiency and food security in principal food-producing regions results from the intricate interplay of environmental, social, and economic factors and cross-scale connectivity. Based on the research of scholars like Liu et al. (2023) and Sun et al. (2024b), nine indicators representing natural conditions, economic development, and governmental actions in primary grain-producing regions were chosen to examine the driving factors behind the synergistic development of agricultural carbon emission efficiency and food security. The indicators are delineated below:
(1) Arable land extent (X1). The extent of cultivated land is a fundamental resource for food production, directly linked to food production and supply. The rapid urbanisation and population expansion have resulted in a decline of arable land, presenting a significant challenge to food security. Moreover, arable land is both a source of carbon emissions and a crucial mechanism for carbon sequestration. The carbon storage potential of arable land systems can be enhanced by optimising farming practices and advancing ecological agriculture, thus diminishing agricultural carbon emissions. The configuration and organisation of agricultural output can be improved through strategic planning and utilisation of arable land, increasing agricultural carbon emissions’ efficiency. Defined by the aggregate expanse of cultivable land in primary grain-producing regions.
(2) Agricultural disaster frequency (X2). The number of agricultural disasters directly influences crop yields; a high disaster rate can substantially decrease yields, impacting the food supply’s stability. Yield variability presents a significant risk to food security. An expansion of the area affected by crop disasters may not only result in diminished crop yields. Still, it may also incite the overutilisation of fertilisers, pesticides, and other agricultural inputs, therefore elevating agricultural carbon emissions. It was defined by the proportion of the impacted crop area to the total cultivated area.
(3) Crop cultivation structure (X3). Diverse crop planting configurations necessitate varying quantities and types of fertilisers and pesticides. Optimising crop planting configurations and minimising the cultivation area of crops with elevated fertiliser and pesticide requirements helps mitigate agricultural carbon emissions. A varied agricultural system can enhance the stability and resilience of food production. Prudent crop rotation and intercropping can sustain soil health and improve soil fertility. It was defined by the proportion of area cultivated for food to the total area sown with crops.
(4) Level of economic advancement (X4). An elevation in economic growth facilitates the judicious utilisation of resources, encompassing agricultural, human, and capital resources. Economic development serves as a crucial catalyst for agricultural modernisation, enhancing food production and quality while mitigating carbon emissions in the agricultural production process, thereby achieving the dual objectives of agricultural carbon emission efficiency and food security. Defined by GDP per capita.
(5) Urbanisation rate (X5). With the rise in urbanisation, the diminishing arable land compels the agriculture sector to utilise land resources more efficiently and minimise excessive carbon emissions. Urbanisation-induced alterations in the labour force structure may influence labour inputs for food production while simultaneously facilitating the dissemination and use of agricultural technologies to enhance the quality and efficiency of food production. Defined by the proportion of the urban populace within the overall population.
(6) Degree of agricultural mechanisation (X6). Agricultural mechanisation can markedly enhance the efficiency of agricultural output, and by diminishing labour inputs and decreasing production costs, it can subsequently reduce energy reliance and carbon emissions. The research, development, and implementation of agricultural machinery that enhances energy efficiency and reduces emissions further diminish carbon emissions during agricultural machinery operations. Agricultural mechanisation facilitates uniform and standardised operational operations, including planting, fertilising, irrigating, and harvesting, enhancing food quality and safety, as defined by agricultural gear’s whole power capacity.
(7) Rural human capital index (X7). Enhancing rural human capital signifies an augmentation in farmers’ education, skills, and knowledge. Farmers may diminish carbon emissions from agricultural production and to improve food security by adopting innovative technologies and renewable energy sources. Human capital is accumulative and can be systematically assigned to many production methods. Defined by a weighted average of years of schooling among the rural workforce.
(8) Degree of financial assistance to agriculture (X8). Financial aid for agriculture facilitates agricultural modernisation by offering monetary support and policy direction, motivating farmers to embrace low-carbon agricultural technologies and advancing the transformation of agricultural production practices. Enhancing agricultural infrastructure bolsters the resilience and stability of agricultural production against disasters. Facilitate innovation in agricultural science and technology and talent development to advance and revolutionise agricultural science and technology. Defined by allocating funds to agriculture, forestry, and water management as a proportion of overall fiscal spending.
(9) Degree of soil erosion management (X9). Efficient soil and water erosion management can augment soil’s carbon sequestration potential, transform atmospheric carbon dioxide into organic carbon, and elevate the agricultural carbon sink capacity. It safeguards arable land resources, mitigates soil erosion and degradation, and preserves soil fertility, assuring food production’s stability and sustainability. Defined by the domain of soil erosion management.
4.5.2 Analysis of driver interaction detection
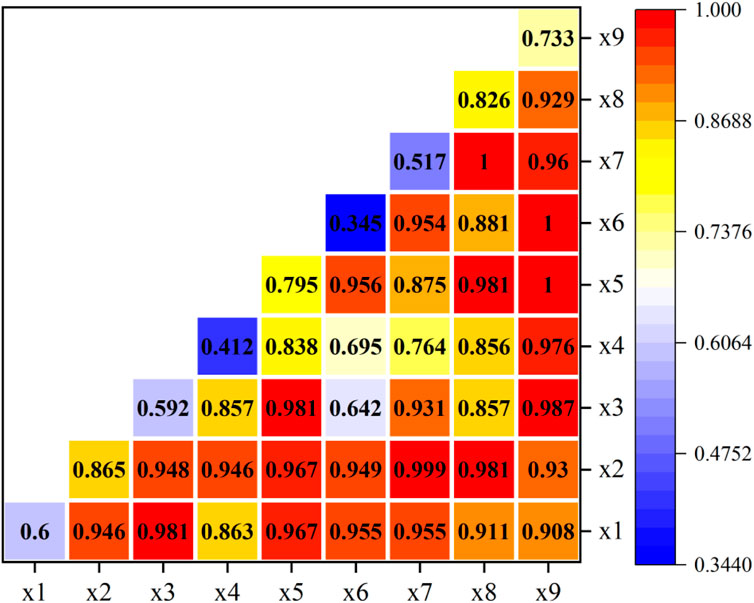
The fundamental factors influencing the synergistic development of the two systems and their intensity were assessed using geo-detectors. All nine indicators demonstrated significance at the 1% level. The primary determinants were the agricultural disaster rate (X2), urbanisation level (X5), financial support for agriculture (X8), and soil erosion control (X9). Figure 8 illustrates the interaction effect of each driving component on the coupling coordination degree of agricultural carbon emission efficiency and food security. The explanatory capacity of the nine driving factors, following two-by-two interactions, is nonlinearly augmented or enhanced by two factors to varying extents, signifying that the degree of coupling coordination between agricultural carbon emission efficiency and food security in primary grain-producing regions is influenced by the interplay of multiple factors. The primary interacting determinants are rural human capital, financial assistance for agriculture, urbanisation rate, soil erosion control, and the power of agricultural machinery concerning soil erosion management. This suggests that economic development, natural resources, and governmental actions in primary food-producing regions must be harmonised to create a reciprocal synergy of internal transformation and external influence, thereby attaining the multiplier effect of synergistic development between the two systems.
4.5.3 Analysis of spatial heterogeneity of drivers
Spatio-temporal spatially weighted regression was utilised to examine the spatial heterogeneity of the factors influencing the linked coordination degree of agricultural carbon emission efficiency and food security. Before executing the regression, covariance analysis was conducted on the nine drivers to ascertain the model’s validity. Consequently, the VIF for each factor was below 10, signifying the absence of covariance issues and confirming the validity of the regression results. The R2 of the GTWR model is 0.973, and the AICc is −1119.57, signifying a solid fit of the GTWR model. Consequently, the driving factor coefficients for each spatial unit element were computed utilising the GTWR model and hierarchically represented by the natural breakpoint approach, with the results illustrated in Figure 9.
(1) The cultivated land area is inconsistent with the degree of coupling coordination. The areas of positive value are predominantly located in the Songhua River and Yellow River Basins, with the Yellow River Basin experiencing the most significant beneficial impact. Areas with negative values are predominantly located in the Yangtze River Basin. The spatial peaks in the north and troughs in the south suggest that increasing arable land in the northern region enhances agricultural carbon emission efficiency and fosters harmonious food security development. In contrast, provinces in the Yangtze River Basin should pursue moderate arable land expansion.
(2) The rate of agricultural disasters is inversely connected with the level of coupling coordination. A rise in the frequency of agricultural disasters will directly result in a decline in the level of coupling coordination. The Henan, Shandong, Liaoning, and Hebei provinces represent a negative high-value low area, signifying that fluctuations in the agricultural disaster rate significantly affect the degree of coupling coordination; thus, the agricultural risk resilience in these regions should be enhanced.
(3) The relationship between crop cultivation structure and coupling coordination degree is unstable. Areas of positive and high value are concentrated in the Songhua River basin, suggesting that the Northeast region’s pivotal role in ensuring China’s food security should be further leveraged. Inner Mongolia is the sole region exhibiting negative values, signifying that modifications in the planting structure will alter the agricultural industry’s framework, adversely affecting the efficiency of agricultural carbon emissions and food security.
(4) The extent of economic development is positively correlated with the degree of coupling coordination. The elevation of economic status will directly enhance the degree of coupling coordination. Elevated values are concentrated in the Yellow River Basin, signifying that enhanced economic levels facilitate the implementation of more precise policies and optimise resource allocation, hence boosting the degree of linkage coordination in the Yellow River Basin.
(5) The urbanisation rate exhibits an inconsistent correlation with the degree of coupling coordination. Areas of negative high value are concentrated in the Songhua River Basin, signifying that variations in urbanisation levels significantly affect the degree of coupling coordination. This underscores the Northeast region’s need to prioritise agricultural development during urbanisation.
(6) The degree of agricultural mechanisation exhibits an inconsistent relationship with the coupling coordination degree. The Heilongjiang, Sichuan, and Jiangsu provinces are identified as high-value locations, suggesting that growth in mechanisation levels enhances coupling coordination. Areas with negative values are predominantly located in the Yellow River Basin, signifying that heightened mechanisation correlates with increased energy consumption and carbon emissions. Therefore, enhancing the effective integration of water resources and energy management within the Yellow River Basin is imperative.
(7) The extent of rural human capital is positively correlated with the degree of coupling coordination. The enhancement of human capital will directly increase the degree of linkage coordination. The locations of high positive value are concentrated in the Yellow River Basin, exhibiting an intermediate high spatial pattern.
(8) The relationship between financial support for agriculture and the degree of coupling coordination is inconsistent. Shandong, Henan, and Hebei are significant high-value regions, and these three provinces should be prioritised for financial assistance to agriculture, which would strengthen food security and facilitate the revitalisation of the seed sector. The area has an elevation pattern in the east and a depression in the west.
(9) The link between soil erosion control and coupling coordination degree is unstable. Areas with positive values are predominantly located in the Yangtze River Basin, signifying that enhanced soil erosion control significantly improves the natural environment. Negative values are prevalent in the Songhua River Basin and the Yellow River Basin, indicating a weak synergy between soil erosion management and eco-agricultural advancement, thereby constraining the enhancement of the coupling coordination between agricultural carbon emission efficiency and food security.
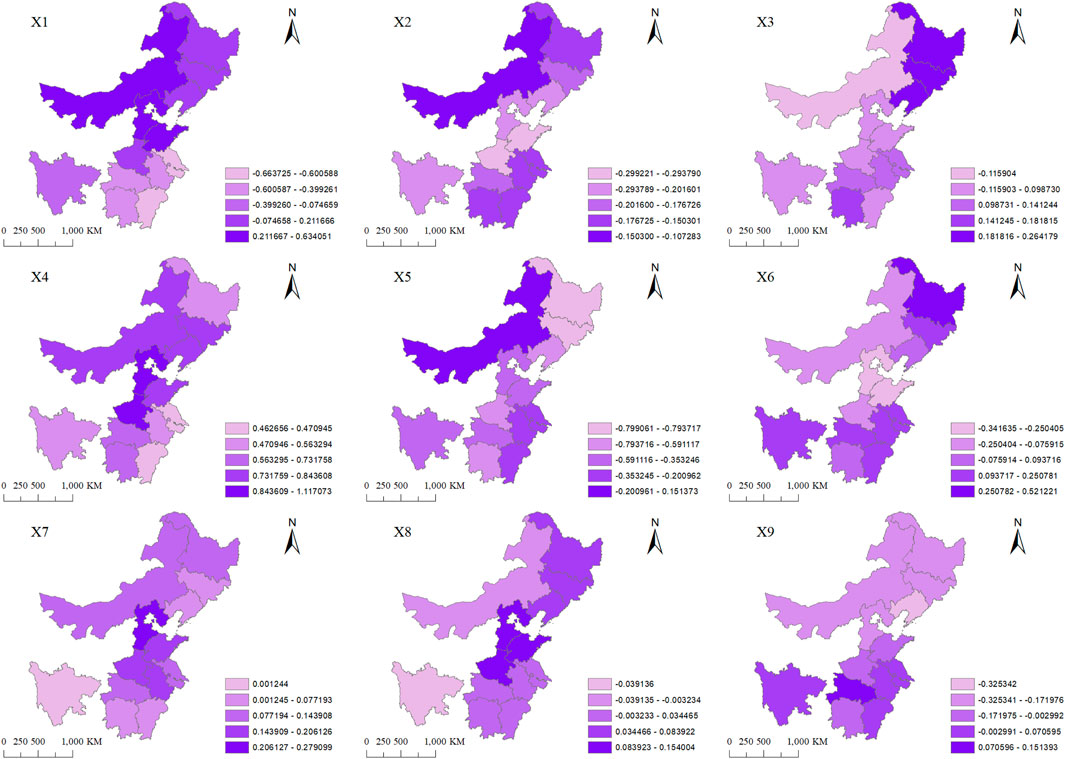
Figure 9. Spatial distribution of the impact of drivers on coupled coordination. The map is obtained from Natural Earth (https://www.naturalearthdata.com/). (X1) Arable land extent; (X2) Agricultural disaster frequency; (X3) Crop cultivation structure; (X4) Level of economic advancement; (X5) Urbanisation rate; (X6) Degree of agricultural mechanisation; (X7) Rural human capital index; (X8) Degree of financial assistance to agriculture; (X9) Degree of soil erosion management.
5 Discussion
This study offers a novel perspective on the literature in multiple facets. Scholars have established a connection between the intertwined development of agricultural carbon emission efficiency and food security; however, existing research predominantly emphasises the analysis of their significance, interrelations, and coordination pathways. Opportunities remain for advancements in elucidating the varieties of coupled coordination, geographical disparities, and determinants of agricultural carbon emission efficiency and food security. The interplay between the two can be further examined in the subsequent aspects:
(1) The associated coordination between agricultural carbon emission efficiency and food security in most provinces within the primary grain-producing regions is characterised by a trailing food security type. The inadequate degree of food security has emerged as the primary impediment to the advancement of their integration. The insufficient food security status will impede the enhancement of agricultural carbon emission efficiency. Due to the declining food security status, applying inputs such as chemical fertilisers and pesticides may need to be augmented in agricultural production to sustain food output (Shao, 2024). This exacerbates agricultural carbon emissions and results in soil contamination and ecological degradation, constraining agricultural carbon emission efficiency enhancement.
(2) The regional disparities in the coupling and coordination of agricultural carbon emission efficiency and food security in principal food production regions mainly stem from hypervariable density. The disparities in resource endowment and agricultural production conditions across various geographical units can result in varying levels of carbon emission efficiency and food security (Hao et al., 2024). Furthermore, the policy orientation and economic development levels in different regions may influence investment and technological innovation in agricultural production, subsequently impacting carbon emission efficiency and food security (Feng et al., 2024). Additionally, regional market demand and consumption habits can affect agricultural product production and marketing, influencing food security and carbon emission efficiency.
(3) Enhancing economic growth, rural human capital, and mitigating agricultural disasters can substantially improve the coordination between agricultural carbon emission efficiency and food security in key food-producing regions. Economic development can enhance the optimisation and advancement of agricultural industrial structures, so fostering the green development of agriculture reduces carbon emissions and improves the sustainability of food production (Rong et al., 2023). The enhancement of rural human capital signifies the advancement of farmers’ education, skill proficiency, and innovative capacity, elevating the scientific and technological quality and added value of agricultural produce. Reduced occurrences of agricultural disasters contribute to the stability and sustainability of food production while enhancing the efficiency of agricultural carbon emissions (Wei et al., 2023).
6 Conclusion and recommendations
The study focuses on 13 provinces within primary grain-producing regions, employing the Super-SBM model, coupled coordination degree model, Dagum Gini coefficient decomposition method, non-parametric kernel density estimation, geo-detector, and spatio-temporal geo-weighted regression to analyse the spatio-temporal characteristics of the coupling and coordination between agricultural carbon emission efficiency and food security, as well as regional disparities and influencing factors. The subsequent findings are derived from the following:
(1) The proportion of carbon emissions from agricultural inputs in primary grain-producing regions exceeds 80%, with rice, maise, and wheat accounting for over 95% of total carbon sinks. In contrast, the Yellow River Basin’s agricultural carbon emissions and sinks remain elevated. Minimising agricultural inputs or enhancing their utilisation efficiency is essential for decreasing agricultural carbon emissions; the efficiency of these emissions has been increasing annually, exhibiting a spatial and temporal pattern characterised by higher levels in the northern and southern regions and lower levels in the central area. The overall degree of food security is increasing, exhibiting a spatial gradient from south to north, transitioning from low to high, with most provinces demonstrating a low level of food security. The disparate advancement of primary food-producing regions is notable, necessitating a varied regional development strategy to foster balanced growth across each area.
(2) A robust correlation exists between agricultural carbon emission efficiency and food security in primary food-producing areas, with a continual rise in places exhibiting essential and highly coordinated relationships. In 2022, only Heilongjiang had a highly coordinated and synchronous development model, while the food security trailing model predominated. The inadequate food security in China is the primary issue hindering coordinated development.
(3) The overall spatial disparity between agricultural carbon emission efficiency and food security in primary food-producing regions exhibits a fluctuating decline, with hypervariable density serving as the principal source of spatial variation in coupled coordination, signifying a high degree of regional crossover and overlap in coordinated development. The general polarisation of the interconnected coordination between agricultural carbon emission efficiency and food security is progressively diminishing, exhibiting heightened multipolarity in the Yangtze River Basin and increasing divergence in the Songhua River Basin. Consequently, interregional connectivity must be considered while devising regional development initiatives.
(4) The explanatory capacity of the two-by-two interactions among the driving factors is nonlinearly augmented or enhanced by two factors to varying extents. The primary interaction factors influencing agricultural carbon emission efficiency and food security are rural human capital and financial support for agriculture, urbanisation rate and soil erosion control, and agricultural machinery power and soil erosion control. Economic development and the improvement of rural human capital facilitate paired coordinated development, but the incidence of agricultural disasters hinders it. The cultivated land area, crop cultivation structure, urbanisation rate, agricultural mechanisation, financial support for agriculture, and soil erosion control exert inconsistent impacts on the degree of coupling coordination.
Based on the above findings, the following policy recommendations are made:
(1) Enhancing agricultural inputs and increasing utilisation efficiency. Carbon emissions from agricultural inputs in primary food-producing regions constitute about 80% of the total. The government should proactively direct farmers and agricultural enterprises to enhance the composition of agricultural inputs, diminish the utilisation of high-carbon inputs like chemical fertilisers and pesticides, and promote the adoption of low-carbon alternatives such as organic fertilisers and bio-pesticides. Advocate for sophisticated agricultural technology and equipment to enhance the efficacy of agricultural capital utilisation. Enhance oversight of agricultural material utilisation in critical regions, such as the Yellow River Basin, to ensure adherence to regulations and optimise efficiency.
(2) Implement tailored regional development plans. To address the issue of uneven development in principal grain-producing regions, the government ought to devise tailored regional development programs that reflect the specific circumstances of each area. In regions exhibiting elevated agricultural carbon emission efficiency yet diminished food security, it is imperative to augment food production inputs to enhance both food production and quality, ensuring food security. In places exhibiting elevated food security yet diminished agricultural carbon emission efficiency, the emphasis should be on advancing energy-saving and emission-reduction technology to mitigate agricultural carbon emissions. Enhance inter-regional collaboration and exchanges to advance the synchronised growth of agricultural carbon emission efficiency and food security.
(3) Enhance regional linkages and foster coordinated growth. Given the significant regional interdependence and overlap in integrated development, the government should enhance inter-regional connectivity and facilitate resource sharing and complementary strengths among regions. Implement a cross-regional monitoring system for agricultural carbon emissions and food security to accurately track real-time variations in agricultural carbon emission efficiency and regional food security levels. Foster collaboration and exchanges among regions to collectively advance the synchronised growth of agricultural carbon emission efficiency and food security, particularly in areas with significant disparities, such as the Yangtze River Basin and Songhua River Basin.
(4) Enhance driver management and policy assistance. The government is advised to augment financial expenditure, particularly in rural education and agricultural technologies, to elevate the quality of rural human capital. Promote the integration of urban development and ecological conservation, particularly in regions experiencing significant soil erosion, to attain a mutually beneficial outcome between economic advancement and environmental safeguarding through strategic urban planning and ecological compensation frameworks. Advocate for the amalgamation of agricultural mechanisation with sustainable development, enhance the efficacy of agricultural machinery via technological innovation and policy direction, and reinforce soil and water conservation and remediation initiatives to mitigate the environmental impact of agricultural production. Enhancing agricultural disaster early warning systems and risk management to minimise the effects of natural catastrophes on agricultural output and safeguard food security.
7 Limitations
This study has specific restrictions that facilitate the growth and depth of future research.
(1) The data source for this study primarily depends on publicly accessible statistics and literature. While these data possess a degree of authority and reliability, they may be influenced by factors such as the quality of the statistics, the frequency of data updates, and regional disparities, leading to inherent limitations and uncertainties in the data.
(2) This study acknowledges the interaction of various driving forces, yet it is possible that significant elements were omitted from the analysis. Future studies should broaden their scope to thoroughly examine additional factors influencing agricultural carbon emission efficiency and food security, thereby elucidating their interconnected and coordinated driving mechanisms.
(3) In examining the spatial and temporal attributes of the interconnected coordination between agricultural carbon emission efficiency and food security, certain methodological constraints may persist despite applying many sophisticated methodologies for analysis. Model parameter configurations and data preprocessing variables may influence it. Future research should further investigate and refine research methodologies to augment the accuracy and dependability of the findings.
Data availability statement
The original contributions presented in the study are included in the article/Supplementary Material, further inquiries can be directed to the corresponding author.
Author contributions
AL: Conceptualization, Data curation, Formal Analysis, Methodology, Software, Writing–original draft. SY: Funding acquisition, Supervision, Writing–review and editing.
Funding
The author(s) declare financial support was received for the research, authorship, and/or publication of this article. Fund Project: Natural Science Foundation of Heilongjiang Province (LH2023G014); Daqing Philosophy and Social Science Planning Research Project (DSGB-ZX18).
Conflict of interest
The authors declare that the research was conducted without any commercial or financial relationships that could be construed as a potential conflict of interest.
Generative AI statement
The author(s) declare that no Generative AI was used in the creation of this manuscript.
Publisher’s note
All claims expressed in this article are solely those of the authors and do not necessarily represent those of their affiliated organizations, or those of the publisher, the editors and the reviewers. Any product that may be evaluated in this article, or claim that may be made by its manufacturer, is not guaranteed or endorsed by the publisher.
Supplementary material
The Supplementary Material for this article can be found online at: https://www.frontiersin.org/articles/10.3389/fenvs.2024.1503733/full#supplementary-material
References
Adesete, A. A., Olanubi, O. E., and Dauda, R. O. (2023). Climate change and food security in selected Sub-Saharan African Countries. Environ. Dev. Sustain. 25 (12), 14623–14641. doi:10.1007/s10668-022-02681-0
Bao, B., Jiang, A., and Jin, S. (2022). What drives the fluctuations of “green” development in China’s agricultural sector? An entropy method approach. Pol. J. Environ. Stud. 31 (4), 3491–3507. doi:10.15244/pjoes/147135
Cai, Z., Zhang, Z., Zhao, F., Guo, X., Zhao, J., Xu, Y., et al. (2023). Assessment of eco-environmental quality changes and spatial heterogeneity in the Yellow River Delta based on the remote sensing ecological index and geo-detector model. Ecol. Inf. 77, 102203. doi:10.1016/j.ecoinf.2023.102203
Cao, Y., Ji, X., Yao, J., Xu, N., Chen, M., Yang, X., et al. (2024). Research on coupling coordination of agricultural carbon emission efficiency and food security in Hebei province, China. Sustainability 16 (13), 5306. doi:10.3390/su16135306
Chen, M., Cui, Y., Jiang, S., and Forsell, N. (2022). Toward carbon neutrality before 2060: trajectory and technical mitigation potential of non-CO2 greenhouse gas emissions from Chinese agriculture. J. Clean. Prod. 368, 133186. doi:10.1016/j.jclepro.2022.133186
Chen, Y., Miao, J., and Zhu, Z. (2021). Measuring green total factor productivity of China’s agricultural sector: a three-stage SBM-DEA model with non-point source pollution and CO2 emissions. J. Clean. Prod. 318, 128543. doi:10.1016/j.jclepro.2021.128543
Chopra, R., Magazzino, C., Shah, M. I., Sharma, G. D., Rao, A., and Shahzad, U. (2022). The role of renewable energy and natural resources for sustainable agriculture in ASEAN countries: do carbon emissions and deforestation affect agriculture productivity? Resour. Policy 76, 102578. doi:10.1016/j.resourpol.2022.102578
Clapp, J. (2023). Concentration and crises: exploring the deep roots of vulnerability in the global industrial food system. J. Peasant Stud. 50 (1), 1–25. doi:10.1080/03066150.2022.2129013
Cooper, M. W., Brown, M. E., Niles, M. T., and ElQadi, M. M. (2020). Text mining the food security literature reveals substantial spatial bias and thematic broadening over time. Glob. Food Secur. 26, 100392. doi:10.1016/j.gfs.2020.100392
Cui, Y., Khan, S. U., Sauer, J., and Zhao, M. (2022). Exploring the spatiotemporal heterogeneity and influencing factors of agricultural carbon footprint and carbon footprint intensity: embodying carbon sink effect. Sci. Total Environ. 846, 157507. doi:10.1016/j.scitotenv.2022.157507
Ding, Y. L., Zhao, N. N., Li, M., Liang, M. Y., Gao, X. R., Wang, J. C., et al. (2024). Spatial characteristics of carbon sources/sinks and carbon footprints of farmland crop production in Northern Shaanxi, China. Ecol. Lett. 44 (11), 4574–4583. doi:10.20103/j.stxb.202308191793
Dong, Q., Zhong, K., Liao, Y., Xiong, R., Wang, F., and Pang, M. (2023). Coupling coordination degree of environment, energy, and economic growth in resource-based provinces of China. Resour. Policy 81, 103308. doi:10.1016/j.resourpol.2023.103308
Elahi, E., Zhu, M., Khalid, Z., and Wei, K. (2024). An empirical analysis of carbon emission efficiency in food production across the Yangtze River basin: towards sustainable agricultural development and carbon neutrality. Agric. Syst. 218, 103994. doi:10.1016/j.agsy.2024.103994
Feng, Y., Liu, W., Zhang, H., Li, Q., and Zhu, A. (2024). Synergistic assessment of environmental pollutants and carbon emissions in the Yellow River Basin, China: an integrated study based on scenario simulation and process decomposition. Ecol. Indic. 166, 112334. doi:10.1016/j.ecolind.2024.112334
Gu, R., Duo, L., Guo, X., Zou, Z., and Zhao, D. (2023). Spatiotemporal heterogeneity between agricultural carbon emission efficiency and food security in Henan, China. Environ. Sci. Pollut. Res. 30 (17), 49470–49486. doi:10.1007/s11356-023-25821-z
Guo, L., Zhao, S., Song, Y., Tang, M., and Li, H. (2022). Green finance, chemical fertilizer use and carbon emissions from agricultural production. Agriculture 12 (3), 313. doi:10.3390/agriculture12030313
Guo, Z., and Zhang, X. (2023). Carbon reduction effect of agricultural green production technology: a new evidence from China. Sci. Total Environ. 874, 162483. doi:10.1016/j.scitotenv.2023.162483
Han, C. Y., Zhao, X. C., and Hu, Y. J. (2023). Spatial and temporal differences in agricultural carbon balance and carbon offsetting potential in Hunan province counties. Soil Water Conservation Bull. 43 (05), 343–354. doi:10.13961/j.cnki.stbctb.2023.05.040
Han, X., Wang, Y., Yu, W., and Xia, X. (2023). Coupling and coordination between green finance and agricultural green development: evidence from China. Finance Res. Lett. 58, 104221. doi:10.1016/j.frl.2023.104221
Hao, D., Xu, R., Du, B., Yang, J., and Liu, W. (2024). Does carbon reduction and sequestration conflict with food security in rural China? what, why and how? Sci. Total Environ. 947, 173871. doi:10.1016/j.scitotenv.2024.173871
He, H., Zhang, Z., Ding, R., and Shi, Y. (2024). Multi-driving paths for the coupling coordinated development of agricultural carbon emission reduction and sequestration and food security: a configurational analysis based on dynamic fsQCA. Ecol. Indic. 160, 111875. doi:10.1016/j.ecolind.2024.111875
Irtyshcheva, I., Ponomarova, M., and Dolzhykova, I. (2019). Conceptual fundamentals of development of the food security system. Baltic J. Econ. Stud. 5 (2), 57–64. doi:10.30525/2256-0742/2019-5-2-57-64
Jiang, X., Ma, J., Zhu, H., Guo, X., and Huang, Z. (2020). Evaluating the carbon emissions efficiency of the logistics industry based on a Super-SBM Model and the Malmquist Index from a strong transportation strategy perspective in China. Int. J. Environ. Res. Public Health 17 (22), 8459. doi:10.3390/ijerph17228459
Khan, A. A., Mei, B., Khan, S. U., and Luo, J. (2024). Agri-food evolution and carbon emissions in Chinese residential consumption: a life cycle analysis of urban-rural disparities and socioeconomic influences. Environ. Impact Assess. Rev. 105, 107387. doi:10.1016/j.eiar.2023.107387
Khatri-Chhetri, A., Sapkota, T. B., Maharjan, S., Cheerakkollil Konath, N., and Shirsath, P. (2023). Agricultural emissions reduction potential by improving technical efficiency in crop production. Agric. Syst. 207, 103620. doi:10.1016/j.agsy.2023.103620
Kong, X., Su, L., Wang, H., and Qiu, H. (2022). Agricultural carbon footprint and food security: an assessment of multiple carbon mitigation strategies in China. China Agric. Econ. Rev. 14 (4), 686–708. doi:10.1108/CAER-02-2022-0034
Kuang, B., Lu, X., Zhou, M., and Chen, D. (2020). Provincial cultivated land use efficiency in China: empirical analysis based on the SBM-DEA model with carbon emissions considered. Technol. Forecast. Soc. Change 151, 119874. doi:10.1016/j.techfore.2019.119874
Lee, C. C., Zeng, M., and Luo, K. (2024). How does climate change affect food security? Evidence from China. Environ. Impact Assess. Rev. 104, 107324. doi:10.1016/j.eiar.2023.107324
Li, J., Li, S., Liu, Q., and Ding, J. (2022). Agricultural carbon emission efficiency evaluation and influencing factors in Zhejiang province, China. Front. Environ. Sci. 10, 1005251. doi:10.3389/fenvs.2022.1005251
Li, L., Han, J., and Zhu, Y. (2023). Does environmental regulation in the form of resource agglomeration decrease agricultural carbon emissions? Quasi-natural experimental on high-standard farmland construction policy. J. Clean. Prod. 420, 138342. doi:10.1016/j.jclepro.2023.138342
Liu, J., and Ren, Y. (2023). Can digital inclusive finance ensure food security while achieving low-carbon transformation in agricultural development? Evidence from China. J. Clean. Prod. 418, 138016. doi:10.1016/j.jclepro.2023.138016
Liu, L., Wang, X., Meng, X., and Cai, Y. (2023). The coupling and coordination between food production security and agricultural ecological protection in main food-producing areas of China. Ecol. Indic. 154, 110785. doi:10.1016/j.ecolind.2023.110785
Mbow, C., Rosenzweig, C. E., Barioni, L. G., Benton, T. G., Herrero, M., Krishnapillai, M., et al. (2020) Food security. IPCC. Available at: https://ntrs.nasa.gov/api/citations/20200001724/downloads/20200001724.pdf.
Nabernegg, S., Bednar-Friedl, B., Muñoz, P., Titz, M., and Vogel, J. (2019). National policies for global emission reductions: effectiveness of carbon emission reductions in international supply chains. Ecol. Econ. 158, 146–157. doi:10.1016/j.ecolecon.2018.12.006
Pan, T., Jin, G., Zeng, S., and Wang, R. (2024). Spatial-temporal divergence characteristics and driving factors of green economic efficiency in the Yangtze River economic belt of China. Chin. Geogr. Sci. 34, 1158–1174. doi:10.1007/s11769-024-1452-7
Rong, J., Hong, J., Guo, Q., Fang, Z., and Chen, S. (2023). Path mechanism and spatial spillover effect of green technology innovation on agricultural CO2 emission intensity: a case study in Jiangsu Province, China. Ecol. Indic. 157, 111147. doi:10.1016/j.ecolind.2023.111147
Shan, T., Xia, Y., Hu, C., Zhang, S., Zhang, J., Xiao, Y., et al. (2022). Analysis of regional agricultural carbon emission efficiency and influencing factors: case study of Hubei Province in China. PLoS One 17 (4), e0266172. doi:10.1371/journal.pone.0266172
Shao, H. (2024). Agricultural greenhouse gas emissions, fertilizer consumption, and technological innovation: a comprehensive quantile analysis. Sci. Total Environ. 926, 171979. doi:10.1016/j.scitotenv.2024.171979
Su, L., Wang, Y., and Yu, F. (2023). Analysis of regional differences and spatial spillover effects of agricultural carbon emissions in China. Heliyon 9 (6), e16752. doi:10.1016/j.heliyon.2023.e16752
Sun, C., Xia, E., Huang, J., and Tong, H. (2024a). Coupled coordination and pathway analysis of food security and carbon emission efficiency under climate-smart agriculture orientation. Sci. Total Environ. 948, 174706. doi:10.1016/j.scitotenv.2024.174706
Sun, C., Xia, E., Huang, J., and Tong, H. (2024b). Coupling and coordination of food security and agricultural carbon emission efficiency: changing trends, influencing factors, and different government priority scenarios. J. Environ. Manag. 370, 122533. doi:10.1016/j.jenvman.2024.122533
Tian, P., Li, D., Lu, H., Feng, S., and Nie, Q. (2021). Trends, distribution, and impact factors of carbon footprints of main grains production in China. J. Clean. Prod. 278, 123347. doi:10.1016/j.jclepro.2020.123347
Tushar, S. R., Alam, M. F. B., Zaman, S. M., Garza-Reyes, J. A., Bari, A. M., and Karmaker, C. L. (2023). Analysis of the factors influencing the stability of stored grains: implications for agricultural sustainability and food security. Sustain. Operations Comput. 4, 40–52. doi:10.1016/j.susoc.2023.04.003
Wang, H., Chen, H., Tran, T. T., and Qin, S. (2022). An analysis of the spatiotemporal characteristics and diversity of grain production resource utilization efficiency under the constraint of carbon emissions: evidence from major grain-producing areas in China. Int. J. Environ. Res. Public Health 19 (13), 7746. doi:10.3390/ijerph19137746
Wang, H., and Qiu, T. (2024). The effects of farmer cooperatives on agricultural carbon emissions reduction: evidence from rural China. J. Clean. Prod. 450, 141881. doi:10.1016/j.jclepro.2024.141881
Wang, J., Zhang, Z., and Liu, Y. (2018). Spatial shifts in grain production increases in China and implications for food security. Land use policy 74, 204–213. doi:10.1016/j.landusepol.2017.11.037
Wang, R., Deng, X., Fang, Y., Bai, W., and Chen, J. (2024). Examination of the relationship between agricultural carbon emission efficiency and food quality and safety: from the perspective of environmental regulation. Environ. Sci. Pollut. Res. 31 (1), 481–493. doi:10.1007/s11356-023-31214-z
Wei, S., Zhou, Q., Luo, Z., She, Y., Wang, Q., Chen, J., et al. (2023). Economic impacts of multiple natural disasters and agricultural adaptation measures on supply chains in China. J. Clean. Prod. 418, 138095. doi:10.1016/j.jclepro.2023.138095
Wei, X., Zhang, Z., Wang, P., and Tao, F. (2017). Recent patterns of production for the main cereal grains: implications for food security in China. Reg. Environ. Change 17, 105–116. doi:10.1007/s10113-016-0977-4
Wu, D., Zhang, Z., Liu, D., Zhang, L., Li, M., Khan, M. I., et al. (2024). Calculation and analysis of agricultural carbon emission efficiency considering water–energy–food pressure: modeling and application. Sci. Total Environ. 907, 167819. doi:10.1016/j.scitotenv.2023.167819
Wu, Z., Feng, X., Zhang, Y., and Fan, S. (2024). Repositioning fertilizer manufacturing subsidies for improving food security and reducing greenhouse gas emissions in China. J. Integr. Agric. 23 (2), 430–443. doi:10.1016/j.jia.2023.12.007
Wu, H., Huang, H., He, Y., and Chen, W. K. (2021). Measurement, spatial spillover and influencing factors of agricultural carbon emissions efficiency in China. Chin. J. Eco-Agriculture 29 (10), 1762–1773. doi:10.13930/j.cnki.cjea.210204
Yang, H., Wang, X., and Bin, P. (2022). Agriculture carbon-emission reduction and changing factors behind agricultural eco-efficiency growth in China. J. Clean. Prod. 334, 130193. doi:10.1016/j.jclepro.2021.130193
Zhan, J. T., Wu, Y. R., Zhang, X. H., and Zhou, Z. (2012). Why do farmers quit from grain production in China? Causes and implications. China Agric. Econ. Rev. 4 (3), 342–362. doi:10.1108/17561371211263365
Zhang, H., Guo, S., Qian, Y., Liu, Y., and Lu, C. (2020). Dynamic analysis of agricultural carbon emissions efficiency in Chinese provinces along the Belt and Road. PloS one 15 (2), e0228223. doi:10.1371/journal.pone.0228223
Zhang, L., Ma, X., Ock, Y. S., and Qing, L. (2022). Research on regional differences and influencing factors of Chinese industrial green technology innovation efficiency based on dagum gini coefficient decomposition. Land 11 (1), 122. doi:10.3390/land11010122
Zhang, Z., Shi, K., Tang, L., Su, K., Zhu, Z., and Yang, Q. (2022). Exploring the spatiotemporal evolution and coordination of agricultural green efficiency and food security in China using ESTDA and CCD models. J. Clean. Prod. 374, 133967. doi:10.1016/j.jclepro.2022.133967
Zhao, M., Wang, H., Sun, J., Tang, R., Cai, B., Song, X., et al. (2023). Spatio-temporal characteristics of soil Cd pollution and its influencing factors: a Geographically and temporally weighted regression (GTWR) method. J. Hazard. Mater. 446, 130613. doi:10.1016/j.jhazmat.2022.130613
Zhao, R., Liu, Y., Tian, M., Ding, M., Cao, L., Zhang, Z., et al. (2018). Impacts of water and land resources exploitation on agricultural carbon emissions: the water-land-energy-carbon nexus. Land Use Policy 72, 480–492. doi:10.1016/j.landusepol.2017.12.029
Keywords: agricultural carbon efficiency, food security, coupled coordination, spatial and temporal variation, geographically weighted regression
Citation: Liu A and Yang S (2024) Study on the spatio-temporal coupling and drivers of agricultural carbon emission efficiency and food security. Front. Environ. Sci. 12:1503733. doi: 10.3389/fenvs.2024.1503733
Received: 29 September 2024; Accepted: 18 November 2024;
Published: 02 December 2024.
Edited by:
Juan Lu, Nanjing Agricultural University, ChinaReviewed by:
Yalong Zhang, Ningbo University of Finance and Economics, ChinaFan Xuerui, Lanzhou University, China
Copyright © 2024 Liu and Yang. This is an open-access article distributed under the terms of the Creative Commons Attribution License (CC BY). The use, distribution or reproduction in other forums is permitted, provided the original author(s) and the copyright owner(s) are credited and that the original publication in this journal is cited, in accordance with accepted academic practice. No use, distribution or reproduction is permitted which does not comply with these terms.
*Correspondence: Shuguo Yang, cmh3eXNnQDE2My5jb20=
 Anzhi Liu
 Shuguo Yang*