 Mengqi Yang
 Xing Tang
- 1Fintech Department of CCCC Capital Holdings Co., Ltd., Beijing, China
- 2Institute of Traffic Engineering, Nanjing Vocational University of Industry Technology, Nanjing, Jiangsu, China
Introduction: The factors that significantly and negatively impact carbon dioxide (CO2) emissions and coastal water quality (CWQ) must be continuously monitored and thoroughly evaluated. Among these, tourism (TR) volume stands out as one of the primary contributors to such effects. In contrast, green fiscal policy (GFP) and fintech (FT) can be considered proactive and modern efforts contributing to the improvement of these environmental indicators. Exploring whether the impacts of these factors exhibit uniformity across quantiles will greatly benefit strategic solutions aimed at avoiding resource waste.
Methods: This paper aims to calibrate procedures to apply the method of moment quantile regression (MMQR) model to address this issue. Firstly, cross-sectional dependence (CSD) among the variables is examined. Next, a stable long-term relationship between the variables is assessed using stationarity analysis. Finally, the MMQR estimation is conducted to thoroughly investigate the impact of independent variables on CWQ and CO2 across different quantiles.
Results: The results from both the fixed effects (FE-OLS) and dynamic ordinary least squares (D-OLS) models reveal stable and significant correlations between the regressors and response variables. The research findings indicate that GFP and FT exert a significant impact on improving both CWQ and reducing CO2. In contrast, the favorable growth of the TR sector contributes negatively to CWQ and CO2.
Discussion: The paper recommends that the government increase spending and investment in green projects utilizing renewable energy, green transportation, blockchain technology, and advanced techniques. It also advocates for a strategic approach to controlling TR, focusing on enhanced waste management, in order to improve CWQ and CO2 indicators across most quantiles.
1 Introduction
Coastal water quality (CWQ) and the reduction of environmental emissions (EE) are two of the most critical priorities for sustaining ecosystems and the viability of human habitats (Bierman et al., 2011; Kai et al., 2024). China, despite being the 6th largest nation in terms of total water resources, ranked the 13 most water-scarce nations globally, with per capita water availability falling below 300 m³ (Liu et al., 2021). The overexploitation of both surface and groundwater, combined with the gradual degradation of water quality, has compounded water security challenges, impeding both economic growth and ecological recovery (Gao et al., 2020). Over the past decade, China’s surface water quality has been clustered as poor and severely degraded due to the rapid pace of economic growth. The ecosystems, public health, soil quality, and environment have all suffered greatly as a result of this degradation (He and Perloff, 2016). Recognizing the significance of surface water quality, the Chinese government has undertaken numerous efforts through various campaigns and initiatives aimed at improving this indicator. As a result, notable achievements in water quality have been realized. In 2022, the percentage of CWQ meeting the standard Grade I and II reached 81.9%, an increase of 0.6% points compared to 2021. Specifically, the area matching the Grade I standard declined by 4.9%, while the area satisfying the Grade II grew by 5.5%. The proportion of CWQ below Grade IV dropped by 0.7 percentage points to 8.9%, with inorganic nitrogen and active phosphate remaining the primary pollutants (Ministry of Ecology and Environment People’s Republic of China, 2022).
In terms of emissions, in 2022, China emitted 12.7 billion metric tons of carbon dioxide (CO2) (Statista, 2024), accounting for 32,9% of global emissions. As part of its approach to combat air pollution and decrease carbon footprint, China has methodically implemented a range of carbon neutrality campaigns and the emissions trading scheme (Du et al., 2022). Research has demonstrated that these policy measures have been essential in enabling China to reach its goal of reducing its carbon footprint. China’s “National Comprehensive Demonstration of Energy Saving and Emission Reduction Fiscal Policy” was studied using a lagged dif-ference-in-differences model to investigate the comprehensive effect of green fiscal policy (GFP) on the reduction of CO2 and other pollutants (Fan and Liang, 2023). They indicated that GFP could considerably mitigate CO2 and the more pronounced synergistic effect was recognized in cities experiencing lower fiscal pressure. Another study expanded policy discussions by examining the influences of energy generation and GFP measures on the exhausted CO2 of BRICS nations (Ma et al., 2023). Based on the study’s findings, it can be observed that government spending exacerbated energy consumption and increased emissions. Li et al. (2023) analyzed the influence of GFP and stringent regulations on consumption-based CO2 (CCO2). The findings indicated that economic development, nonrenewable energy, and government spending exacerbated CCO2, whereas tax revenue, the stringency of environmental policies, and renewable energy helped reduce CCO2. This provides critical evidence for a more detailed understanding of how economic development impacts energy decomposition and CCO2 emissions across different quantiles. Consequently, it supports the integration of renewable energy development policies with economic growth strategies to mitigate negative effects on CCO2 emissions.
Tourism (TR), as one of the major economic drivers, contributes significantly to environmental deterioration, negative social and cultural effects, and the fragmentation of natural habitats (Lukoseviciute and Panagopoulos, 2021). Furthermore, coastal sites, which are frequently at the forefront of the TR sector, face the brunt of water pollution caused by improper disposal of solid trash and food residues. This pollution manifests as eutrophication, in which nutrient overloads, mainly nitrogen and phosphorus, cause algal blooms, resulting in oxygen depletion in coastal waters and harming marine biodiversity. The link between TR-induced emissions and water pollution puts additional strain on ecosystems, particularly in coastal places that are already sensitive to the variations of climate change. The massive flood of visitors not only increases demand for food and energy, resulting in higher carbon emissions, but it also hastens the deterioration of water quality due to increasing rubbish production. For example, cruise liners, a major means of transportation, are renowned for releasing massive amounts of untreated sewage and greywater directly into the ocean, adding to coastal ecosystem degradation (Lloret et al., 2021; Vu-Thi-Minh et al., 2024). This not only upsets the natural equilibrium of marine habitats but also poses long-term dangers to the livelihoods of coastal people, tying economic and ecological interests together in a web of interdependence. Xu et al. (2024) identified the effects of fintech (FT), TR, and investment in natural resources on environmental sustainability in leading tourist arrival countries. This study successfully identifies the inverse impact and quantifies the effects of FT and TR on CO2 across different quantiles. Additionally, it recommends the adoption of CO2 emission standards for the TR and hospitality sector to ensure that companies within this industry are compelled to transition toward sustainable practices.
FT involves the integration of artificial intelligence applications, blockchain, and other robust information technologies into the field of finance, which is currently transforming financial services (Cheng et al., 2023). In addressing interwoven challenges of CO2 emissions, the role of FT as a financial enabler for sustainable environmental practices becomes increasingly apparent (Leng et al., 2024). By facilitating carbon credit trading systems and enabling decentralized financing for clean energy projects within the TR industry, FT can support the reduction of emissions at a systemic level. At the same time, FT innovations in traceability and transparency of food production and waste streams can bridge the gap between TR operators and sustainable resource management, fostering a more resilient and eco-friendlier TR ecosystem. FT has been increasingly recognized as a supportive and driving mechanism for promoting renewable energy and biomass energy sources (Bui-Duy et al., 2023). The intersection of FT with environmental sustainability thus offers a promising avenue for tackling the complex dynamics between TR, water pollution, and emissions, ensuring a balanced approach to economic growth and environmental stewardship. The National Development and Reform Commission of China and the Ministry of Finance jointly released a financial policy on energy conservation and pollution elimination, which promised to help pilot city governments better integrate financial policies for energy generation and pollution elimination while also making it easier to achieve sustainable development objectives (Miao et al., 2023).
In this study, we examine the factors, including GFP, FT, and TR, for some reasons. First, GFP integrated with FT can fund sustainable TR projects, providing opportunities for small and medium-sized enterprises in the TR sector to access advanced capital and technology, potentially leading to positive environmental impacts. Second, FT reduces transaction and monitoring costs associated with GFP implementation, enabling TR businesses to more effectively meet sustainability requirements. Third, the simultaneous consideration of these three factors remains underexplored in previous studies.
Our review highlights some gaps in the literature. First, studies exploring the relationship between FT and CWQ are lacking. Second, while some studies examined the impacts of green fiscal policies (GFP) and TR on CO2 emissions across quantiles, these studies have not extended their scope to CWQ and do not consider FT’s simultaneous effects on CWQ. Consequently, the government and local authorities may lack an accurate assessment of whether the current policies are more effective in addressing air pollution or marine water pollution, or the extent of their effectiveness under varying levels of pollution—low, moderate, or high. This is crucial for evaluating whether resources allocated to these policies are being used efficiently or wasted.
Another gap can be recognized in considering detailed insights into short-term heterogeneity, as the AMG (augmented mean group) and CCEMG (common correlated effect means group) methods rely on assumptions of uniform short-term dynamics across units and group-averaged effects. Moreover, previous methods are well-suited for normal distributions, whereas our dataset exhibits asymmetry. By employing MMQR, we effectively address this asymmetry, mitigate the impact of outliers, better capture nonlinear relationships, and handle cross-sectional dependence (CSD) with greater flexibility. Consequently, the effects of explanatory variables on the dependent variable across different quantiles can be comprehensively examined. Given that GFP, FT, and TR do not always exhibit linear impacts on CO2 emissions and CWQ, the utilization of MMQR provides valuable insights for developing more precise and targeted policy interventions.
This paper aims to investigate the asymmetric relationship between three independent factors—GFP, TR, and FT—and two environmental indicators, namely, CO2 emissions and CWQ. Also, we explore whether the current GFP policies and FT activities are more effective in addressing air or marine water pollution, and which environmental indicator is more adversely affected by TR activities. Additionally, their effectiveness is investigated corresponding to varying levels of pollution. The study makes some novel contributions. First, we examine whether the impacts of these independent factors on the environment are positive or negative. Second, we investigate the extent of their influence on the two environmental indicators across different quantiles. Third, based on our findings, we identify the key measures necessary for the sustainable implementation and management of GFP, TR, and FT to foster more positive environmental outcomes. This paper is structured as follows. Section 2 begins with a fundamental theoretical foundation, develops the research procedures, and establishes hypotheses. Section 3 describes the research methodologies, and analyzes the data. The discussions of the findings are implemented in Section 4. Finally, Section 5 highlights the theoretical and practical significance. Also, the limitations and directions for future research are discussed and suggested.
2 Conceptual framework and hypothesis establishment
By enabling sustainable practices and prohibiting environmentally destructive actions, the GFP can accelerate carbon neutrality. Governments can shift economic activity to low-carbon alternatives by introducing policies such as carbon taxes, renewable energy subsidies, and green infrastructure projects. These regulations stimulate not just the use of clean technologies, but also the reduction of greenhouse gas emissions by industries and consumers (Fan and Liang, 2023). Furthermore, GFP can enhance public awareness and engagement in sustainability initiatives, leading to a collective reduction in carbon footprints across various sectors (Benkhodja et al., 2023). It can employ environmental taxes and fees as penalties to raise the cost of emissions for polluting businesses, thereby internalizing the external costs associated with environmental damage (Fan and Liang, 2023). One significant impact of GFP is its potential influence on the renewable energy sector (Zhang et al., 2022). Alongside monetary policy, tight fiscal policies have been identified as effective measures for mitigating CO2 emissions (Chishti et al., 2021). Numerous studies also advocate for governments to adopt policies that impose higher taxes on petroleum and major polluting sources while increasing subsidies for renewable energy industries and green technologies (Li et al., 2024; Ran et al., 2024). One of GFP’s tools, environmental taxes, has garnered significant attention in Europe and other developed economies as a means to encourage investment in renewable energy. In developing countries, 78.64% of environmental tax revenue comes from energy taxes, which account for 6% of total tax revenue and 4% of GDP (Orlov and Aaheim, 2017). Current research emphasizes that to promote investment in environmentally friendly energy sources, governments must impose taxes on activities that harm the natural environment. Such environmental taxes are expected to boost investment in renewable energy, thereby enhancing ecological efficiency.
Based on previous literature, we develop the below hypothesis.
Hypothesis 1. GFP plays an essential role in contributing to EE.
In terms of the CWQ, GFP has been implemented in a diversified manner. Measures such as subsidies for eco-friendly technologies, taxes on pollution-intensive activities, and investments in waste management and water treatment infrastructure can effectively decrease the discharge of pollutants into coastal areas. By encouraging industries and municipalities to adopt cleaner technologies and practices, GFP enables the reduction of coastal water pollution, including runoff from agriculture, industrial discharges, and untreated sewage (Wang et al., 2022). Additionally, these policies can incentivize the protection and restoration of coastal ecosystems, further enhancing water quality and contributing to the overall health of marine environments (Zhang et al., 2021). The GFP is believed to be an indirect regulatory tool to support the monitoring, management, and control of environmental impacts in the Yucatan Peninsula (Mexico) (Vidal-Hernández et al., 2021). After decades of economic development accompanied by severe water quality degradation, the Chinese government has implemented green fiscal policies in various forms to improve water quality. To evaluate the achievement of “10-Point Water Plan”, Zhou et al. (2021) indicated that this policy created a significantly positive impact on industrial water quality, as evidenced by an analysis of industrial water pollution levels before and after the policy’s adoption. Using the comprehensive feasible generalized least squares method, Jiang and Li (2021) argued that the promotion-driven motivations of local officials significantly influenced marine environmental degradation. Although GFP was not directly addressed, they also indicated that local authority incentives positively impact marine ecosystems. Naturally, the instruments of GFP do not have uniform impacts. This heterogeneity reduces the effectiveness of environmental tax/subsidy policies in surrounding contexts. Wu S et al. (2021) examined the impact of four types of firm heterogeneity and three methods of processing social norm information on the effectiveness of environmental tax/subsidy policies. The authors concluded that informational nudges can enhance outcomes even in the presence of significant heterogeneity within the policy environment. These arguments in the literature reinforce the existence of a research gap in examining the effectiveness of GFP on CWQ across different quantiles.
Based on previous literature, we develop the below hypothesis.
Hypothesis 2. GFP plays an essential role in contributing to CWQ.
In terms of EE, research has demonstrated that the TR industry contributes notably to environmental degradation on a global scale. TR activities, including transportation, accommodation, and excessive consumption, rely heavily on fossil fuels or electricity (UN Tourism, 2024). The amount of CO2 emissions that TR generates serves as a key metric for evaluating its environmental impact. This topic has been central to research on the interaction between humans and the environment within the TR sector in the 21st century. Gössling (2000) pioneered a method for estimating CO2 emissions specifically associated with TR. Since then, this issue has garnered increasing attention. TR heavily relies on energy, with the majority being derived from fossil fuels. The combustion of these fuels results in the emission of various greenhouse gases, predominantly CO2. The TR industry generates carbon emissions through both direct and indirect channels (Ullah et al., 2022). Direct emissions arise from the energy consumption directly associated with the TR system, while indirect emissions stem from embodied CO2 linked to the energy use involved in producing intermediate goods and services by TR-related businesses. The volume of carbon emissions from the TR sector serves as a crucial indicator for evaluating its environmental impact (Mishra et al., 2022). Ullah et al. (2022) demonstrated that TR contributes to CO2 emissions through both positive and negative shocks by employing nonlinear ARDL estimations.
Based on relevant literature, we develop the following hypothesis.
Hypothesis 3. TR plays an essential role in contributing to EE.
The hypothesis regarding the impact of TR on CWQ posits that increased TR activities are likely to harm coastal ecosystems. As TR grows, particularly in coastal regions, the demand for infrastructure, recreational activities, and waste management intensifies, which can lead to pollution from wastewater discharge, litter, and increase nutrient runoff. These factors may degrade water quality, threatening marine biodiversity and ecosystem health. Some studies have highlighted this relationship across various geographical regions. A notable impact of TR on the CWQ index was demonstrated in the marine TR Park in Indonesia (Ministry of Land, Infrastructure, Transport and Tourism, 2024). It confirmed that extensive TR expansion in marine protected areas and small islands could lead to declining water quality and heightening environmental vulnerability. A different study highlighted the adverse effects of TR on water quality in Tara National Park in Serbia, with senior and highly educated residents and visitors particularly stressing this issue (World Bank Group, 2024). Vidal-Hernández et al. (2021) provided evidence demonstrating the gradual decline in coastal ecosystems, including fauna, flora, and natural coastal appeal, due to the effects of TR. Drius et al. (2019) indicated that specific studies investigating the primary threats posed by coastal TR and their interactions with other human activities affecting marine ecosystems and water quality remain potential.
Based on previous literature, we develop the below hypothesis.
Hypothesis 4. TR plays an essential role in contributing to CWQ.
FT has the potential to significantly reduce carbon footprints by promoting the adoption of digital financial services and enhancing efficiency in various sectors. FT facilitates more efficient energy usage, streamlined processes, and lower reliance on traditional financial institutions, which are often resource-intensive. Moreover, FT-enabled platforms can foster investment in green technologies, enable carbon tracking, and promote transparency in emissions reporting. This shift not only aids in reducing operational carbon footprints but also encourages environmentally responsible behaviors among consumers and businesses. Studies revealed a substantial positive impact of FT in mitigating carbon footprint across seven resource-rich developing (Leng et al., 2024) and BRICS nations (Kai et al., 2024). Previous studies indicated that policies including additional deductions, scientific financial subsidies, and tax incentives should be implemented to promote FT, thereby advancing core technologies for green innovation and enabling cities to achieve carbon neutrality goals (Teng and Shen, 2023). FT demonstrates substantial strength in addressing environmental issues, exerting a bidirectional impact on the environment. It not only fosters innovative solutions but also contributes to minimizing environmental pollution. For instance, blockchain-based applications enhance supplier transparency and promote healthy consumer habits through virtual transactions. Moreover, FT plays a pivotal role in facilitating green credit operations (Liu et al., 2022). It also enables the development of advanced financial products such as carbon trading and green bonds, providing new avenues for funding climate change mitigation projects (Rahman et al., 2023). Additionally, FT’s emphasis on digitalization reduces the negative environmental impact associated with traditional banking while creating opportunities to maximize economic outcomes (Goel, 2022). This encourages businesses to adopt environmentally conscious practices and transform corporate operations through the use of cryptocurrencies.
Based on relevant literature, we develop the following hypothesis.
Hypothesis 5. FT plays an essential role in contributing to EE.
The relationship between FT and CWQ represents a critical yet underexplored area in existing literature. FT’s potential to influence CWQ lies in its ability to facilitate green financing mechanisms, such as crowdfunding and green bonds, which can be directed toward projects aimed at coastal preservation and pollution mitigation. Blockchain technology, a subset of FT, offers possibilities for improving transparency in supply chain practices, particularly in industries contributing to marine pollution. Chhipi-Shrestha et al. (2023) argued that AI and supply chain applications were essential for autonomous digital water quality management. These methods have primarily been utilized to predict, assess, and regulate water quality more precisely. Dong et al. (2024) initially supposed that FT, encompassing mobile payments, online banking, blockchain technology, cryptocurrency, and crowdfunding platforms, enhances and democratizes financial activities but may have unintended environmental consequences, including impacts on water quality. However, their study does not delve deeply into this relationship. Jiang et al. (2019) examined and concluded that there is an inverted U-shaped relationship between the development of FT and non-point source agricultural pollution, a major contributor to surface water quality degradation. Generally, studies linking these capabilities to measurable improvements in CWQ are scarce. This gap is significant given the urgent need for innovative solutions to address coastal degradation driven by TR, urbanization, and industrial discharges.
Based on previous literature, we develop the below hypothesis.
Hypothesis 6. FT plays an essential role in contributing to CWQ.
3 Methodologies
In this paper, our model is constructed based on the widely recognized STIRPAT (Stochastic Impacts by Regression on Population, Affluence, and Technology) framework proposed by Dietz and Rosa (1997) and extended including FT by Leng et al. (2024). Additionally, due to the nonlinear exponential relationship between GFP and TR with environmental factors as demonstrated by several studies (Ehigiamusoe, 2020; Aldama and Creel, 2019), we apply natural logarithms and incorporate them into the STIRPAT model. The relationship between FT and ecological degradation is suggested to follow an inverted U-shaped pattern (Murshed, 2024). We then quantify CWQ using the widely recognized single-factor index method proposed by Debels et al. (2005) and then apply natural logarithms. The selection of this method is based on the availability of data accessible to the authors. Additionally, this approach is both widely used and suitable for assessing water quality characteristics, as evidenced by its application in numerous studies conducted in China (Tian et al., 2019; Wu Z et al., 2021; Wang et al., 2019).
where
The single-factor index
where
In this study, to calculate the
To implement the MMQR model for robust test estimation, we undertake the following three-step procedure: Cross-sectional dependence (CSD) test, Panel cointegration test, and panel estimation using MMQR.
3.1 CSD tests
The CSD test aims to detect interdependencies among cross-sectional units (Kai et al., 2024). This is essential because panel data encompasses multiple cross-sectional units recorded across time and space. Often, these cross-sectional units may exhibit interdependencies due to common shocks, shared influences, or spillover effects. The CSD test determines whether such interdependencies exist among the cross-sectional units. Identifying CSD is vital, as it can significantly impact the consistency and efficiency of standard panel data estimations. Also, ignoring CSD can create biased parameter estimates and inferences (Leng et al., 2024). In the presence of CSD, the traditional MMQR estimates might not be robust, leading to misleading estimations. Understanding the CSD informs the researcher to adopt more suitable adjustment techniques for the estimation model.
3.2 Panel cointegration tests
The panel cointegration tests are deployed to diagnose the appearance of a stable, long-term association despite short-term deviations. It increases the power of cointegration analysis by pooling information across cross-sectional units, thereby providing more reliable results compared to single time series tests. This is particularly beneficial when dealing with heterogeneous panels where individual units may exhibit diverse behaviors (Chakraborty and Mazzanti, 2021). further emphasized the robustness of panel cointegration tests in the presence of CSD, a common feature in panel datasets. By accounting for such dependencies, these tests provide more reliable estimates and inferences about the long-term equilibrium relationships. Also, the advantages of panel cointegration tests are believed to reduce the risk of spurious regression results, which can occur when analyzing non-stationary data (Herzer, 2019). By confirming the presence of cointegration, researchers can be more confident that their models reflect genuine long-term relationships rather than transient correlations.
We calibrate the Augmented Dickey-Fuller (ADF) test and the Phillips-Perron (PP) method for this analysis. Consider a panel data model with
where
where
3.3 Panel estimation using MMQR
In this study, we implement panel estimation methods, including Fixed Effects OLS (FE-OLS) and Dynamic OLS (D-OLS), alongside MMQR for a comprehensive quantile estimation analysis. Firstly, by using FE-OLS, we control for unobserved characteristics that remain constant over time within each unit, eliminating between-unit variation due to fixed factors to control for fixed heterogeneity. As emphasized by Pedroni (2004), the FE-OLS method effectively addresses the mentioned issues. Similarly, the D-OLS approach, proposed by Kao and Chiang (2000), is extended through Monte Carlo simulations and delivers efficient estimates even with small sample sizes. D-OLS can examine the long-term relationships between variables in the panel data, especially when there may be cointegration between independent and dependent variables for capturing long-term relationships. D-OLS effectively addresses autocorrelation and endogeneity by incorporating lags and leads, providing clarity on long-term effects. Subsequently, the use of MMQR expands our analysis by capturing the differential effects of predictor variables across quantiles of the dependent variable. This capability is essential when independent variables have non-uniform impacts across different levels of the dependent variable. MMQR reveals how specific factors may have a stronger influence at higher or lower quantiles. Finally, Reducing Bias and Fully Characterizing Data: This combination allows us to capture both short-term and long-term effects accurately while addressing potential endogenous factors. MMQR further adds value by assessing variations in impact across quantiles, helping us avoid biases often seen in traditional mean-based models.
Quantile regression estimates the conditional quantile function
where
where
The moment conditions are used to estimate the parameters. The moment condition can be written as Equation 11:
where
The GMM (Generalized Method of Moments) estimator is often deployed to solve the moment conditions. GMM estimator
where
We establish the econometric functional modeling of dependent and independent variables as follows in Equations 13, 14.
where
4 Analysis results
4.1 Data reliability and validating test
The data were generated from multiple data sources presented in Table 1 from 2001 to 2020. Based on the summary statistics provided in Table 2, we can make several observations. Firstly, the descriptive statistics for the variables LGFP, LTR, LFT, LCWQ, and LEE show a range of values, with means and medians differing significantly, indicating potential skewness and kurtosis in the distributions. For instance, the variable LTR has a median of 9.781 and a mean of 11.431, suggesting positive skewness. The skewness and kurtosis values highlight some deviations from normality. For instance, LCWQ shows a highly negative skewness of −1.551, indicating a slightly highly skewed distribution, while LEE has a positive skewness of −0.778 and kurtosis of −0.51, suggesting a distribution with lighter tails than normal. The Jarque-Bera (JB) test results confirm non-normality across all variables, with p-values of 0.000 or very close to zero, reinforcing the need for methods that handle non-normal distributions. Given these characteristics, MMQR could be a suitable modeling approach. The method’s robustness to non-normality and its ability to model different quantiles of the dependent variable align well with the observed skewness and kurtosis in the data. MMQR allows for the examination of the impact of explanatory variables at various points of the conditional distribution, making it well-suited to handle the variability and non-normality evident in this dataset. Therefore, considering the non-normality and distributional properties of the data, MMQR appears appropriate for further analysis to capture the complex relationships between the variables.
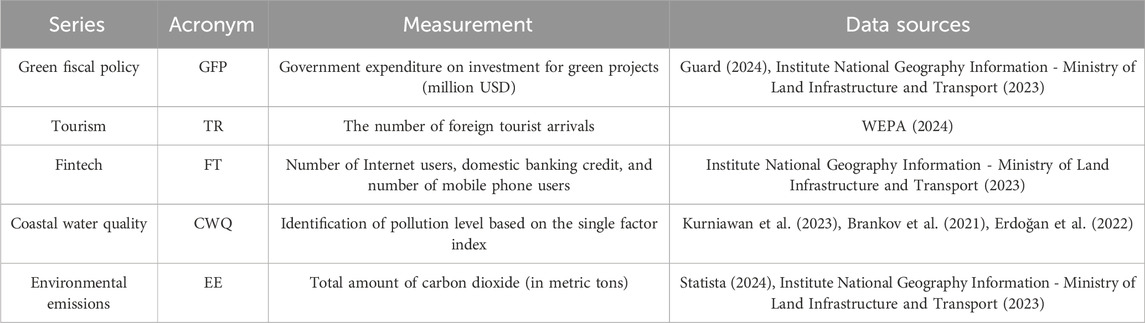
Table 1. Variables measurement.
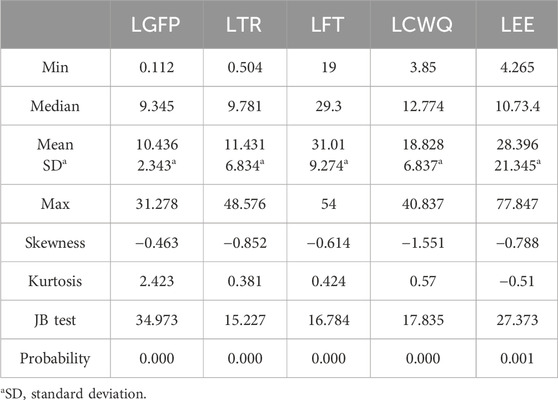
Table 2. Descriptive statistics.
4.2 CSD test results
Table 3 shows the CSD test outcomes for various variables. The test statistics for all variables—LGFP, LTR, LFT, LCWQ, and LEE—are significant at the 1% level, with p-values of 0.000. Specifically, the CSD test statistics range from 5.112 for LGFP to 53.927 for LEE, all indicating evidence of CSD among the variables. This presence suggests that the errors in the panel data are correlated across cross-sectional units. The existence of CSD is attributed to the globalization effects associated with these variables. The spillover effects of disturbances are the underlying cause of the presence of CSD in the panel data.
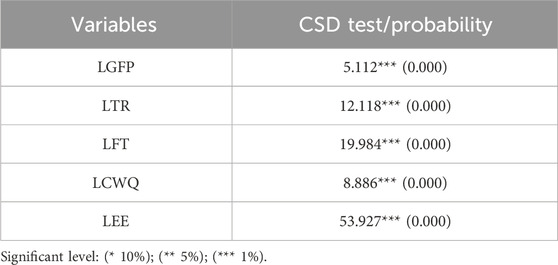
Table 3. CSD test results.
Table 4 provides the stationarity analysis outcomes for the variables using both the ADF and PP methods, under different deterministic components: constant (C) and constant and trend (C&T). For the ADF method, the variables LGFP, LTR, and LFT are all non-stationary at level I (0) under both specifications, as their test statistics do not surpass the critical values at conventional significance levels. For instance, the ADF statistics for LGFP are −3.223 and −3.765 under the C and C&T models, respectively, which are insufficient to reject the non-stationarity null hypothesis. Notwithstanding, after first differencing, the test statistics for LGFP become −8.663 and −9.499 under both specifications, significant at the 1% level, indicating that LGFP is integrated of I (1). Similarly, LTR and LFT exhibit the same pattern, where they fail to be stationary at levels but achieve stationarity after first differencing, confirming their integration order as I (1).
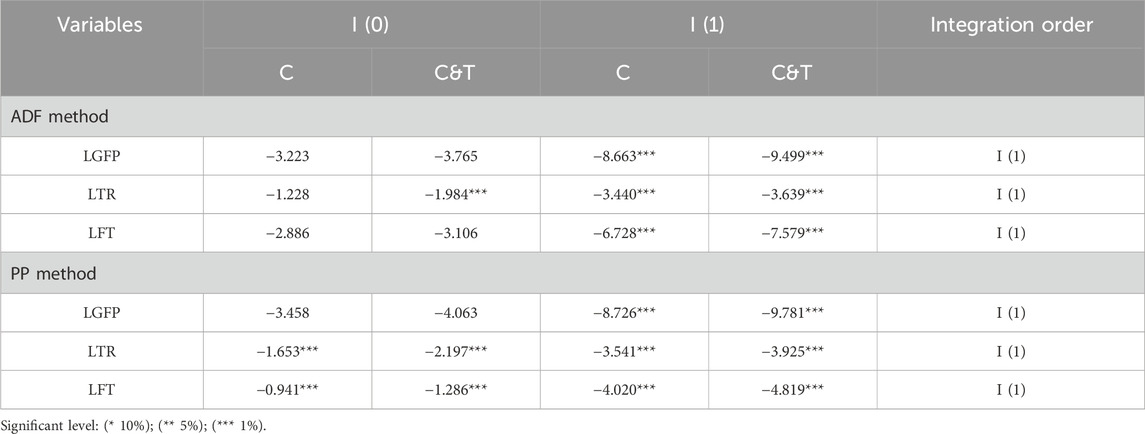
Table 4. Stationary analysis performance.
The results from the PP method corroborate the findings from the ADF tests. For LGFP, the PP test statistics at level I (0) are −3.458 and −4.063, indicating non-stationarity. However, at the first-differenced I (1) form, the values become −8.726 and −9.781, significant at the 1% level, confirming that LGFP is I (1). Similarly, LTR and LFT demonstrate non-stationarity at levels but become stationary at I (1) across both C and C&T specifications, with significant test statistics at the 1% level. The integration order of all three variables—LGFP, LTR, and LFT—is determined to be I (1) under both the ADF and PP methods, as they exhibit stationarity only after first differencing. This suggests that the variables are non-stationary in their levels but achieve stationarity in their first-differenced forms.
The test statistics in Table 5 report that the Gt stat has a value of −7.003, with a z-value of −7.001 and p-values of 0.000 (both standard and robust), indicating the appearance of CSD among the factors and strong evidence of rejecting the null hypothesis. Similarly, the Ga stat, with a value of −20.397, a z-value of −17.638, and p-values of 0.000, further confirms the presence of CSD. The Pt stat, showing a value of −24.736, a z-value of −20.063, and p-values of 0.000, strongly proves that the null hypothesis can be rejected, indicating significant CSD at the 1% level. Lastly, the Pa stat has a value of −34.108, a z-value of −36.286, and p-values of 0.000, robustly rejecting the null hypothesis and confirming significant CSD at the 1% level.
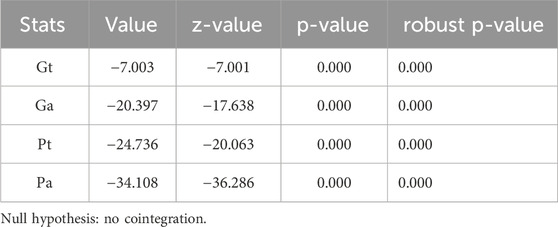
Table 5. Cointegration test (Westerlund, 2007).
Table 6 indicates the consistent significance of all statistics across both panels, thus, demonstrating robust evidence of cointegration and confirming the long-term equilibrium relationships between the factors despite possible short-term fluctuations. The Westerlund and Pedroni tests with Driscoll-Kraay standard errors (Driscoll and Kraay, 1998), demonstrate that CSD has been effectively controlled, as all robust p-values and Driscoll-Kraay p-values are below 0.05.
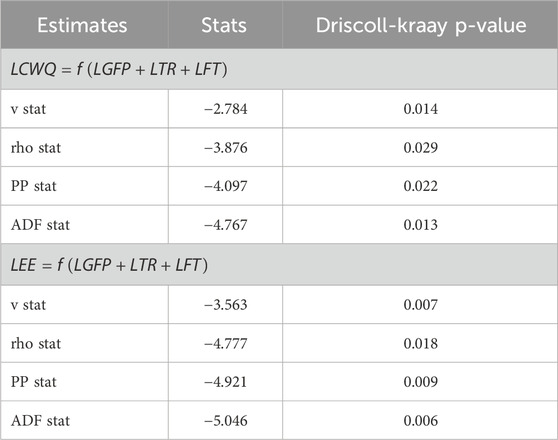
Table 6. Panel Cointegration test (Pedroni, 2004) with Driscoll-Kraay standard errors.
4.3 Heterogeneous panel and MMQR estimations
We can observe the heterogeneous estimators’ results using the FE-OLS and the D-OLS models (see Table 7). A noteworthy adverse impact of LGFP on LCWQ at the 1% significance level can be observed from both FE-OLS and D-OLS models with p-values of 0.000 and statistics of −5.882 and −6.791, respectively. Similarly, LFT has a significant negative relationship at the 1% level when showing p-values of 0.000. The test statistics of LFT are −5.837 and −7.105 for FE-OLS and D-OLS, respectively. The results from both the FE-OLS and D-OLS models indicate consistent and significant relationships between five independent variables and LCWQ. Which, LGP and LFT consistently show significant negative relationships, whereas LTR exhibits a significant positive relationship. The statistical significance across both models, as indicated by p-values less than 0.01, supports the robustness of these findings. These results provide important insights into the influence of the examined variables, suggesting that increases in LGP and LFT tend to decrease the dependent variable, while the increase in LTR tends to increase it.
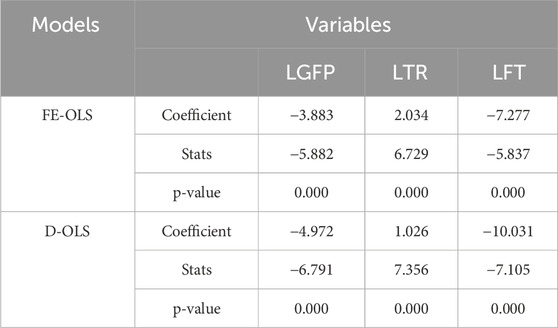
Table 7. Heterogeneous estimators result for LCWQ.
For LEE, the results follow a similar trend (see Table 8). The FE-OLS model shows a negative and significant effect of LGFP with a coefficient of −6.532 and a t-statistic of −4.277. LTR again has a positive and significant coefficient of 2.753, suggesting that TR exacerbates environmental pollution. LFT has a negative impact, with a coefficient of −3.996, implying that FT negatively affects EE. The D-OLS model further confirms these findings, with LGFP having a negative coefficient of −5.945, while LTR continues to positively influence EE with a coefficient of 2.011. The negative impact of LFT is more pronounced in the D-OLS model, with a coefficient of −8.465, highlighting the detrimental effect of TR on environmental efficiency, at the 1% significance level.
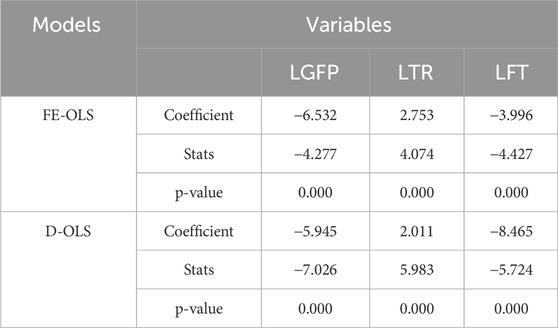
Table 8. Heterogeneous estimators result for LEE.
The MMQR outcomes for CWQ are given in Table 9. The location parameter reflects the general impact of the variables on CWQ across all quantiles. The LGFP coefficient is −0.832, statistically significant at the 1% level, indicating that GFPs have a robust negative impact on pollution, consistently improving water quality. This result aligns with expectations, as environmentally focused fiscal policies, such as taxes, subsidies, and current investment in green projects promoting sustainability, tend to reduce environmental degradation. LTR shows a positive and statistically significant coefficient (0.073), indicating that TR tends to have a detrimental effect on CWQ. The positive sign reflects TR’s contribution to environmental stress, likely through increased waste generation and resource use. LFT has a negative coefficient (−0.363), also significant at the 1% level, suggesting that FT contributes to reducing water pollution, by fostering innovation in environmental management and green financing initiatives.
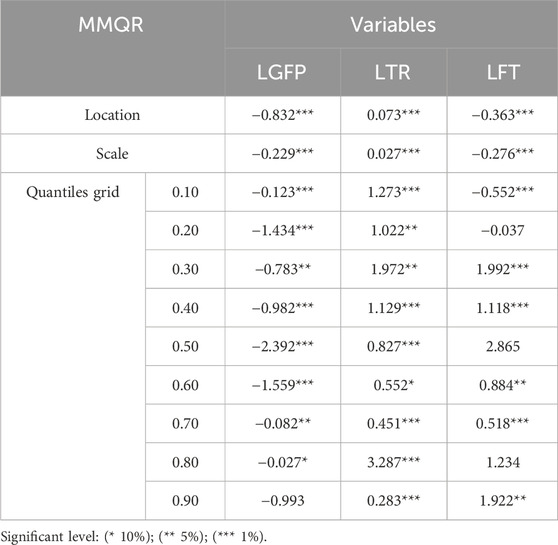
Table 9. Quantile regression (MMQR) results for LCWQ.
The scale parameter captures how the effect of these variables varies across the distribution of CWQ. LGFP has a significant negative scale coefficient (−0.229), implying that the impact of GFP on improving water quality is stronger at lower levels of pollution. This suggests that GFPs are effective in preventing environmental degradation. LTR presents a small but significant positive scale coefficient (0.027), indicating that TR’s negative impact on water quality is more pronounced at higher levels of pollution. As pollution worsens, the adverse effects of TR become more evident. LFT has a significant negative scale coefficient (−0.276), indicating that FT’s positive effect on reducing pollution is more substantial in areas with better water quality. This suggests that FT solutions are more effective in maintaining environmental standards rather than mitigating extreme pollution levels.
The quantile grid results provide further detail on how each variable’s influence shifts across the spectrum of water pollution levels. At the 0.10 quantile, LGFP exhibits a strong and significant negative effect (−0.123), emphasizing its effectiveness at improving water quality in areas where pollution is low. This effect becomes more pronounced at the 0.40 quantile (−0.982) and peaks at the 0.50 quantile (−2.392), highlighting the substantial positive impact of GFP in areas with moderate pollution. However, the effect decreases at higher quantiles, such as at the 0.90 quantile, where it becomes insignificant (−0.993), suggesting that GFPs may be less effective in severely polluted areas. LTR shows more variable effects across the quantiles. While it has no significant positive effect at lower quantiles, TR shows a strong positive impact on pollution at the 0.30 quantile (1.972) and 0.80 quantile (3.287), indicating that TR contributes significantly to water quality deterioration at moderate to higher levels of pollution. This aligns with expectations that TR, especially in coastal regions with higher pollution levels, exacerbates environmental stress on water resources. LFT displays a positive and significant effect at the 0.30 quantile (1.992) and 0.40 quantile (1.118), indicating that FT plays an important role in improving water quality at these levels of pollution. However, at the 0.60 quantile (0.884) and 0.90 quantile (1.922), FT continues to have a positive, though slightly diminished, impact, showing that FT’s role in supporting water quality management persists even at higher levels of pollution.
Table 10 offers key insights into how GFP, TR, and FT affect EE across different quantiles. LGFP has a negative coefficient (−0.377) with high statistical significance, suggesting that GFPs are effective in reducing EE on average. LTR shows a positive and significant coefficient (0.354), which indicates that TR contributes to an increase in EE. This finding reflects the idea that TR activities tend to exacerbate environmental degradation, potentially due to increased waste, energy consumption, and resource utilization in tourist areas. LFT demonstrates a negative and highly significant coefficient (−1.287), indicating that FT has a strong mitigating effect on EE. This may suggest that FT innovations facilitate greener financial operations, possibly by improving energy efficiency or promoting more sustainable investment practices.

Table 10. Quantile regression (MMQR) results for LEE.
The scale parameter captures how the influence of these variables changes across different quantiles of the emissions distribution. A statistically significant scale coefficient suggests varying impacts at lower versus higher emission levels. The scale coefficient for LGFP is −0.136, with significance at the 5% level, indicating that the influence of GFP is stronger at lower emission levels. As emissions increase, the relative impact of these policies diminishes, suggesting that they are most effective when emissions are initially lower. For LTR, the scale coefficient is 0.086, highly significant at the 1% level, highlighting that the detrimental effects of TR on emissions intensify as pollution levels rise. This suggests that as tourist activity increases in more polluted areas, its environmental toll becomes even greater. Similarly, LFT exhibits a negative scale coefficient (−0.653), significant at the 5% level, suggesting FT’s mitigating effects on emissions are more pronounced at higher levels of environmental damage. This consistent negative impact across the distribution underscores FT’s potential to foster sustainability at both medium and high levels of emissions.
The quantile-specific coefficients further illustrate how the effects of these variables vary at different points in the emissions distribution. LGFP shows significant and negative effects in the lower quantiles (e.g., −0.542 at the 0.10 quantile and −1.916 at the 0.30 quantile), indicating its strong ability to reduce emissions at these levels. LTR exhibits a significant positive effect at the middle quantiles, particularly at the 0.20 quantile (1.284) and 0.40 quantile (1.748), indicating that TR activities significantly increase emissions at these levels. Yet, its impact tapers off at higher quantiles, implying that the contribution of TR to environmental degradation is less pronounced as emissions rise. LFT shows strong and positive impacts at key quantiles, such as the 0.30 quantile (1.008) and 0.50 quantile (2.387), illustrating FT’s capacity to reduce emissions is most effective at these medium levels.
5 Discussion
It can be observed that the government’s current investment in green projects, while effective in preventing environmental degradation, demonstrates stronger efficiency at lower pollution levels and weaker efficiency at higher pollution levels, particularly concerning the CWQ index. In terms of CWQ, areas with severe pollution levels experience even worse negative impacts. Conversely, the adverse effects on heavily air-polluted regions are less pronounced compared to those with moderate and low pollution levels. This suggests that, for TR, CWQ should be a more prominent policy priority than air pollution. FT, on the other hand, exhibits a more significant impact on severe air pollution, while its effects on heavy marine water pollution remain less evident. Therefore, further development of FT solutions that positively influence CWQ is necessary.
Theoretically, it is evident that government investments in green projects have proven effective in improving air quality and CWQ. However, government investments and fiscal tools aimed at promoting green TR have not yet delivered the expected results. Also, this paper demonstrates the existence of local thresholds at which the expansion of FT reverses its impact on both EE and CWQ. Therefore, the paper lays the groundwork and suggests exploring these thresholds to provide more accurate recommendations for proposing investment and development policies for FT.
Based on research findings, the author provides the following policy recommendations. (1) The government’s portfolio of green project investments should include the TR sector, with a balanced allocation of weights relative to other sectors. Additionally, the implementation of fiscal tools should be regularly monitored and evaluated to prevent overinvestment beyond the point of effectiveness, thereby avoiding waste. (2) The government should gradually increase environmental taxes targeting the TR sector. Currently, environmental taxes in China are in a phase of ‘tax transformation-transition,’ with tax rates remaining below the actual pollution emission levels. (3) Given the inevitable development and expansion of TR and FT, local authorities may hesitate to implement fiscal tools that could hinder this growth. They might consider adopting a combination of innovative measures that incentivize businesses to focus on green TR development, such as carbon credit solutions. Exploring pilot programs that allow cryptocurrency payments for businesses committed to green TR is also worth investigating. The dual benefit of these solutions could provide significant potential for businesses to contribute to environmental quality improvement. (4) For FT, due to its diverse forms of development and the rapid pace at which this diversity continues to grow, it is essential to disaggregate these forms and continuously monitor and examine their actual impacts on EE and CWQ. (5) The impact of FT on environmental indicators shifts depending on pollution levels and water quality, making the identification of local thresholds (the peaks of the inverted U-shape) critically important. If authorities fail to recognize these thresholds, the expansion of FT could harm the environment. Since each type of pollution has distinct thresholds, controlling FT development must account for these variations.
6 Concluding remarks
6.1 Research findings
This paper explores the asymmetric relationship between TR, GFP, and FT with CWQ level and CO2 emissions in China. Besides considering the quantile effects of GFP and TR, this paper contributes a novel aspect by examining the quantile effects of FT on CWQ. The cointegration suggests that, despite possible short-term variations, the variables are likely to move together over the long term, maintaining a balance defined by their cointegrating relationship. The estimation results reveal stable and significant correlations between the regressors and response variables. GFP exerts a substantial impact on improving both CWQ and reducing CO2 emissions. In contrast, the favorable growth of the TR sector contributes negatively to CWQ and air pollution, highlighting the environmental challenges associated with TR expansion. The MMQR results indicate that the relationship between FT and CWQ with EE forms a series of inverted U-shaped patterns that evolve across different phases of environmental quality. This aligns with and further extends the conclusions drawn by previous studies concerning EE (Murshed, 2024) and water quality in agriculture (Jiang et al., 2019).
6.2 Limitations and future directions
This study has some limitations. First, we only examine the aggregated impact of GFP without disaggregating the specific forms of GFP to infer the effectiveness of individual policy instruments. For instance, it does not analyze whether one unit of subsidy or one unit of tax yields greater effects across quantiles or compare the efficiency of one unit of subsidy versus one unit of expenditure for promoting green TR or green FT. Future studies will explore this aspect further when more granular datasets are accessible. Secondly, governments often favor the integration of monetary and fiscal policies. However, this study does not examine the effects of monetary policy due to data limitations, leaving room for future research to address this gap. Furthermore, while traditional regression methods are well-suited for explanatory analysis, machine learning algorithms offer superior capabilities in prediction and classification. Future research could leverage machine learning to forecast emissions and CWQ, integrating these insights with classical models to deliver more accurate impact assessments and refined policy recommendations.
Data availability statement
The original contributions presented in the study are included in the article/supplementary material, further inquiries can be directed to the corresponding author.
Author contributions
MY: Conceptualization, Data curation, Formal Analysis, Investigation, Methodology, Software, Validation, Visualization, Writing–original draft, Writing–review and editing. XT: Conceptualization, Formal Analysis, Investigation, Methodology, Validation, Visualization, Writing–original draft, Writing–review and editing.
Funding
The author(s) declare that no financial support was received for the research, authorship, and/or publication of this article.
Conflict of interest
Author MY was employed by Fintech Department of CCCC Capital Holdings Co., Ltd.
The remaining author declares that the research was conducted in the absence of any commercial or financial relationships that could be construed as a potential conflict of interest.
Publisher’s note
All claims expressed in this article are solely those of the authors and do not necessarily represent those of their affiliated organizations, or those of the publisher, the editors and the reviewers. Any product that may be evaluated in this article, or claim that may be made by its manufacturer, is not guaranteed or endorsed by the publisher.
References
Aldama, P., and Creel, J. (2019). Fiscal policy in the US: sustainable after all? Econ. Model. 81, 471–479. doi:10.1016/j.econmod.2018.03.017
Benkhodja, M. T., Ma, X., and Razafindrabe, T. (2023). Green monetary and fiscal policies: the role of consumer preferences. Resour. Energy Econ. 73, 101370. doi:10.1016/j.reseneeco.2023.101370
Bierman, P., Lewis, M., Ostendorf, B., and Tanner, J. (2011). A review of methods for analysing spatial and temporal patterns in coastal Water quality. Ecol. Indic. 11 (1), 103–114. doi:10.1016/j.ecolind.2009.11.001
Brankov, J., Pešić, A. M., Joksimović, D. M., Radovanović, M. M., and Petrović, M. D. (2021). Water quality estimation and population’s attitudes: a multi-disciplinary perspective of environmental implications in tara national park (Serbia). Sustain 13 (1), 241–318. doi:10.3390/su13010241
Bui-Duy, L., Le, L. T., Vu-Thi-Minh, N., Hoang-Huong, G., Bui-Thi-Thanh, N., and Nguyen, P. N. (2023). Economic and environmental analysis of biomass pellet supply chain using simulation-based approach. Asia Pac. Manag. Rev. 28 (4), 470–486. doi:10.1016/j.apmrv.2023.02.002
Chakraborty, S. K., and Mazzanti, M. (2021). Renewable electricity and economic growth relationship in the long run: panel data econometric evidence from the OECD. Struct. Chang. Econ. Dyn. 59, 330–341. doi:10.1016/j.strueco.2021.08.006
Cheng, X., Yao, D., Qian, Y., Wang, B., and Zhang, D. (2023). How does fintech influence carbon emissions: evidence from China’s prefecture-level cities. Int. Rev. Financ. Anal. 87, 102655. doi:10.1016/j.irfa.2023.102655
Chhipi-Shrestha, G., Mian, H. R., Mohammadiun, S., Rodriguez, M., Hewage, K., and Sadiq, R. (2023). Digital water: artificial intelligence and soft computing applications for drinking water quality assessment. Clean. Technol. Environ. 25, 1409–1438. doi:10.1007/s10098-023-02477-4
Chishti, M. Z., Ahmad, M., Rehman, A., and Khan, M. K. (2021). Mitigations pathways towards sustainable development: assessing the influence of fiscal and monetary policies on carbon emissions in BRICS economies. J. Clean. Prod. 292, 126035. doi:10.1016/j.jclepro.2021.126035
Debels, P., Figueroa, R., Urrutia, R., Barra, R., and Niell, X. (2005). Evaluation of water quality in the Chillán River (Central Chile) using physicochemical parameters and a modified Water Quality Index. Environ. Monit. Assess. 110 (1–3), 301–322. doi:10.1007/s10661-005-8064-1
Dietz, T., and Rosa, E. A. (1997). Effects of population and affluence on CO2 emissions. Proc. Natl. Acad. Sci. U. S. A. 94 (1), 175–179. doi:10.1073/pnas.94.1.175
Dong, Z., Zhou, Z., Ananzeh, M., Hoang, K. N., Shamansurova, Z., and Luong, T. A. (2024). Exploring the asymmetric association between fintech, clean energy, climate policy, natural resource conservations and environmental quality. A post-COVID perspective from Asian countries. Resour. Policy. 88, 104489. doi:10.1016/j.resourpol.2023.104489
Driscoll, J. C., and Kraay, A. C. (1998). Consistent covariance matrix estimation with spatially dependent panel data. Rev. Econ. Stat. 80 (4), 549–560. doi:10.1162/003465398557825
Drius, M., Bongiorni, L., Depellegrin, D., Menegon, S., Pugnetti, A., and Stifter, S. (2019). Tackling challenges for Mediterranean sustainable coastal tourism: an ecosystem service perspective. Sci. Total Environ. 652, 1302–1317. doi:10.1016/j.scitotenv.2018.10.121
Du, X., Shen, L., Ren, Y., and Meng, C. (2022). A dimensional perspective-based analysis on the practice of low carbon city in China. Impact Assess. Rev. 95, 106768. doi:10.1016/j.eiar.2022.106768
Ehigiamusoe, K. U. (2020). Tourism, growth and environment: analysis of non-linear and moderating effects. J. Sustain. Tour. 28 (8), 1174–1192. doi:10.1080/09669582.2020.1729164
Erdoğan, S., Gedikli, A., Cevik, E. I., and Erdoğan, F. (2022). Eco-friendly technologies, international tourism and carbon emissions: evidence from the most visited countries. Technol. Forecast. Soc. Change 180, 121705. doi:10.1016/j.techfore.2022.121705
Fan, H., and Liang, C. (2023). The pollutant and carbon emissions reduction synergistic effect of green fiscal policy: evidence from China. Financ. Res. Lett. 58, 104446. doi:10.1016/j.frl.2023.104446
Gao, Y., Qian, H., Huo, C., Chen, J., and Wang, H. (2020). Assessing natural background levels in shallow groundwater in a large semiarid drainage Basin. J. Hydrol. 584, 124638. doi:10.1016/j.jhydrol.2020.124638
Goel, A. (2022). Digitization: road ahead forbanking industry. J. Glob. Inf. Bus.Strategy. 14 (1), 14–19. doi:10.5958/2582-6115.2022.00002.9
Gössling, S. (2000). Sustainable tourism development in developing countries: some aspects of energy use? J. Sustain. Tour. 8 (5), 410–425. doi:10.1080/09669580008667376
Guard, J. C. (2024). Water quality database. Available at: https://www.jodc.go.jp/jodcweb/aboutData.html (Accessed March 26, 2024).
He, G., and Perloff, J. M. (2016). Surface water quality and infant mortality in China. Econ. Dev. Cult. Change 65 (1), 119–139. doi:10.1086/687603
Herzer, D. (2019). The long-run effect of aid on health: evidence from panel cointegration analysis. Appl. Econ. 51 (12), 1319–1338. doi:10.1080/00036846.2018.1527449
Institute National Geography Information - Ministry of Land Infrastructure and Transport (2023). Korea water quality monitoring, THE NATIONAL ATLAS OF KOREA. Available at: http://nationalatlas.ngii.go.kr/pages/page_1313.php (Accessed March 12, 2024).
Jiang, S., Qiu, S., Zhou, H., and Chen, M. (2019). Can fintech development curb agricultural nonpoint source pollution? Int. J. Environ. Res. Public Health. 16 (22), 4340. doi:10.3390/ijerph16224340
Jiang, S. S., and Li, J. M. (2021). Do political promotion incentive and fiscal incentive of local governments matter for the marine environmental pollution? Evidence from China’s coastal areas. Mar. Policy 128, 104505. doi:10.1016/j.marpol.2021.104505
Kai, Z., Sharaf, M., Wei, S. Y., Shraah, A. A., Le, L. T., Arvind Bedekar, D. A., et al. (2024). Exploring the asymmetric relationship between natural resources, fintech, remittance and environmental pollution for BRICS nations: new insights from MMQR approach. Resour. Policy 90, 104693. doi:10.1016/j.resourpol.2024.104693
Kao, C., and Chiang, M. H. (2000). On the estimation and inference of a cointegrated regression in panel data. Adv. Econ. 15, 179–222. doi:10.1016/S0731-9053(00)15007-8
Kurniawan, F., Adrianto, L., Bengen, D. G., and Prasetyo, L. B. (2023). Hypothetical effects assessment of tourism on coastal water quality in the marine tourism park of the gili matra islands, Indonesia. Environ. Dev. Sustain. 25 (8), 7959–7985. doi:10.1007/s10668-022-02382-8
Leng, C., Wei, S. Y., Al-Abyadh, M. H. A., Halteh, K., Bauetdinov, M., Le, L. T., et al. (2024). An empirical assessment of the effect of natural resources and financial technologies on sustainable development in resource abundant developing countries: evidence using MMQR estimation. Resour. Policy 89, 104555. doi:10.1016/j.resourpol.2023.104555
Li, S., Samour, A., Irfan, M., and Ali, M. (2023). Role of renewable energy and fiscal policy on trade adjusted carbon emissions: evaluating the role of environmental policy stringency. Renew. Energy 205, 156–165. doi:10.1016/j.renene.2023.01.047
Li, X., Abed, A. M., Shaban, M., Le, L. T., Zhou, X., Abdullaev, S., et al. (2024). Artificial intelligence application for assessment/optimization of a cost-efficient energy system: double-flash geothermal scheme tailored combined heat/power plant. Energy 313 (30), 133594. doi:10.1016/j.energy.2024.133594
Liu, H., Yao, P., Latif, S., Aslam, S., and Iqbal, N. (2022). Impact of Green financing, FinTech, and financial inclusion on energy efficiency. Environ. Sci. Pollut. Res. 29 (13), 18955–18966. doi:10.1007/s11356-021-16949-x
Liu, J., Peng, Y., Li, C., Gao, Z., and Chen, S. (2021). Characterization of the hydrochemistry of water resources of the Weibei Plain, Northern China, as well as an assessment of the risk of high groundwater nitrate levels to human health. Environ. Pollut. 268, 115947. doi:10.1016/j.envpol.2020.115947
Lloret, J., Carreño, A., Carić, H., San, J., and Fleming, L. E. (2021). Environmental and human health impacts of cruise tourism: a review. Mar. Pollut. Bull. 173 (A), 112979. doi:10.1016/j.marpolbul.2021.112979
Lukoseviciute, G., and Panagopoulos, T. (2021). Management priorities from tourists’ perspectives and beach quality assessment as tools to support sustainable coastal tourism. Ocean. Coast. Manag. 208, 105646. doi:10.1016/j.ocecoaman.2021.105646
Ma, B., Sharif, A., Bashir, M., and Bashir, M. F. (2023). The dynamic influence of energy consumption, fiscal policy and green innovation on environmental degradation in BRICST economies. Energy Policy 183, 113823. doi:10.1016/j.enpol.2023.113823
Miao, S., Tuo, Y., Zhang, X., and Hou, X. (2023). Green fiscal policy and ESG performance: evidence from the energy-saving and emission-reduction policy in China. Energies 16 (9), 3667. doi:10.3390/en16093667
Ministry of Ecology and Environment People’s Republic of China (2022). Bulletin of marine Ecology and environment status of China (Part 1). Available at: https://en.planning.org.cn/planning/view?id=1428 (Accessed June 26, 2024).
Ministry of Land, Infrastructure, Transport and Tourism, J (2024). Infrastructure investment in tourism. Available at: https://www.mlit.go.jp/en/index.html (Accessed March 4, 2024).
Mishra, H. G., Pandita, S., Bhat, A. A., Mishra, R. K., and Sharma, S. (2022). Tourism and carbon emissions: a bibliometric review of the last three decades: 1990–2021. Tour. Rev. 77 (2), 636–658. doi:10.1108/TR-07-2021-0310
Murshed, M. (2024). The role of Fintech financing in correcting ecological problems caused by mineral resources: testing the novel ecological deficit hypothesis. Resour. Policy 88, 104439. doi:10.1016/j.resourpol.2023.104439
Orlov, A., and Aaheim, A. (2017). Economy-wide effects of international and Russia’s climate policies. Energy Econ. 68, 466–477. doi:10.1016/j.eneco.2017.09.019
Pedroni, P. (2004). Panel cointegration: asymptotic and finite sample properties of pooled time series tests with an application to the PPP hypothesis. Econom. Theory 20 (3), 597–625. doi:10.1017/S0266466604203073
Rahman, M. H., Rahman, J., Tanchangya, T., and Esquivias, M. A. (2023). Green banking initiatives and sustainability: a comparative analysis between Bangladesh and India. Res. Glob. 7, 100184. doi:10.1016/j.resglo.2023.100184
Ran, L., Yan, G., Goyal, V., Abdullaev, S., Alhomayani, F. M., Le, L. T., et al. (2024). Advancing solar thermal utilization by optimization of phase change material thermal storage systems: a hybrid approach of artificial neural network (ANN)/Genetic algorithm (GA). Case Stud. Therm. Eng. 64, 105513. doi:10.1016/j.csite.2024.105513
Statista (2024). Territorial carbon dioxide (CO₂) emissions from fossil fuel combustion and industrial processes in China from 1960 to 2022. Available at: https://www.statista.com/statistics/239093/co2-emissions-in-china/#:∼:text=CarbondioxideemissionsinChina1960-2022&text=Chinareleased11.4billionmetric,world’slargestpolluterthatyear (Accessed: March 3, 2024).
Teng, M., and Shen, M. (2023). The impact of fintech on carbon efficiency: evidence from Chinese cities. J. Clean. Prod. 425, 138984. doi:10.1016/j.jclepro.2023.138984
Tian, Y., Jiang, Y., Liu, Q., Dong, M., Xu, D., Liu, Y., et al. (2019). Using a water quality index to assess the water quality of the upper and middle streams of the Luanhe River, northern China. Sci. Total. Environ. 667, 142–151. doi:10.1016/j.scitotenv.2019.02.356
Ullah, I., Rehman, A., Svobodova, L., Akbar, A., Shah, M. H., Zeeshan, M., et al. (2022). Investigating relationships between tourism, economic growth, and CO2 emissions in Brazil: an application of the nonlinear ARDL approach. Front. Environ. Sci. 10, 843906. doi:10.3389/fenvs.2022.843906
UN Tourism (2024). Tourism statistics. Available at: https://www.unwto.org/(Accessed March 31, 2024).
Vidal-Hernández, L., de Yta-Castillo, D., Castellanos-Basto, B., Suárez-Castro, M., and Rivera-Arriaga, E. (2021). Fiscal economic instruments for the sustainable management of natural resources in coastal marine areas of the yucatan peninsula. Sustain. Switz. 13 (19), 11103. doi:10.3390/su131911103
Vu-Thi-Minh, N., Linh, B. D., Le, L. T., Hoang-Huong, G., and Ta-Anh, S. (2024). Supply chain disruption for crude oil due to the effect of Covid-19 pandemic: evidence from Vietnam. Int. J. Logist. Syst. Manag. 48 (3), 1–349. doi:10.1504/ijlsm.2021.10044296
Wang, H., Qi, S., Zhou, C., Zhou, J., and Huang, X. (2022). Green credit policy, government behavior and green innovation quality of enterprises. J. Clean. Prod. 331, 129834. doi:10.1016/j.jclepro.2021.129834
Wang, J., Fu, Z., Qiao, H., and Liu, F. (2019). Assessment of eutrophication and water quality in the estuarine area of Lake Wuli, Lake Taihu, China. Sci. Total. Environ. 650, 1392–1402. doi:10.1016/j.scitotenv.2018.09.137
WEPA (2024). WEPA database. Available at: https://wepa-db.net/(Accessed February 27, 2024).
Westerlund, J. (2007). Testing for error correction in panel data. Oxf. Bull. Econ. Stat. 69 (6), 709–748. doi:10.1111/j.1468-0084.2007.00477.x
World Bank Group (2024). World development indicators. Available at: https://databank.worldbank.org/source/world-development-indicators (Accessed April 5, 2024).
Wu, S., Palm-Forster, L. H., and Messer, K. D. (2021). Impact of peer comparisons and firm heterogeneity on nonpoint source water pollution: an experimental study. Resour. Energy Econ. 63, 101142. doi:10.1016/j.reseneeco.2019.101142
Wu, Z., Lai, X., and Li, K. (2021). Water quality assessment of rivers in Lake Chaohu Basin (China) using water quality index. Ecol. Indic. 121, 107021. doi:10.1016/j.ecolind.2020.107021
Xu, A., Jin, L., and Yang, J. (2024). Balancing tourism growth, Fintech, natural resources, and environmental sustainability: findings from top tourist destinations using MMQR approach. Resour. Policy 89, 104670. doi:10.1016/j.resourpol.2024.104670
Zhang, K. Q., Chen, H. H., Tang, L. Z., and Qiao, S. (2022). Green finance, innovation and the energy-environment-climate nexus. Front. Environ. Sci. 10, 879681. doi:10.3389/fenvs.2022.879681
Zhang, S., Wu, Z., Wang, Y., and Hao, Y. (2021). Fostering green development with green finance: an empirical study on the environmental effect of green credit policy in China. J. Environ. Manage. 296, 113159. doi:10.1016/j.jenvman.2021.113159
Keywords: green fiscal policy, coastal water quality, tourism, environmental emissions, method of moment quantile regression, cross-sectional dependence, panel cointegration and estimation
Citation: Yang M and Tang X (2025) Investigating the asymmetric impact of tourism, green fiscal policy, and fintech on environmental emissions and coastal water quality: an empirical study using the method of moments quantile regression. Front. Environ. Sci. 12:1499558. doi: 10.3389/fenvs.2024.1499558
Received: 21 September 2024; Accepted: 16 December 2024;
Published: 07 January 2025.
Edited by:
Muhammad Saeed Meo, Sunway University, MalaysiaCopyright © 2025 Yang and Tang. This is an open-access article distributed under the terms of the Creative Commons Attribution License (CC BY). The use, distribution or reproduction in other forums is permitted, provided the original author(s) and the copyright owner(s) are credited and that the original publication in this journal is cited, in accordance with accepted academic practice. No use, distribution or reproduction is permitted which does not comply with these terms.
*Correspondence: Xing Tang, MjAyMTEwMTIzNkBuaWl0LmVkdS5jbg==, bWVuZ3FpeWFuZzg1QGdtYWlsLmNvbQ==