- School of Resources and Environment, Anqing Normal University, Anqing, China
Introduction: Transportation corridors, as special economic corridors, have a greater impact on land cover and landscape pattern changes.
Methods: Therefore, 10 buffer zones were established at 1 km intervals on both sides of the Longhai Railway as the centerline to trace the impact of the railroad corridor on the land use change and regional landscape pattern change of the cities along the line from 1985 to 2020.
Result: The results show that: (1) The land cover changes along the railroad corridor during the 35 years are mainly characterized by the conversion between cropland, grassland, and construction land. Compared with 1985, in 2020, the construction land increased by 161.96%, the grassland area decreased by 11.83%, and the cropland area decreased by 15.83%. (2) The fragmentation of land patches and vegetation coverage is negatively and positively correlated with the buffer zone distance, respectively. In the same year, the comprehensive land-use dynamic degree is smaller as it is further away from the railway. The nighttime light index in the buffer zone is significantly correlated with the land aggregation index and average patch area, and the closer to the railroad, the higher the land aggregation index of construction land. (3) In terms of zoning, the intensity of land cover and landscape pattern changes in the eastern section is higher than that in the western section, with a higher degree of land fragmentation and more agglomeration of construction land, and the transportation corridor has a greater impact on the change of integrated land use motives in this region. The results of the study can provide a scientific basis for optimising the spatial pattern of land and improving the ecological environment in the construction of cross-regional transport corridors.
1 Introduction
Economic globalization and increasing regional cooperation have accelerated the process of urbanization, leading to rapid expansion of urban space (Bezpalov et al., 2022). When the rate of urban spatial expansion is higher than the rate of population growth, it will lead to a large amount of high-quality land resources being wasted, which will threaten the ecological security and sustainable development of the region (Grimm et al., 2008). Transportation corridors, as axes of regional development, have greatly promoted the coordinated development of cities along them. However, in the process of construction, operation, and maintenance, transportation corridors change the original land use and may lead to the degradation of regional ecosystems (Yang et al., 2023). The longer the transportation corridor route, the more complex the ecosystem it may affect (Changsheng, 2020). From the perspective of “globalization” and “localization”, the construction of transportation corridors will cause problems of land use homogeneity and heterogeneity (Xiao et al., 2024). According to the theory of “patch-corridor-matrix” (Forman, 1995), transportation corridors cut through the original landscape substrate and form new patches, changing the connectivity and edge effect between patches. This affects the fragmentation, diversity and complexity of the landscape, ultimately leading to changes in landscape patterns (Zhao and Peng, 2012; Yang et al., 2024).
The impacts of transportation corridors on regional land use changes and landscape patterns have been mainly studied in terms of spatial and temporal characteristics, simulation prediction mechanisms, driving factors, and impact effects (Forman, 2000; Sarfraz et al., 2023; Kanchan et al., 2024; Zhao et al., 2024). At present, urgent quantitative studies is needed on the issue about the impacts of regional cross-border railway corridors on land use, landscape changes, and ecological environment. Understanding the impact of transportation corridors on ecological quality, land use/land cover (LULC) is crucial for regional sustainable development (Kanchan et al., 2024; Sun et al., 2024). In addition, the evaluation of land use changes at different distances from railway lines has begun to receive attention from academia (Wang et al., 2021; Yang et al., 2022; Navalkar et al., 2023). In China, the railway has played a critical role in the rapid socio-economic development (Cui et al., 2021). In the context of the Belt and Road Initiative (Huang, 2016) and the “Two Horizontal and Three Vertical Urbanization Belt” development strategy (“https://www.gov.cn/gongbao/content/2014/content_2644805.htm” \o “https://www.gov.cn/gongbao/content/2014/content_2644805.htm” https://www.gov.cn/gongbao/content/2014/content_2644805.htm), the railway network of China is developing rapidly. There are more and more cross-regional railway transportation corridors, and one of the railroad lines worth noting is the Longhai Railway.
The Longhai Railway starts from Lanzhou City in Gansu Province of China in the west to Lianyungang City in Jiangsu Province in the east, linking the three major geographical regions of Northwest China, Central China, and East China. As an important part of the “Belt and Road” strategy and the “Two Horizontal and Three Vertical Urbanization Belt” strategy, the Longhai Railway plays a pivotal role in economic and transportation development. Therefore, it has attracted the attention and research of many scholars. Recently, researchers have studied the human-land relationship issues in cities along the Longhai Railway at the county (Liu et al., 2022), city (Guo and Xie, 2011), and provincial (Zhou et al., 2020) scales. However, there is a gap in research on the long-timescale and different distance effects of changes in land use cover and landscape patterns across the Longhai Railway. Hereby, in the context of regional economic cooperation, we aim to answer the following questions: (1) What are the spatiotemporal characteristics of land use changes along the Longhai Railway line at different regional scales? (2) How to quantify the impact of this transportation corridor on land use change and landscape pattern varying distance from the railway line? This will inform the study of the relationship between regional land use change and geo-economy, as well as the interaction between transportation and ecological corridors.
2 Study area
The Longhai Railway, built in 1904, runs in an east-west direction and crosses the second and third terraces in China, with different geographic and environmental conditions along the railway line. Both the “Belt and Road” and “Two Horizontal and Three Vertical Urbanization Belt” include the Longhai Railway line (Figure 1A). The altitude difference along this railroad corridor is large, up to 5,703 m (Figure 1B), showing a trend of low in the east and high in the west. There are significant differences in land use types and landscape patterns between the east and west along the railway line. In addition, Sanmenxia is a transitional zone between China’s second and third terraces (Wang et al., 2002). Therefore, under the comprehensive consideration of climate, topography, vegetation and other conditions, the Longhai Railway was also divided into two sections, i.e., the eastern section (Jiangsu-Henan) and the western section (Shaanxi-Gansu) with Sanmenxia in Henan as the boundary, to explore the changes in land use and landscape pattern of the areas along the line over the past 35 years, from both the overall and the sub-district perspectives.
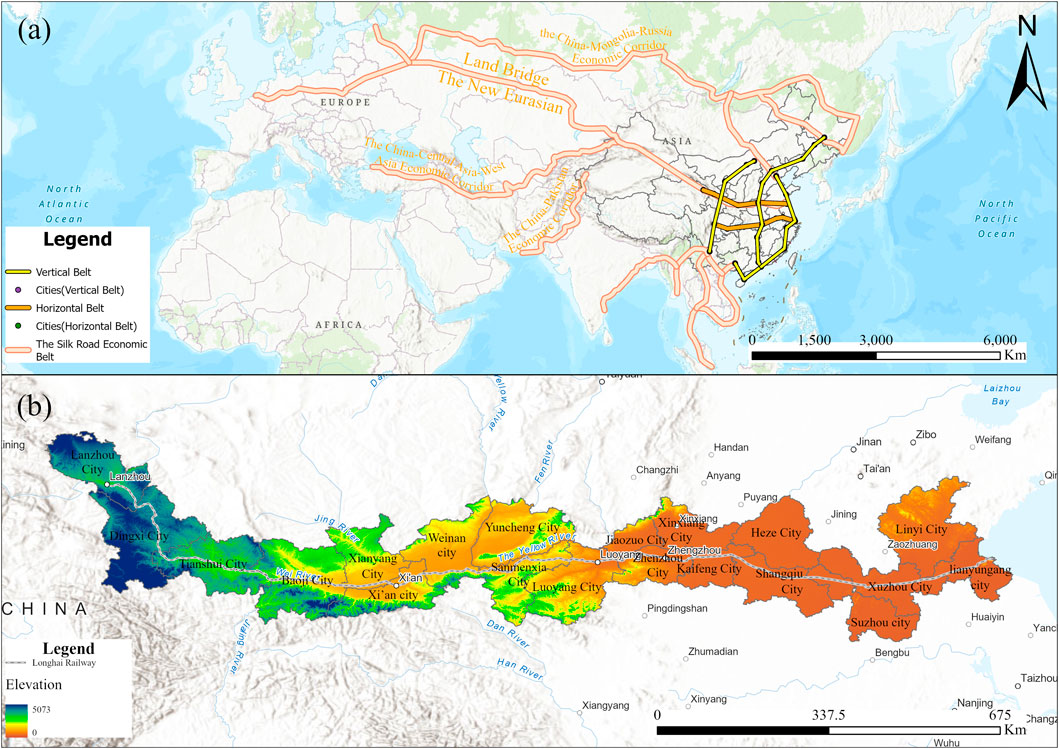
Figure 1. Study area [(A): the “Belt and Road” strategy and the “Two Horizontal and Three Vertical Urbanization Belt” strategy, (B) Topography along Longhai Railway].
3 Data and methods
3.1 Data
Land use classification data were obtained from http://globeland30.org/home.html?type=data, with a spatial resolution of 30 m × 30 m. Regarding the National Land Use Classification System, the area around the route was classified into six first-level land classes: cropland, forest, grass, wetland, construction land, and unused land (Table 1). DEM data were downloaded from the Geospatial Data Cloud (https://www.gscloud.cn) with ASTERGDEM datasets (30 m × 30 m). Fractional vegetation cover (FVC), an important basic data for describing ecosystems, was obtained using Google Earth Engine (GEE) with Landsat satellite dataset (30 m × 30 m, Level 2, Collection 2, Tier 1) during 1986–2020. The site conditions in the study area were synthesized and the vegetation coverage was classified into five categories: higher (FVC ≥0.7), high (0.5≤ FVC <0.7), medium (0.3≤ FVC <0.5), low (0.1 ≤ FVC <0.3), and lower (0.1 < FVC).
Previous studies have introduced the urban lighting index into landscape ecology research to explore the characteristics of spatial pattern changes in urban development (Shen et al., 2023; Xie et al., 2023). The DMSP-OLS image and NPP-VIIRS image are mainly used for nighttime lighting data (Li et al., 2023). Firstly, the relative invariant target area method is used to carry out relative correction on the DMSP-OLS images of the Longhai Railway from 1992 to 2013, and the saturation correction and continuity correction are combined with the reference images after radiometric calibration, to obtain the DMSP-OLS continuity image dataset of various districts along the Longhai Railway from 1997 to 2013. The NPP-VIIRS images are corrected by noise processing and logarithmic transformation, and the NPP-VIIRS continuity image dataset is obtained for each district along the Longhai Railway from 2000 to 2020. In addition, due to the inconsistency of DMSP-OLS data acquired by different sensors for the same year, the author referred to existing methods to correct some images for inter-correction and continuity after saturation correction, see Equations 1, 2 (Zhang et al., 2020).
where
3.2 Methods
3.2.1 Flow chart of the methodology
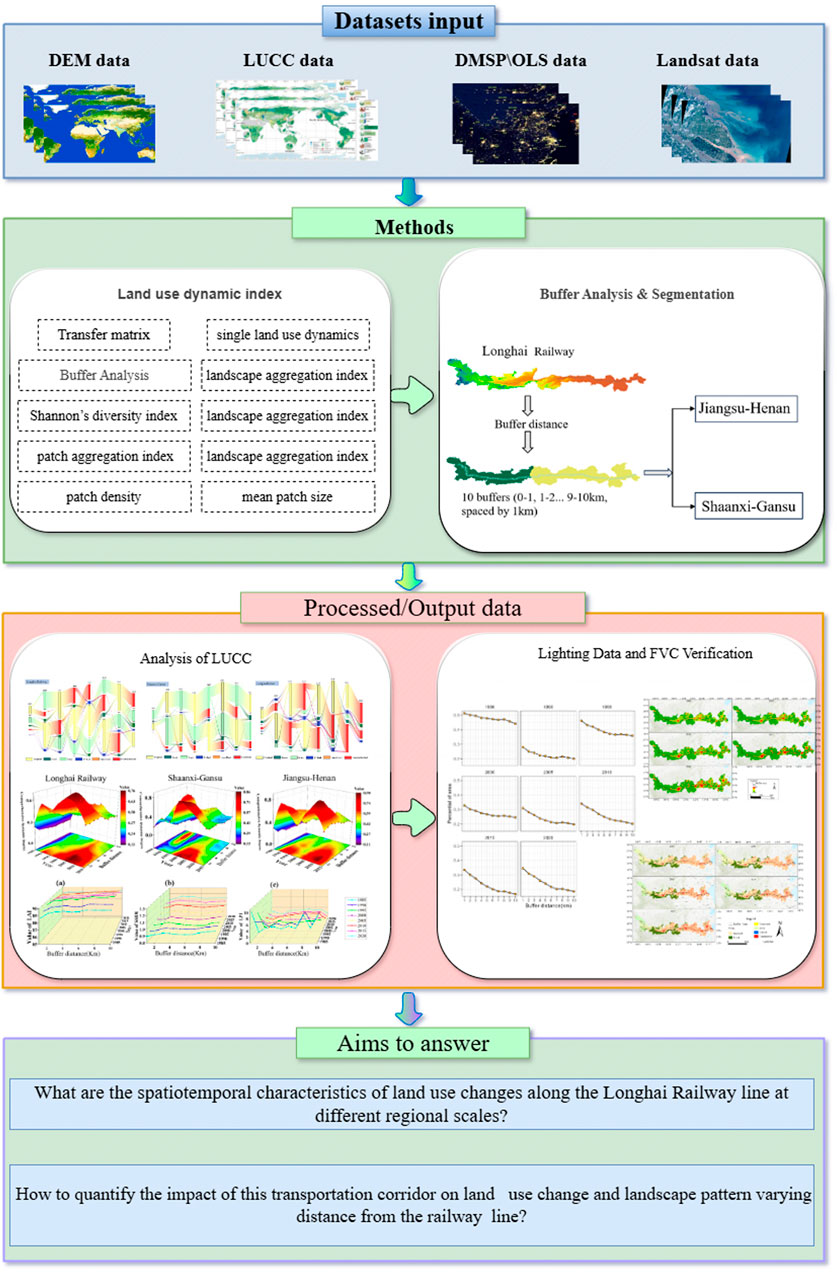
According to the current status of land use along the Longhai Railway, we established a buffer zone extending 10 km to both sides with the railroad as the centerline, and the interval between buffer zones was 1 km. By superimposing the buffer zones and land use data, the land use changes and landscape changes along the railroad line of the Longhai Railway were analyzed in a geo-economic context (Figure 2).
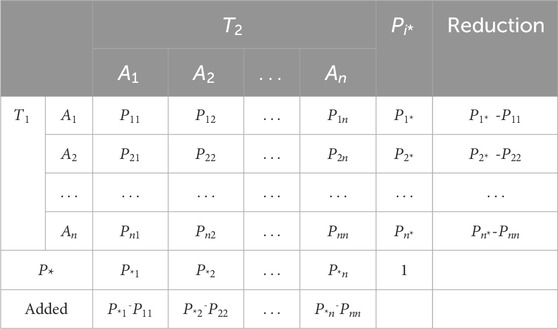
3.2.2 Transfer matrix
The inter-transition situation between land use types is mainly realized by using the land transfer matrix (Alves et al., 2022). The land use transfer matrix comes from the quantitative description of the system state and state transfer in system analysis. In the usual land-use transfer matrix, the rows represent the land use types at the time point of
3.2.3 The dynamic degree of land use
Land use dynamics (Xiao et al., 2022) refers to the quantitative changes in land use types in a certain period, mainly reflecting the intensity of land use changes and regional differences in the rate of change, mainly divided into a single land use dynamics (Mustafa et al., 2021) and integrated land use dynamics (Chen et al., 2023), the formula is as Equations 3, 4:
Where
Where
3.2.4 Land use and landscape pattern analysis
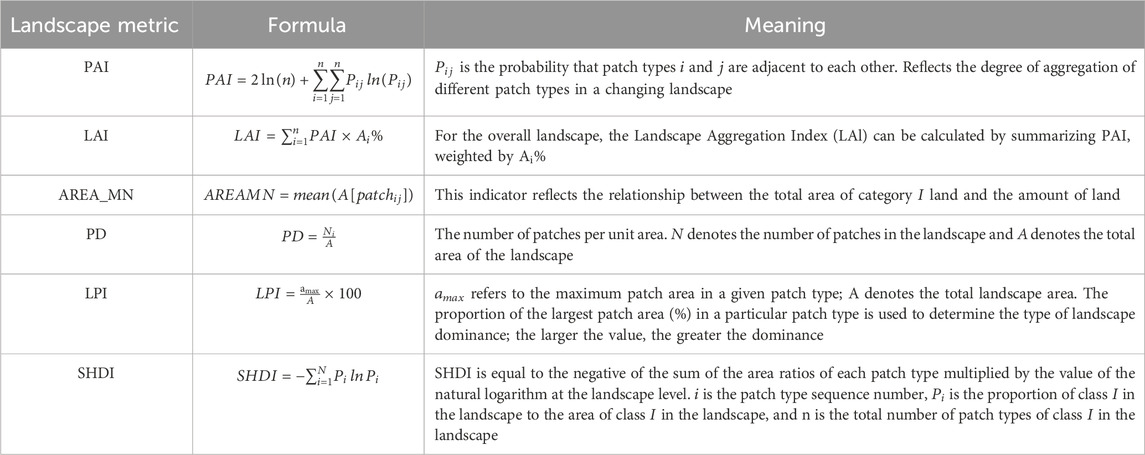
Landscape pattern analysis (Costanza et al., 2019) is the main method for evaluating landscape structure, composition, and spatial patterns. It condenses the landscape information and reflects the characteristics of the landscape. Among the landscape-level indicators are the landscape aggregation index (LAI), the largest patch index (LPI), and the Shannon’s diversity index (SHDI). The indicators at the patch level are three indicators: patch aggregation index (PAI), mean patch size (AREA_MN), and patch density (PD). The data of these indicators were calculated (Table 3) by the software Fragstats 4.2 (McGarigal and Marks, 1995).
3.2.5 Nighttime lighting statistics in the buffer zone
Currently, night-light remote sensing images are widely used for monitoring land cover (Zhang et al., 2024), estimation of socio-economic parameters (Li et al., 2016; Zheng et al., 2023), regional development studies (Lu et al., 2022), urbanization monitoring (Li et al., 2022) and many other research areas, which can objectively respond to socio-economic trends and facilitate the use of large spatial scales. For this reason, this paper selects the nighttime light data of the 10 km buffer zone from 2000 to 2020 for statistical research to verify and invert the role of the Longhai Railway on regional urban development. The total amount of night light
where
4 Results
4.1 Spatial and temporal characteristics of land use changes along the Longhai Railway
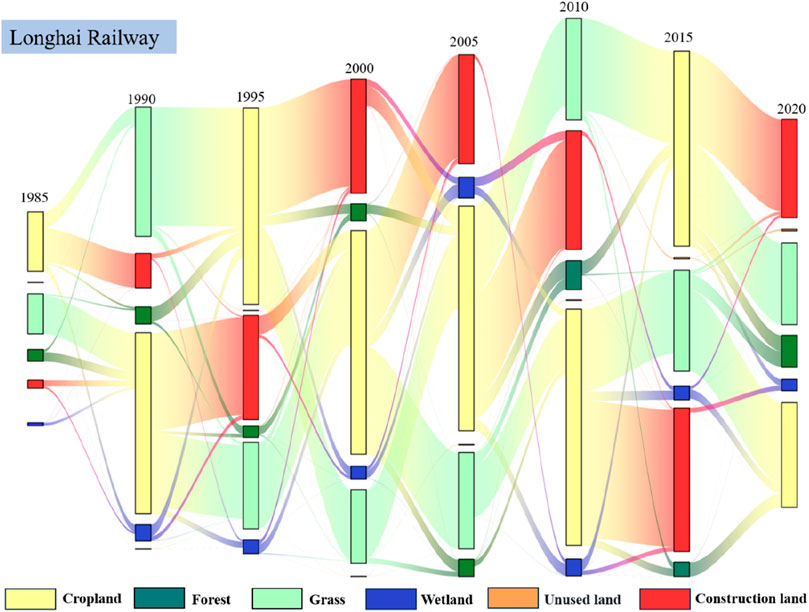
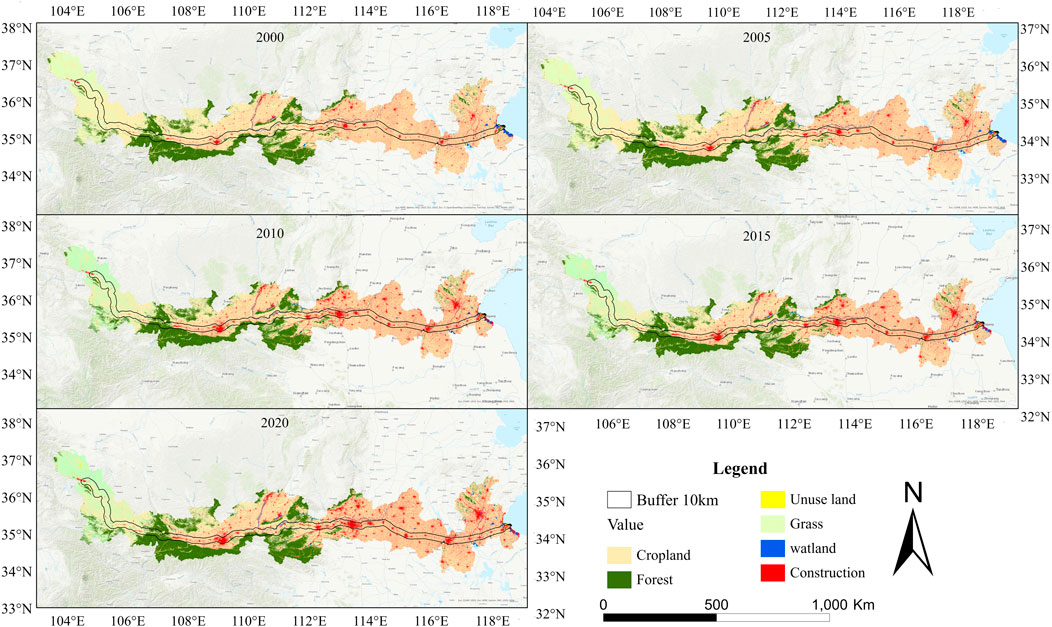
Five important node cities (Lanzhou, Xi’an, Zhengzhou, Xuzhou and Lianyungang) along the Longhai Railway, were selected to analyse the impact of the railway on their land-use changes (Figure 3). It was found that compared with 1985, the area of construction land in 2020 increased significantly in all five cities, especially in Zhengzhou and Xi’an, where construction land encroached on large areas of cropland. There are significant changes in land use types across the Longhai Railway, which are dominated by changes in construction land and cropland (Figure 4). Construction land increased from 2,475.67 km2 (1985) to 6,485.33 km2 (2020), an increase of 161.96%. Similarly, the area of cropland decreased from 23,820.52 km2 to 20,049.03 km2, a decrease of 15.83%. Forest area increased by 9.39% from 2,535.79 km2 to 2,773.84 km2. Grassland area decreased from 4,179.61 km2 to 3,685.13 km2, a decrease of about 11.83%.
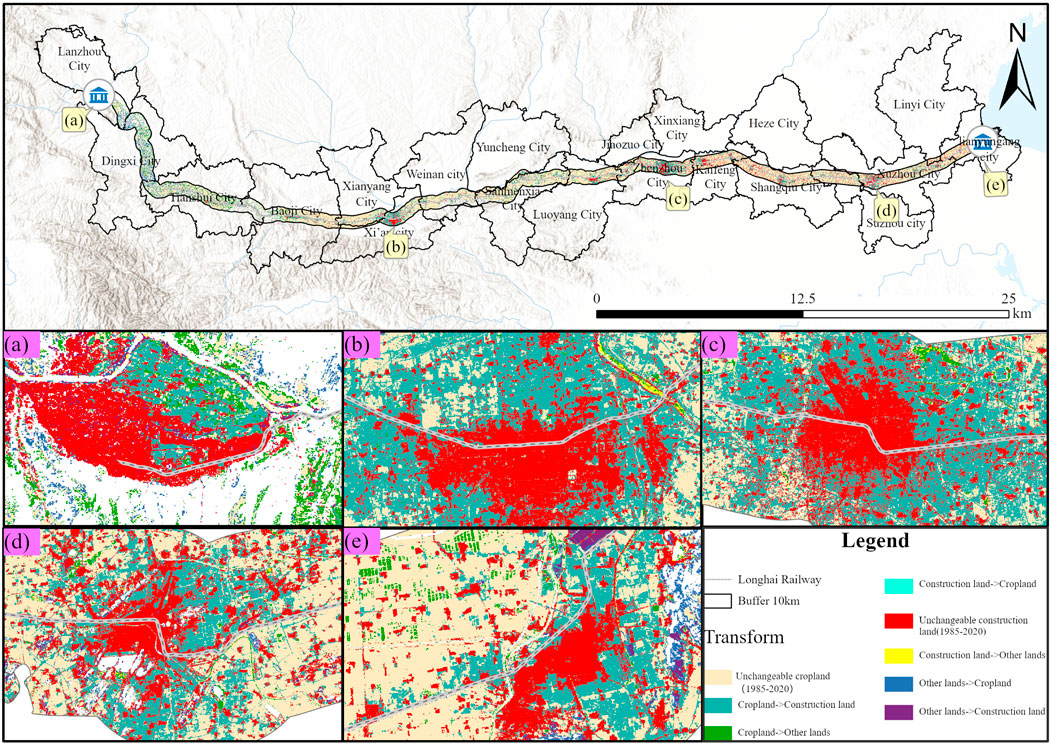
Figure 3. Expansion of crop and construction land along the Longhai Railway from 1985 to 2020 [(A) Lanzhou, (B) Xi’an, (C) Zhengzhou, (D) Xuzhou, (E) Lianyungang].
Overall, the area of construction land expansion increases year by year from west to east. In terms of buffer distance, the rate of change of land use types is inversely proportional to the buffer distance, indicating that the Longhai Railway has an important influence on the local land use pattern. Over the past 35 years, the rate of change of land use in the entire area of the Longhai Railway has shown an overall trend of slowing down and then speeding up, and the rate of conversion of various types of land use types has accelerated after 1990, especially between 1990 and 1995, when the expansion of construction land was the most prominent, and a large amount of cropland was converted into construction land. Especially in 1990–1995, when the expansion of construction land was the most prominent, and a large amount of cropland was converted into construction land (Figure 4).
In terms of the eastern and western sections, the construction land in the eastern section (Jiangsu-Henan) increased from 1,930.51 km2 in 1985 to 4,741.33 km2 in 2020, a year-on-year increase of 145.60%. Cropland decreased from 14,820.93 km2 in 1985 to 12,136.05 km2 in 2020, shrinking by 18.81% (Figure 5). On the other hand, the construction land in the western section (Shaanxi-Gansu) increases from 545.18 km2 to 1,744.08 km2, a year-on-year increase of 219.91%. The cropland area has decreased by 12.07% from 9,000.167 km2 in 1985 (Figure 6).
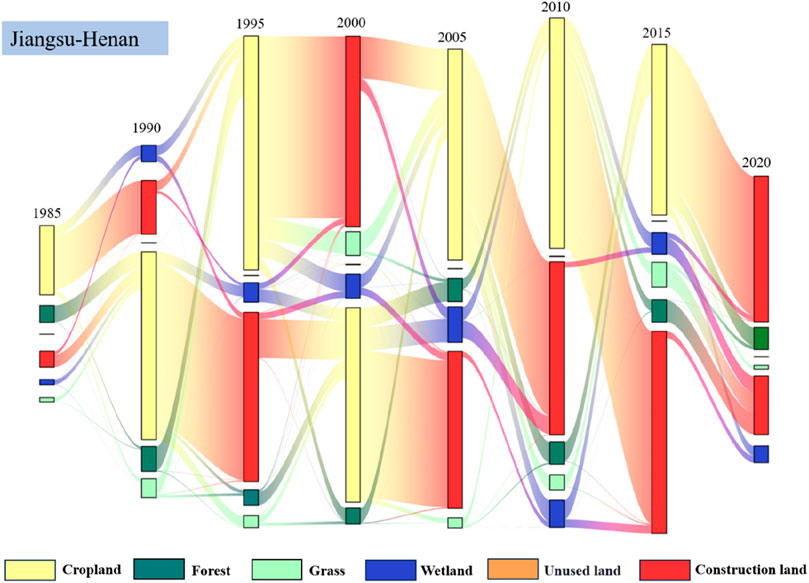
Figure 5. Sankey map of land cover changes in the eastern section (Jiangsu-Henan) of the Longhai Railway from 1985 to 2020.
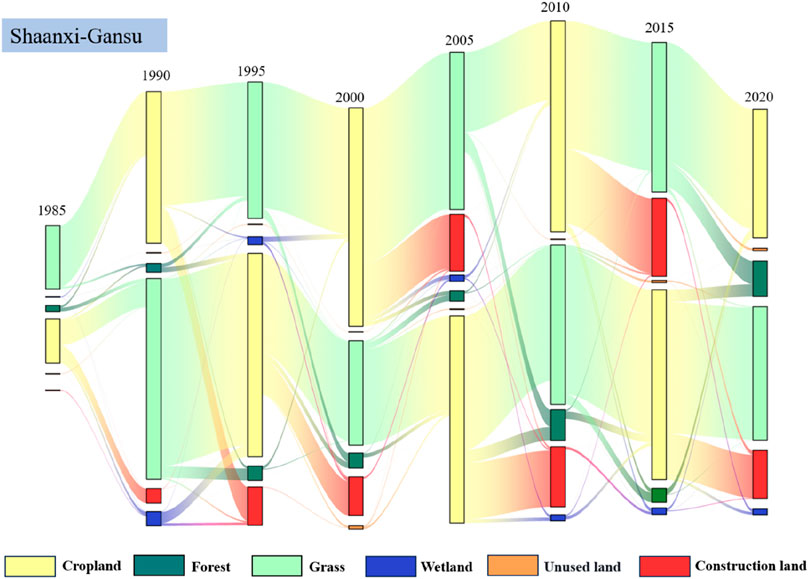
Figure 6. Sankey map of land cover changes in the western section (Shaanxi - Gansu) of the Longhai Railway from 1985 to 2020.
Compared with the eastern section, the expansion of construction land in the western section was relatively slow. Specifically, there was no change in the construction land in the western section from 1990 to 2000, and it was not until the period of 2000–2015 that there was a relatively large change in the type of land use, which was mainly manifested in the conversion of cropland and grassland, with a slight increase in the construction land. Due to the ecological fragility of the western part of China and the reclamation of land for economic development in the early period, a large area of grassland was converted into cropland in 1990–1995 (Figure 6). However, after 2000, with the national emphasis on the ecological environment, the cropland was gradually converted into grassland and forest land. As for the eastern section, due to its flat terrain and good water-heat combination, the conversion of all kinds of land-use types accelerated from 1990 onwards, mainly the conversion of cropland and construction land. As can be seen from Figure 5, a large amount of cropland was converted to construction land, with the most conversions between 1995 and 2015. In addition, the study found that areas closer to the Longhai Railway (e.g., within the 2 km buffer zone) had the fastest land conversion.
4.2 Comparison of land use dynamics between the buffer zones of the Longhai Railway
The dynamics of land use change along the Longhai Railway at different buffer distances (i.e., the 1st–10th buffer zone, represents distances of 1–10 km from the railway line, respectively) from 1985 to 2020 was analyzed using two types of indicators: the degree of synthesis and single land use. The integrated land use dynamic degree of the whole area shows an M-shaped trend with the increase of buffer distance (Figure 7). There is a main peak between the 1st and 3rd buffers and a secondary peak between the 4th and 6th buffers.

Figure 7. Integrated land-use mobility and mobility index for the buffer zone of the Longhai Railway, eastern section (Jiangsu-Henan) and western section (Shanxi-Gansu).
For the degree of single dynamics (Figure 8), both the eastern and western sections showed a decreasing trend year by year from 1985 to 2005. However, after 2005, the area of grassland increased at a faster rate in each buffer zone, and the single land dynamics of grassland showed a “W” shape in time and buffer zone. During the same period, the single land dynamics of construction land showed an “M” trend in both time and buffer, with a peak in 1990 and 2010 respectively, mainly in the buffer (between the 2nd and 4th buffers). Worth noting is that for cropland, within 1 km buffer zone, peak and valley values were observed in 1985 and 2005, respectively. However, overall, regardless of the distance of the buffer zone from the railway line, the degree of single land use dynamics for cultivated land remained relatively small. In the 10 km buffer zone in 1985, a positive peak value was evident, while for the rest of the time, it remained negative. This indicates a continuous decrease in cropland along the Longhai Railway since 1985. As for grassland, we found that from 2000 to 2010, regardless of changes in buffer zone distance, its single dynamic attitude consistently showed positive values. The single dynamic attitude of construction land was also positive. This suggests that over the past 35 years, the area of construction land has continued to increase. From the east and west sections, the land use dynamics of grassland and construction land in the east section has similarities with the overall change characteristics of the west section.
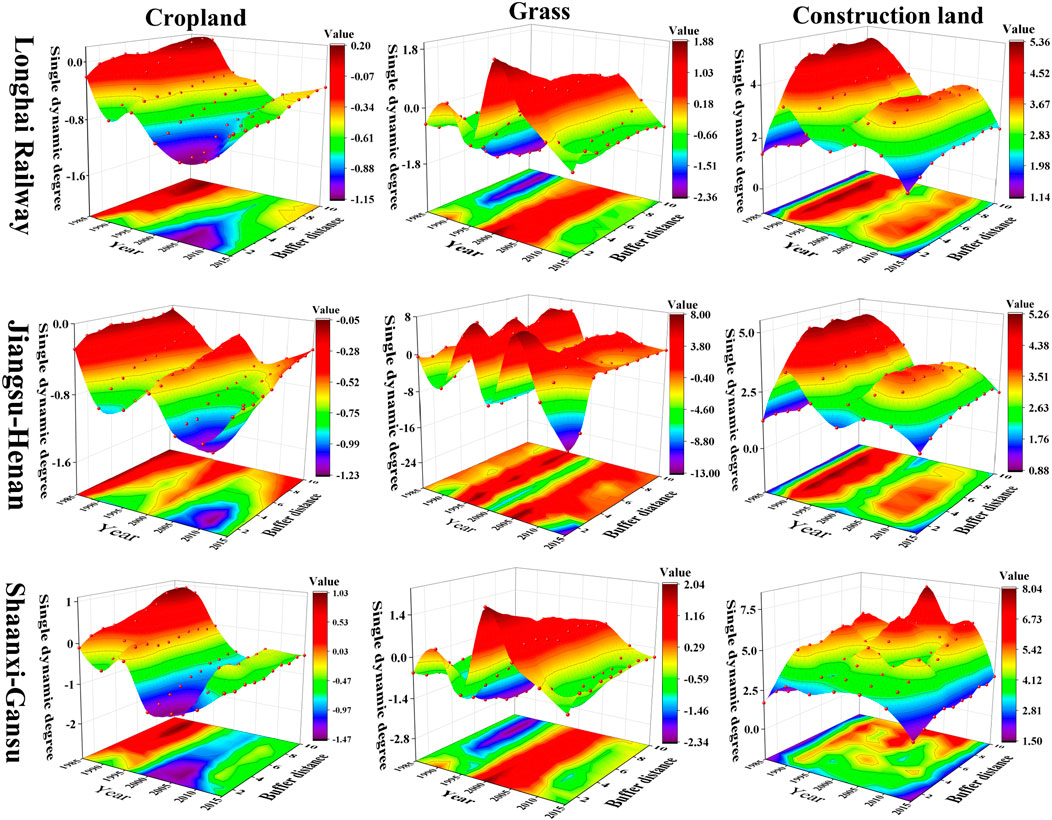
Figure 8. Dynamic attitude and dynamic attitude index for single land use in the buffer zone of the entire Longhai Railway, the eastern and western sections.
At the same time, two land use dynamics indices, integrated and single, were utilized to measure the degree of land use dynamics at different buffer distances over 35 years. From the composite index, the land-use dynamics of the Longhai Railway showed an M-shaped characteristic in time, with two peaks around 1990 and 2005, respectively, and a high rate of land-use change (Figure 8). That is, it gradually increased from 23.7% in 1985 to 57.09% in 1990, then decreased to 49.8% in 1995, and rapidly increased to 75.17% in 2005. Combined with the single index, the changes in cropland and construction land have a higher contribution in these two phases, indicating that factors such as economic development and accelerated rate of urbanization exacerbated the degree of land use change in this phase. In the area farther away from the Longhai Railway, another peak appeared near 1985, and in combination with the single index, the change of grassland and construction land was the main factor influencing the attitude of land use change dynamics in this stage. In terms of buffer distance, the overall dynamic index is relatively low in areas farther away from the Longhai Railway, considering that the Longhai Railway passes through large cities such as Xi’an and Zhengzhou, indicating that the dynamic attitude of land use in urban areas is generally higher than that in peri-urban areas.
Specifically, the dynamic attitude of the western section did not change in the 2 km buffer zone from 1985 to 2000, while the change was more obvious between the 9th and 10th buffers. Starting from 2000, the rate of land change in the second buffer zone was higher, forming a peak in 2005. Combined with the single index, the contribution of cropland was higher in this period, indicating that the change in cropland was an important factor affecting this section. The dynamic attitude of the eastern section is in the shape of “M”, which is similar to the dynamic attitude of the Longhai Railway as a whole, indicating that the conflict between cropland and construction land caused by the intensification of urbanization is the main feature of this region. From the value of the dynamic attitude, the land use dynamic attitude of the eastern section is higher, indicating that the rate of change of land use types in the eastern region is higher, which is also consistent with the conclusion of the overall characteristics and spatial-temporal dynamics of the land use change along the Longhai Railway.
In terms of the single dynamic index, grassland as a whole has a “W” shape, while cropland and construction land have a roughly “M” shape. The construction land has the highest mobility index. In the west section of the Longhai Railway, the disturbance of the construction land to the cropland is low, while the disturbance of the construction land to the cropland in the east section is high. Combined with Figure 5, the construction land in eastern section mainly comes from the cropland, which indicates that the urbanization construction encroaching on the cropland is more serious. The phenomenon of grassland and cropland inter-transfer is more prominent in the western section, indicating that the conflict between environmental protection and cropland development is the theme of the region at different times.
4.3 Characteristics of vegetation coverage changes within different buffer distances along railway lines
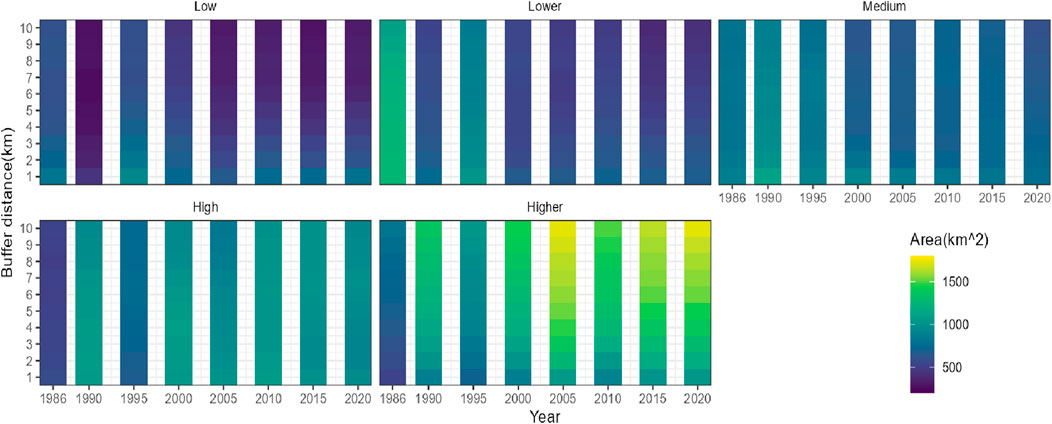
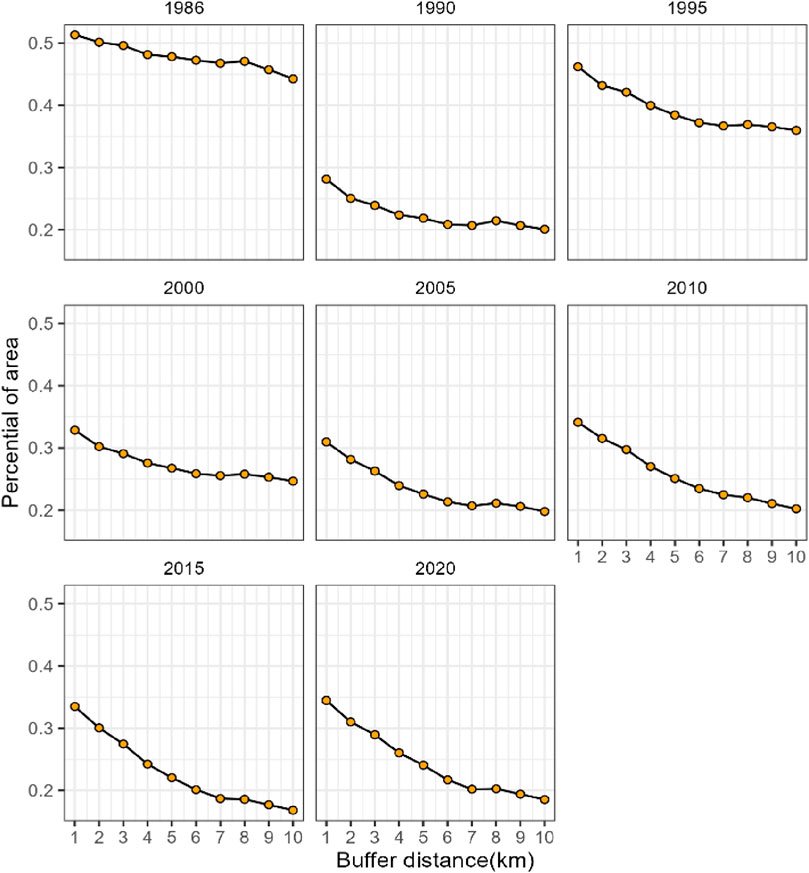
The analysis of the current state of the natural ecological environment within a 10 km buffer zone along the Longhai Railway, based on vegetation coverage parameters, reveals that overall vegetation coverage values have been relatively high from 1986 to 2020. Within the 10 buffer zones (each established at 1 km intervals), the areas covered by low-density and moderately low-density vegetation accounted for 47.85%, 22.56%, 39.38%, 27.40%, 23.60%, 25.74%, 23.01%, and 24.56% from 1986 to 2020, respectively. Starting from the year 2000, the area covered by high-density vegetation has shown an increasing trend. Regarding buffer distance, the area covered by high-density vegetation generally increases with greater buffer distance (Figure 9), while the area covered by low-density vegetation tends to be inversely proportional to buffer distance. Within the same year, between the first and seventh buffer zones, the area covered by low-density and moderately low-density FVC decreases rapidly with increasing buffer distance. Between the 7th and 8th buffer zones, the area covered by these two FVC types shows an upward trend in some years and remains relatively stable in others. Subsequently, with further increases in buffer distance, the area covered by both types of FVC gradually decreases (Figure 10).
4.4 Changes in landscape patterns in different buffer zones along the Longhai Railway
4.4.1 The impact of railway lines on patch scale index
In this study, the landscape pattern was characterized in terms of patch aggregation index (PAI), average area (AREA-MN), and patch density (PD) at the patch scale. During 1985–2020, the PAI index for each land use type showed an increasing trend, indicating that the effectiveness of land planning was relatively significant and more intensive land use (Figure 11). In terms of distance, the farther away from the Longhai Railway, the higher the PAI index of other land use types except for construction land, indicating a higher degree of agglomeration, while construction land is relatively fragmented, especially in the suburban areas, which show a fragmented distribution. Among the five land use types, cropland has the highest PAI, indicating a high degree of aggregation. Within the 1st–10th buffer zone, the PAI index is smoother, but generally shows an upward trend. From 1985 to 2020, the PAI of cropland within the 1st–2nd buffer zone decreased significantly. The PAI values within each buffer zone were higher than in other years during the same period. PAI values for construction land show an overall decreasing trend as the buffer area increases. There was an increasing trend within each buffer zone area over time. PAI values for forest land showed an overall fluctuating upward trend within the 1–10 km buffer zone. Within the 4th–6th buffer zone, there was a trough. The PAI of wetland showed a fluctuating and increasing trend internally with a slight decreasing trend within the 7th–10th buffer zone. The PAI values for grasslands showed little change overall, with a small peak at the 1st–2nd buffer zone, after which a slow decline began.
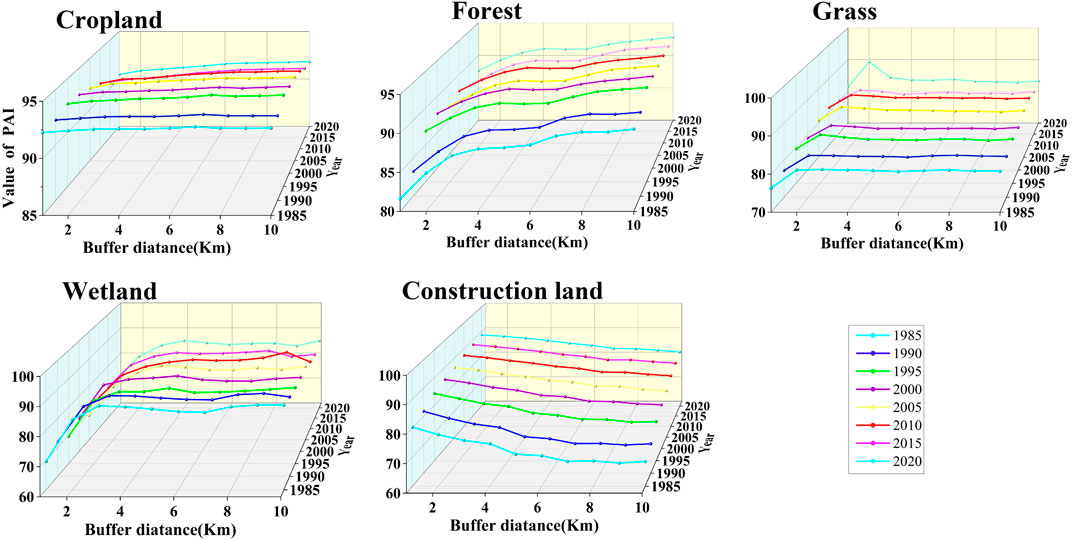
Figure 11. The changing trend of PAI of buffer zones with different land use types on the Longhai Railway.
In terms of the AREA_MN (Figure 12), the changes in cropland, wetland, and construction land are more significantly characterized. With the change of time, the AREA_MN index of construction land showed a significant upward trend, while the relative AREA_MN index of cropland and wetland showed a more obvious downward trend, indicating that the conflict between construction land and cropland and wetland has been increasing. From the perspective of buffer distance, with the increasing distance of the buffer zone, the AREA_MN index of construction land gradually decreases, and the AREA_MN index of suburban areas farther away from the Longhai Railway is significantly lower, indicating that the construction of the railroad trunk line has a significant impact on the expansion of construction land.
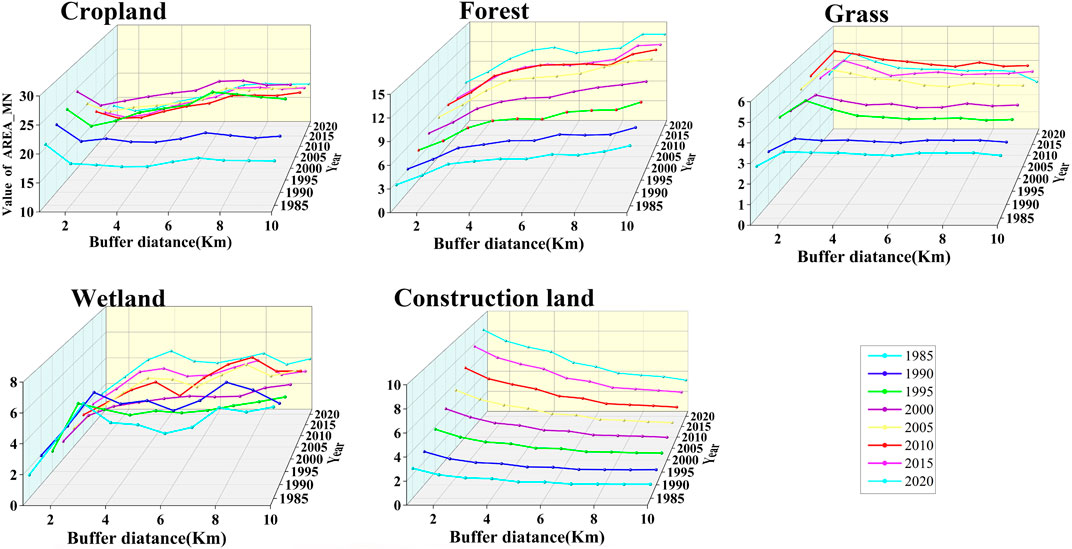
Figure 12. Trends in the average area of buffer zones (AREA_MN) for different land use types along the Loonghai Railway.
In terms of PD (Figure 13), the value of construction land is the highest, and the overall PD value is relatively smooth, with the highest place occurring within the 2 km buffer zone, indicating that the density of construction land in this zone is higher and urban construction is faster. The PD value of the wetland area is the lowest and the density is the smallest. The PD value of cropland shows an increase first and then forms a small wave peak at 2nd buffer zone as the buffer distance decreases. Woodland and grassland areas were similar, with little inter-annual variation within each buffer.
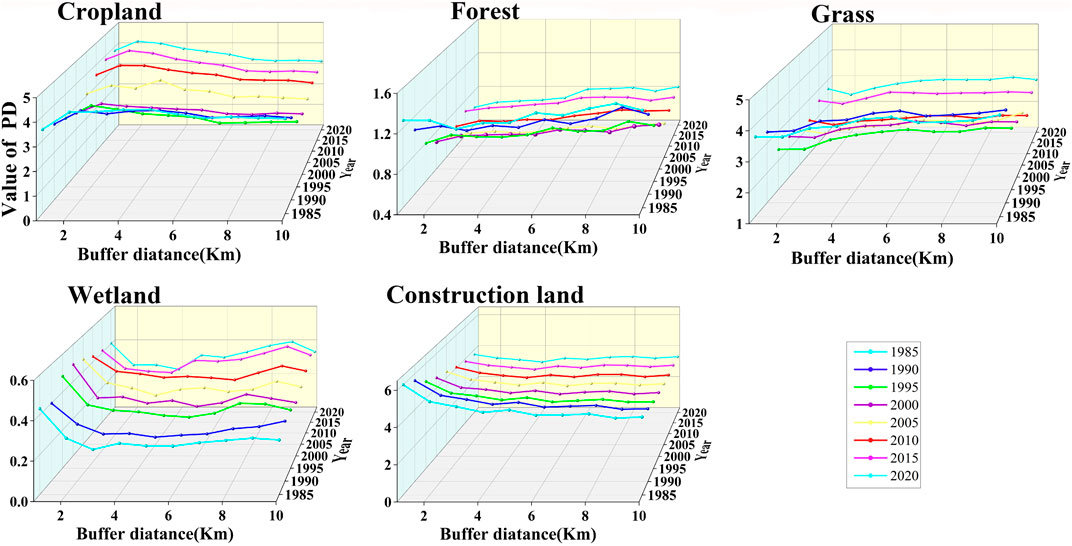
Figure 13. Change trend of patch density (PD) in buffer zones of different land use types on the Longhai Railway.
4.4.2 The impact of railway lines on landscape level indices
At the landscape level, the landscape pattern along the Longhai Railway and within different buffer zones was analyzed as a whole using the Shannon Diversity Index (SHDI), the landscape aggregation index (LAI), and the largest patch index (LPI) (Figure 14). The overall LAI index in the study area was relatively smooth, showing an increasing pattern within the 2 km buffer zone, where land was more concentrated. During 1985 and 2020, the SHDI index showed an overall increasing trend with slight fluctuations as the buffer zone distance increased, indicating that each patch type was balanced and distributed in the landscape. Specifically, it gradually increased at the 1st–3rd buffer zone, then gradually decreased, and then gradually increased again at the 7th buffer zone, forming a peak at the 3rd buffer zone and a trough at the 7th buffer zone, respectively. In the time series, the LPI index fluctuated greatly in 1985 and 1990, and the LPI initially decreased in the 1st–2nd buffer zone, indicating that with the increase of the distance from the railroad line, the maximum patch area was smaller and more strongly disturbed by human beings, and then it slowly increased during 2nd–6th buffer zone, and then the LPI fluctuated strongly between the 6th–10th zone. After 1990, the overall fluctuation of the LPI index was smaller, but during the 1st–2nd buffer zone, the LPI was always in a decreasing trend, indicating that the closer to the railroad, the higher the degree of fragmentation of the patches.

Figure 14. Trends of different landscape indices [(A): Landscape aggregation index, i.e., LAI, (B): SHDI, (C): LPI] of the Longhai Railway.
4.4.3 Night light images
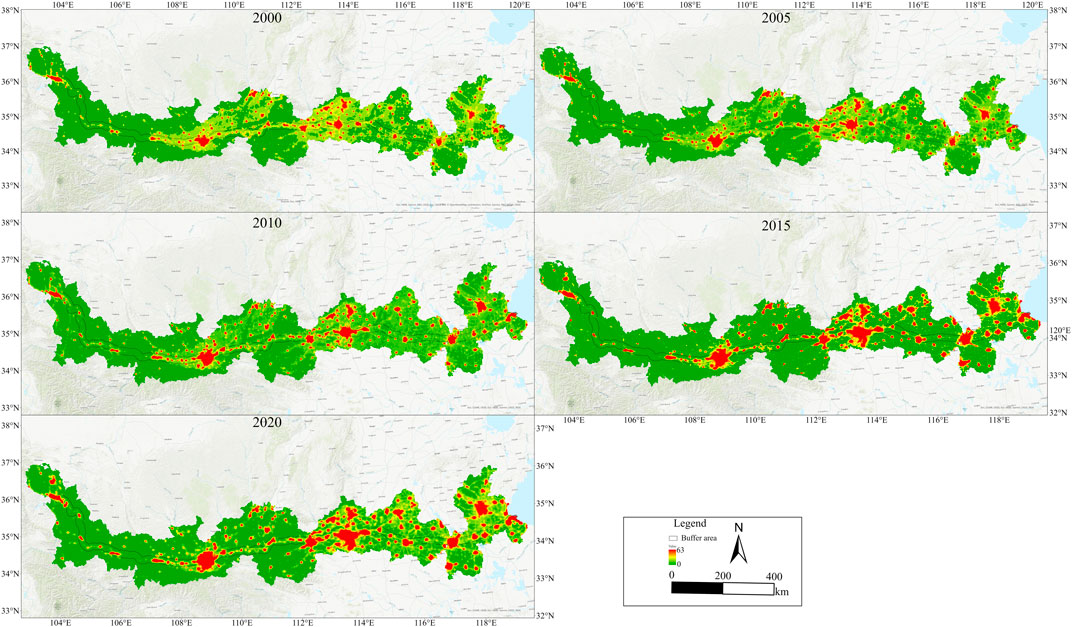
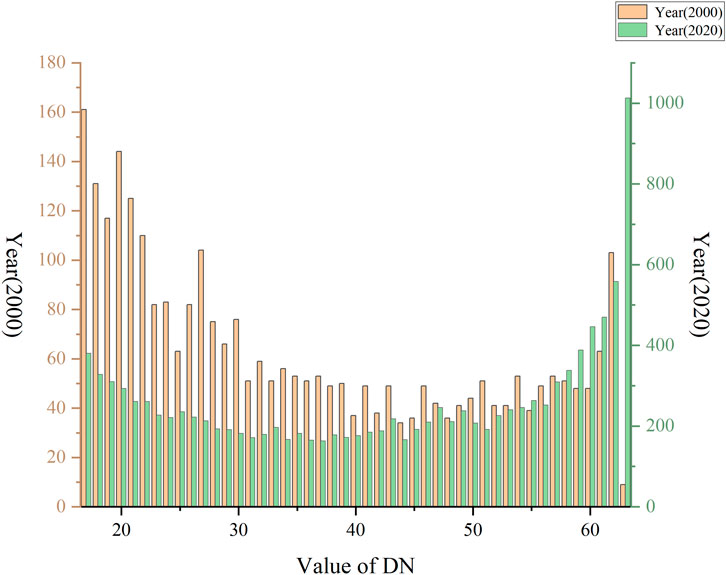
Changes in the intensity of the light index reflect the development of regional urbanization. The contrast between bright and dark areas on the lighting image can be a powerful tool for studying human activities and their impacts. By comparing and analyzing the intensity of nighttime lights in each district along the railroad from 2000 to 2020 (Figures 15, 16) with the land cover changes in each district during the same period (Figure 17). It is found that relatively developed cities such as Zhengzhou, Xi’an, and Xuzhou have a larger increase in lighting area and rapid economic development in the last 20 years. While small cities along the line have a certain degree of economic growth, the lighting growth is smaller, indicating that these cities are relatively slow to develop. The farther away from the railroad line, the smaller the intensity of the lights. Moreover, the areas along the line where cropland, forest land and grassland are distributed are sparsely populated, and the lighting index has remained almost unchanged over the years.
In addition, the light index within the buffer zone is highly correlated with the LAI and AREA_MN (Table 4), indicating that the light area along the route continues to expand and become more concentrated over time. The light index is significantly negatively correlated with the LAI and AREA_MN of three types of land use (cropland, forest land, and wetland), and significantly positively correlated with building land. Therefore, it further proves that the Longhai Railway has an important impact on the changes in the land landscape pattern along the line.
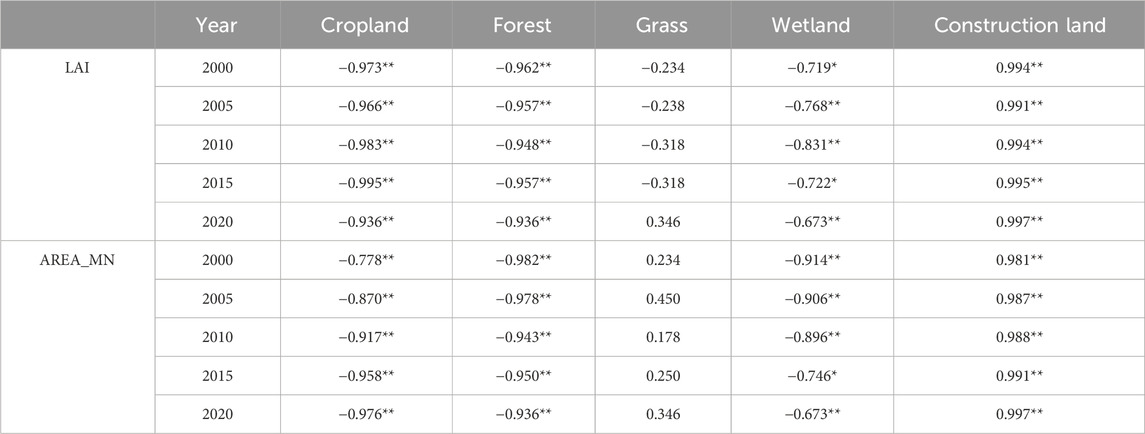
Table 4. Correlation analysis of lighting index with aggregation index and mean patch area in the 10 km buffer zone of Longhai Railway, 2000–2020 (“**” denotes p< 0.01, “*” denotes p< 0.05).
5 Discussion
5.1 The impact of linear transportation corridors on land use and coverage
Road construction will have a certain impact on the ecology, environment, and landscape pattern along the route. What is the impact range of linear transportation corridors on the ecological landscape pattern on both sides? This is a question worth studying. A study has found that the construction of highways leads to a decrease in landscape integrity, and the ecological landscape tends to become more complex and fragmented (Zhang et al., 2023a). Landscape diversity is greatly influenced by transportation routes and can be used to indicate the fragmentation, connectivity, and isolation of route buffer zones (Su et al., 2014). Existing research has shown that the impact of transportation on land cover change decreases linearly with distance (Röder et al., 2015; Vilela et al., 2020). However, the degree of comprehensive land use dynamics along the Longhai Railway line in the buffer zone shows an “M” type change. Similarly, the comprehensive dynamic degree of land use along the China-Laos railway from 2017 to 2022 shows two peaks within the buffer zones of 2–4 km and 8–10 km (Xiao et al., 2024). A positive dynamic degree indicates an increasing trend in the quantity of land use types, and vice versa. The comprehensive land use dynamics within a 2 km buffer zone along the Longhai Railway reached its peak at two-time points in 1990 and 2005. However, in other buffer zone locations, the comprehensive land use dynamics are showing an increasing trend year by year. Looking at the segments, there are two peaks in the eastern section within the 1–4 km buffer zone from 1990 to 2010. The spatiotemporal variation pattern of comprehensive land use dynamics in the western section is relatively complex. Research has shown that the further away from the Kunming Bangkok Expressway, the smaller the overall change in land use, and after the expressway is opened, its impact range will exceed 10 km (Zheng et al., 2021). However, for the same year, the comprehensive land use dynamic degree of the entire Longhai Railway line is smaller as it is further away from the railway line. This indicates that since the opening of the Longhai Railway, the impact of the railway on land use cover changes has decreased beyond 10 km along the railway line.
In addition, national policies have an important impact on regional ecological environment changes, such as the ecological protection red line situation in China’s ecological environment has been greatly improved. In 2005, China attaches great importance to ecological environmental protection, “Two Mountains” concept proposed the establishment of nature reserves, ecological civilisation construction bases, and other measures to strongly promote China’s ecological environment change. Sustainable land management benefits from this “Two Mountains” theory (Huang et al., 2024). From the point of view of land use along the Longhai Railway line, in 2005, there was a peak in the attitude of comprehensive land use motivation and single land use motivation, which indicates that the grassland changes are the most drastic at this time, and the policy has a significant impact on the ecological environment.
During the railway construction period, with the increase of buffer zone distance, the dynamic change of single land use was relatively stable (Xu et al., 2022). Since the Longhai Railway line was opened to traffic in 1953, it was not possible to analyze the ecological environment before its construction, and only the situation since 1985 was analyzed. From the results, the dynamic change of single land use for cultivated land area along the Longhai Railway line peaked positively at the 10th buffer zone location in 1985, while other years and buffer zone distances showed negative values and did not exhibit stable characteristics. Within the 10 km buffer zone along the Longhai Railway, the construction land has been continuously increasing, which also verifies the previous characteristics of land use type conversion, namely, grassland and cropland area were mainly converted into construction land. The main areas of increase and decrease were located in the first to second buffer zones, indicating that the operation of the railway has facilitated the conversion of land use patterns along the line. Within the range of 2–10 km from the Longhai Railway line, the construction land and grassland exhibited opposite trends in their single dynamic changes between 1985 and 2020. Specifically, the single land use dynamic change of construction land generally declined with the increase of buffer distance during 1990–2000.
According to the index of single land use dynamic degree, the absolute values of the land use change intensity index for various land use types have shown an increasing trend, indicating that factors such as accelerated economic development and urbanization have intensified the degree of land use change during this period. Overall, from 1985 to 2020, the main types of land use change were cropland and construction land, both experiencing significant changes. The area of cropland showed a decreasing trend overall, while the area of construction land increased. Additionally, between 2000 and 2010, the single dynamic degree of grassland increased, resulting in an increase in area, which may be related to environmental improvements in western China. The results of the single dynamic degree change of grassland in the Shaanxi-Gansu section also support this conclusion.
5.2 The impact of linear transportation corridors on the ecological environment
The distribution of vegetation coverage along the Lhasa-Linzhi railway indicates that the vegetation coverage increases as the distance from the railway line increases (Zhang et al., 2023b). Through analyzing the relationship between vegetation coverage changes and buffer zone distances over the past 35 years, we also found a pattern that the closer to the railway, the worse the vegetation coverage. Research on ecological changes along the Qinghai-Tibet Railway corridor has shown that the overall ecological environment quality relatively declined from 1986 to 1994, while it exhibited a stable recovery trend from 2013 to 2020 (Zou et al., 2024). In this study, regarding temporal changes, since the 1980s, the vegetation coverage along the Longhai Railway has generally been high, with a fluctuating decrease in the area of low-density and lower-density FVC. Between 1986 and 1995, the average proportion of low-density and lower-density FVC areas was above 30%. However, after 2000, the proportion of these two density levels fell below 30%, and the area of higher-density vegetation coverage increased significantly. This may be due to the effective promotion of the ecological restoration and protection project from 2000 to 2002, which improved FVC from low, medium, and high coverage levels to extremely high coverage levels (Cai et al., 2022).
The degree of land patch fragmentation along the China-Laos railway line is inversely proportional to the distance from the buffer zone (Xiao et al., 2024). Similarly, as the buffer zone distance increases, the degree of landscape fragmentation along the Longhai Railway decreases, and the rate of change in the landscape pattern gradually slows down. Through the study of the transportation corridor in Yunnan, China, it was found that although the overall landscape pattern is stable, there are still dynamic changes in the landscape composition and horizontal distribution of patch types (Liang et al., 2014). In terms of buffer distance, the AREA_MN index of construction land gradually decreases as the distance from the Longhai Railway line increases. Especially in suburban areas far from the Longhai Railway line, the AREA_MN index is significantly lower. This indicates that the construction of the railway trunk line has a significant impact on the expansion of construction land. Research analysis shows that the impact of the railway construction from Golmud to Lhasa on vegetation richness is limited to a 5 km range (Wang et al., 2015). In addition, the AREA_MN index of grassland does not change much in time and space, indicating that the Longhai Railway line focuses on ecological environment protection. These findings can enhance the prediction and assessment of vegetation cover dynamics within a certain distance along transportation corridors, as well as the implementation and management of afforestation projects.
6 Conclusion
Currently, with the rapid development of transportation, there is an urgent need to quantitatively study the scope, degree, and pattern of the impact of cross-regional transportation corridors on land use and landscape change. In this paper, 10 buffer zones at 1-km intervals were established on the Longhai Railway. Based on the land use change data, satellite data, and nighttime lighting data, using geographic information technology and landscape ecology methods, the conversion trend (1985–2020) of land cover types, spatial distribution patterns, and evolutionary characteristics of landscape patterns at different distances from the railway line were revealed. The main conclusions were as follows.
(1) Between 1985 and 2020, the area of cropland and grassland in the buffer zone continued to shrink, mainly converted into construction land. Compared to 1985, construction land showed an increase of 161.96%. However, the cropland and grassland areas decreased by 15.83% and 11.83% respectively. In terms of the eastern and western sections, the construction land in the eastern section increased from 1,930.51 km2 (1985) to 4,741.33 km2 (2020), an increase of 145.60%. The construction land in the western section increases from 545.18 km2 to 1,744.08 km2, an increase of 219.91%. This indicates that with the continuous operation of the Longhai Railway Line, the expansion rate of construction land in the western section is faster, which is of great significance for shortening regional differences.
(2) The construction and operation of interregional transport corridors often have a greater impact on the ecological environment. The results of the study show that the closer to the railway line, the more intense is the degree of integrated land use dynamics along the railway in the buffer zone. In addition, the impact of the railway on land use dynamics had two peaks in the buffer zone, which exacerbated landscape fragmentation while changing the landscape pattern. The fragmentation of land patches and fractional vegetation coverage is negatively and positively correlated with the buffer zone distance, respectively. The degree of fragmentation of construction land patches increases with the distance of railway line.
The combination of land use analysis and landscape ecology methods can better reflect regional development dynamics and ecological environment change characteristics. In later research, models such as the InVEST, PLUS model can be used to predict land use cover, combined with population, climate, and economic data, to more accurately analyze the impact of railways on the surrounding land use and ecological environment in future years, and provide reference for sustainable land and ecological environment management.
Data availability statement
The datasets generated during and/or analyzed during the current study are available from the corresponding author upon reasonable request.
Author contributions
HG: Conceptualization, Funding acquisition, Writing–review and editing. XZ: Methodology, Software, Writing–original draft.
Funding
The author(s) declare that financial support was received for the research, authorship, and/or publication of this article. These research results received the funding from Anhui Natural Science Foundation (grant no. 2108085QD149), and Key Project of Natural Science Research of Anhui Provincial Education Department (grant no. 2023AH050472).
Conflict of interest
The authors declare that the research was conducted in the absence of any commercial or financial relationships that could be construed as a potential conflict of interest.
Publisher’s note
All claims expressed in this article are solely those of the authors and do not necessarily represent those of their affiliated organizations, or those of the publisher, the editors and the reviewers. Any product that may be evaluated in this article, or claim that may be made by its manufacturer, is not guaranteed or endorsed by the publisher.
References
Alves, A., Marcelino, F., Gomes, E., Rocha, J., and Caetano, M. (2022). Spatiotemporal land-use dynamics in continental Portugal 1995–2018. Sustainability 14, 15540. doi:10.3390/su142315540
Bezpalov, V. V., Lochan, S. A., Fedyunin, D. V., Polozhentseva, I. V., and Gorina, T. V. (2022). Relationship between complex integration indices and inflation indicators and their impact on the development of regional cooperation between countries to reduce the level of inflationary risks: case of the SCO member countries. Risks 11, 5. doi:10.3390/risks11010005
Cai, Y., Zhang, F., Duan, P., Yung Jim, C., Weng Chan, N., Shi, J., et al. (2022). Vegetation cover changes in China induced by ecological restoration-protection projects and land-use changes from 2000 to 2020. CATENA 217, 106530. doi:10.1016/j.catena.2022.106530
Changsheng, S. (2020). Study on ecological compensation mechanism of railway construction projects. E3S Web Conf. 145, 02047. doi:10.1051/e3sconf/202014502047
Chen, X., He, L., Luo, F., He, Z., Bai, W., Xiao, Y., et al. (2023). Dynamic characteristics and impacts of ecosystem service values under land use change: A case study on the Zoigê plateau, China Ecol. Inform. 78, 102350. doi:10.1016/j.ecoinf.2023.102350
Costanza, J. K., Riitters, K., Vogt, P., and Wickham, J. (2019). Describing and analyzing landscape patterns: where are we now, and where are we going? Landsc. Ecol. 34, 2049–2055. doi:10.1007/s10980-019-00889-6
Cui, S., Pittman, R., and Zhao, J. (2021). Restructuring the Chinese freight railway: two scenarios. Asia Glob. Econ. 1, 100002. doi:10.1016/j.aglobe.2021.100002
Forman, R. T. T. (1995). Some general principles of landscape and regional ecology. Landsc. Ecol. 10, 133–142. doi:10.1007/BF00133027
Forman, R. T. T. (2000). Estimate of the area affected ecologically by the road system in the United States. Conserv. Biol. 14, 31–35. doi:10.1046/j.1523-1739.2000.99299.x
Grimm, N. B., Faeth, S. H., Golubiewski, N. E., Redman, C. L., Wu, J., Bai, X., et al. (2008). Global change and the ecology of cities. Science 319, 756–760. doi:10.1126/science.1150195
Guo, Y., and Xie, H. (2011). “Research on landscape pattern change of land use in Lianyungang coastal zone based on remote sensing,” in 2011 Third Pacific-Asia Conference on Circuits, Communications and System (PACCS), Wuhan, China (IEEE), 1–4. doi:10.1109/PACCS.2011.5990255
Huang, Y. (2016). Understanding China’s Belt and road initiative: motivation, framework and assessment. China Econ. Rev. 40, 314–321. doi:10.1016/j.chieco.2016.07.007
Huang, Z., Bai, Y., Ali, M., and Fang, Z. (2024). “Two Mountains concept” leading the green transformation of China’s economic society. J. Environ. Manage. 359, 120960. doi:10.1016/j.jenvman.2024.120960
Kanchan, A., Nitivattananon, V., Tripathi, N. K., Winijkul, E., and Mandadi, R. R. (2024). A spatio-temporal examination of land use and land cover changes in smart cities of the Delhi–Mumbai industrial corridor. Land 13, 957. doi:10.3390/land13070957
Li, D., Zhao, X., and Li, X. (2016). Remote sensing of human beings – a perspective from nighttime light. Geo-Spat. Inf. Sci. 19, 69–79. doi:10.1080/10095020.2016.1159389
Li, J., Zou, Q., Luo, S., Huang, Y., Wang, J., and Lu, Y. (2022). “The temporal and spatial analysis of county poverty prevention in ningxia based on night light remote sensing data,” in 2022 4th International Academic Exchange Conference on Science and Technology Innovation (IAECST), Guangzhou, China (IEEE), 699–706. doi:10.1109/IAECST57965.2022.10061905
Li, S., Cao, X., Zhao, C., Jie, N., Liu, L., Chen, X., et al. (2023). Developing a pixel-scale corrected nighttime light dataset (PCNL, 1992–2021) combining DMSP-OLS and NPP-viirs. Remote Sens. 15, 3925. doi:10.3390/rs15163925
Liang, J., Liu, Y., Ying, L., Li, P., Xu, Y., and Shen, Z. (2014). Road impacts on spatial patterns of land use and landscape fragmentation in three parallel rivers region, Yunnan Province, China. Chin. Geogr. Sci. 24, 15–27. doi:10.1007/s11769-014-0652-y
Liu, S., Ma, L., Yao, Y., and Cui, X. (2022). Man-land relationship based on the spatial coupling of population and residential land – a case study of Yuzhong County in Longzhong Loess Hilly Region, China. Land Use Policy 116, 106059. doi:10.1016/j.landusepol.2022.106059
Lu, H., Qu, W., Min, S., and Chen, J. (2022). Inversion of regional economic trend from NPP-viirs nighttime light data based on adaptive clustering algorithm. Math. Probl. Eng. 2022, 1–8. doi:10.1155/2022/9266705
McGarigal, K., and Marks, B. J. (1995). FRAGSTATS: spatial pattern analysis program for quantifying landscape structure. United States: U.S. Department of Agriculture, Forest Service, Pacific Northwest Research Station. doi:10.2737/pnw-gtr-351
Mustafa, E. K., Liu, G., Abd El-Hamid, H. T., and Kaloop, M. R. (2021). Simulation of land use dynamics and impact on land surface temperature using satellite data. Geo Journal 86, 1089–1107. doi:10.1007/s10708-019-10115-0
Navalkar, A., Jaiswal, S., Pranadh, M., and Jayaraman, T. (2023). Impact of railways on land use and land cover change: evidence from India. Transp. Res. Part Transp. Environ. 124, 103933. doi:10.1016/j.trd.2023.103933
Röder, A., Pröpper, M., Stellmes, M., Schneibel, A., and Hill, J. (2015). Assessing urban growth and rural land use transformations in a cross-border situation in Northern Namibia and Southern Angola. Land Use Policy 42, 340–354. doi:10.1016/j.landusepol.2014.08.008
Sarfraz, Y., Basharat, M., Riaz, M. T., Akram, M. S., Ahmed, K. S., and Shahzad, A. (2023). Spatio-temporal evolution of landslides along transportation corridors of Muzaffarabad, Northern Pakistan. Environ. Earth Sci. 82, 131. doi:10.1007/s12665-023-10822-5
Shen, J., Zhu, W., Peng, Z., and Wang, Y. (2023). Improving landscape ecological network connectivity in urbanizing areas from dual dimensions of structure and function. Ecol. Model. 482, 110380. doi:10.1016/j.ecolmodel.2023.110380
Su, S., Xiao, R., Li, D., and Hu, Y. (2014). Impacts of transportation routes on landscape diversity: a comparison of different route types and their combined effects. Environ. Manage. 53, 636–647. doi:10.1007/s00267-013-0214-6
Sun, Y., Jin, G., Zhao, L., Guo, J., and Yue, D. (2024). Assessment of eco-environmental changes along roads in the Qinghai-Tibetan Plateau based on remote sensing data: a case study of the Sino-Nepalese Transport Corridor. Land Degrad. Dev. 35, 3552–3566. doi:10.1002/ldr.5151
Vilela, T., Malky Harb, A., Bruner, A., Laísa Da Silva Arruda, V., Ribeiro, V., Auxiliadora Costa Alencar, A., et al. (2020). A better Amazon road network for people and the environment. Proc. Natl. Acad. Sci. 117, 7095–7102. doi:10.1073/pnas.1910853117
Wang, F., Yuan, X., and Xie, X. (2021). Dynamic change of land use/land cover patterns and driving factors of Nansihu Lake Basin in Shandong Province, China. Environ. Earth Sci. 80, 180. doi:10.1007/s12665-021-09476-y
Wang, G., Gillespie, A. R., Liang, S., Mushkin, A., and Wu, Q. (2015). Effect of the qinghai–tibet railway on vegetation abundance. Int. J. Remote Sens. 36, 5222–5238. doi:10.1080/01431161.2015.1041179
Wang, S., Wu, X., Zhang, Z., Jiang, F., Xue, B., Tong, G., et al. (2002). Sedimentary records of environmental evolution in the sanmen lake basin and the yellow river running through the Sanmenxia gorge eastward into the sea. Sci. China Ser. Earth Sci. 45, 595–608. doi:10.1360/02yd9061
Xiao, C., Wang, Y., Yan, M., and Chiwuikem Chiaka, J. (2024). Impact of cross-border transportation corridors on changes of land use and landscape pattern: a case study of the China-Laos railway. Landsc. Urban Plan. 241, 104924. doi:10.1016/j.landurbplan.2023.104924
Xiao, X., Huang, X., Jiang, L., and Jin, C. (2022). Empirical study on comparative analysis of dynamic degree differences of land use based on the optimization model. Geocarto Int. 37, 9847–9864. doi:10.1080/10106049.2022.2025919
Xie, J., Xie, B., Zhou, K., Li, J., Xiao, J., Liu, C., et al. (2023). Factors impacting ecological network in Changsha-Zhuzhou-Xiangtan urban agglomeration, China—based on the perspective of functional performance. Ecol. Indic. 154, 110771. doi:10.1016/j.ecolind.2023.110771
Xu, C., Zhou, Z., Qiu, R., Lin, Y., and Hu, X. (2022). Study on land use/cover change along main railway lines in Fujian Province in recent 20 years. J. Jiangsu For. Sci. Technol. 49, 14–23. doi:10.3969/j.issn.1001⁃7380.2022.01.003
Yang, C., Wei, T., and Li, Y. (2022). Simulation and spatio-temporal variation characteristics of LULC in the context of urbanization construction and ecological restoration in the yellow river basin. Sustainability 14, 789. doi:10.3390/su14020789
Yang, S., Zhang, L., and Zhu, G. (2023). Effects of transport infrastructures and climate change on ecosystem services in the integrated transport corridor region of the Qinghai-Tibet Plateau. Sci. Total Environ. 885, 163961. doi:10.1016/j.scitotenv.2023.163961
Yang, Y., Wang, Y., Zhou, H., Chen, X., Tao, S., and Kong, Y. (2024). Evaluation of the effect of road barriers on wildlife habitats. Transp. Res. Part Transp. Environ. 131, 104218. doi:10.1016/j.trd.2024.104218
Zhang, J., Hu, R., Cheng, X., Christos, V., Philbin, S. P., Zhao, R., et al. (2023a). Assessing the landscape ecological risk of road construction: the case of the Phnom Penh-Sihanoukville Expressway in Cambodia. Ecol. Indic. 154, 110582. doi:10.1016/j.ecolind.2023.110582
Zhang, J., Zhang, R., Sun, S., and Ballesteros-Pérez, P. (2023b). Influencing factors of vegetation coverage along major railway projects in qinghai-tibet region. SSRN Electron. J. doi:10.2139/ssrn.4368081
Zhang, L., Ren, Z., Chen, B., Gong, P., Xu, B., and Fu, H. (2024). A prolonged artificial nighttime-light dataset of China (1984-2020). Sci. Data 11, 414. doi:10.1038/s41597-024-03223-1
Zhang, W., Qi, J., Wang, G., Zhang, T., and Zhai, H. (2020). Research on the development of urbanization in yangtze river economic Belt based on nighttime light remote sensing data. IGARSS 2020 - 2020 IEEE Int. Geosci. Remote Sens. Symp. 10, 4426–4429. doi:10.1109/igarss39084.2020.9324574
Zhao, L., and Peng, Z.-R. (2012). LandSys: an agent-based Cellular Automata model of land use change developed for transportation analysis. J. Transp. Geogr. 25, 35–49. doi:10.1016/j.jtrangeo.2012.07.006
Zhao, S., Qi, J., Li, D., and Wang, X. (2024). Land use change and its influencing factors along railways in Africa: a case study of the Ethiopian section of the Addis Ababa–Djibouti Railway. J. Geogr. Sci. 34, 1128–1156. doi:10.1007/s11442-024-2242-y
Zheng, F., Huang, J., Feng, Z., and Xiao, C. (2021). Impact of the kunming–bangkok highway on land use changes along the route between Laos and Thailand. Land 10, 991. doi:10.3390/land10090991
Zheng, M., Huang, W., Xu, G., Li, X., and Jiao, L. (2023). Spatial gradients of urban land density and nighttime light intensity in 30 global megacities. Humanit. Soc. Sci. Commun. 10, 404. doi:10.1057/s41599-023-01884-8
Zhou, X., Xiao, L., Lu, X., and Sun, D. (2020). Impact of road transportation development on habitat quality in economically developed areas: a case study of Jiangsu Province, China. Growth Change 51, 852–871. doi:10.1111/grow.12374
Keywords: spatial-temporal analysis, land cover, landscape pattern, Longhai Railway, transportation corridors
Citation: Gu H and Zhang X (2024) Assessment of the spatial-temporal impact of the Longhai Railway transportation corridor on land cover changes and landscape patterns. Front. Environ. Sci. 12:1451498. doi: 10.3389/fenvs.2024.1451498
Received: 19 June 2024; Accepted: 20 September 2024;
Published: 02 October 2024.
Edited by:
Riccardo Buccolieri, University of Salento, ItalyReviewed by:
Martina Zelenakova, Technical University of Košice, SlovakiaYongming Lin, Fujian Agriculture and Forestry University, China
Copyright © 2024 Gu and Zhang. This is an open-access article distributed under the terms of the Creative Commons Attribution License (CC BY). The use, distribution or reproduction in other forums is permitted, provided the original author(s) and the copyright owner(s) are credited and that the original publication in this journal is cited, in accordance with accepted academic practice. No use, distribution or reproduction is permitted which does not comply with these terms.
*Correspondence: Hongliang Gu, dWZvZ2hsQDEyNi5jb20=
 Hongliang Gu
 Xiaolong Zhang
