 Md. Rashedul Haque
 Wahida Ahmed
 Md. Rayhanul Islam Rayhan
 Md. Mostafizur Rahman
- 1Laboratory of Environmental Health and Ecotoxicology, Department of Environmental Sciences, Jahangirnagar University, Dhaka, Bangladesh
- 2Department of Environmental Sciences, Jahangirnagar University, Dhaka, Bangladesh
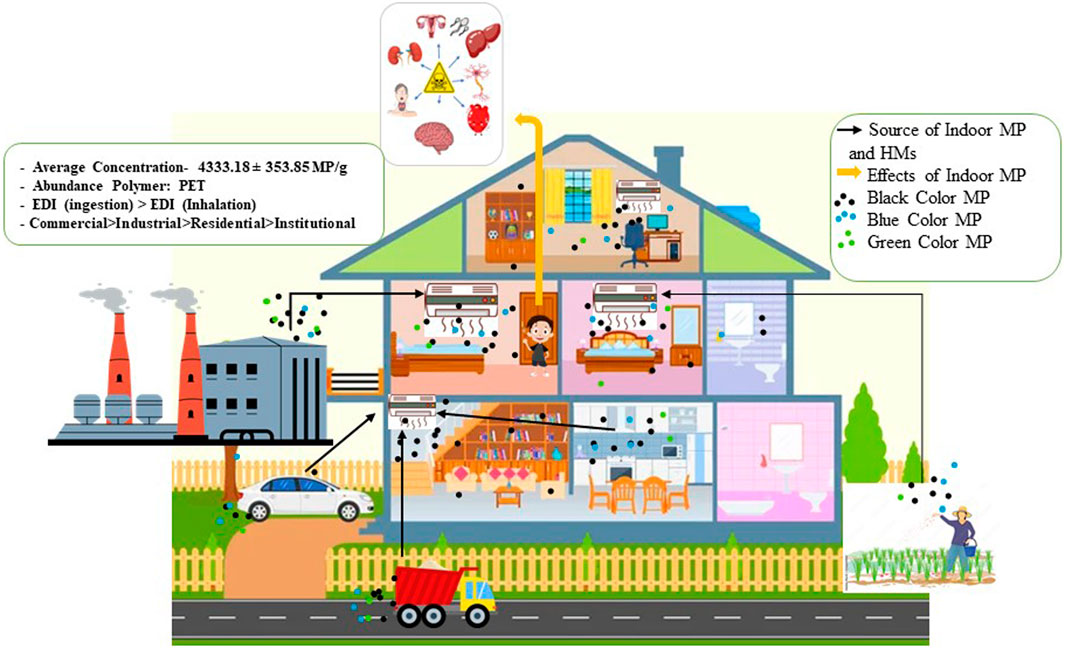
Indoor environments, considered sanctuaries from external pollutants, are increasingly recognized as reservoirs for microplastics (MP). This research employed a comprehensive approach, combining dust sampling from diverse indoor spaces, density separation method, and microscopic observation to quantify and characterize microplastic particles. This is the first initial study worldwide that incorporated MP identification in indoor dust from different indoor environments along with factor analysis, health, and ecological risk assessment. The average MP concentration in the indoor environment was 4333.18 ± 353.85 MP/g. The MP distribution pattern was in institutional areas < residential areas < industrial areas < and commercial areas. Black color, fiber, <0.5 mm size was the dominant color, morphology, and size, respectively, among the detected MP from the studied samples. In addition, the polymer types of the MP were detected by Fourier Transform-Infrared (FT-IR) spectroscopy, and ten types of polymers were detected while PET was in high abundance. Population number, architectural features of habitat, human activities, urban topography, and particle residence time were determined as responsible factors for MP abundance in indoor areas. The estimated daily intake (EDI) value via ingestion was higher than the inhalation of MP. Infants are highly susceptible to MP exposures. According to Polymer Hazard Index (PLI) and Polymer Hazard Index (PHI) values, the exposure risk was in the minor and extreme risk categories.
1 Introduction
In recent years, the pervasive use and disposal of plastic materials have given rise to a burgeoning environmental concern–the ubiquitous presence of microplastics (MP). The history of MP pollution began with the study of Thompson’s team in 2004 at Plymouth University (Thompson et al., 2004). MP is generally the tiny part of plastic components whose size does not exceed 5 mm long (Rana et al., 2023). MP pollution is the product of plastic pollution. The use of plastic started after the innovation of plastic material by Leo Baekland in 1907 (Jahandari, 2023; Wagner, 2011). The durability, weight, flexibility, easy production process, and low-cost features make it popular among the general masses. These features increased the production and use of plastic material. According to estimates, the global production of plastics witnessed a rise from 330 million metric tons in 2016 (Sharma et al., 2023), to 368 million metric tons in 2019 (Prapanchan et al., 2023), 390.7 million tonnes globally in 2021 (Yin et al., 2023), and projected that the quantity will increase to 500 million tonnes by the year 2025 (Sutkar et al., 2023). According to Plastic Pollution 2019, with 30% of the global plastic produced, China is the world leader in plastic production (Jahandari, 2023). The majority of plastics are released into the environment as waste plastic through a variety of channels, with only a small amount being recycled. Since certain types of plastics may withstand years in an aquatic environment without decomposing, they are regarded as non-biodegradable (Sutkar et al., 2023).
Microplastic is found in various color such as white, red, blue, black, transparent, yellow, pink, brown (Afrin et al., 2020; Paray et al., 2024); size such as category 1 was less than 0.5 mm, category 2 was 0.5 mm–1 mm, and category 3 was 1 mm–5 mm (Haque et al., 2023); morphological such as fiber, fragment, granule, film, pellet, foam (Haque et al., 2023; Rana et al., 2023), and chemical composition such as Acrylonitrile butadiene styrene (ABS), Cellulose acetate (CA), Ethylene vinyl acetate (EVA), High-density polyethylene (HDPE), Latex, Nylon, Polypropylene (PP), Polystyrene (PS), Polyurethane (PU), and Polyvinyl chloride (PVC) (Asensio et al., 2009; Tanaka and Takada, 2016). These microplastics are not only present in the environmental components but also in the human food chain and the human body. MP are already detected in human stool (Schwabl et al., 2019; Yan et al., 2022), breast milk, blood (Leslie et al., 2022). This MP from indoor dust may be inhaled by humans and causes several health effects such as respiratory disease, chronic disease, lung problems, and respiratory cell damage (Lee et al., 2023). MP may also be deposited into human food and ingested by humans as food. In this way, it may also disrupt endocrine, cytotoxicity, inflammatory, metabolism effect, neurotoxicity, and immune system dysfunction (MacHado et al., 2018; Leifheit et al., 2021; Leslie et al., 2022; Yuan et al., 2022).
The MP has also previously been detected in different environmental components, such as sediment (Ding et al., 2019; Huang J. et al., 2021; Osorio et al., 2021), water (Alam et al., 2023; Hossain et al., 2024; Kirstein et al., 2021), human food (Hossain et al., 2019; Khan and Setu, 2022; Oliveri Conti et al., 2020) and road dust (Patchaiyappan et al., 2021; Soltani et al., 2022; Su et al., 2020). While the environmental implications of microplastics in outdoor matrices have been extensively studied, the exploration of their presence and potential consequences within indoor environments remains in its infancy. Indoor spaces serve as primary arenas for human activity, where individuals spend a significant portion of their time and are intricate ecosystems that can serve as reservoirs for various pollutants, including microplastics (Van Tran et al., 2020).
Indoor environments, comprising homes, workplaces, and recreational spaces, function as complex ecosystems with distinct characteristics influencing the behavior and fate of pollutants (Hosgood and Lan, 2011). The indoor milieu represents an amalgamation of outdoor emissions, human activities, and the materials used in constructing and furnishing these spaces. Within this intricate web of interactions, indoor dust emerges as a reservoir for diverse particulate matter, including microplastics (Hosgood and Lan, 2011; Van Tran et al., 2020). The composition of indoor dust is complex, featuring a blend of organic and inorganic particles originating from both indoor and outdoor sources. Understanding the presence and dynamics of microplastics within indoor dust is integral to comprehending the full extent of human exposure to these pervasive contaminants.
This study aims to bridge the existing knowledge gap by systematically investigating the occurrence, sources, and characteristics of microplastics in indoor dust. Employing a multidisciplinary approach that combines environmental science, analytical chemistry, and public health perspectives. This research endeavors to elucidate the presence of MP in indoor dust, quantification, characterization, source, and pathways through which microplastics enter indoor spaces with factors and assess their human health risk along with ecological risk. By shedding light on the intricate interplay between microplastics and indoor environments, this study aspires to contribute to a more comprehensive understanding of the implications of microplastic pollution on human wellbeing and environmental sustainability.
2 Methodology
2.1 Study area
This total study was conducted in Dhaka city, which is the capital of Bangladesh (Supplementary Figure S1). It ranks seventh in terms of population density and is the ninth-largest city in the world (Dhakatribune, 2023). It is a developing country, and different types of industries, construction sites, and vehicles are common in this city. This industry, transportation system, and construction sites are the main contributors of pollutants in the urban air (IQAir, 2023). The Air Quality Index of Dhaka city ranked Dhaka as the 2nd most populated city in the world (AQI, 2023).
For this study, Dhaka was broadly divided into four areas: industrial, commercial, institutional, and residential. A total of 40 samples were collected from these major types of areas. Among them, S.1‒S.10 were collected from residential areas, S.11‒S.20 from institutional areas, S.21‒S.30 from commercial areas, and S.31‒S.40 from industrial areas. A detailed description of the study area is given in Supplementary Table S1.
2.2 Sample collection
All samples were collected from air conditioners that were installed on walls. The air conditioners were average in height, at 7–10 feet. Every AC had its filter cleaned a month before the time of the sampling. At first, the AC filter was opened with the help of a scrow driver. Then, the dust sample was collected from this filter by using brushes that were made of jute fiber and wood. Initially, a 5 g dust particle was collected on a piece of aluminum foil paper and placed inside a Pyrex bottle. After proper labeling, all of the samples were taken to the Laboratory of Environmental Health and Ecotoxicology, Department of Environmental Sciences, Jahangirnagar University, Dhaka 1,342, Bangladesh, for further analysis.
2.3 Microplastic extraction
Total dust particles were first sieved with a 2 mm sieve. Then, 1 gm of each sample was taken in a glass beaker, and 15 mL (30% w/v) hydrogen peroxide (H2O2) (Merck, Germany) was added to the beaker to decompose organic matter (Haque et al., 2023). This glass beaker is kept in a dark place for 3 days. After 3 days, it went through the density separation method with NaCl (1.2 g cm−3) (Haque et al., 2023; Rana et al., 2023). At first, 40 mL NaCl (Merck, Germany) solution was added to the glass beaker and shaken with glass rood for 30 min. Then, it is allowed to settle down for 2 days. After that, the supernatant was transferred to a test tube, and then it went through a centrifugation process at 2000 rpm for 10 min to completely separate the fine dust from the supernatant solution (v). Then, the supernatant solution was filtered by using Whatman Microfiber glass filter paper, and the pore size was 0.45 μm. The solid part of the dust sample (that remained in the first phase of the sedimentation process) was again going through a density separation process with ZnCl2 (d = 1.70 g/mL) to ensure higher accuracy. As no salt shows higher efficiency for every type of polymer extraction (Duong et al., 2022; Mattsson et al., 2022; Quinn et al., 2017). For that purpose, at first, 40 mL ZnCl2 (d = 1.70 g/mL) (Merck, Germany) solution was added to the glass beaker and shaken with glass rood for 30 min. Then, it is again allowed to settle down for 2 days. After that, the supernatant was transferred to a test tube, and then it again went through a centrifugation process at 2000 rpm for 10 min to completely separate the fine dust from the supernatant solution (v). But nothing settled down in that process. For that reason, the entire solution was filtered by using Whatman Microfiber glass filter paper, and the pore size was 0.45 μm. After that, two filter papers were preserved for microscopic observation in a glass Petri dish (Haque et al., 2023; Rana et al., 2023). This method was also validated for two types of polymers, PP and PET. The recovery rate was (71–75) %. Details were in Supplementary Table S2.
2.4 Visual inspection by stereo microscope
Microplastic from the filter paper was inspected by a stereo microscope (Leica® EZ4 HD with a Built-in Digital Camera range of magnification 8x-35x) (Haque et al., 2023). Picture of these microplastic particles was also captured by the help of it. Microplastic particle size was measured with ImageJ software (version 2022), as the stereo microscope had no built-in facility for microplastic particle measurement. From the visual identification, microplastic particles were divided according to their morphology, size, and color. According to size, it was divided into three categories. Category 1: less than 0.5 mm, Category 2: 0.5–1 mm, and Category 3: 1–5 mm (Haque et al., 2023). According to color, it is divided into six categories: green, blue, black, red, white, and pink. In the case of morphology, it was divided into five categories: fiber, fragment, pellet, film, and foam. Furthermore, microplastic particles were also counted carefully in that part (Haque et al., 2023; Rana et al., 2023).
2.5 FTIR analysis
Fourier Transformed-Infrared (FT-IR) spectroscopy was conducted to ensure the microplastic type by using wavelength. IR Prestisize-21 was used for that purpose. A representative number of samples (25%) was taken for FTIR analysis (Haque et al., 2023; Parvin et al., 2021). At first, microplastic particles were mixed with KBr salt. Then KBr pellet is created. After that, KBr pellet went through the FTIR analysis method. The wavelength measurement used in that method was 400–4,000 cm−1 (Tanaka and Takada, 2016). Each of the polymer types was confirmed by comparing it with existing literature, Hummel Polymer and Additives, HR Spectra IR Demo, and Aldrich Vapor Phase Sample Library (Haque et al., 2023).
2.6 Microscopic observation by SEM
The scanning electron microscope (SEM), which creates high-resolution images of the materials, is typically utilized for any form of morphological study. For the sample preparation and better resolution of the image, gold coating was used. In this investigation, a high vacuum SEM (EVO18, Carl Zeiss AG, United Kingdom) was used to examine the surface morphology of the detected MP at 1 and × 5 magnification (Haque et al., 2023; Rana et al., 2023).
2.7 Risk assessment of indoor dust MP
Following Equations 1, 2, Estimated daily intake (EDI) (MP/kg bw/day via ingression and inhalation was calculated (Zhu et al., 2022).
Here, Cp is the MP concentration (measured in MP/g) found in indoor dust samples; f indicates the total fraction of exposure in the indoor environment (i.e., hours spent by individuals in the indoor environment in a particular day) that is for infants (0.5–1 years) 0.79, toddlers (1–6 years) 0.79, children (6–21 years) 0.79, and adults (≥21 years) 0.88 (Johnson-Restrepo and Kannan, 2009); IR is the indoor dust intake rate for humans, and that is for infants 0.04, toddlers 0.03, children 0.02, and adults 0.02 g/day (US EPA, 2023); and W stands for the body weight of infants, toddlers, children, and adults 5 kg, 16 kg, 29 kg, and 75 kg, respectively (Saygin et al., 2023).
Here, Cp is the MP concentration (measured in MP/g) found in indoor dust samples; f indicates the total fraction of exposure in the indoor environment (i.e., hours spent by individuals in the indoor environment in a particular day) that is for infants (0.5–1 years) 0.79, toddlers (1–6 years) 0.79, children (6–21 years) 0.79, and adults (≥21 years) 0.88 (Johnson-Restrepo and Kannan, 2009); IR is the indoor dust inhalation rate (m3/day) for humans, and that is 5.4, 10.1, 15.2, and 16 for infants, toddlers, children, and adults, respectively; PEF indicates particulate emission factor (m3/kg) 1.20E + 09 (Saygin et al., 2023); and W stands for the body weight of infants, toddlers, children, and adults 5 kg, 16 kg, 29 kg, and 75 kg, respectively (Saygin et al., 2023).
Both the total concentration of MP and the polymer type of indoor dust MP have been taken into consideration in order to calculate the possible dangers associated with plastic debris in settled house dust (Ranjani et al., 2021). A polymer hazard index (PHI) and integrated pollution load index (PLI) were used to assess the level of plastic debris pollution in settled house dust. The following Equations 3–5 were used to assess the environmental health risk.
Where,
2.8 Statistical and graphical analysis
All of the statistical analysis was conducted in Microsoft Excel 2020. Bar charts with errors, stacked columns, pie charts, and FT-IR data plotting graphs were created with the help of Origin Pro-2022.
2.9 Quality control
The samples were carefully collected using a face mask, hand gloves, and brushes. This brush was made of organic jute fiber and wood. All apparatus used in that process were made of either glass or Pyrex. To avoid any contamination, all of the samples were locked in a Pyrex sampling bottle immediately. After that, samples were carefully analyzed in the Laboratory of Environmental Health and Ecotoxicology, Department of Environmental Sciences, Jahangirnagar University, Dhaka 1,342. The laboratory window was closed during the experiment, and the scientist doing it wore white gloves free of polymers and lab coats. Before using any apparatus, it was rinsed three times with distilled water and dried to ensure it was contamination-free. The distilled water was also the first filtered with a Whatman filter paper (0.45 μm). Three replicas of each sample were analyzed for every sample. Moreover, the blank sample was also examined to ensure the quality of the analysis. Blank filter paper was also observed during microscopic observation to avoid contamination in each case. Only in a few cases was the blank filter paper detected with MP, which was reduced in the quantification process. In addition, FTIR and SEM were also conducted carefully to avoid any kind of contamination. In this process, all of the apparatus was rinsed with ethanol solution to avoid any kind of contamination.
3 Result and discussion
3.1 Abundance of MP in air dust
Indoor dust was highly contaminated with MP (Figure 1). However, it varied from place to place and circumstance to circumstance. The highest amount of MP was found in the commercial area (6,081 ± 396.3 MP/g), and the lowest amount of MP was found in the institutional area (2,069.4 ± 252.7 MP/g). The variation of MP in indoor dust was followed by institutional area (2,069.4 ± 252.7 MP/g), residential area (3,115 ± 345.5 MP/g), industrial area (6,067.3 ± 420.9 MP/g), and commercial area (6,081 ± 396.3 MP/g). The highest and lowest values of MP in residential, institutional, commercial, and industrial indoor dust was 2,355 ± 355 to 4,600 ± 340 MP/g; 1,782 ± 234 to 2,611 ± 254 MP/g; 4,500 ± 345 to 8,400 ± 234 MP/g; 4,521 ± 234 to 8,971 ± 456 MP/g.
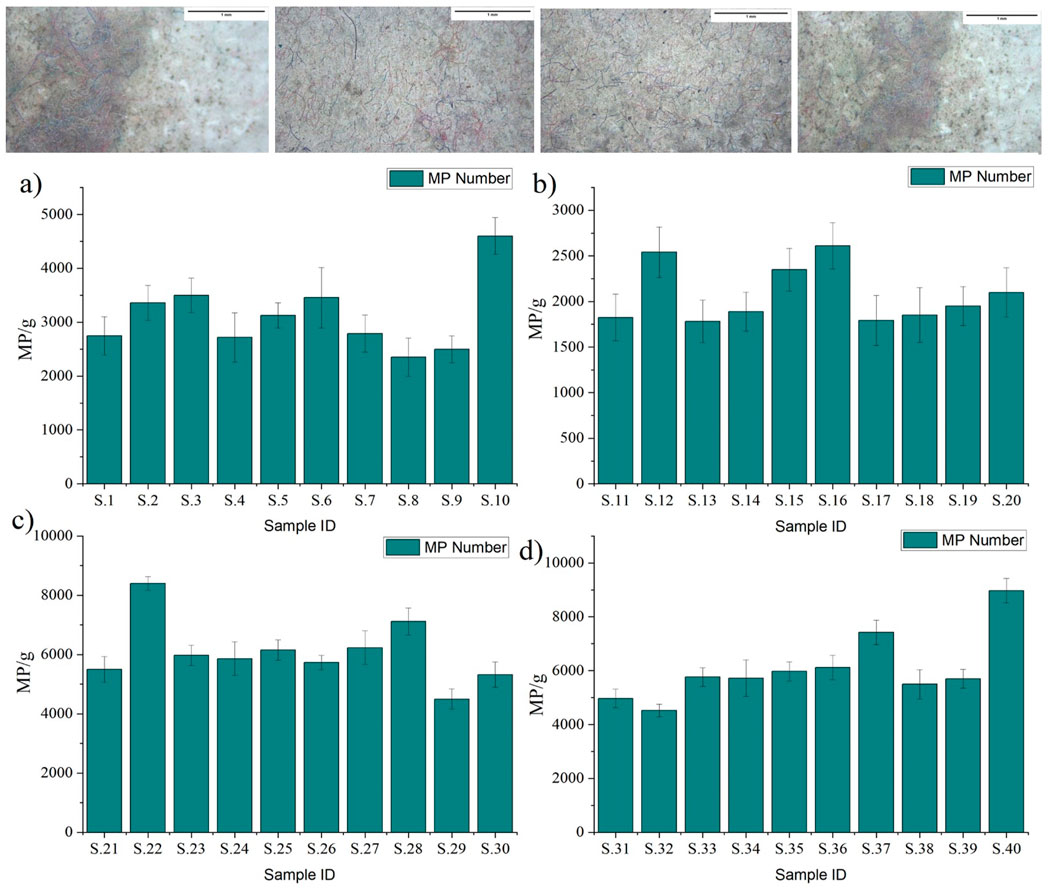
Figure 1. Microplastic (MP) abundance (Mp/g) in indoor dust of Dhaka City. At the top are the MP picture of studied samples. (A) Residential area (B) Institutional area (C) Commercial area (D) Industrial area. Error bar indicates mean ± SD (n = 3).
Indoor air dust acts as a sink of MP in an indoor environment (Peng et al., 2023). However, this is the first study of indoor dust in Bangladesh. Fluctuation in the abundance of indoor dust in Bangladesh may be derived from its locational composition factor. The source of this MP in the air also varies from place to place, which may be another reason for this fluctuation. MP abundance in indoor dust was comparatively lower than in China and Iran (Kashfi et al., 2022); and higher than in Melbourn city (Kashfi et al., 2022). The source of this MP in the atmosphere may have come from different indoor and outdoor sources. Indoor sources may be textile products such as cloths, backpacks, and luggage; architectural features such as habitat composition, habitat structures, decoration, and finishing products used in habitat. Outdoor sources may include industrial emissions, textile products, littering, transportation systems, riverine microplastic, construction sectors, population settings, agricultural sources, sediment, and water sources. According to the World Bank, 39.71% of people live in cities in Bangladesh (Statista, 2022), and according to the United Nations, 55% of the world’s population lives in cities, and this will increase to 68% by 2022 (United Nations, 2023). Further research by the EPA revealed that Americans spend around 90% of their time indoors, with 65% of that time being spent at home (Jahandari, 2023). In this long time, a man can be easily affected by MP by inhalation, ingestion and dermal contact. Inhalation is considered the main pathway for MP entry pathway in the human body (Rahman et al., 2021). MP causes cardiovascular and respiratory disease in the human body depending on the exposure limit and susceptibility of the human body. It can cause oxidative stress that results in lung symptoms such as coughing, sneezing, and dyspnea because of inflammation and injury, as well as exhaustion and lightheadedness because of low blood oxygen levels (Lee et al., 2023). According to a recent study, human respiratory cells’ mitochondrial damage was linked to nanoscale plastics (Lin et al., 2022). In that way, MP poses a threat to our existence.
3.2 Characteristics of MP in indoor air dust
3.2.1 MP characterization according to color
MP in the indoor air dust showed a lot of variety in color composition (Supplementary Figure S2). A total of six colors, red, green, blue, black, brown, and transparent, were found in the indoor dust. Among them, black (45%) color MP was the most abundant MP, and transparent (3%) was the least abundant MP. The distribution pattern of MP color was followed by transparent (3%), brown (5%), green (6%), red (11%), blue (30%), and black (45%).
Color derives in MP from the color of plastic materials. A variety of color plastic is used worldwide. This property of plastic makes it attractive to use. For that reason, varieties of color were also detected in several studies of indoor dust (Kashfi et al., 2022; Nematollahi et al., 2022; Zhu et al., 2022). Zhu et al. (2022) reported similar findings in their study. In another study, Nematollahi et al. (2022) reported white and transparent color was the highest. There is no previous study on the microplastic color effects on the human body. However, several studies reported that several aquatic organisms, such as fishes, crabs, snails, frogs, and soil biotas, are attracted by MP. The bright color of MP misleads them and mistakenly ingest it (Haque et al., 2023; Rana et al., 2023).
3.2.2 MP characterization according to size
MP in the indoor air dust also varies according to their size (Supplementary Figure S3). According to size, it was categorized into three large groups: category 1 was less than 0.5 mm, category 2 was 0.5 mm–1 mm, and category 3 was 1 mm–5 mm. Among them, the category with less than 0.5 mm (75%) in size was the most dominant group, and the 1 mm–5 mm category (7%) was the least dominant. The distribution pattern was followed by less than 0.5 mm (75%), 0.5 mm–1 mm (18%), and 1 mm–5 mm (7%).
MP has been divided into different categories in different studies (Kashfi et al., 2022; Nematollahi et al., 2022; Zhu et al., 2022). Among them, most of the studies reported that the lower size of MP was in higher abundance. The reason behind MP in a large size lower in indoor dust may be that lower size MP has a higher residence time in the atmosphere, and higher size MP is deposited early in the ground due to gravitational forces (Prata et al., 2020). MP effect on the human body may vary according to size. Large-size MP may easily coagulate the respiratory tract and Lungs. Nematollahi et al. (2022) reported that Children are highly affected by large-size MP rather than smaller size. This may be because of their organ properties.
3.2.3 MP characterization according to morphology
MP in indoor air dust was mostly fiber. However, fragment, film, pellet, and foam are also found (Supplementary Figure S4). Among the fiber (82%) was the most dominant group, while film and pellet (1%) were the least dominant group. The distribution pattern was followed by pellet (1%), film (1%), foam (6%), fragment (10%) and fiber (82%).
Fiber and fragment types of MP are mostly detected in several studies of microplastic in dust samples (Abbasi et al., 2022; Chen et al., 2022; Jahandari, 2023). This may be because synthetic fiber can be readily ripped and removed from possible indoor sources, such as clothing, toys, packaging products; and other soft furnishings like curtains, carpets, sofas, and chairs.
3.3 Chemical composition of MP by FTIR
Fourier Transform-Infrared (FT-IR) spectroscopy was used to examine the chemical components of various plastics. A representative number of dust samples was selected for FT-IR analysis. In the representative sample, FT-IR analysis revealed the presence of the following substances: Polyethylene Terephthalate (PET), Cellulose acetate (CA), Ethylene vinyl acetate (EVA), High-density polyethylene (HDPE), Latex, Nylon, Polypropylene (PP), Polystyrene (PS), Polyurethane (PU), and Polyvinyl chloride (PVC) (Figure 2). Among them, PET (38%) was dominated and the distribution pattern followed by PET (38%), Nylon (18%), PP (10.8%), PU (10.5%), EVA (6.5%), PS (5.6%), PVC (5.2%), HDPE (2.9%), CA (2.5%).
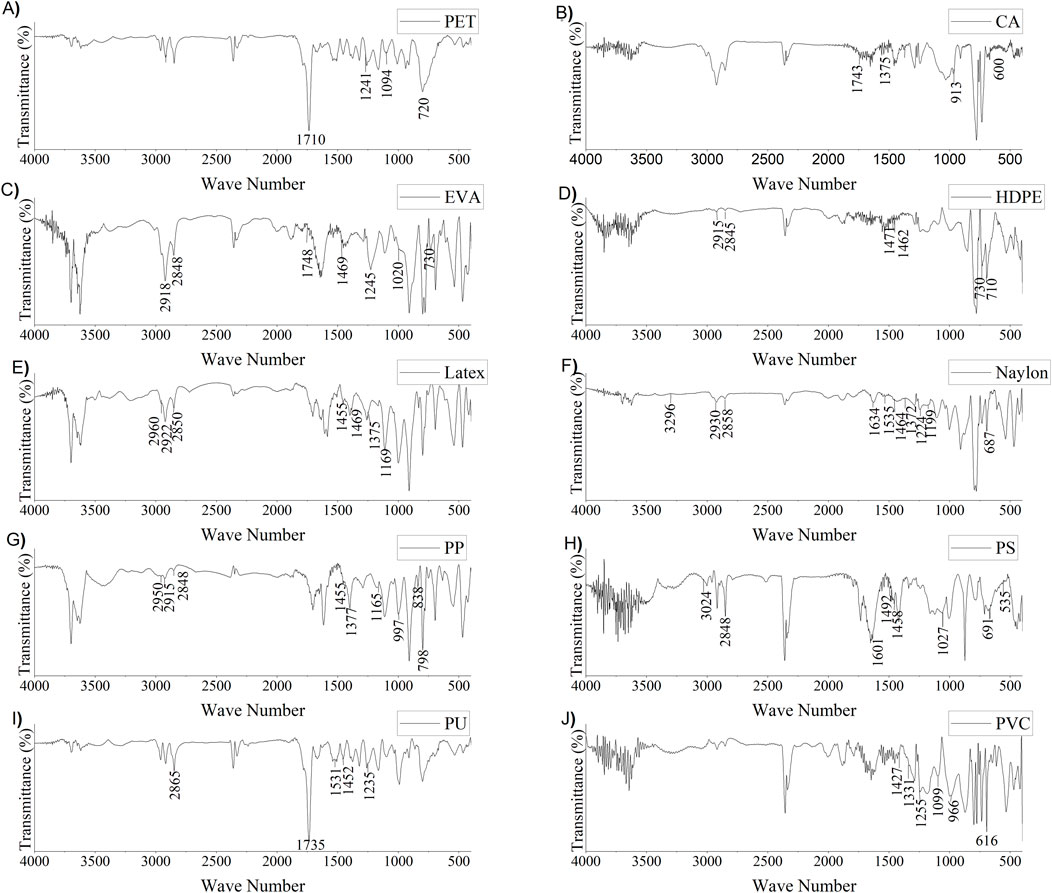
Figure 2. MP polymer characterization with Fourier Transform-Infrared spectroscopy (FTIR). (A) Polyethylene Terephthalate (PET), (B) Cellulose acetate (CA), (C) Ethylene vinyl acetate (EVA), (D) High-density polyethene (HDPE), (E) Latex, (F) Nylon, (G) Polypropylene (PP), (H) Polystyrene (PS), (I) Polyurethane (PU), and (J) Polyvinyl chloride (PVC).
Figure 2 describes the FT-IR spectra of the detected MP in the samples. The distinctive characteristic peaks were found at wavenumbers 1,710, 1,241, 1,094, and 720 cm−1. These wavenumbers demonstrate the existence of C-O stretching, C = O stretching, C = O stretching, and aromatic CH out of the planned band, respectively (Haque et al., 2023). In CA (Figure 2B), four distinct peaks are found at wavenumber 1,743, 1,375, 913, and 600 cm−1. These wavenumbers demonstrate the C = O stretch, CH3 bend, Aromatic ring stretch or CH bend, and O-H bend, respectively (Haque et al., 2023; Verleye et al., 2001). In EVA (Figure 2C), characteristic peaks at wavenumbers 2,918, 2,848, 1,748, 1,469, 1,245, 1,020, and 730 cm−1 were detected. These wavenumbers demonstrate the existence of C-H asymmetric and symmetric stretching vibration, C = O stretching bend, CH2 bend, C (=O) O stretching, C-O stretch, and CH2 rock, respectively (Asensio et al., 2009). In HDPE (Figure 2D), seven distinct peaks at wavenumbers 2,915, 2,845, 1,471, 1,462, 730, and 710 cm−1 were detected. These wavenumbers demonstrate C-H two stretching peaks, CH2 bending, and CH2 two rock peaks, respectively (Asensio et al., 2009). In latex (Figure 2E), seven distinct peaks at wavenumber 2960, 2,922, 2,850, 1,455, 1,469, 1,375, and 1,196 cm−1 were detected. These wavenumbers demonstrate the C-H stretch three peaks, C-C stretch, CH2 bend, and CH3 bend, respectively (Guidelli et al., 2011). In Nylon (Figure 2F), characteristic peaks at wavenumbers 3,296, 2,930, 2,858, 1,634, 1,535, 1,464, 1,372, 1,224, 1,199, and 687 cm−1 were detected. These wavenumbers demonstrate N-H stretching, C-H stretching two peaks, C = O stretching bend, NH bend, CH2 two bends, N-H bends, CH2 bend, and C = O stretching, respectively (Noda et al., 2007; Verleye et al., 2001). In PP (Figure 2G), characteristic peaks at wavenumbers 2,950, 2,915, 2,848, 1,455, 1,377, 1,165, 997, 838, and 798 cm−1 were detected. These wavenumbers demonstrate C-H stretch three peaks, CH2 bend, CH3 bend, CH bend, CH3 rock, and CH2 two rock, respectively (Asensio et al., 2009; Noda et al., 2007). In PS (Figure 2H), characteristic peaks at wavenumbers 3,024, 2,848, 1,601, 1492,1458, 1,027, 691, and 535 cm−1 were detected. These wavenumbers demonstrate the C-H stretching, C-H stretching, aromatic ring stretching, aromatic ring stretching, CH2 bend, aromatic CH bend, and aromatic CH out of the plane two bends, respectively (Asensio et al., 2009; Verleye et al., 2001). In PU (Figure 2I), characteristic peaks at wavenumbers 2,865, 1,735, 1,531, 1,452, and 1,235 cm−1 were detected. These wavenumbers demonstrate C-H stretch, C = O stretch, C-N stretch, CH2 bend, and C (=O) O stretch, respectively (Noda et al., 2007; Verleye et al., 2001). In PVC (Figure 2J), characteristic peaks at wavenumbers 1,427, 1,331, 1,255, 1,099, 966, and 616 cm−1 were detected. These wavenumbers demonstrate CH2 bend, CH two bends, C-C stretch, CH2 rock, and C-Cl stretch, respectively (Noda et al., 2007; Verleye et al., 2001). It is challenging to accurately predict the most frequent polymer groups in MP by investigating only a small number of samples. There is a good chance of finding additional polymers in indoor air dust samples.
Plastic polymers typically have a particular use. Different types of plastic polymers are used for different purposes. Polyvinyl chloride is largely employed as an engineering plastic. Meanwhile, textiles (nylon) are the primary application of PA in indoor spaces (Plastics Europe, 2019). In addition, indoor spaces use plastic products made of these polymers, like synthetic fiber fabrics (made of PET, PP, PU, and PA), plastic containers made of PET, PP, and PE, and packaging materials made of PP and PE (Chen et al., 2022; Peng et al., 2023). All of these are particular sources of this polymer. PET and Nylon are the most abundant polymer types in this study. According to Statista (2021b), the global yearly production of raw PA in 2021 was 7.80 Mt, of which 5.87 Mt was utilized to make nylon fiber. It will be increased to 10.4 Mt by 2027 (Research and Markets, 2023). On the other hand, PET polymer is used extensively in the manufacturing of polyester fiber (60.5 Mt worldwide annually) (Statista, 2021a). It is also used extensively in the production of packaging materials like plastic bags, films, bottles, and food containers (Shankar and Jaiswal, 2024). These packaging materials are potential sources of MPs because they are commonly used indoors.
3.4 Surface morphology of MP by SEM
SEM is frequently used to describe or identify MP because it produces a high-resolution image that amply reveals its surface. A representative number (15%) of MP-like particles were taken to conduct SEM analysis. Figure 3 shows SEM for representative MP. However, it can be quite challenging to recognize the MP surface. The SEM results showed that the MP fiber contained flake, crack, linear fracture, crescentic fracture, protrusions, and scratches (Figure 3) (Haque et al., 2023; Parvin et al., 2021; Wang et al., 2019). Furthermore, the SEM image clearly shows that the MP has adequately changed into nano plastic, which presents another challenge for us. This will undoubtedly have a disastrous impact on human health and the environment.
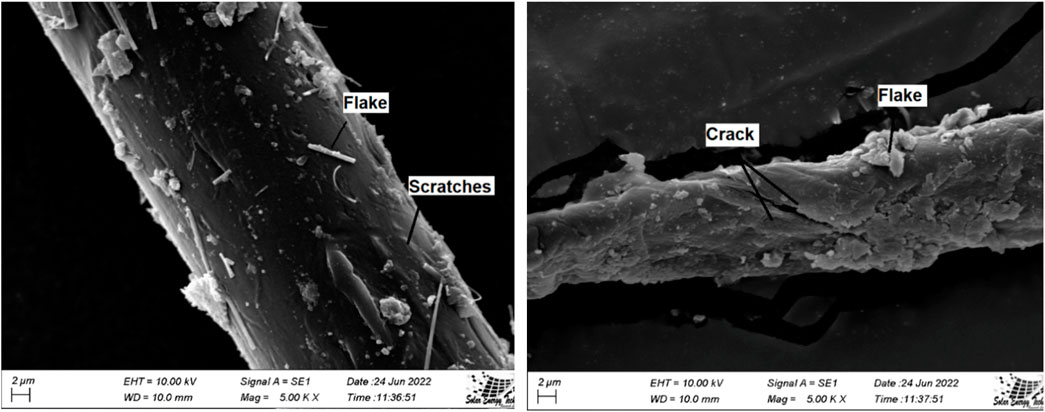
Figure 3. MP surface inspection by Scanning Electron Microscopy (SEM).
3.5 Comparison of indoor dust MP with different study
The average concentration of MP in this study is comparatively lower from China (97.51 times), Iran (20.95 times), and Denmark (1.72 times); while higher from USA (13.5 times) and Paris (5.4t times) (Table 1). The most abundant size and shape are quite similar in all studies. However, a lot of varieties in the chemical properties of MP are observed in this study. This may be due to the geological setting, environmental setting, population behavior, and lifestyle of that area.
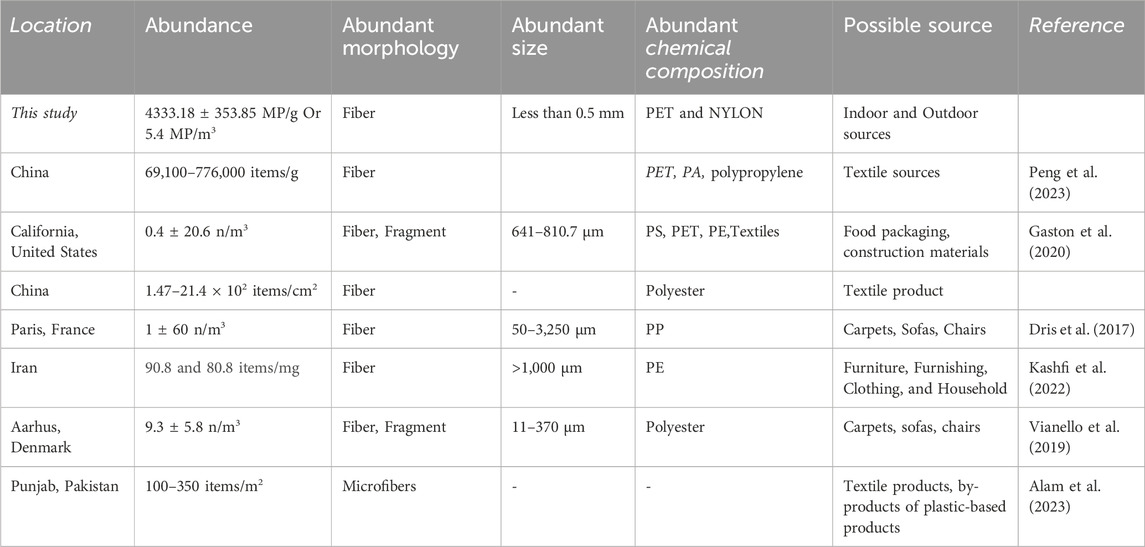
Table 1. Microplastic characteristics of indoor dust in different countries.
3.6 Factors affecting MP distribution in air
MP may alter its abundance due to several factors, such as population number, architectural features of habitat, human activities, urban topography, and particle residence time.
3.6.1 Number of population
MP abundance in the indoor dust was largely varied with the number of people living in those habitats. This study shows a lower amount of MP in indoor dust of residential and institutional areas, while commercial and industrial indoor dust was highly contaminated with MP. The average MP concentration of this area is 2.34 times higher in industrial and commercial areas than in institutional and residential areas. This may be because the number of people staying in institutional and residential areas is much lower than the number of people staying or working in commercial and industrial areas. It may also be because people in populated areas use more plastic products than in lower-density (Wright et al., 2020). Jahandari, (2023) reported in his study the similar things. However, this study also indicated that this situation may also be altered by other factors such as human activity, age, food habitat and other things.
3.6.2 Human activity
Human activity, as determined in this study, is another crucial factor that influences MP abundance in indoor dust. The number of MP in the indoor dust increases its number where human activity increases. In this study, the highest amount of MP was detected in industrial and commercial areas where human activity is higher. On the other hand, lower amounts of MP were detected in residential and institutional areas because of lower human activity. However, the activity in the institutional area was greater than in residential areas, as the number of people involved in the institutional area was greater than in the residential area. But MP was detected in higher amounts in residential areas. This may be because the amount of time spent in residential areas is much higher than in institutional areas. EPA revealed that Americans spend around 90% of their time indoors, with 65% of that time being spent at home (Jahandari, 2023).
3.6.3 Building materials, furniture, and appliances
Building materials, furniture, and appliances gradually increased from residential to industrial and commercial areas. This furniture, building materials, and appliances are potential sources of MP in indoor dust. For that reason, the MP in industrial and commercial areas may be much higher than in residential and commercial areas.
3.6.4 Urban topography
Urban topography means the number of buildings or infrastructure present in certain areas. Generally, industrial and commercial areas are more congested than residential and institutional areas. The buildings are larger than residential areas. Urban canyons, formed by narrow streets or towering buildings, trap pollutants and stop them from diffusing into the atmosphere (Huang Y. et al., 2021; Ollander et al., 2020). That may increase the outdoor source of MP in indoor dust. The dispersion of particles in the air like MP in urban areas can also be influenced by wind modulation, which is defined as variations in wind patterns brought on by urban topography (Ollander et al., 2020; Prata et al., 2020). Actually, wind in urban settings can create turbulence and eddies when it passes over densely populated buildings, which can trap or spread airborne pollutants in various ways (Kurppa et al., 2018; Wright et al., 2020). Furthermore, a downdraft on the leeward side of structures caused by strong winds blowing over high-rise buildings may result in a greater dispersion of air pollutants (Wang and Benson, 2021).
3.6.5 Particles residence time
Particle residence time means the time MP spends in the atmosphere. This may vary with the density and weight of the MP particles. It may also vary from other physical, chemical, and environmental factors. This may be another reason behind the MP abundance difference in different residential, institutional, industrial, and commercial areas (Prata et al., 2020; Wang and Benson, 2021). It also anticipated that density and size are responsible factors behind the MP residence in the atmosphere.
3.7 Indoor MP sources, probable distribution pathway, and human effects
MP in indoor dust generally comes from two types of major sources that are indoor sources and outdoor sources (Figure 4). Indoor sources include textile sources such as cloths; furniture such as sofas, carpets, and chairs; plastic tools and equipment such as packaging products of cosmetics, cosmetics products, toys, and bags; and building materials. Outdoor sources include industrial emissions, transportation sources, mostly vehicle tires, road paints, varnish paints, construction paints, packaging products, littering, population setting, agricultural activity, sediment, and water sources. Apart from these nearby origins, MP can also originate from far-off places, which is particularly significant for isolated regions with minimal human activity. This is because atmospheric transportation enables MP to travel to locations that are far from their source. It is evident that the MP are not a local issue because they have been found in air samples from far-off maritime regions and even glacial territory (Liu et al., 2019).
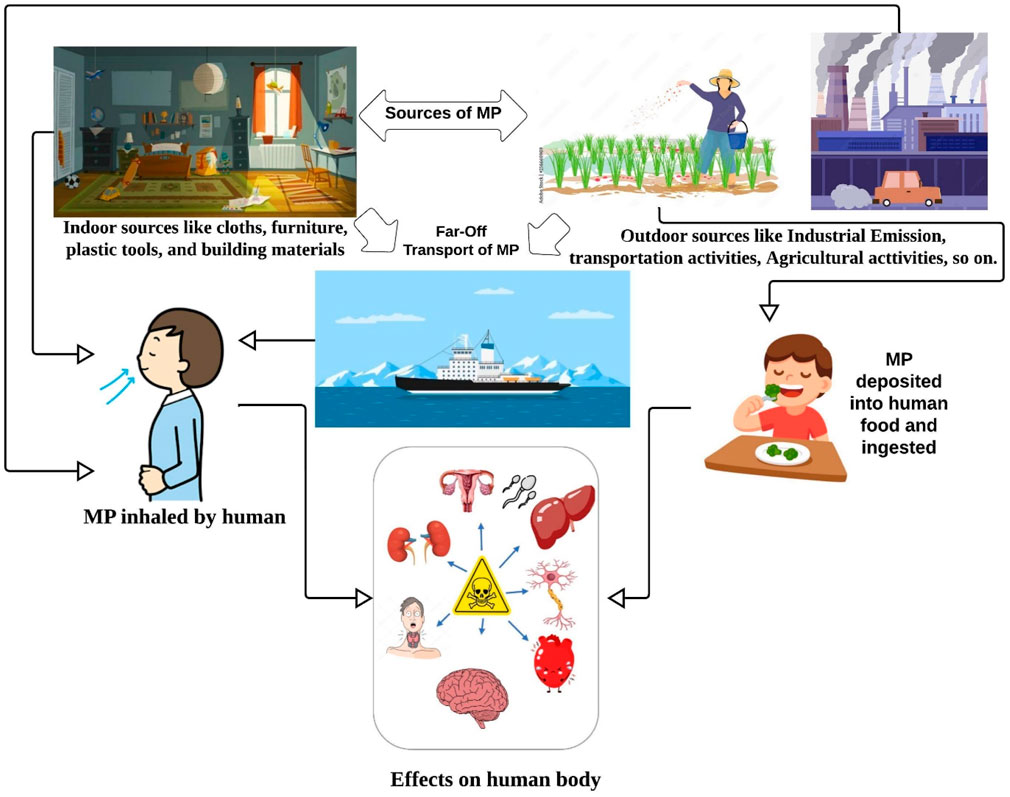
Figure 4. Source and distribution of indoor dust MP along with its health impact.
This MP from indoor dust may be inhaled by humans and causes several health effects such as respiratory disease, chronic disease, lung problems, and respiratory cell damage (Lee et al., 2023). This MP may also be deposited into human food and drinking water. It can easily be ingested by humans as food. In this way, it may also disrupt endocrine, cytotoxicity, inflammatory, metabolism effect, neurotoxicity, and immune system dysfunction (Leifheit et al., 2021; Leslie et al., 2022; MacHado et al., 2018; Picó et al., 2022; Yuan et al., 2022). MP, which is not consumed by humans, may also transfer to another component of the environment such as soil and water. In soil, it hampers the soil pH, soil properties, soil water holding capacity, soil nutrient recycling capacity, soil biota, and groundwater recharge capacity (Rana et al., 2023). In water, it may alter its properties. As MP are harmful to the human body, for that reason, MP containing water are unsuitable for drinking. More than this, MP from water is harmful to water biota such as fish, crab snails, frogs, etc. This aquatic species thought MP as their food and ingested it (Haque et al., 2023). It may also mix with other additives, such as heavy metals and other toxic elements. Furthermore, MP may also degrade into nanoplastic by mechanical abrasion, photochemical degradation, weathering degradation, and biological processes (Song et al., 2017; Wang et al., 2021).
3.8 Health risks from MP inhalation
Inhalation, ingestion, and dermal contact are the major ways to be exposed to a certain pollutant. Among them, inhalation and ingestion are considered potential pathways for MP exposure (Saygin et al., 2023). Moreover, MP has now been detected in human blood (Leslie et al., 2022), breast milk (Caba-Flores et al., 2023), and lungs (Cheng et al., 2022; Ramsperger et al., 2023). In addition, the mean ingestion and inhalation Estimated daily intake (EDI) values of indoor dust microplastic were in the ranges of 27.39 ± 2.24, 6.42 ± 0.52, 2.36 ± 0.19, 1.02 ± 0.08 and 3.08E-6 ± 2.52E-7, 1.80E-6 ± 1.47E-7, 1.49E-6 ± 1.22E-7, 6.78E-7 ± 5.54E-8 mg/kg-bw/day for infants, toddlers, children’s, and adults respectively (Figure 5). Exposure to MP in humans continuously decreases from infants to adults for both ingestion and inhalation. This result is consistent with the result of (Saygin et al., 2023; Zhang et al., 2020a).
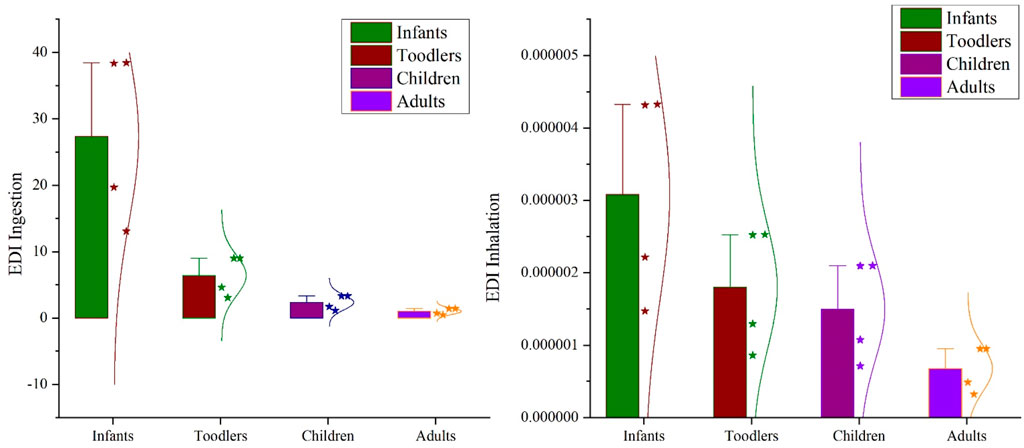
Figure 5. Estimated Daily Intake (EDI) (mg/kg-bw/day) for MP in indoor dust.
According to the Pollution load index (PLI) and Pollution Hazard Index (PHI), it was in the minor and extreme risk category (Supplementary Table S3). This PHI category is similar to a previous study of Turkey (Saygin et al., 2023). Furthermore, depending on the kind of polymer, plastic materials have the ability to sorb and transfer infections and pollutants (such as antibiotics, heavy metals, etc.) (Zhang et al., 2020b). Depending on the kind of polymer, different organic and inorganic additives are included in plastic materials, and these additives can pose additional health concerns to people. For example, the use of plastic additives such as BPA in beverage cans and food packaging causes liver dysfunction, increases insulin resistance, complicates pregnancy, and causes issues with the reproductive system and brain because phthalates used to improve the flexibility and durability of materials can cause reproductive system abnormalities (Muhib et al., 2023; Salthammer, 2022). Furthermore, due to their abilities as biocides, antibacterial agents, lubricants, and fame retardants depending on the type of polymer, metal-based additions are being utilized in plastic materials more and more; nonetheless, the presence of metals might result in a number of health problems (Turner and Filella, 2021).
4 Concluding remarks
In summary, the investigation of microplastics in indoor dust has provided a nuanced understanding of the subtle yet pervasive contamination within the sanctuary of our homes. The diverse array of microplastic polymers identified in indoor dust samples reflects the extensive infiltration of synthetic materials into the very fabric of our living spaces. This study has not only quantified and characterized the presence of microplastics but has also unraveled patterns of distribution influenced by various indoor activities and usage patterns along with EDI and health risks. This research will contribute to the evolving field of microplastic studies by refining methodologies for indoor sampling and analysis. The identified patterns and factors influencing microplastic distribution within homes will provide valuable insights for future research and policy development. In addition, these findings highlight the importance of interdisciplinary collaboration between environmental scientists, public health experts, and policymakers. Integrating this knowledge into broader discussions on indoor air quality and human health is imperative for formulating effective strategies to mitigate microplastic pollution at its source and safeguard the wellbeing of individuals within indoor environments.
Data availability statement
The raw data supporting the conclusions of this article will be made available by the authors, without undue reservation.
Author contributions
MH: Conceptualization, Data curation, Formal Analysis, Investigation, Methodology, Project administration, Software, Supervision, Validation, Visualization, Writing–original draft, Writing–review and editing, Funding acquisition, Resources. WA: Conceptualization, Formal Analysis, Investigation, Methodology, Writing–original draft, Writing–review and editing. MI: Funding acquisition, Project administration, Resources, Software, Writing–review and editing, Writing–original draft. MR: Data curation, Funding acquisition, Project administration, Software, Supervision, Validation, Writing–review and editing, Writing–original draft.
Funding
The author(s) declare that no financial support was received for the research, authorship, and/or publication of this article.
Acknowledgments
The authors acknowledge the Ministry of Education, Grant for Advanced Research (2022-2024) #LS20211617 (BANBEIS).
Conflict of interest
The authors declare that the research was conducted in the absence of any commercial or financial relationships that could be construed as a potential conflict of interest.
Publisher’s note
All claims expressed in this article are solely those of the authors and do not necessarily represent those of their affiliated organizations, or those of the publisher, the editors and the reviewers. Any product that may be evaluated in this article, or claim that may be made by its manufacturer, is not guaranteed or endorsed by the publisher.
Supplementary material
The Supplementary Material for this article can be found online at: https://www.frontiersin.org/articles/10.3389/fenvs.2024.1437866/full#supplementary-material
References
Abbasi, S., Rezaei, M., Ahmadi, F., and Turner, A. (2022). Atmospheric transport of microplastics during a dust storm. Chemosphere 292 (December 2021), 133456. doi:10.1016/j.chemosphere.2021.133456
Afrin, S., Uddin, M. K., and Rahman, M. M. (2020). Microplastics contamination in the soil from urban landfill site, Dhaka, Bangladesh. Heliyon 6 (11), e05572. doi:10.1016/J.HELIYON.2020.E05572
Alam, M. J., Shammi, M., and Tareq, S. M. (2023). Distribution of microplastics in shoreline water and sediment of the ganges river basin to meghna estuary in Bangladesh. Ecotoxicol. Environ. Saf. 266 (September), 115537. doi:10.1016/j.ecoenv.2023.115537
AQI (2023). Dhaka ranks 2nd among cities with most polluted air in the world | Prothom Alo. Available at: https://en.prothomalo.com/environment/pollution/k7yfmhypcm (Accessed September 8, 2023).
Asensio, R., San Andrés Moya, M., De La Roja, J. M., and Gómez, M. (2009). Analytical characterization of polymers used in conservation and restoration by ATR-FTIR spectroscopy. Anal. Bioanal. Chem. 395 (7), 2081–2096. doi:10.1007/S00216-009-3201-2
Caba-Flores, M., Martínez-Valenzuela, C., Cardenas-Tueme, M., and Camacho-Morales, A. (2023). Micro problems with macro consequences: accumulation of persistent organic pollutants and microplastics in human breast milk and in human milk substitutes. Environ. Sci. Pollut. Res. Int. 30, 95139–95154. doi:10.1007/s11356-023-29182-5
Chen, Y., Li, X., Zhang, X., Zhang, Y., Gao, W., Wang, R., et al. (2022). Air conditioner filters become sinks and sources of indoor microplastics fibers. Environ. Pollut. 292 (PB), 118465. doi:10.1016/j.envpol.2021.118465
Cheng, Y., Yang, S., Yin, L., Pu, Y., and Liang, G. (2022). Recent consequences of micro-nanaoplastics (MNPLs) in subcellular/molecular environmental pollution toxicity on human and animals. Ecotoxicol. Environ. Saf. 249, 114385. doi:10.1016/J.ECOENV.2022.114385
Dhakatribune (2023). Dhaka ranks world’s sixth most populous city. Available at: https://www.dhakatribune.com/bangladesh/261898/dhaka-ranks-world%E2%80%99s-sixth-most-populous-city (Accessed September 8, 2023).
Ding, L., Mao, R. F., Guo, X., Yang, X., Zhang, Q., and Yang, C. (2019). Microplastics in surface waters and sediments of the Wei River, in the northwest of China. Sci. Total Environ. 667, 427–434. doi:10.1016/J.SCITOTENV.2019.02.332
Dris, R., Gasperi, J., Mirande, C., Mandin, C., Guerrouache, M., Langlois, V., et al. (2017). A first overview of textile fibers, including microplastics, in indoor and outdoor environments. Environ. Pollut. 221, 453–458. doi:10.1016/J.ENVPOL.2016.12.013
Duong, T. T., Le, P. T., Nhu, T., Nguyen, H., Hoang, T. Q., Ngo, H. M., et al. (2022). Selection of a density separation solution to study microplastics in tropical riverine sediment. Environ. Monit. Assess. 194 (2), 65. doi:10.1007/s10661-021-09664-0
Gaston, E., Woo, M., Steele, C., Sukumaran, S., and Anderson, S. (2020). Microplastics differ between indoor and outdoor air masses: insights from multiple microscopy methodologies. Appl. Spectrosc. 74 (9), 1079–1098. doi:10.1177/0003702820920652
Guidelli, E. J., Ramos, A. P., Zaniquelli, M. E. D., and Baffa, O. (2011). Green synthesis of colloidal silver nanoparticles using natural rubber latex extracted from Hevea brasiliensis. Spectrochimica Acta Part A Mol. Biomol. Spectrosc. 82 (1), 140–145. doi:10.1016/J.SAA.2011.07.024
Haque, M. R., Ali, M. M., Ahmed, W., Siddique, M. A. B., Akbor, M. A., Islam, M. S., et al. (2023). Assessment of microplastics pollution in aquatic species (fish, crab, and snail), water, and sediment from the Buriganga River, Bangladesh: an ecological risk appraisals. Sci. Total Environ. 857, 159344. doi:10.1016/J.SCITOTENV.2022.159344
Hosgood, H. D., and Lan, Q. (2011). Indoor air pollution attributed to solid fuel use for heating and cooking and cancer risk. Encycl. Environ. Health 1-5 (3), 198–200. doi:10.1016/B978-0-444-52272-6.00579-1
Hossain, M. B., Yu, J., Sarker, P. K., Banik, P., Sultana, S., Nur, A. A. U., et al. (2024). Microplastic accumulation, morpho-polymer characterization, and dietary exposure in urban tap water of a developing nation. Front. Sustain. Food Syst. 8, 1397348. doi:10.3389/fsufs.2024.1397348
Hossain, M. S., Sobhan, F., Uddin, M. N., Sharifuzzaman, S. M., Chowdhury, S. R., Sarker, S., et al. (2019). Microplastics in fishes from the northern bay of bengal. Sci. Total Environ. 690, 821–830. doi:10.1016/J.SCITOTENV.2019.07.065
Huang, J., Chen, H., Zheng, Y., Yang, Y., Zhang, Y., and Gao, B. (2021a). Microplastic pollution in soils and groundwater: characteristics, analytical methods and impacts. Chem. Eng. J. 425, 131870. doi:10.1016/J.CEJ.2021.131870
Huang, Y., Lei, C., Liu, C. H., Perez, P., Forehead, H., Kong, S., et al. (2021b). A review of strategies for mitigating roadside air pollution in urban street canyons. Environ. Pollut. 280, 116971. doi:10.1016/J.ENVPOL.2021.116971
IQAir (2023). Dhaka air quality index (AQI) and Bangladesh air pollution. Available at: https://www.iqair.com/bangladesh/dhaka (Accessed September 8, 2023).
Jahandari, A. (2023). Microplastics in the urban atmosphere: sources, occurrences, distribution, and potential health implications. J. Hazard. Mater. Adv. 12 (July), 100346. doi:10.1016/j.hazadv.2023.100346
Johnson-Restrepo, B., and Kannan, K. (2009). An assessment of sources and pathways of human exposure to polybrominated diphenyl ethers in the United States. Chemosphere 76 (4), 542–548. doi:10.1016/J.CHEMOSPHERE.2009.02.068
Kashfi, F. S., Ramavandi, B., Arfaeinia, H., Mohammadi, A., Saeedi, R., De-la-Torre, G. E., et al. (2022). Occurrence and exposure assessment of microplastics in indoor dusts of buildings with different applications in Bushehr and Shiraz cities, Iran. Sci. Total Environ. 829, 154651. doi:10.1016/j.scitotenv.2022.154651
Khan, H. M. S., and Setu, S. (2022). Microplastic ingestion by fishes from jamuna river, Bangladesh. Environ. Nat. Resour. J. 20 (2), 1–11. doi:10.32526/ENNRJ/20/202100164
Kirstein, I. V., Gomiero, A., and Vollertsen, J. (2021). Microplastic pollution in drinking water. Curr. Opin. Toxicol. 28, 70–75. doi:10.1016/J.COTOX.2021.09.003
Kurppa, M., Hellsten, A., Auvinen, M., Raasch, S., Vesala, T., and Järvi, L. (2018). Ventilation and air quality in city blocks using large-eddy simulation—urban planning perspective. Atmosphere 9 (2), 65. doi:10.3390/ATMOS9020065
Lee, Y., Cho, J., Sohn, J., and Kim, C. (2023). Health effects of microplastic exposures: current issues and perspectives in South Korea. Yonsei Med. J. 64 (5), 301–308. doi:10.3349/ymj.2023.0048
Leifheit, E. F., Lehmann, A., and Rillig, M. C. (2021). Potential effects of microplastic on arbuscular mycorrhizal fungi. Front. Plant Sci. 12, 626709. doi:10.3389/fpls.2021.626709
Leslie, H. A., van Velzen, M. J. M., Brandsma, S. H., Vethaak, A. D., Garcia-Vallejo, J. J., and Lamoree, M. H. (2022). Discovery and quantification of plastic particle pollution in human blood. Environ. Int. 163 (December 2021), 107199. doi:10.1016/j.envint.2022.107199
Lin, S., Zhang, H., Wang, C., Su, X. L., Song, Y., Wu, P., et al. (2022). Metabolomics reveal nanoplastic-induced mitochondrial damage in human liver and lung cells. Environ. Sci. Technol. 56 (17), 12483–12493. doi:10.1021/acs.est.2c03980
Liu, K., Wu, T., Wang, X., Song, Z., Zong, C., Wei, N., et al. (2019). Consistent transport of terrestrial microplastics to the ocean through atmosphere. Environ. Sci. and Technol. 53 (18), 10612–10619. doi:10.1021/ACS.EST.9B03427
MacHado, A. A., Lau, C. W., Till, J., Kloas, W., Lehmann, A., Becker, R., et al. (2018). Impacts of microplastics on the soil biophysical environment. Environ. Sci. Technol. 52 (17), 9656–9665. doi:10.1021/acs.est.8b02212
Mattsson, K., Ekstrand, E., Granberg, M., Hassellöv, M., and Magnusson, K. (2022). Comparison of pre-treatment methods and heavy density liquids to optimize microplastic extraction from natural marine sediments. Sci. Rep. 12 (1), 15459–9. doi:10.1038/s41598-022-19623-5
Muhib, M. I., Uddin, M. K., Rahman, M. M., and Malafaia, G. (2023). Occurrence of microplastics in tap and bottled water, and food packaging: a narrative review on current knowledge. Sci. Total Environ. 865, 161274. doi:10.1016/J.SCITOTENV.2022.161274
Nematollahi, M. J., Zarei, F., Keshavarzi, B., Zarei, M., Moore, F., Busquets, R., et al. (2022). Microplastic occurrence in settled indoor dust in schools. Sci. Total Environ. 807, 150984. doi:10.1016/j.scitotenv.2021.150984
Noda, I., Dowrey, A. E., Haynes, J. L., and Marcott, C. (2007). Group frequency assignments for major infrared bands observed in common synthetic polymers. Phys. Prop. Polym. Handb., 395–406. doi:10.1007/978-0-387-69002-5_22
Oliveri Conti, G., Ferrante, M., Banni, M., Favara, C., Nicolosi, I., Cristaldi, A., et al. (2020). Micro- and nano-plastics in edible fruit and vegetables. The first diet risks assessment for the general population. Environ. Res. 187, 109677. doi:10.1016/J.ENVRES.2020.109677
Ollander, S., Bode, F. W., and Baum, M. (2020). “Simulation-based analysis of multipath delay distributions in urban canyons,” in 2020 European Navigation Conference, Dresden, Germany, 23-24 November 2020. doi:10.23919/ENC48637.2020.9317487
Osorio, E. D., Tanchuling, M. A. N., and Diola, M. B. L. D. (2021). Microplastics occurrence in surface waters and sediments in five river mouths of manila bay. Front. Environ. Sci. 9, 719274. doi:10.3389/fenvs.2021.719274
Paray, B. A., Yu, J., Sultana, S., Banik, P., Nur, A. A. U., Haque, M. R., et al. (2024). Contamination, morphological and chemical characterization, and hazard risk analyses of microplastics in drinking water sourced from groundwater in a developing nation. Front. Environ. Sci. 12, 1379311. doi:10.3389/fenvs.2024.1379311
Parvin, F., Jannat, S., and Tareq, S. M. (2021). Abundance, characteristics and variation of microplastics in different freshwater fish species from Bangladesh. Sci. Total Environ. 784, 147137. doi:10.1016/J.SCITOTENV.2021.147137
Patchaiyappan, A., Dowarah, K., Zaki Ahmed, S., Prabakaran, M., Jayakumar, S., Thirunavukkarasu, C., et al. (2021). Prevalence and characteristics of microplastics present in the street dust collected from Chennai metropolitan city, India. Chemosphere 269, 128757. doi:10.1016/J.CHEMOSPHERE.2020.128757
Peng, C., Zhang, X., Li, M., Lu, Y., Liu, C., and Wang, L. (2023). Source apportionment of microplastics in indoor dust: two strategies based on shape and composition. Environ. Pollut. 334, 122178. doi:10.1016/J.ENVPOL.2023.122178
Picó, Y., Manzoor, I., Soursou, V., and Barceló, D. (2022). Microplastics in water, from treatment process to drinking water: analytical methods and potential health effects. Water Emerg. Contam. and Nanoplastics 1 (3), 13. doi:10.20517/WECN.2022.04
Plastics Europe (2019). Plastics - the facts 2019. Available at: https://plasticseurope.org/knowledge-hub/plastics-the-facts-2019/(Accessed November 12, 2023).
Prapanchan, V. N., Kumar, E., Subramani, T., Sathya, U., and Li, P. (2023). A global perspective on microplastic occurrence in sediments and water with a special focus on sources, analytical techniques, health risks, and remediation technologies. Water 15 (11), 1987. doi:10.3390/W15111987
Prata, J. C., da Costa, J. P., Lopes, I., Duarte, A. C., and Rocha-Santos, T. (2020). Environmental exposure to microplastics: an overview on possible human health effects. Sci. Total Environ. 702, 134455. doi:10.1016/J.SCITOTENV.2019.134455
Quinn, B., Murphy, F., and Ewins, C. (2017). Validation of density separation for the rapid recovery of microplastics from sediment. Anal. Methods 9 (9), 1491–1498. doi:10.1039/C6AY02542K
Rahman, A., Sarkar, A., Yadav, O. P., Achari, G., and Slobodnik, J. (2021). Potential human health risks due to environmental exposure to nano- and microplastics and knowledge gaps: a scoping review. Sci. Total Environ. 757, 143872. doi:10.1016/J.SCITOTENV.2020.143872
Ramsperger, A. F. R. M., Bergamaschi, E., Panizzolo, M., Fenoglio, I., Barbero, F., Peters, R., et al. (2023). Nano- and microplastics: a comprehensive review on their exposure routes, translocation, and fate in humans. NanoImpact 29, 100441. doi:10.1016/J.IMPACT.2022.100441
Rana, Md. M., Haque, Md. R., Tasnim, S. S., and Rahman, Md. M. (2023). The potential contribution of microplastic pollution by organic fertilizers in agricultural soils of Bangladesh: quantification, characterization, and risk appraisals. Front. Environ. Sci. 11, 1205603. doi:10.3389/FENVS.2023.1205603
Ranjani, M., Veerasingam, S., Venkatachalapathy, R., Mugilarasan, M., Bagaev, A., Mukhanov, V., et al. (2021). Assessment of potential ecological risk of microplastics in the coastal sediments of India: a meta-analysis. Mar. Pollut. Bull. 163 (November 2020), 111969. doi:10.1016/j.marpolbul.2021.111969
Research and Markets (2023). Nylon: global strategic business report. Available at: https://www.researchandmarkets.com/reports/1227800/nylon_global_strategic_business_report?srsltid=AfmBOoomEe0sVTHAwD9fSK5mI-CK469nUNtN--GRSYB4v3gnOdtS6PZ1. (Accessed November 12, 2023).
Salthammer, T. (2022). Microplastics and their additives in the indoor environment. Angew. Chem. Int. Ed. Engl. 61 (32), e202205713. doi:10.1002/anie.202205713
Saygin, H., Baysal, A., Tarakci, S., and Batuhan, Z. (2023). A characterization and an exposure risk assessment of microplastics in settled house floor dust in Istanbul, Turkey. Environ. Sci. Pollut. Res. 30, 121030–121049. doi:10.1007/s11356-023-30543-3
Schwabl, P., Koppel, S., Konigshofer, P., Bucsics, T., Trauner, M., Reiberger, T., et al. (2019). Detection of various microplastics in human stool: a prospective case series. Ann. Intern. Med. 171 (7), 453–457. doi:10.7326/M19-0618
Shankar, S., and Jaiswal, L. (2024). “Plastic and bioplastic-based nanocomposite materials for food packaging and preservation,” in Food packaging and preservation: antimicrobial materials and technologies. Editors A. K. Jaiswal,, and S. Shankar (Elsevier B.V), 53–65. doi:10.1016/B978-0-323-90044-7.00004-5
Sharma, S., Bhardwaj, A., Thakur, M., and Saini, A. (2023). Understanding microplastic pollution of marine ecosystem: a review. Environ. Sci. Pollut. Res. Int. 31, 41402–41445. doi:10.1007/S11356-023-28314-1
Soltani, N. S., Taylor, M. P., and Wilson, S. P. (2022). International quantification of microplastics in indoor dust: prevalence, exposure and risk assessment. Environ. Pollut. 312, 119957. doi:10.1016/J.ENVPOL.2022.119957
Song, Y. K., Hong, S. H., Jang, M., Han, G. M., Jung, S. W., and Shim, W. J. (2017). Combined effects of UV exposure duration and mechanical abrasion on microplastic fragmentation by polymer type. Environ. Sci. Technol. 51 (8), 4368–4376. doi:10.1021/ACS.EST.6B06155
Statista (2021a). Global polyamide fiber production 2021. Available at: https://www.statista.com/statistics/649908/polyamide-fiber-production-worldwide/(Accessed November 12, 2023).
Statista (2021b). Global textile fiber production by type 2021. Available at: https://www.statista.com/statistics/1250690/global-textile-fiber-production-type//(Accessed November 12, 2023).
Statista (2022). Bangladesh - urbanization 2022. Available at: https://www.statista.com/statistics/455782/urbanization-in-bangladesh/(Accessed October 30, 2023).
Su, L., Nan, B., Craig, N. J., and Pettigrove, V. (2020). Temporal and spatial variations of microplastics in roadside dust from rural and urban Victoria, Australia: implications for diffuse pollution. Chemosphere 252, 126567. doi:10.1016/J.CHEMOSPHERE.2020.126567
Sutkar, P. R., Gadewar, R. D., and Dhulap, V. P. (2023). Recent trends in degradation of microplastics in the environment: a state-of-the-art review. J. Hazard. Mater. Adv. 11 (July), 100343. doi:10.1016/j.hazadv.2023.100343
Tanaka, K., and Takada, H. (2016). Microplastic fragments and microbeads in digestive tracts of planktivorous fish from urban coastal waters. Sci. Rep. 6 (1), 34351–34358. doi:10.1038/srep34351
Thompson, R. C., Olson, Y., Mitchell, R. P., Davis, A., Rowland, S. J., John, A. W. G., et al. (2004). Lost at sea: where is all the plastic? Sci. (New York, N.Y.) 304 (5672), 838. doi:10.1126/SCIENCE.1094559
Turner, A., and Filella, M. (2021). Hazardous metal additives in plastics and their environmental impacts. Environ. Int. 156, 106622. doi:10.1016/J.ENVINT.2021.106622
United Nations (2023). World population prospects - population division. Available at: https://population.un.org/wpp/(Accessed October 30, 2023).
US EPA (2023). Exposure factors handbook chapter 5 (update): soil and dust ingestion | risk assessment portal. Available at: https://cfpub.epa.gov/ncea/risk/recordisplay.cfm?deid=337521 (Accessed October 31, 2023).
Van Tran, V., Park, D., and Lee, Y. C. (2020). Indoor air pollution, related human diseases, and recent trends in the control and improvement of indoor air quality. Int. J. Environ. Res. Public Health 17 (8), 2927. doi:10.3390/IJERPH17082927
Verleye, G. A. L., Roeges, N. P. G., and De Moor, M. O. (2001). Easy identification of plastics and rubbers. Shrewsbury, United Kingdom: Rapra Technology, 160.
Vianello, A., Jensen, R. L., Liu, L., and Vollertsen, J. (2019). Simulating human exposure to indoor airborne microplastics using a Breathing Thermal Manikin. Sci. Rep. 9 (1), 8670. doi:10.1038/s41598-019-45054-w
Wagner, B. E. (2011). Leo baekeland’s legacy - 100 years of plastics. ACS Symp. Ser. 1080, 31–67. doi:10.1021/BK-2011-1080.CH004
Wang, J., Wang, M., Ru, S., and Liu, X. (2019). High levels of microplastic pollution in the sediments and benthic organisms of the South Yellow Sea, China. Sci. Total Environ. 651, 1661–1669. doi:10.1016/J.SCITOTENV.2018.10.007
Wang, L., Wu, W. M., Bolan, N. S., Tsang, D. C. W., Li, Y., Qin, M., et al. (2021). Environmental fate, toxicity and risk management strategies of nanoplastics in the environment: current status and future perspectives. J. Hazard. Mater. 401, 123415. doi:10.1016/J.JHAZMAT.2020.123415
Wang, Y., and Benson, M. J. (2021). Large-eddy simulation of turbulent flows over an urban building array with the ABLE-LBM and comparison with 3D MRI observed data sets. Environ. Fluid Mech. 21 (2), 287–304. doi:10.1007/s10652-020-09770-6
Wright, S. L., Ulke, J., Font, A., Chan, K. L. A., and Kelly, F. J. (2020). Atmospheric microplastic deposition in an urban environment and an evaluation of transport. Environ. Int. 136 (December 2019), 105411. doi:10.1016/j.envint.2019.105411
Yan, Z., Liu, Y., Zhang, T., Zhang, F., Ren, H., and Zhang, Y. (2022). Analysis of microplastics in human feces reveals a correlation between fecal microplastics and inflammatory bowel disease status. Environ. Sci. Technol. 56 (1), 414–421. doi:10.1021/acs.est.1c03924
Yin, L., Du, L., Wen, X., Huang, D., Xiao, R., Wang, Z., et al. (2023). Occurrence and effects of microplastics in lake ecosystems: particular focus on migration in water and food chains. Rev. Environ. Contam. Toxicol. 261 (1), 11–22. doi:10.1007/S44169-023-00036-Y
Yuan, Z., Nag, R., and Cummins, E. (2022). Human health concerns regarding microplastics in the aquatic environment - from marine to food systems. Sci. Total Environ. 823, 153730. doi:10.1016/J.SCITOTENV.2022.153730
Zhang, J., Wang, L., and Kannan, K. (2020). Microplastics in house dust from 12 countries and associated human exposure. Environ. Int. 134, 105314. doi:10.1016/j.envint.2019.105314
Zhang, Q., Zhao, Y., Du, F., Cai, H., Wang, G., and Shi, H. (2020). Microplastic fallout in different indoor environments. Environ. Sci. and Technol. 54 (11), 6530–6539. doi:10.1021/ACS.EST.0C00087
Keywords: microplastics (MP), indoor dust, estimated daily intake (EDI), health risk, ecological risk
Citation: Haque MR, Ahmed W, Islam Rayhan MR and Rahman MM (2024) Microplastics in indoor dust at Dhaka city: unveiling the unseen contaminants within our homes. Front. Environ. Sci. 12:1437866. doi: 10.3389/fenvs.2024.1437866
Received: 24 May 2024; Accepted: 29 August 2024;
Published: 13 September 2024.
Edited by:
Yasser Morera-Gómez, University of Navarra, SpainReviewed by:
Adrián López-Rosales, University of A Coruña, SpainMengjing Wang, University of California, San Francisco, United States
Copyright © 2024 Haque, Ahmed, Islam Rayhan and Rahman. This is an open-access article distributed under the terms of the Creative Commons Attribution License (CC BY). The use, distribution or reproduction in other forums is permitted, provided the original author(s) and the copyright owner(s) are credited and that the original publication in this journal is cited, in accordance with accepted academic practice. No use, distribution or reproduction is permitted which does not comply with these terms.
*Correspondence: Md. Mostafizur Rahman, cmFobWFubW1AanVuaXYuZWR1