 Favianna Cubello
 Benjamin Karls1
 Samuel Beal
 Katerina Dontsova
- 1Department of Environmental Science, The University of Arizona, Tucson, AZ, United States
- 2U.S. Army Engineer Research and Development Center, Cold Regions Research and Engineering Library, Hanover, NH, United States
- 3Southwest Watershed Research Center, United States Department of Agriculture-Agricultural Research Service, Tucson, AZ, United States
- 4Biosphere 2, The University of Arizona, Oracle, Tucson, AZ, United States
The partial detonation of munitions used in military exercises leaves behind energetic particles on the surface of soil. Energetic particles deposited by incomplete detonations can then dissolve and be transported by overland flow and potentially contaminate ground and surface waters. The objective of this study was to evaluate the mechanisms of transport of Composition B, a formulation that includes TNT (2,4,6-trinitrotoluene) and RDX (hexahydro-1,3,5-trinitro-1,3,5-triazine) during overland flow. The transport of Composition B was examined using a rill flume with three flow rates (165-, 265-, and 300-mL min−1) and four energetic particle sizes (4.75–9.51 mm, 2.83–4.75 mm, 2–2.83 mm, and <2 mm). After each erosion simulation, energetic particles remaining on the soil surface were measured along with energetics dissolved in runoff, in suspended sediment, and in infiltration. Smaller particle sizes led to greater transport in both solution and sediment. The properties of the energetic compounds also influenced transport. More TNT was transported in runoff than RDX, likely due to TNT’s higher solubility and dissolution rates, however, overall, dissolved energetics in runoff and infiltration accounted for very little of the total transport. Most transport of Composition B was the result of the physical movement of energetic particles and flakes by erosion forces. This study’s results allow for improved prediction of Composition B transport during overland flow.
1 Introduction
Commonly used in hand grenades, land mines, rockets, and artillery shells, Composition B is a military explosive formulation that has been in use since World War I. It is comprised of a 40:60 mixture of TNT (2,4,6-trinitrotoluene) and RDX (hexahydro-1,3,5-trinitro-1,3,5-triazine). Occasional malfunctioning of munitions can result in the partial detonation of Composition B and the dispersal of unreacted energetic particles on the surface of soil. These incomplete or low-order detonations have been found to deposit as particles between 4% and 72% of the initial explosive mass contained in munitions (Bigl et al., 2022; Taylor et al., 2006). The soil and groundwater at military firing ranges can become contaminated by these particles and their dissolved constituents (Clausen et al., 2004).
The compounds that make up Composition B, RDX and TNT, are known to have adverse health effects in humans when inhaled or consumed (Agency for Toxic Substances and Disease Registry, 2012; ATSDR, 2014; Woody et al., 1986). The general population can be exposed to energetics through contamination of drinking water. Terrestrial wildlife, soil organisms, and aquatic organisms may also suffer negative effects due to exposure to RDX and TNT (Lotufo, 2012; Williams et al., 2015). These environmental impacts stress the importance of monitoring and studying Composition B contamination.
Due to its ability to carry sediment and dissolved contaminants (Cadwalader et al., 2011; Deng et al., 2019; Favaretto et al., 2006; Sharpley and Kleinman, 2003), overland flow is investigated as a potential mechanism for the transport of Composition B. Overland flow occurs when precipitation exceeds the infiltration capacity of the soil (Steenhuis et al., 2005). It is common in places with high rainfall amount and intensity, areas with little vegetation, and arid regions that can have rare but intense rainstorms (Kampf and Mirus, 2013). The rainwater runoff can then cause soil erosion (Zhang et al., 2002). Soil erosion process includes detachment (the separation of particles from the soil matrix by overland flow or raindrops), transport, and deposition (Hairsine and Rose, 1991; Nearing et al., 1991; Zhang et al., 2003).
This study examines rill erosion as a potential mechanism of Composition B transport. Transport of Composition B has been reported in vegetated and unvegetated rills (Price et al., 2011). Rill erosion occurs when concentrated flow detaches soil particles and forms channels (Di Stefano et al., 2019). Sediment transport in eroding rills can be predicted based on stream power (Nearing et al., 1997). Stream power (ω) is defined using the following equation:
where ρw is the density of water, g is the acceleration due to gravity, S is slope, and q is overland flow discharge.
It has been shown that overland flow can also pick up and carry energetic residue particles (Polyakov et al., 2023; Karls et al., 2023; Cubello et al., 2023). In addition, the sediment carried in overland flow has the potential to adsorb and transport energetic compounds to surface waters. Energetics may also dissolve in rainwater and be transported in solution. When fully dissolved, solute transport in runoff can be predicted by average flow velocity (Guo et al., 2018). The goal of this study was to examine the factors that influence the transport of Composition B particles in overland flow in rills to better understand their fate in the environment. To do this, we designed a set of rill erosion experiments using various water flow rates and multiple energetic particle sizes.
2 Materials and methods
2.1 Composition B particles
Composition B particles in four size ranges were used in these experiments (4.75–9.51 mm, 2.83–4.75 mm, 2–2.83 mm, and <2 mm (Figure 1). The energetic materials were provided by the Environmental Security Technology Certification Program (ESTCP) project ER18-5105. Particles were collected from low order detonation tests conducted on smooth ice surfaces following procedure described in Bigl et al. (2022). They were then separated by size by dry sieving. Nonenergetic impurities, such as metal fragments and vegetation, were removed from the fractions >2 mm. This was not possible for particles less than 2 mm in size, resulting in lower purity of collected residues. Chemical analysis also revealed that <2 mm particles were the purest (69%–99%) when collected within 10 m of the detonation (Bigl et al., 2022). The <2 mm particles used in our experiments were found to contain 62% RDX and 31% TNT by weight (Bigl et al., 2022), resulting in 0.5 ratio of TNT to RDX. For all other particle sizes TNT to RDX ratio was 0.66, same as in the original formulation.

Figure 1. Image of Composition B particle sizes <2 mm (extra small), 2.00–2.83 mm (small), 2.83–4.75 mm (medium), 4.75–9.51 mm (large), from left to right.
2.2 Soil
The soil used in this experiment, Florence loam, was collected from Arizona National Guard Florence Military Reservation and is classified as Laveen loam (Coarse-loamy, mixed, superactive, hyperthermic Typic Haplocalcid). The soil was collected from the top 0.15 m layer, air dried, mixed, and sieved to 4.75 mm. The soil was found to be sandy clay loam with 29.0% clay, 14.2% silt, and 56.8% sand. The soil had a pH of 8.3, an electrical conductivity of 1:1 suspension of soil in water of 252 μS cm−1, a cation exchange capacity of 13.7 cmolc kg−1, and an organic carbon content of 0.3%. Soil characterization is described in greater detail in Cubello et al. (2023).
2.3 Experimental procedure
The stainless-steel rill flume used in these experiments was 16 cm deep, 50 cm long, and 6 cm wide, with a 10 cm long, 2.2 cm deep V-shaped outlet and a 30 cm long, 2.2 cm deep V-shaped inlet, for a total 90 cm length as shown in Figure 2. A 50 cm long rectangular middle section had two drainage outlets at the bottom that connected via plastic tubes to a glass flask filled with water to control the water table. The flume’s design was based on flumes used in Nearing et al. (1997) and Nouwakpo et al. (2010). The rectangular section of the flume was packed with 10 cm of silica sand, forming the bottom layer of the rill. This was followed by 6 cm of soil, to the top of the channel. The soil surface was formed into a V-shape to match the inlet and outlet, providing a seamless flow transition. Nylon mesh was used to separate the soil from the sand and on the bottom to prevent the sand from entering the drainage outlets. To ensure consistent bulk density, soil was compacted in three layers, two layers of 660 g each and one layer of 330 g. Final packed bulk density was 0.92 g cm−1. Soil was gradually saturated from the bottom to the surface for about 20 min, and the water table was lowered to 5 cm below the soil surface before the start of the experiment.
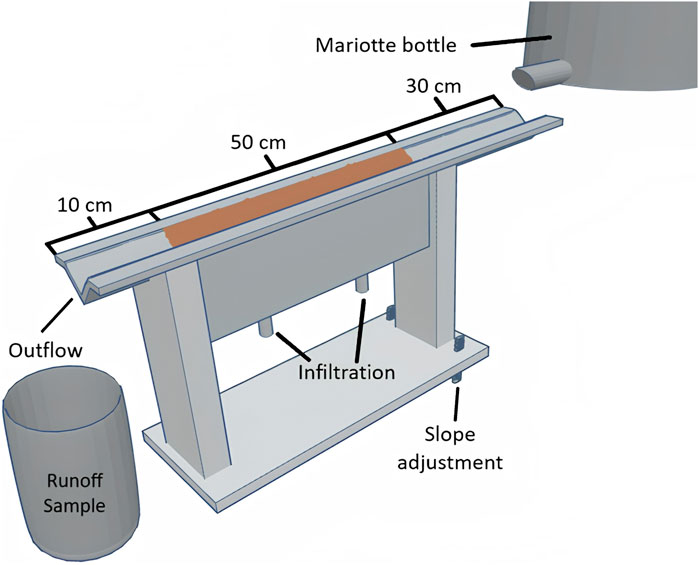
Figure 2. Diagram of rill flume.
Once the soil was saturated, the flume was set at 5% slope (An average value observed for alluvial fans in arid regions (Anstey, 1965)) and a natural rill was created in the soil using reverse osmosis (RO) water with a flow rate of 400 mL min-1 for 5 min. Reverse osmosis (RO) water was used to simulate natural rain water as the RO process removes dissolved solids. Approximately 0.152 g of Composition B particles were placed on the soil surface. This amount was chosen to be consistent with the amount of Composition B measured during low-order detonations in the field. There deposition ranged from 0.0307 ± 0.0046 g m−2 at the edge of the plume to 7.459 ± 5.123 g m−2 at the center of detonation, averaging at 1.143 ± 0.643 g m−2 (Bigl et al., 2022). Each trial utilized one of four studied particle sizes (large: 4.75–9.51 mm, medium: 2.83–4.75 mm, small: 2–2.83 mm, and extra-small: <2 mm). The average number of particles placed on the rill surface was 12.6 ± 2.3, 4.3 ± 0.9, and 1.3 ± 0.7 for small, medium and large particles respectively. Extra small particles were too small to count. The calculated average mass of individual particles of each size category was 12.5 ± 2.1, 38.1 ± 0.94, and 178.2 ± 90.1 mg for small, medium, and large particles, respectively.
After particles were placed, RO water was applied at 50 mL min−1 for 5 min to simulate lower rainfall intensity that would occur at the beginning of precipitation event (a pre-wet phase) and the runoff was collected in a jar at the outlet of the flume. After that, rill erosion was simulated by applying water to the rill for 15 min at either 165, 265 or 300 mL min−1. Flow rates were chosen based on preliminary trials (Karls et al., 2023). The flow rate was controlled using a Mariotte bottle. All flow rate and particle size treatment combinations were replicated three times for a total of 36 runs.
During each run, ten runoff samples were collected over a period of 15 min. The first five samples were collected every minute and the last five were collected every 2 min. Each sample was weighed to determine total runoff. Infiltration samples were taken at the same time as runoff samples, weighed, and combined into one container. The jars containing runoff were centrifuged for 20 min at centrifugal force of 3,400 g. The supernatant was subsampled, filtered through 0.45 µm PVDF syringe filters, and analyzed for energetic compounds using high-performance liquid chromatography (HPLC). All sediment from each jar, which included energetic particles and soil, was then transferred into 30-mL clear borosilicate glass Kimble vials. To determine the amount of energetics in the sediment, the samples underwent acetonitrile extraction. 5 mL of acetonitrile were added to the Kimble vial for every 1 g of sediment. The vials were then shaken at 120 rpm overnight at room temperature. The next day they were centrifuged at 3,400 g for 20 min. The acetonitrile was decanted, filtered through 0.45 µm PVDF syringe filters, and analyzed by HPLC. The extraction protocol followed EPA method 8330b (U.S. Environmental Protection Agency, 2006). One set of sediment extractions failed so values for treatments with extra small particles at 165 mL min−1 and 265 mL min−1 flow rates and small particles at 265 mL min−1 and 300 mL min−1 had only two replicates.
After the end of the run, soil remaining in the rill flume was collected in three layers, from 0–2 cm, 2–4 cm, and 4–6 cm depths. The soil layers were collected using a custom-made tool with an inclined blade to remove soil uniformly at the desired depth. The surface layer, which contained remaining energetic particles, was air dried, weighed and ground as detailed in EPA method 8330b (U.S. Environmental Protection Agency, 2006). This ensured subsamples taken to find Composition B remaining on the soil surface were uniform. The middle and lowest soil layers were collected while wet, thoroughly mixed and subsampled without grinding prior to analysis. Lower soil layers were not ground as energetic particles were not likely to translocate to lower layers from the surface. To determine the water content of the wet soil layers, subsamples were air dried and weighed. Soil layer subsamples were collected and extracted according to EPA method 8330b (U.S. Environmental Protection Agency, 1986). Pore water remaining in the sand layer of the rill was drained, combined with infiltration samples, filtered, and analyzed by HPLC.
The solution samples and acetonitrile extracts were analyzed using a Dionex Ultimate 3,000 high performance liquid chromatography equipped with a diode array detector (ThermoFisher, MA). RDX and TNT were quantified using a Thermo Scientific Acclaim reverse phase E2 column with an isocratic 43:57 methanol: water mobile phase and 1 mL min−1 flow rate for 30 min. RDX and TNT were analyzed at 254 nm wavelength and the oven temperature was set to 34°C. The injection volume was 20 µL. Retention times were approximately 12 min and 22 min for RDX and TNT, respectively. The minimum detection limit in water was 1.19 mg L−1 for RDX and 0.46 mg L−1 for TNT. Minium detection limits in acetonitrile were 0.83 mg L−1 for RDX and 1.14 mg L−1 for TNT.
3 Results and discussion
3.1 Transport of energetics in solution
Transport of RDX and TNT in runoff was low. For extra small particles, at all flow rates, the most transport occurred during the pre-wet phase as seen at 0 min in Figure 3 and decreased during the first 2 min of the experiment followed by a low but non-zero steady state transport for the remainder of the experiment. At all flow rates, extra small particles experienced the most transport in the runoff solution. This is consistent with the findings of a similar experiment assessing a different energetic formulation, IMX-104. Karls et al. (2023) found the smallest particle size of energetics experienced the most transport in solution. Additionally, experiments assessing the transport of energetics during rainfall simulations found the smallest particle size yielded the highest concentrations in solution (Cubello et al., 2023; Polyakov et al., 2023).
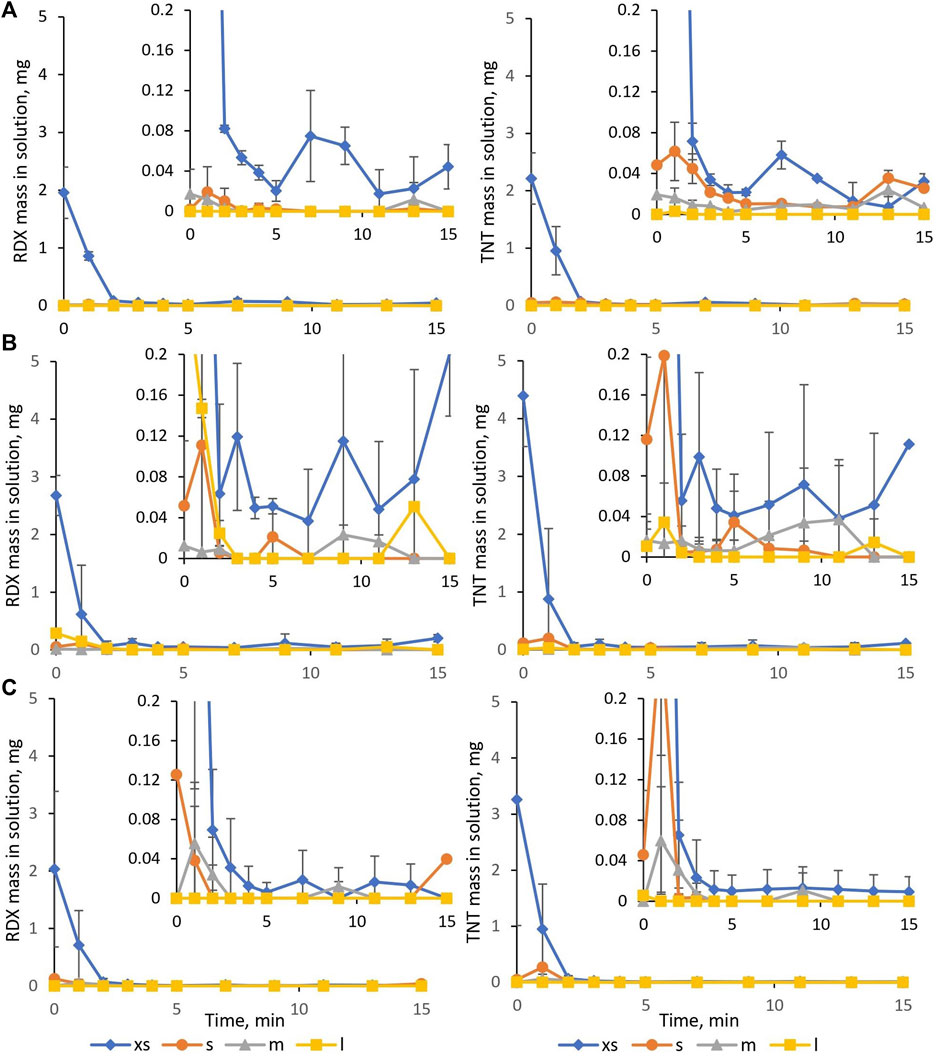
Figure 3. Mass of RDX (Left) and TNT (Right) in runoff solution for (A) 165-, (B) 265-, and (C) 300-mL min−1. Error bars equal standard error of the mean (n = 3). Inset plots present the same data rescaled to clearly show near zero values.
There was no statistically significant relationship between total transport of energetics in solution and flow rate. Despite Composition B containing more RDX than TNT, a greater mass of TNT was transported in solution than RDX. Two studies examining Composition B transport under simulated rainfall also found higher concentrations of TNT than RDX in runoff solution (Cubello et al., 2023; Price et al., 2011). This can be attributed to TNT having a higher solubility and dissolution rate than RDX. At 25°C, the solubility of RDX is approximately 60 mgL−1 while the solubility of TNT is approximately 100 mg L−1 (Brannon and Pennington, 2002). Additionally, compared to RDX, TNT has greater dissolution rates (Lynch et al., 2002). For extra small particles, a similar mass of RDX was transported dissolved in runoff across all the flow rates indicating that dissolution and transport were limited by dissolution rate rather than solubility for RDX, which would result in larger transport with the larger volumes of water associated with higher flow rates. However, for TNT, the amount transported in solution increased with flow rate from 165 mL min−1–265 mL min−1 (Table 1; Figure 3).
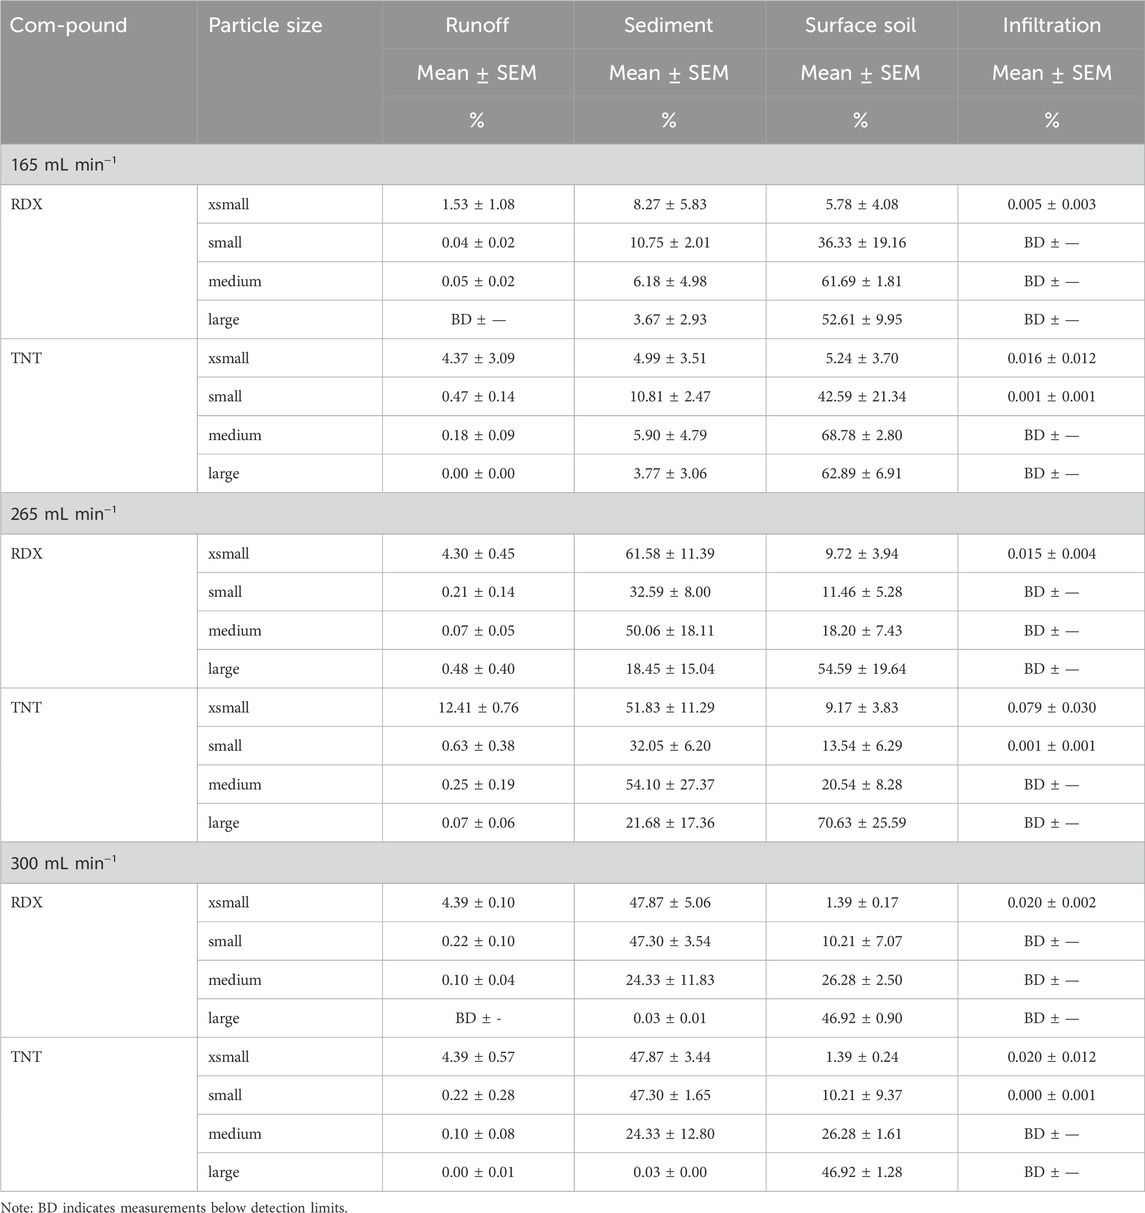
Table 1. Percentage of RDX and TNT originally placed on surface soil recovered dissolved in runoff, in eroded sediment, in surface soil, and in infiltration and subsoil (mean ± standard error of the mean).
3.2 Transport of energetics with sediment
Figure 4 shows the mass of RDX and TNT recovered from sediment over time for the erosion simulations. There was significantly more TNT and RDX moving with sediment than dissolved in runoff for all treatments (Table 1). Stochastic single particle movement or movement of particle flakes/pieces can be observed by the irregular spikes in mass recovered (Figure 4). For medium and large particles, flakes, rather than whole particles, moved with sediment because the mass recovered in suspended sediment at each time point was less than the mass of the original particles placed on the soil. Medium particles were approximately 38 mg each and large particles were about 178 mg (about three medium or one large particle were originally placed on the soil surface). Fuller et al. (2015) observed flakes breaking off from 0.25 cm diameter Composition B particles during weathering under artificial precipitation.
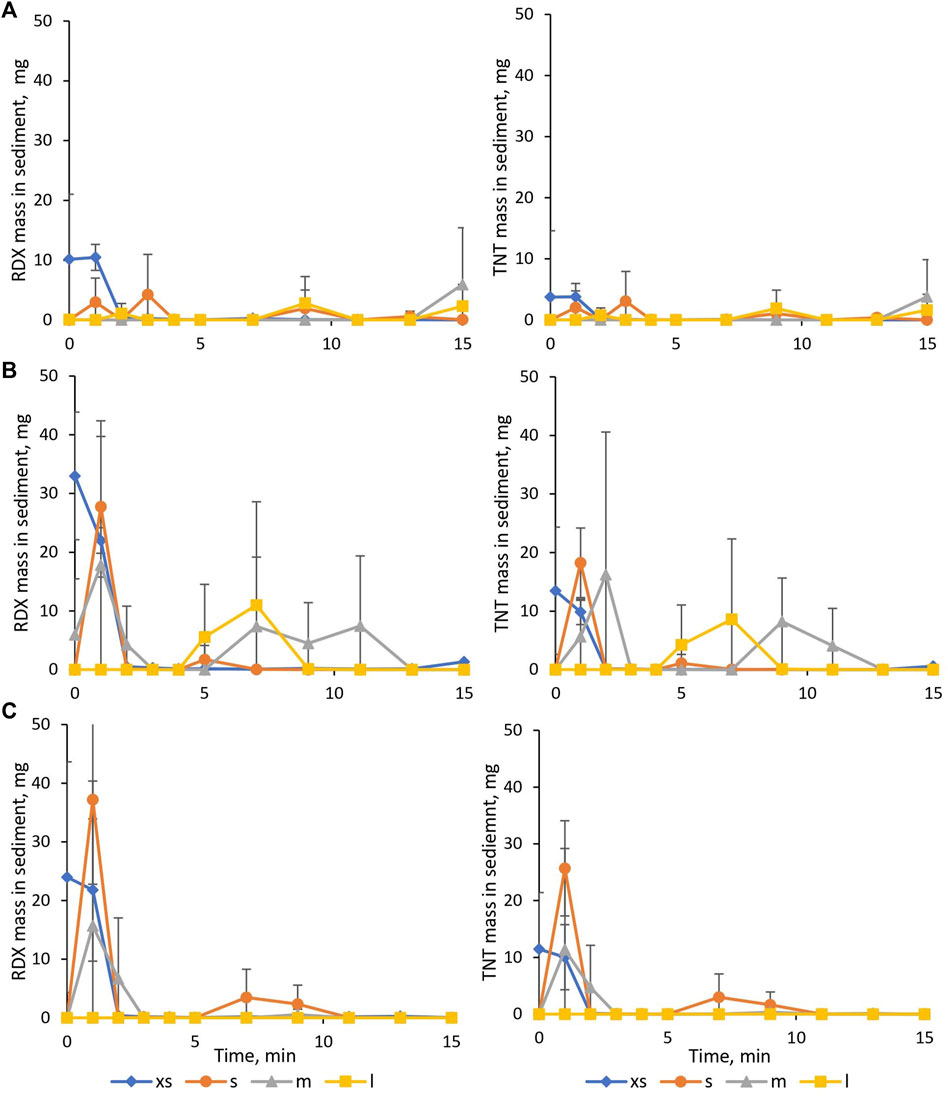
Figure 4. Mass of RDX (Left) and TNT (Right) in sediment for (A) 165-, (B) 265-, and (C) 300-mL min−1. Error bars equal standard error of the mean (n = 3).
At all flow rates, extra small particles had the most mass moved in sediment during the pre-wet stage plus the first 2 min of flow. Transport of extra small energetic particles in sediment then decreased to a steady state of near zero values. Small and medium particles experienced the most movement one to 3 min into the experiment, and large particles moved the most from five to 8 min into the run.
For small particles, the mass of both RDX and TNT transported in sediment increased with increasing flow rate. For all other particle sizes, RDX and TNT transport in sediment increased with flow rate from 165 mL min−1–265 mL min−1 (Table 1; Figure 4). Karls et al. (2023) found that transport of RDX in sediment increased with flow rate for all particle sizes of IMX-104 in similar rill experiments.
Overall, more RDX was transported in sediment than TNT, partially due to larger RDX content in original Composition B particles and partially due to rapid TNT dissolution from extra small particles. For extra small particles, at all flow rates, more RDX was transported in sediment than TNT. The ratio of TNT to RDX in the extra small Composition B particles used in this experiment was 0.5, while the ratio of TNT and RDX recovered from sediment ranged from 0.36 to 0.47 for this particle size. The ratio of TNT to RDX in sediment for other particle sizes was consistent with original composition of Composition B.
Energetics can be transported adsorbed to sediment in addition to being transported as particles. RDX and TNT likely are adsorbing to organic matter and phyllosilicate clays in the soil with organic matter as the primary factor (Dontsova et al., 2009; Haderlein et al., 1996; Tucker et al., 2002). The amount of Composition B adsorbed to sediment was estimated using known adsorption coefficients for RDX and TNT. The values of the adsorption coefficients were calculated based on the fraction of organic carbon in the Florence soil, 0.003. The adsorption coefficient for RDX was calculated using a relationship described in Tucker et al. (2002), while the coefficient for TNT was found using a relationship from Karls (2023). Kd values were found to be 0.82 L kg−1 for RDX and 1.54 L kg−1 for TNT. The concentrations of RDX and TNT in each runoff solution sample were multiplied by the adsorption coefficients and by the mass of sediment in each sample. This value was then divided by the total amount of RDX and TNT extracted from each sediment sample to find the percentage of RDX and TNT adsorbed to sediment relative to the total amount of each compound transported with sediment. On average across all particle sizes and flow rates, 0.23% of RDX and 0.98% of TNT transported with sediment was estimated to be adsorbed to soil (Table 2).
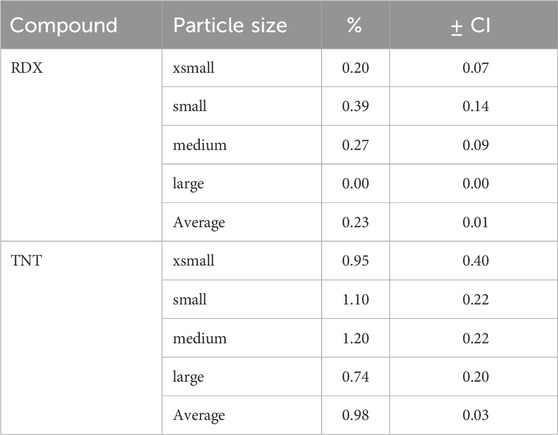
Table 2. Estimated adsorption of energetic compounds to sediments by particle size relative to total transported with sediment (mean ±95% confidence interval).
3.3 Distribution of TNT and RDX between different pools over the entire erosion event
For all flow rates, as particle size increased, transport in runoff and sediment decreased and the amount of energetic remaining on the surface soil increased. This trend was also observed in simulated rainfall transport experiments with Composition B (Cubello et al., 2023). For extra small particles at the highest flow rate there was also transport with infiltration that was not observed for other particle sizes. As flow rate increased, the amount of energetic recovered from sediment increased and the amount remaining on the surface decreased, with virtually no RDX and TNT left on the surface at the largest flow rate. There was also an increase in energetics in runoff at higher flow rates. Most transported energetics were recovered from sediment (Figure 5). There was very little to no detected infiltration of energetics (Table 1). Infiltration included solution collected from the outlets at the bottom of the rill and energetics extracted from the lower two layers of soil collected after each run, as well as solution drained from the flume at the end of the experiment.
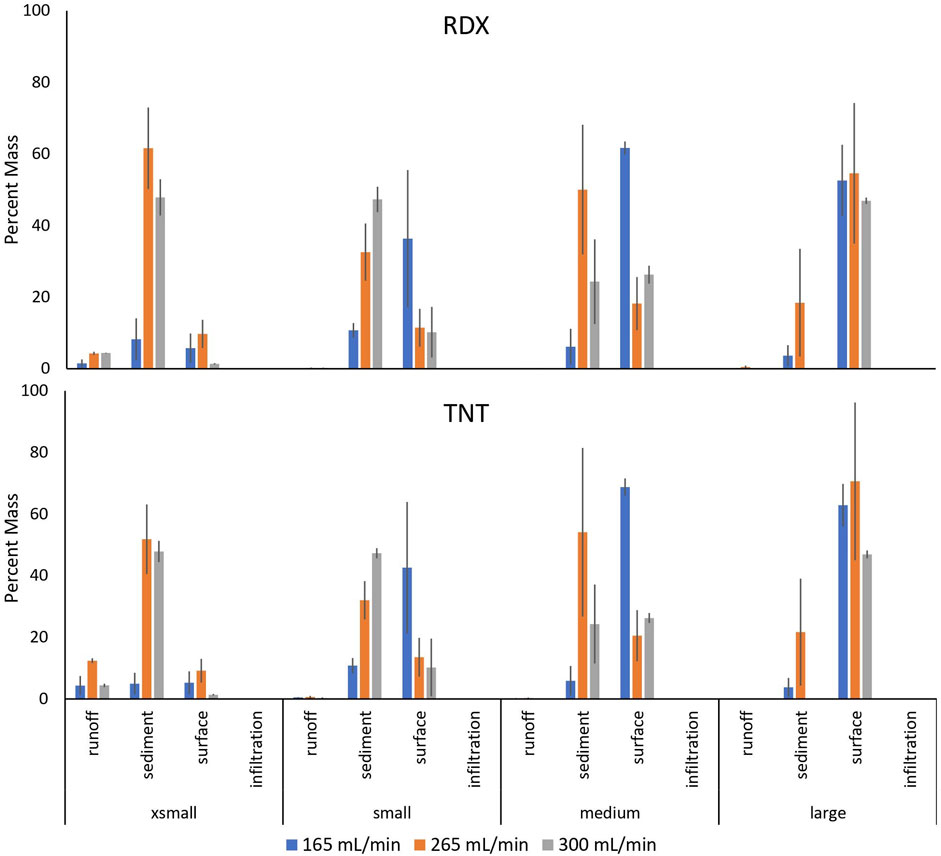
Figure 5. Total mass balance of Composition B by component and particle size. Error bars equal the standard error of the mean.
The total mass of energetics combined across all measured pools varied with no clear trend with the treatments. It increased with an increase in particle size for the lowest flow rate but was similar across particle sizes for the largest flow rate. A possible source of error is incomplete extraction of energetics from soil and sediment due to the solubility limit of TNT and RDX in acetonitrile. This would affect both measurements of TNT and RDX in the sediment transported with runoff and remaining on soil surface. It is also possible that particles placed on the soil surface did not have the same composition as measured previously for each fraction. However, we do not expect that either of these sources of error would affect comparison between treatments, as they would affect them similarly.
3.4 Stream power and sediment yield
Using Equation 1, the stream power of each run was calculated using the slope value and measurements of total discharge for each run. Because slope was constant across all runs and infiltration was negligible, stream power in this experiment was only affected by the flow rate. Stream power has been shown to be the best predictor of the sediment yield, as observed in several studies (Nearing et al., 2007; Polyakov et al., 2010; Hui-Ming and Yang, 2009). For this study, a significant positive relationship can be observed between stream power and sediment yield (Figure 6). Additionally, significant positive relationships were found between stream power and the mass of energetics transported in runoff solution and sediment for small particles (Supplementary Table S1), but not for particles of other sizes.
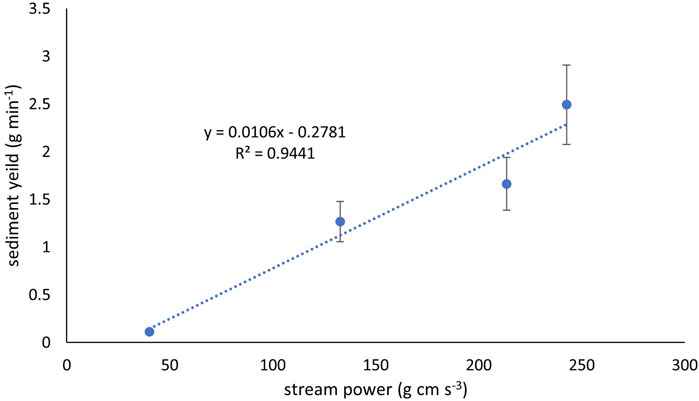
Figure 6. Relationship between stream power and sediment yield (P = 0.0028).
4 Conclusion
This is the first study to quantify the transport of Composition B particles in eroding rills during overland flow as a function of energetic particle size and water flow rate. Relative contributions of different transport pathways to the overall movement of Composition B were examined as well. Smaller particle sizes led to greater transport in both solution and sediment. This is especially important as particles less than 2 mm in diameter have been shown to be deposited in the largest quantities during incomplete detonations of 81 mm rounds (Bigl et al., 2022; Taylor et al., 2006).
The properties of the energetic compounds also influenced transport. More TNT was transported in runoff than RDX, likely due to TNT’s higher solubility and dissolution rates, since there is a greater percentage of RDX than TNT in the formulation. Runoff and infiltration contributed very little to the transport of both compounds for all particle sizes.
Most transport of Composition B, for all particle sizes, was the result of the physical movement of energetic particles and flakes by erosion forces. For large particles, most energetic particles remained on the soil surface. This study found that sediment yield was positively correlated with the stream power, and most transported energetics were transported with sediment, therefore increased stream power may lead to increased transport of energetics, however, significant relationship was only observed for small particles. These findings help determine the fate of deposited Composition B particles in the environment. Because most energetics were recovered from sediment, a future area of interest would be to determine if reducing rill erosion mitigates the transport of energetics.
Data availability statement
The raw data supporting the conclusions of this article will be made available by the authors, without undue reservation.
Author contributions
FC: Formal Analysis, Investigation, Writing–original draft. BK: Investigation, Writing–review and editing. WK: Resources, Writing–review and editing. SB: Resources, Writing–review and editing. VP: Conceptualization, Methodology, Writing–review and editing. KD: Conceptualization, Funding acquisition, Methodology, Supervision, Writing–review and editing.
Funding
The author(s) declare that financial support was received for the research, authorship, and/or publication of this article. This work was funded by SERDP project ER19-1074.
Acknowledgments
Authors are grateful to Kim Birdsall for help in collecting soil used in experiments and Matthew Bigl and ESTCP project ER18-5105 for providing energetic residues.
Conflict of interest
The authors declare that the research was conducted in the absence of any commercial or financial relationships that could be construed as a potential conflict of interest.
The author(s) declared that they were an editorial board member of Frontiers, at the time of submission. This had no impact on the peer review process and the final decision.
Publisher’s note
All claims expressed in this article are solely those of the authors and do not necessarily represent those of their affiliated organizations, or those of the publisher, the editors and the reviewers. Any product that may be evaluated in this article, or claim that may be made by its manufacturer, is not guaranteed or endorsed by the publisher.
Supplementary material
The Supplementary Material for this article can be found online at: https://www.frontiersin.org/articles/10.3389/fenvs.2024.1433379/full#supplementary-material
References
Agency for Toxic Substances and Disease Registry (ATSDR) (2012). Toxicological profile for RDX. Atlanta, GA: U.S. Department of Health and Human Services, Public Health Service.
Agency for Toxic Substances and Disease Registry (ATSDR) (2014). Toxicological profile for TNT. Atlanta, GA: U.S. Department of Health and Human Services, Public Health Service.
Anstey, R. L. (1965). Physical characteristics of alluvial fans. Natick, MS: US Department of Defense, Army Corps of Engineers. Available at: https://apps.dtic.mil/sti/pdfs/AD0627707.pdf.
Bigl, M. F., Beal, S. A., and Ramsey, C. A. (2022) “Determination of residual low-order detonation particle characteristics from Composition B mortar rounds,” in US army engineer research and development center, cold regions research and engineering laboratory. Hanover, NH. Available at: https://hdl.handle.net/11681/45260.
Brannon, J. M., and Pennington, J. C. (2002) “Environmental fate and transport process descriptors for explosives,” in US army engineer research and development center, envrionemental laboratory, vickburg, MS. ERDC/EL TR-02-10.
Cadwalader, G. O., Renshaw, C. E., Jackson, B. P., Magilligan, F. J., Landis, J. D., and Bostick, B. C. (2011). Erosion and physical transport via overland flow of arsenic and lead bound to silt-sized particles. Geomorphology 128 (1–2), 85–91. doi:10.1016/j.geomorph.2010.12.025
Clausen, J. L., Robb, J., Curry, D., and Korte, N. (2004). A case study of contaminants on military ranges: camp edwards, Massachusetts, USA. Environ. Pollut. 129 (1), 13–21. doi:10.1016/j.envpol.2003.10.002
Cubello, F., Polyakov, V., Meding, S. M., Kadoya, W., Beal, S., and Dontsova, K. (2023). Movement of TNT and RDX from composition B detonation residues in solution and sediment during runoff. Chemosphere 141023, 141023. doi:10.1016/j.chemosphere.2023.141023
Deng, L., Fei, K., Sun, T., Zhang,, L., Fan, X., and Ni, L. (2019). Phosphorus loss through overland flow and interflow from bare weathered granite slopes in southeast China. Sustainability 11 (17), 4644. doi:10.3390/su11174644
Di Stefano, C., Nicosia, A., Palmeri, V., Pampalone, V., and Ferro, V. (2019). Comparing flow resistance law for fixed and mobile bed rills. Hydrol. Process. 33 (26), 3330–3348. doi:10.1002/hyp.13561
Dontsova, K. M., Hayes, C., Pennington, J. C., and Porter, B. (2009). Sorption of high explosives to water-dispersible clay: influence of organic carbon, aluminosilicate clay, and extractable iron. J. Environ. Qual. 38 (4), 1458–1465. doi:10.2134/jeq2008.0183
Favaretto, N., Norton, L. D., Joern, B. C., and Brouder, S. M. (2006). Gypsum amendment and exchangeable calcium and magnesium affecting phosphorus and nitrogen in runoff. Soil Sci. Soc. Am. J. 70 (5), 1788–1796. doi:10.2136/sssaj2005.0228
Fuller, M. E., Schaefer, C. E., Andaya, C., and Fallis, S. (2015). Production of particulate Composition B during simulated weathering of larger detonation residues. J. Hazard. Mater. 283, 1–6. doi:10.1016/j.jhazmat.2014.08.064
Guo, Z., Ma, M., Cai, C., and Wu, Y. (2018). Combined effects of simulated rainfall and overland flow on sediment and solute transport in hillslope erosion. J. soils sediments 18, 1120–1132. doi:10.1007/s11368-017-1868-0
Haderlein, S. B., Weissmahr, K. W., and Schwarzenbach, R. P. (1996). Specific adsorption of nitroaromatic explosives and pesticides to clay minerals. Environ. Sci. & Technol. 30 (2), 612–622. doi:10.1021/es9503701
Hairsine, P. B., and Rose, C. W. (1991). Rainfall detachment and deposition - sediment transport in the absence of flow-driven processes. Soil Sci. Soc. Am. J. 55 (2), 320–324. doi:10.2136/sssaj1991.03615995005500020003x
Hui-Ming, S. H. I. H., and Yang, C. T. (2009). Estimating overland flow erosion capacity using unit stream power. Int. J. sediment Res. 24 (1), 46–62. doi:10.1016/S1001-6279(09)60015-9
Kampf, S. K., and Mirus, B. B. (2013). 9.3 Subsurface and surface flow leading to channel initiation,” in Treatise on Geomorphology. Editors J. F. Shroder (Academic Press), 22–42.
Karls, B. (2023). Parametrizing Models for Fate and Transport of Energetics on training ranges [symposium presentation]. Envis. Grad. Symp. Tucson, AZ, U. S.
Karls, B., Meding, S. M., Li, L., Polyakov, V., Kadoya, W., Beal, S., et al. (2023). A laboratory rill study of IMX-104 transport in overland flow. Chemosphere 310, 136866. doi:10.1016/j.chemosphere.2022.136866
Lotufo, G. R. (2012). Ecotoxicity of explosives. Encycl. aquatic Ecotoxicol., 328–336. doi:10.1007/978-94-007-5704-2
Lynch, J. C., Brannon, J. M., and Delfino, J. J. (2002). Dissolution rates of three high explosive compounds: TNT, RDX, and HMX. Chemosphere 47 (7), 725–734. doi:10.1016/S0045-6535(02)00035-8
Nearing, M. A., Bradford, J. M., and Parker, S. C. (1991). Soil detachment by shallow flow at low slopes. Soil Sci. Soc. Am. J. 55 (2), 339–344. doi:10.2136/sssaj1991.03615995005500020006x
Nearing, M. A., Nichols, M. H., Stone, J. J., Renard, K. G., and Simanton, J. R. (2007). Sediment yields from unit-source semiarid watersheds at Walnut Gulch. Water Resour. Res. 43 (6). doi:10.1029/2006WR005692
Nearing, M. A., Norton, L. D., Bulgakov, D. A., Larionov, G. A., West, L. T., and Dontsova, K. M. (1997). Hydraulics and erosion in eroding rills. Water Resour. Res. 33 (4), 865–876. doi:10.1029/97WR00013
Nouwakpo, S. K., Huang, C. H., Bowling, L., and Owens, P. (2010). Impact of vertical hydraulic gradient on rill erodibility and critical shear stress. Soil Sci. Soc. Am. J. 74 (6), 1914–1921. doi:10.2136/sssaj2009.0096
Polyakov, V., Kadoya, W., Beal, S., Morehead, H., Hunt, E., Cubello, F., et al. (2023). Transport of insensitive munitions constituents, NTO, DNAN, RDX, and HMX in runoff and sediment under simulated rainfall. Sci. Total Environ. 866, 161434. doi:10.1016/j.scitotenv.2023.161434
Polyakov, V. O., Nearing, M. A., Nichols, M. H., Scott, R. L., Stone, J. J., and McClaran, M. P. (2010). Long-term runoff and sediment yields from small semiarid watersheds in southern Arizona. Water Resour. Res. 46 (9). doi:10.1029/2009WR009001
Price, R. A., Bourne, M., Price, C. L., Lindsay, J., and Cole, J. (2011). “Transport of RDX and TNT from composition-B explosive during simulated rainfall,” in Environmental chemistry of explosives and propellant compounds in soils and marine systems: distributed source characterization and remedial technologies (American Chemical Society), 229–240. doi:10.1021/bk-2011-1069.ch013
Sharpley, A., and Kleinman, P. (2003). Effect of rainfall simulator and plot scale on overland flow and phosphorus transport. J. Environ. Qual. 32 (6), 2172–2179. doi:10.2134/jeq2003.2172
Taylor, S., Campbell, E., Perovich, L., Lever, J., and Pennington, J. (2006). Characteristics of Composition B particles from blow-in-place detonations. Chemosphere, 65(8), 1405–1413. doi:10.1016/j.chemosphere.2006.03.077
Tucker, W. A., Murphy, G. J., and Arenberg, E. D. (2002). Adsorption of RDX to soil with low organic carbon: laboratory results, field observations, remedial implications. Soil Sediment Contam. 11 (6), 809–826. doi:10.1080/20025891107104
U. S. Environmental Protection Agency (1986) “SW846 method 9081. Cation-exchange capacity of soils (sodium acetate),” in Office of solid waste and emergency response. Washington, DC.
U. S. Environmental Protection Agency. (2006). Method 8330b (SW-846): nitroaromatics, nitramines, and nitrate esters by high performance liquid chromatography (HPLC).
Williams, M., Reddy, G., Quinn, M., and Johnson, M. S. (2015). Wildlife toxicity assessments for chemicals of military concern. Elsevier.
Woody, R. C., Kearns, G. L., Brewster, M. A., Turley, C. P., Sharp, G. B., and Lake, R. S. (1986). The neurotoxicity of cyclotrimethylenetrinitramine (RDX) in a child: a clinical and pharmacokinetic evaluation. J. Toxicol. Clin. Toxicol. 24 (4), 305–319. doi:10.3109/15563658608992595
Zhang, G. H., Liu, B. Y., Liu, G. B., He, X. W., and Nearing, M. A. (2003). Detachment of undisturbed soil by shallow flow. Soil Sci. Soc. Am. J. 67 (3), 713–719. doi:10.2136/sssaj2003.0713
Keywords: Pollutant transport, composition B, RDX, TNT, overland flow, munitions constituents
Citation: Cubello F, Karls B, Kadoya W, Beal S, Polyakov V and Dontsova K (2024) Detachment and transport of composition B detonation particles in rills. Front. Environ. Sci. 12:1433379. doi: 10.3389/fenvs.2024.1433379
Received: 15 May 2024; Accepted: 18 September 2024;
Published: 03 October 2024.
Edited by:
Xijuan Chen, Chinese Academy of Sciences (CAS), ChinaReviewed by:
Vito Ferro, University of Palermo, ItalyHuilian Ma, The University of Utah, United States
Copyright © 2024 Cubello, Karls, Kadoya, Beal, Polyakov and Dontsova. This is an open-access article distributed under the terms of the Creative Commons Attribution License (CC BY). The use, distribution or reproduction in other forums is permitted, provided the original author(s) and the copyright owner(s) are credited and that the original publication in this journal is cited, in accordance with accepted academic practice. No use, distribution or reproduction is permitted which does not comply with these terms.
*Correspondence: Favianna Cubello, ZmN1YmVsbG9AYXJpem9uYS5lZHU=