 Tao Song1*
 Hamzeh Ghorbani
- 1Changjiang Water Resources and Hydropower Development Group (Hubei) Co., Ltd., Hubei, China
- 2Young Researchers and Elite Club, Ahvaz Branch, Islamic Azad University, Ahvaz, Iran
Hydropower stations are important infrastructures for generating clean energy. However, they are vulnerable to natural disasters such as earthquakes, which can cause severe damage and even lead to catastrophic failures. Therefore, it is essential to develop effective strategies for maximizing hydropower station safety against earthquakes. To evaluate the potential shear rate of surrounding rock layers, the shear wave velocity (Vs) parameter can be used as a useful tool. This parameter helps to determine the velocity at which shear waves travel through the rock layers, which can indicate their stability and susceptibility to earthquakes. This study will investigate the significance of the Vs parameter in evaluating the potential shear rate of rock layers surrounding hydropower stations and how it can be used to ensure their safety and efficiency in earthquake-prone regions. Furthermore, a novel approach is proposed in this research, which involves using extreme learning machine (ELM) technology to predict Vs and enhance the seismic safety of hydropower stations. The ELM model predicts the Vs of the soil layers around the hydropower station, a crucial factor in determining the structure’s seismic response. The predicted Vs is then used to assess seismic hazard and design appropriate safety measures. The ML-ELM model outperformed both the ELM and empirical models, with an RMSE of 0.0432 μs/ft and R2 of 0.9954, as well as fewer outlier data predictions. This approach shows promise for predicting Vs in similar environments, and future research could explore its effectiveness in other datasets and practical applications.
1 Introduction
Shear wave velocity (Vs) is an important parameter in rock mechanics and earthquake engineering as it helps to determine the potential shear rate of the surrounding rock layers (Goodman, 1991; Barton, 2006). The Vs are a type of seismic wave that move perpendicular to the direction of the wave propagation (Ohta and Goto, 1978). They are responsible for causing the most damage during earthquakes as they can create significant ground motion and lead to soil liquefaction and landslides (Keefer, 1984; Verma et al., 2014). By measuring the Vs, engineers can determine the stability of the rock layers and their susceptibility to earthquakes (Hussien and Karray, 2015). Rock layers with high Vs are more stable and less likely to experience significant shear rates during an earthquake. In contrast, rock layers with low Vs are more susceptible to damage and can experience significant shear rates during an earthquake (Lee and Trifunac, 2010). In hydropower systems, the stability of the surrounding rock layers is essential for ensuring the safety and effectiveness of the system (Jiang et al., 2019). A stable foundation is necessary for supporting the weight of the dam, turbine, and other components of the hydropower system (Han et al., 2022). If the rock layers are unstable, they can shift or deform during an earthquake, leading to damage to the system (Yao et al., 2022).
Therefore, by evaluating the Vs parameter, engineers can determine the potential shear rate of the surrounding rock layers and take appropriate measures to ensure the safety and effectiveness of hydropower systems in earthquake-prone areas (Li et al., 2022). This may involve strengthening the foundation, adding additional support, or implementing other measures to mitigate the impact of earthquakes on the system (Antonovskaya et al., 2019). The Vs is a important parameter in evaluating the potential shear rate of surrounding rock layers and ensuring the safety and effectiveness of hydropower systems in earthquake-prone areas (Siegel, 2016). By using this parameter, engineers can determine the stability of the rock layers and take appropriate measures to mitigate the impact of earthquakes on the system (Zheng et al., 2021). Traditional methods for predicting Vs rely on laboratory tests or field measurements, which are time-consuming and expensive (Maleki et al., 2014; Adjei et al., 2020). Moreover, these methods may not provide sufficient spatial coverage or resolution to capture local variations in soil properties.
The Vs data gathered from vertical seismic profile (VSP) petrophysics well logging can be applied as Vs evaluation for the purpose of hydropower station safety against earthquakes (Liu et al., 2010). The VSP petrophysics well logging is a technique used to measure the subsurface properties of rocks and soil layers (Shao et al., 2022). It involves drilling a borehole and lowering a geophone or accelerometer to measure the velocity of sound waves and Vs as they travel through the subsurface layers. The data collected from VSP petrophysics well logging provides detailed information about the subsurface structure, including the Vs (Salahdin et al., 2022). Therefore, it can be applied as a reliable tool for evaluating hydropower station safety against earthquakes.
Presently, the field of machine learning (ML) is witnessing remarkable growth in the domains of engineering, tool development, and management, which has demonstrated its efficacy in the realm of construction management and risk evaluation of hydropower structures (Cao et al., 2023). This technology holds immense promise in enabling proactive safety control by using advanced data analytics to monitor environmental conditions and detect potential safety hazards in real-time, thereby averting catastrophic events and ensuring the safety of dams (Hariri-Ardebili and Pourkamali-Anaraki, 2018a). One way ML can assist in this task is by detecting patterns in the data that human analysts might miss. For example, algorithms can learn to recognize subtle changes in seismic activity that might indicate an impending earthquake, or identify correlations between weather conditions and seismic events (Hariri-Ardebili and Pourkamali-Anaraki, 2018b). Another important application of ML is in developing models to simulate the behavior of hydropower structures during an earthquake (Wang et al., 2021). This could help engineers design structures that can better withstand seismic forces, or improve emergency response plans to minimize the risk of catastrophic failure.
This research uses a novel approach using vertical seismic profile data, typically collected to assess subsurface formations in oil and gas wells, near various dam construction sites. The innovative methodology aims to facilitate geotectonic assessment of the foundation formations of dams and hydropower stations. Previous studies have not utilized this model for risk assessment in hydropower facilities. Previous research has mainly concentrated on estimating shear wave velocity using standard petrophysical data to determine rock properties in geosciences and petroleum engineering. By using this data to evaluate the geological structures underlying these infrastructure projects, researchers can gain valuable insights into potential risks and challenges associated with their construction and operation. This approach represents a significant advancement in geotechnical engineering, enabling more accurate and comprehensive evaluations of foundation formations important for ensuring the safety and stability of dams and hydropower stations. Additionally, the research introduces a new methodology using Extreme Learning Machine (ELM) models to predict the Vs of rock layers in hydropower station foundations. The Vs is important in determining the seismic response of structures and plays a vital role in enhancing seismic safety. The proposed approach uses ELM-enabled Vs prediction to assess seismic hazards and design appropriate safety measures. By accurately predicting Vs, this method can assist engineers and policymakers in making informed decisions to mitigate potential risks associated with seismic activity.
1.1 Research background
There is ongoing research into using ML techniques to help predict and mitigate the risk of earthquakes threatening hydropower stations. These techniques involve analyzing a wide range of data sources, including seismic data from sensors on the ground, satellite images, weather data, and historical records of earthquakes.
Kien-Trinh T., et al. (2020) in their study presents a new approach for deformation predicting of hydropower dams using a hybrid method that combines deep learning with a coronavirus optimization model. This technique enhances the performance of the long short-term memory (LSTM) model by improving its ability to capture nonlinear relationships between inputs and outputs. The experiment was tested on real-world data from the Hoa Binh hydropower dam in Vietnam and achieved promising predicting results (Bui et al., 2022). Rico et al. (2019) emphasized the significance of safety in managing dams and explored the potential of ML in dam safety control. They suggested that advanced data analytics can be used to monitor environmental conditions and detect safety risks, allowing for proactive safety control. By collecting and analyzing real-time data, this approach can effectively prevent disasters and ensure dam safety (Rico et al., 2019). Tang et al. (2022) proposes a Bayesian network model to analyze dam risk in their paper. The approach integrates ML models and domain knowledge. The study explores the potential of using such models in disaster risk reduction. The authors suggest that the proposed model can help policymakers make more informed decisions on dam safety (Tang et al., 2022).
Some researchers put more emphasis on the analysis of ML models based on Vs and seismic responses. Vs data and seismic responses of sensors are important for predicting earthquakes using ML because they provide key indicators of the state of the Earth’s subsurface. By analyzing these data, researchers can identify patterns and correlations that may indicate an increased likelihood of an earthquake occurring. The study by Zhang et al. (2021) emphasizes the potential of deep learning techniques, specifically Deep Neural Network (DNNs), in enhancing the precision and dependability of soil liquefaction prediction. The researchers aimed to examine the effectiveness of DNNs in predicting soil liquefaction using Vs data. They gathered data from various sources, including laboratory tests and field measurements, and used a five-layer DNN model to predict LPI values based on Vs (Zhang et al., 2021).
The study by Won et al. (2021) emphasizes the significance of accurately predicting potential damages to building structures caused by seismic activities. The authors aimed to address this limitation by developing a new ML-based approach that considers soil-structure interaction effects. The authors developed a deep learning-based approach that incorporates building characteristics, soil properties, and ground motion data. The proposed model was trained and evaluated using data from real-world earthquakes and compared with existing seismic damage prediction methods (Won and Shin, 2021).
Derakhshani and Foruzan (2019) demonstrate the potential of deep learning techniques for predicting strong ground motion parameters, which can have significant implications for seismic hazard assessment and infrastructure design. The authors propose a deep neural network that is trained using a large database containing strong motion records from various earthquakes around the world (Derakhshani and Foruzan, 2019). Kim et al. (2020) explore the development of ground motion amplification (GMA) models for Japan using ML techniques. GMA models are commonly used to evaluate seismic hazards and help with site selection for important infrastructure. They compare the performance of several ML models and assess the accuracy of their developed GMA models. The study highlights the potential of using ML techniques in earthquake engineering research for developing accurate and efficient predictive models (Kim et al., 2020). Shreedharan et al. (2021) in their study explores how ML techniques can be used to predict the evolution of lab earthquakes’ timing and shear stress using active seismic monitoring. The study emphasizes the potential of using ML models to improve earthquake predicting in the future (Shreedharan et al., 2021).
The current research stands out as superior to previous literature in several ways. Firstly, the data acquisition method used in this study is highly advanced and sophisticated, enabling researchers to collect data on the actual depth of the rock formation. This level of precision is unparalleled in previous studies, which relied on less accurate methods of data collection. Additionally, the continuous data collection approach used in this research is a significant improvement over previous studies that only gathered data at specific intervals. Secondly, the current study relies on the specific characteristics of the foundation stone to withstand overload, which is a important factor in assessing the potential risks for a hydropower complex. This approach is a marked improvement over previous studies that did not consider this important factor. Finally, the ability to detect the maximum value of the shear modulus for a rock bed is a significant advancement in this field. This information is vital in assessing potential risks and designing an effective hydropower complex. Overall, the current research is superior to previous literature due to its advanced data acquisition method, continuous data collection, and focus on important factors that were previously overlooked.
2 Methodology
The methodology that has been put forward comprises three primary stages, namely, data collection, ELM-based prediction of Vs, and assessment of seismic hazard through the evaluation of the shear modulus of foundation rock. The first step involves gathering relevant data from various sources to ensure that the subsequent analysis is comprehensive and accurate. The second step entails using the ELM-based approach to predict the Vs, which is a important parameter in assessing seismic hazards. This method has been chosen due to its proven effectiveness in accurately predicting Vs in various geological settings. Finally, the third step involves evaluating the seismic hazard based on the predicted Vs and other relevant factors such as shear modulus magnitude and frequency. This comprehensive methodology provides a robust framework for accurately assessing seismic hazards, which is essential for ensuring public safety and minimizing damage caused by earthquakes.
2.1 Data collection and description
The data set of this research exhibits the seismic characteristics and strength properties of the rock formations of the foundation of hydropower plants. It contains more than 3,200 data points that have obtained the electrochemical, physical, radiogenic and seismic characteristics of the ground rock mass through the petrophysical well logging data of the boreholes from an oil field in the East of Iran (Figure 1). Nine input variables are used for analysis including: Measured Depth (MD), which denotes the depth at which specific measurements or observations are taken in a wellbore or formation. Rock Type (RT) classifies geological formations based on their composition, texture, and other characteristics. Gamma Ray Log (GR) measures gamma radiation emitted by the formation, aiding in lithology identification and log correlation. Rock Density (RHOB) quantifies the density of the formation, assisting in porosity and lithology estimation. Thermal Neutron Porosity (TNPHI) measures the formation’s porosity using thermal neutrons, revealing fluid presence within the rock. Shallow Electrical Resistivity (Hall-S) gauges the formation’s resistance to electrical current flow at a shallow depth, inferring lithology and fluid content. Deep Electrical Resistivity (Hall-D) measures the formation’s resistance to electrical current flow at greater depths, furnishing information on formation properties. Photo-electric Index (PEF) measures the rock’s response to incident photons, commonly used for lithology and mineral composition identification. Compressive Wave Velocity (Vp) represents the velocity of compressional waves traveling through the formation, offering insights into rock stiffness and porosity. The dataset also includes Vs recorded during vertical seismic logging as well as full-set borehole logging data. A summary of the data description of the research is presented in Table 1.
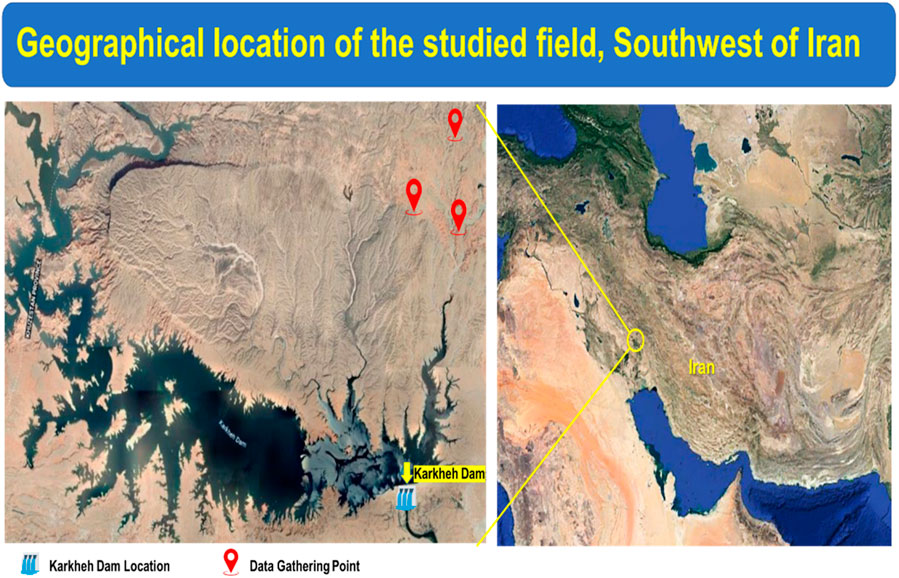
Figure 1. Graphical location of the study field in southwest Iran for prediction of Vs to determination of the and enhance the seismic safety of hydropower stations.
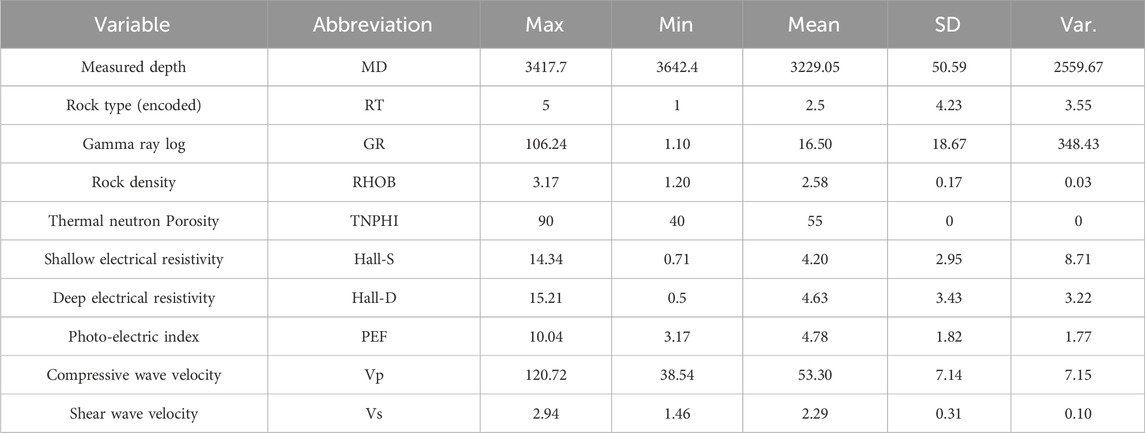
Table 1. Data description for prediction of Vs to determination of the and enhance the seismic safety of hydropower stations.
2.2 Machine learning models
This study uses four powerful machine learning models to estimate Vs parameters. Each of the proposed models possesses different flexibilities and operational mechanisms, competing with each other for better performance and higher accuracy after adaptation and training with the dataset used in this research.
2.2.1 Extreme learning machine (ELM)
ELM is a single-hidden layer feedforward neural network (SLFN) paradigm developed for efficient learning and generalization (El-Bably and Fouad, 2022). Unlike traditional neural network training methods which iteratively adjust all parameters, ELM uniquely fixes the hidden layer parameters and only optimizes the output weights, leading to significantly faster training times (Huang et al., 2019). ELM aims to address the limitations of traditional neural networks, such as slow convergence and local minima entrapment (Kaur et al., 2023). The core principle behind ELM is the random assignment of input weights and biases, followed by the determination of output weights through a straightforward linear optimization process (Deng et al., 2015). This methodology leverages the universal approximation capability of SLFNs, ensuring that random hidden nodes can approximate any continuous function given a sufficient number of neurons. Figure 2 illustrates the operational mechanism and pattern recognition, along with the schematic architecture of the ELM model.
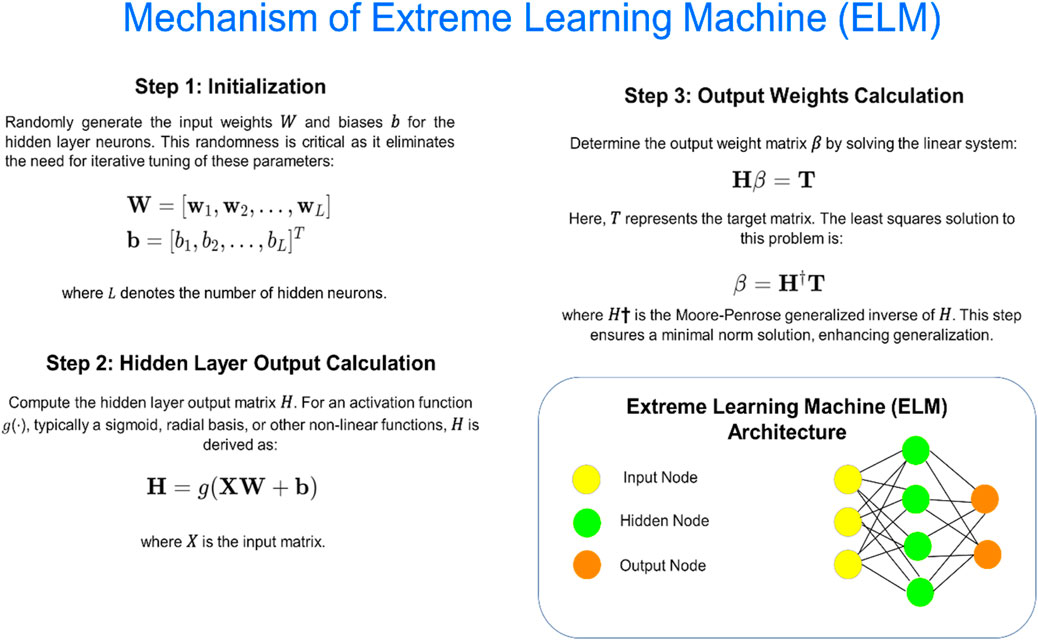
Figure 2. Graphical illustration of the ELM for predicting Vs to determination of the and enhance the seismic safety of hydropower stations.
2.2.2 Multi-layer extreme learning machine (ML-ELM)
Multi-Layer Extreme Learning Machine (ML-ELM) extends the conventional Extreme Learning Machine (ELM) by incorporating multiple hidden layers, thus enhancing its capacity to model complex data patterns (Baghirli, 2015). The ML-ELM retains the core advantage of ELM—efficient training—while exploiting deep architectures for improved feature extraction and representation (Wang et al., 2019). ML-ELM combines the fast-training advantage of ELM with the deep learning concept of hierarchical feature learning (Tang et al., 2014). By stacking multiple layers of ELM, each layer learns an abstract representation of the input data, progressively capturing higher-order features. This deep architecture enables ML-ELM to handle more complex functions and patterns compared to single-layer ELM. Figure 3 illustrates the operational mechanism and pattern recognition, along with the schematic architecture of the ML-ELM algorithm model.
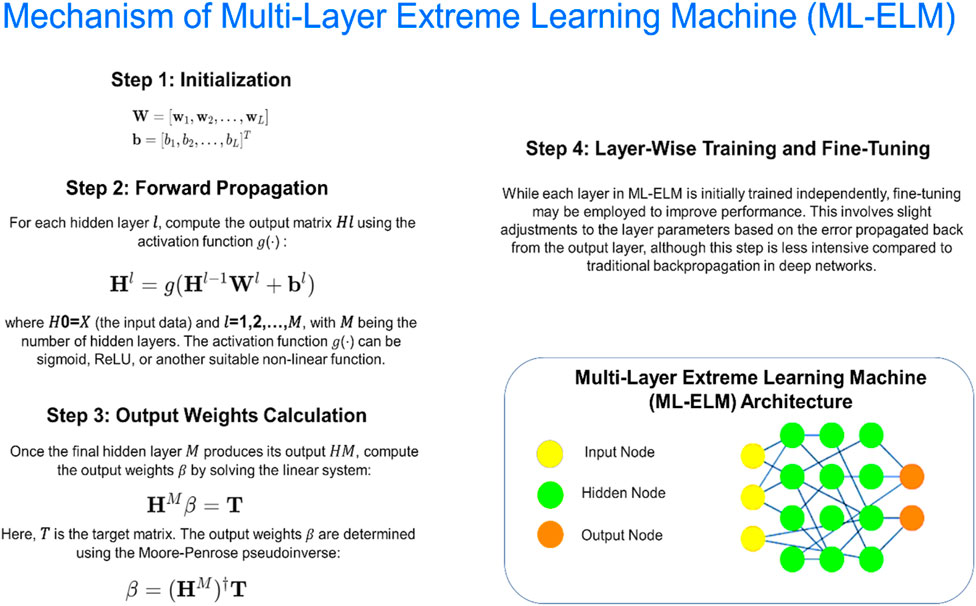
Figure 3. Graphical illustration of the ML-ELM for predicting Vs to determination of the and enhance the seismic safety of hydropower stations.
2.2.3 Multi-layer perceptron neural network (MLP-NN)
The MLP-NN is a fundamental architecture in deep learning, characterized by multiple layers of interconnected neurons (Zhang et al., 2023). It is a versatile model capable of learning complex non-linear relationships in data, making it widely applicable in various domains such as image recognition, natural language processing, and predictive modeling (Garcia et al., 2005). MLP-NN consists of an input layer, one or more hidden layers, and an output layer (Alqadhi et al., 2021). Each layer, except the input layer, contains neurons that are interconnected with neurons from the previous and subsequent layers (Alqadhi et al., 2021). The network learns by adjusting the weights and biases of connections between neurons through a process called backpropagation, optimizing a chosen loss function. Figure 4 illustrates the operational mechanism and pattern recognition, along with the schematic architecture of the MLP-NN model.
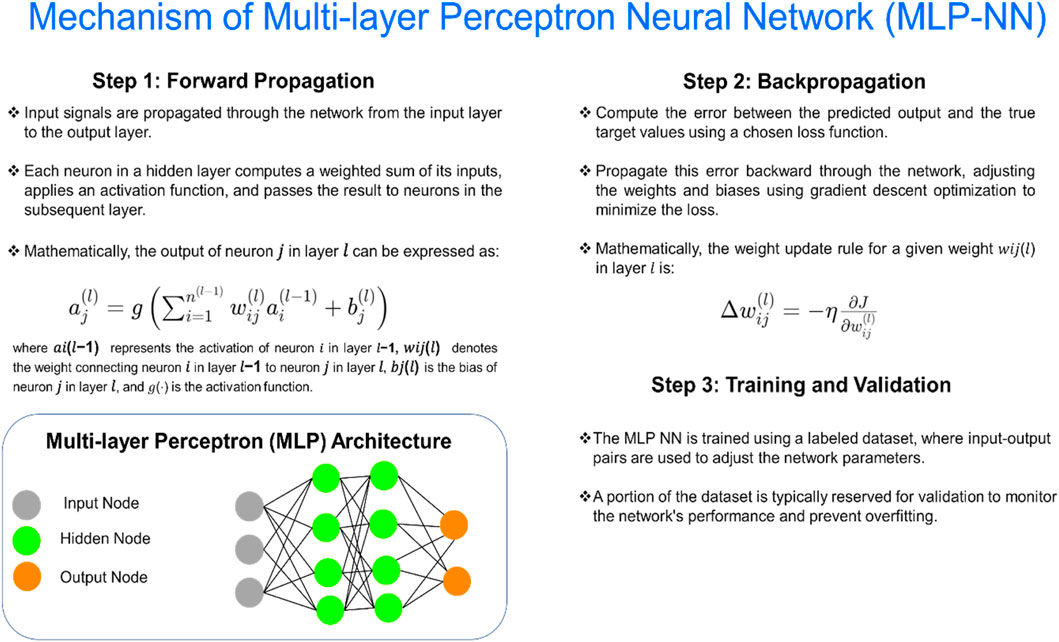
Figure 4. Graphical illustration of the MLP-NN for predicting Vs to determination of the and enhance the seismic safety of hydropower stations.
Multi-layer Perceptron (MLP) Neural Networks and Multi-layer Extreme Learning Machines (ELMs) are both prominent models in the realm of artificial neural networks, yet they differ significantly in nature, working mechanisms, and applications (Afzal et al., 2024). MLP, a classic neural network architecture, consists of multiple layers of interconnected neurons, each layer transforming the input data successively to generate complex representations (RamaKrishna et al., 2014). Through backpropagation, MLP optimizes its weights to minimize prediction errors, making it suitable for tasks requiring high accuracy but susceptible to overfitting and slow training due to iterative optimization. In contrast, Multi-layer ELMs, an advancement in the ELM paradigm, use a single-layer feedforward network followed by a random projection to a higher-dimensional space, facilitating rapid training by directly solving the output weights. While MLPs excel in tasks like image recognition and natural language processing due to their ability to capture intricate patterns, Multi-layer ELMs are favored in scenarios where computational efficiency and scalability are crucial, such as large-scale data processing and real-time applications like speech and gesture recognition.
2.2.4 Multiple linear regression (MLR)
Multiple Linear Regression (MLR) is a statistical method used to model the relationship between multiple independent variables and a single dependent variable (Zaefizadeh et al., 2011). It is widely used in data science and machine learning for predictive modeling, where the goal is to estimate the value of the dependent variable based on the values of the independent variables (Zare Abyaneh, 2014). Independent variables. MLR assumes a linear relationship between the independent variables
Where:Y is the dependent variable,

Figure 5. Graphical illustration of the MLR for predicting Vs to determination of the and enhance the seismic safety of hydropower stations.
2.3 K-fold cross-validation technique
Cross-validation is an important method for assessing the effectiveness of ML models. During this process, data is segmented into both training and testing sets, which are used to train and evaluate the model’s performance (AlBadawy et al., 2018; Schratz et al., 2019). This process can be carried out multiple times until the model has been thoroughly tested. A common variation of cross-validation is k-fold cross-validation, where data is partitioned into k subsets (Owen and Perry, 2009). During each iteration of the process, the model is trained on a different k-1 of these subsets while the remaining subset is used as the test set to assess the resulting performance (Owen and Perry, 2009). This process is repeated k times and the results are averaged to give an overall estimate of the model’s performance. The cross-validation technique is used to avoid overfitting in ML models whereas provides an estimate of a model’s performance on unseen data, which can help to identify overfitting.
3 Results and discussion
3.1 Implementation of cross validation
The process of evaluating an Extreme Learning Machine (ELM) model involves selecting the best architecture and data subsets for training and testing. One method for choosing subgroups involves randomly allocating 30% of the data records to the test subset and the remaining 70% to the training subset. However, this approach caused overfitting throughout the feature selection method, resulting in some characteristics having an excessive impact on predictions. The 7-fold cross-valid technique was applied as part of a more effective strategy to deal with this issue. The dataset was split using this method into seven distinct, non-overlapping segments, of which one was chosen as an assessment subset and the other six were designated as the training subset. The model with the lowest RMSE to predict Vs versus recorded Vs was chosen after the ELM model was tested 70 times (10 times per training/test subset combination). Every of the 10 training/test sample mixtures underwent the same procedure, and the outcome of the investigated feature selection was judged based on the average of the 10 lowest RMSE scores acquired over the course of seven iterations. The 7-fold validation sequence is depicted in Figure 6. The overfitting issue during feature selection was resolved by using the 7-fold cross-validation method, which led to the ELM model’s predictions being more accurate and dependable.
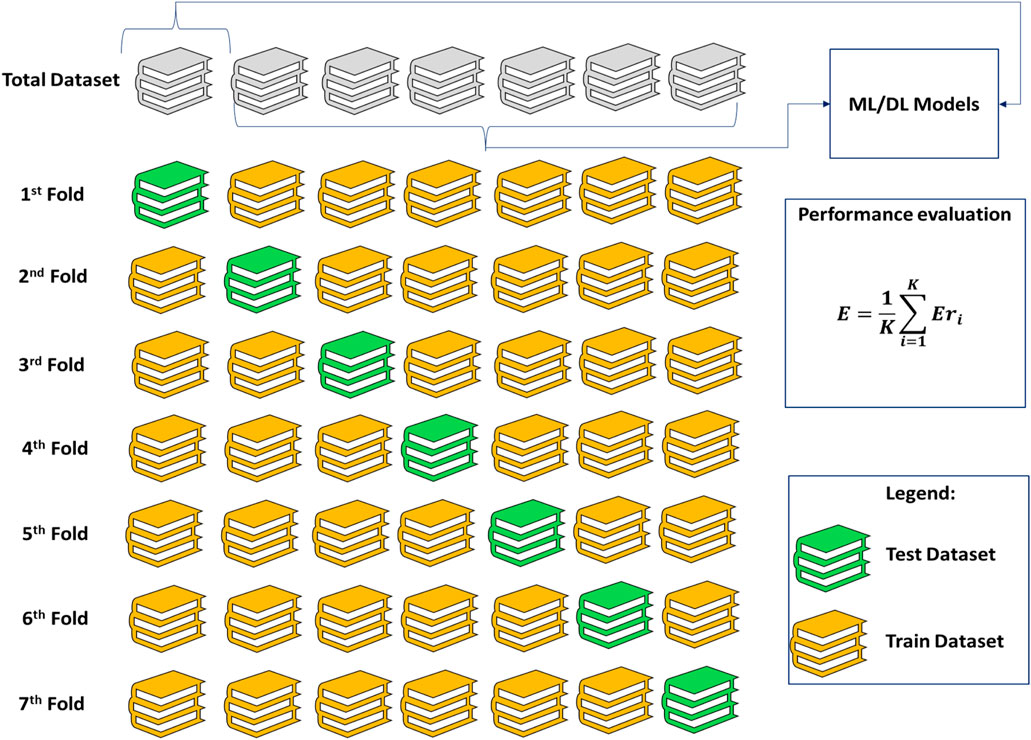
Figure 6. Illustration of k-fold cross validation based on the train/test evaluation.
3.2 Error parameters
The utilization of metrics such as mean square error (MSE), standard deviation (SD), absolute average relative error (AARE), root mean square error (RMSE), R-square, and average relative error (ARE) can provide valuable insights into the effectiveness of ML models in analyzing and interpreting data. MSE measures the accuracy of the ML models by determining the average squared difference between the predicted and actual values, while SD provides a measure of the variability of data points around the mean. AARE calculates the average difference as a percentage of the actual value, while RMSE makes it easier to determine the level of error.
R-square measures how well the ML models fit the data, with a value closer to 1 indicating a better fit. ARE provides a percentage value of the average difference between predicted and actual values, giving an idea of the ML models accuracy level. Overall, these metrics are important for evaluating ML models performance in predicting statistical data and selecting the most suitable ML models for a particular task. By using these parameters, the accuracy and reliability of statistical analysis and predictions can be significantly improved (Eqs 2–7).
3.3 Model performance
Over time, researchers have focused on developing empirical equations that can accurately determine Vs Several researchers have contributed to this field (Table 2). Each of these researchers has presented their respective empirical equations to determine Vs, and Table 2 lists these equations and their related equations. By combining the knowledge and expertise of these researchers, scientists can use empirical equations to accurately and efficiently determine Vs As such, these empirical equations continue to play an important role in the field of geophysics and contribute significantly to our understanding of subsurface structures and properties.
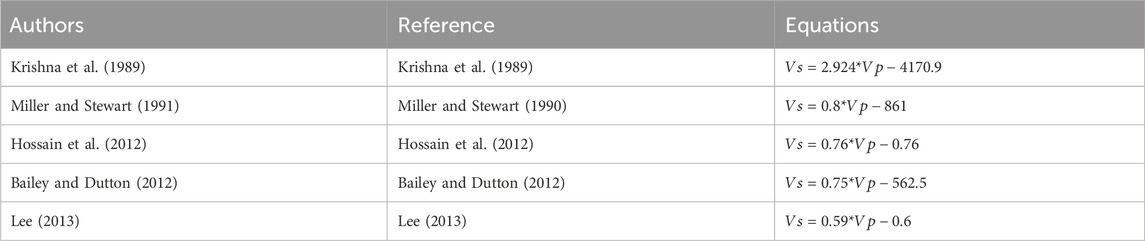
Table 2. The Vs empirical equation for other researchers.
The aim of this study is to prediction of Vs using robust ML models. In this article, 70% of the dataset was randomly assigned for training, while 15% was earmarked for testing, with the remaining 15% used for validation. Comparative analysis of the outcomes derived from the different ML models including ELM, ML-ELM, MLR, and MLPNN, and experimental equations was conducted based on Table 3. The results show the performance of the ML-ELM Model is better than ELM, MLP-NN, and MLR models and empirical equations.
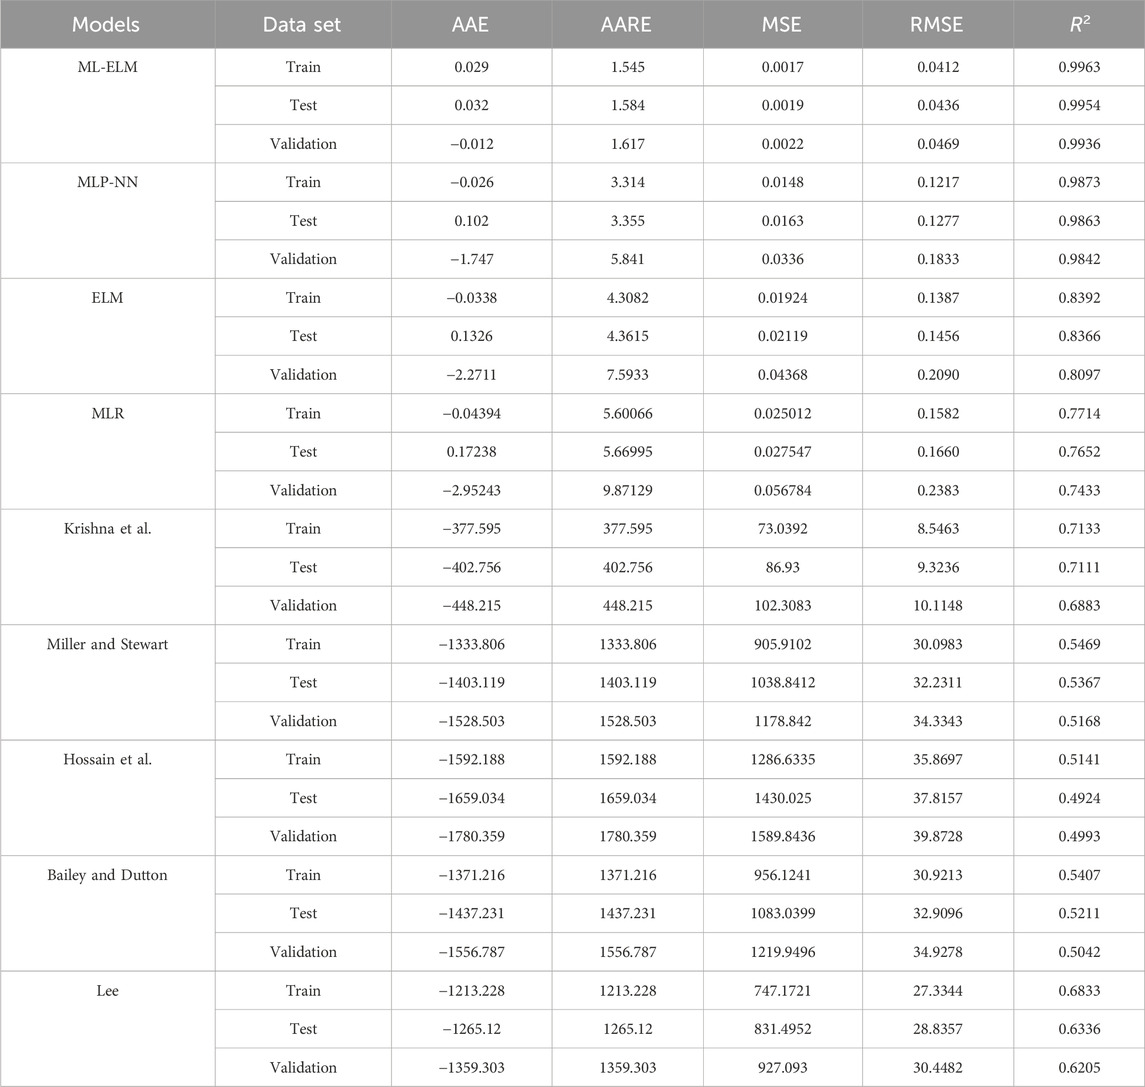
Table 3. Determination of the statical parameter for prediction of Vs to determination of the and enhance the seismic safety of hydropower stations.
The statistical parameters for predicting Vs are given in Table 3, and the results presented in this table show the accuracy and performance of each artificial intelligence model and empirical equations. The ML-ELM model outperforms the ELM model and empirical equations in terms of accuracy. The ML-ELM model performs exceptionally well, achieving RMSE = 0.0412 μs/ft, AARE = 1.545%, and R2 = 0.9963 for the training subset, RMSE = 0.0436 μs/ft, AARE = 1.584%, and R2 = 0.9954 for the testing subset, and RMSE = 0.9936 μs/ft, AARE = 1.617%, and R2 = 0.9936 for validation subset.
To evaluate the accuracy of different models, statistical parameters such as RMSE and R2 can be used. The values for these parameters for predicting Vs are given in Table 3, while Figures 7, 8 offer an in-depth comparison of the performance accuracy of various artificial intelligence models and empirical equations. From the observations presented in Figure 7, it can be inferred that the ML-ELM model outperforms the ELM, MLP-NN and MLR models in terms of performance accuracy. On the other hand, Figure 8 indicates that the performance accuracy of the Krishna et al. empirical equations is superior to that of the other models. Based on these findings, it can be concluded that the order of models, arranged according to RMSE values, is ML-ELM < MLP-NN < ELM < MLR < Lee < Krishna et al. < Miller and Stewart < Bailey and Dutton < Hossain et al. However, in terms of RMSE values, the ranking of the models is ML-ELM > MLP-NN > ELM > MLR Lee > Krishna et al. > Miller and Stewart > Bailey and Dutton > Hossain et al.
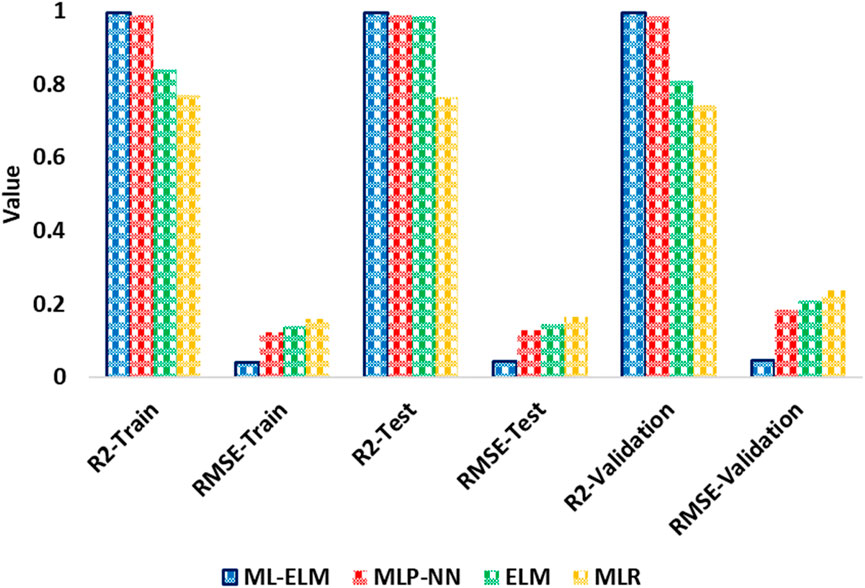
Figure 7. Illustration of comparison between RMSE and R2 for ELM, ML-ELM, MLP-NN and MLR models for prediction of Vs to determination of the and enhance the seismic safety of hydropower stations.
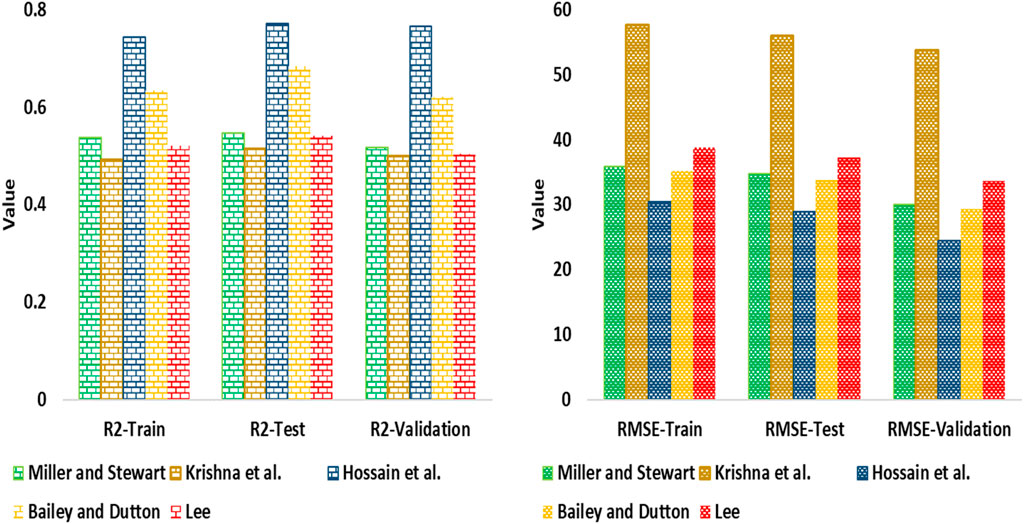
Figure 8. Illustration of comparison between RMSE and R2 for empirical equation models for prediction of Vs to determination of the and enhance the seismic safety of hydropower stations.
Figure 9 present information on the cross-plot diagram for testing subset for predicting Vs using ELM, MLP-NN, MLR and ML-ELM models. The cross-plot diagram provides insight into the accuracy of the performance of the algorithms. By examining the cross points between the measured and predicted data, we can visually observe the accuracy of the performance. Additionally, the R2 mathematical relationship can be used to obtain a statistical parameter value from the chart features. Figure 9 shows that the R2 value for the entire subset is approximately 0.99 for ML-ELM and 0.98 for ELM. After analyzing Figure 9, it is evident that the ML-ELM model outperforms the ELM model. Both ML-ELM and ELM are neural network models that are frequently used for regression analysis to predict continuous variables. The ML-ELM model comprises multiple hidden layers with neurons that receive input data and activate based on the input values. Each neuron in the hidden layer uses a non-linear activation function to combine weighted connections from the previous layer.
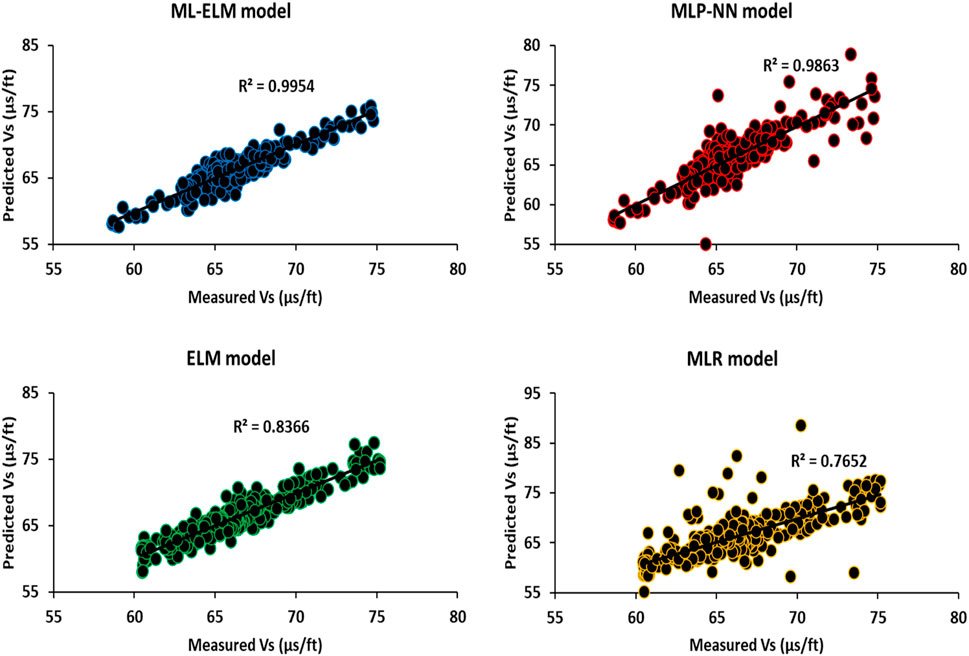
Figure 9. Illustration of the cross-plot diagram for testing subset for prediction of Vs (based on ELM and ML-ELM models) to determination of the and enhance the seismic safety of hydropower stations.
Figure 10 show the histograms of the Vs prediction errors for the four ML models used in this article: ML-ELM, MLP-NN, MLR and ELM. As shown in Figure 10, the prediction errors for the ML models are symmetrically distributed around zero and approximate normal distributions. The spreads are relatively narrow, and there are no positive or negative biases observed. The ML-ELM model is associated with the lowest Vs prediction error range. The figure also shows that the accuracy performance of the ML models follows the order ML-ELM > ELM > MLP-NN > MLR.
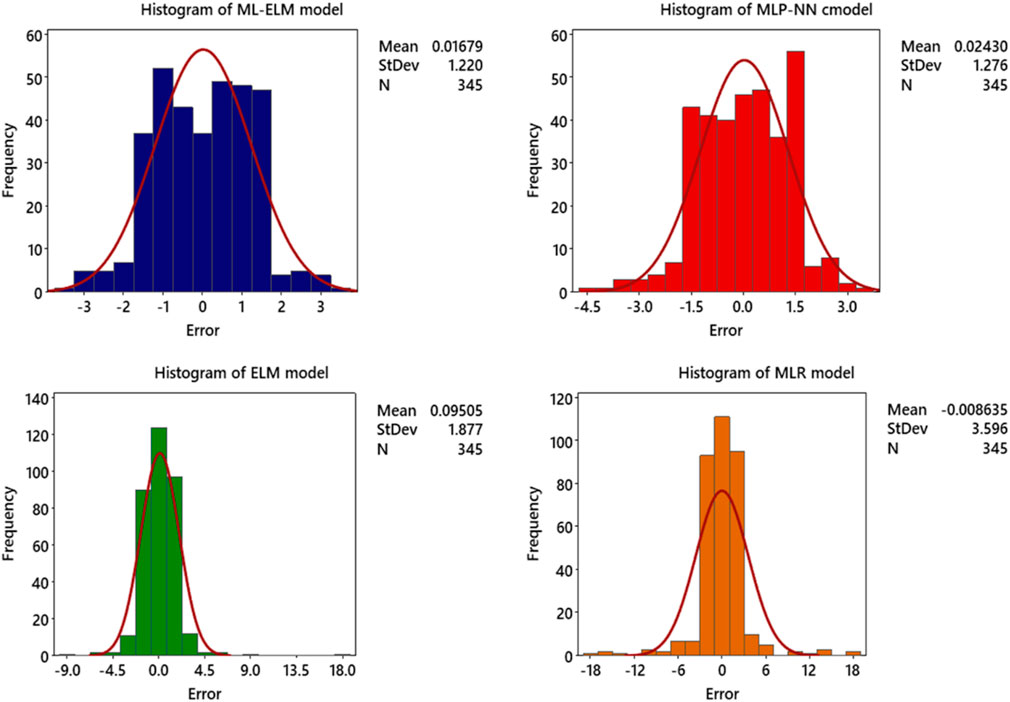
Figure 10. Illustration of the Histogram of Error for prediction of Vs (based on MLR, MLP-NN, ELM and ML-ELM models) to determination of the and enhance the seismic safety of hydropower stations.
A practical approach to evaluating the impact of input variables on output variables involves using the Pearson correlation (as represented by Eq. 8). This metric operates simply, where a score of +1 indicates a complete and positive correlation, −1 signifies a complete and negative correlation, and zero denotes no correlation between the variables. This method offers valuable insights into the interplay of various factors, facilitating comprehension of their influence on the final result.
After investigating the results derived from the correlation coefficient regarding both the input variables and the Vs, it is evident that parameters such as GR, Hall-S, Hall-H, Vp, TNPHI, RHOB, and PEF exhibit a positive correlation coefficient with the Vs as shown in Eq. 9. Conversely, parameters MD and RT show a negative correlation coefficient with the output parameter, as shown in Eq. 10. Additionally, according to Figure 11, certain variables such as Vp, GR, Hall-S, Hall-H, PEF, and RHOB significantly influence the Vp.
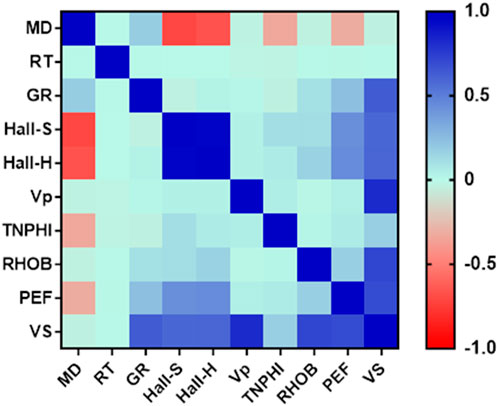
Figure 11. Illustration of the heat map for input/output variable and determination of the correlation coefficient for prediction of Vs (based on MLR, MLP-NN, ELM and ML-ELM models) to determination of the and enhance the seismic safety of hydropower stations.
The Anderson-Darling normality chart is a tool used to assess the normality of data distribution by plotting cumulative probability (P) against standardized values (Vs), where data points should ideally fall along a straight line if the distribution is normal. However, analysis reveals that the data distribution for both the MLR and MLP-NN models deviates notably from normality, evidenced by their respective Anomaly Distance (AD) values of 3.508 and 3.007, along with p values below 0.005. Conversely, the ELM model displays a somewhat normal distribution, with a slight deviation indicated by an AD of 2.826 and p-value under 0.005. Remarkably, the ML-ELM model demonstrates the most normal distribution among the four models, with an AD of 2.031 and p-value below 0.005. This suggests greater accuracy in predictions for the ML-ELM model compared to the others. The Anderson-Darling normality Figure 12 serves as a valuable tool for evaluating data distribution normality and model accuracy. Based on these findings, it is evident that the ML-ELM model stands out as the most accurate, while the MLP-NN and MLR models exhibit the least accuracy due to their significant departure from normality.
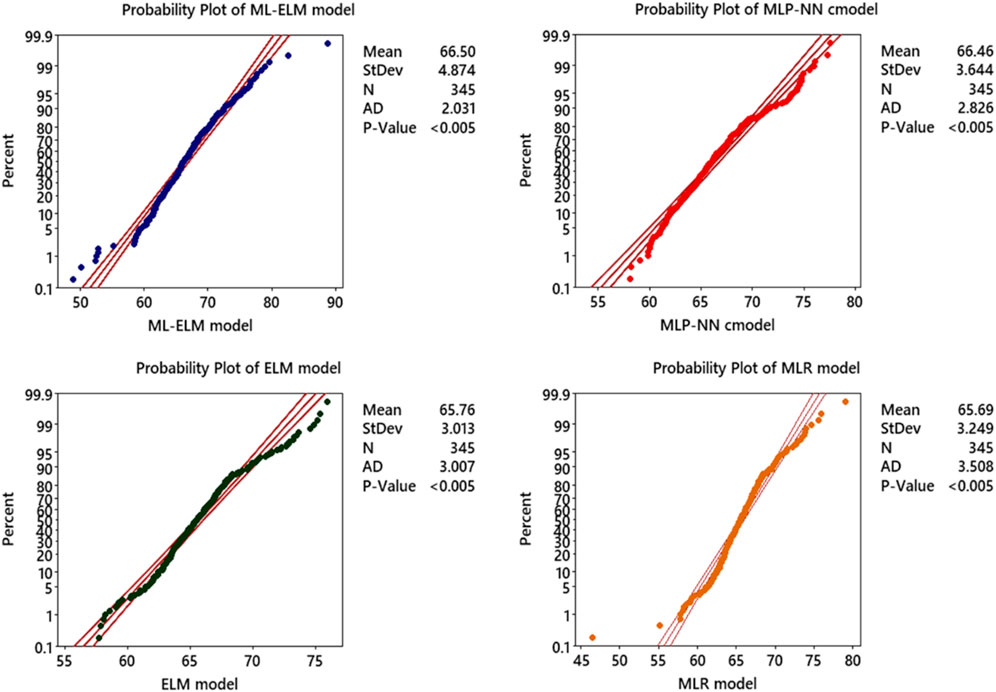
Figure 12. Illustration of the Analysis of Anderson–Darling analysis for prediction of Vs based on four ML models (ML-ELM, ELM, MLP-NN and MLR) to determination of the and enhance the seismic safety of hydropower stations.
Another method for comparing model performance is “Score Analysis.” In this approach, each model is assigned a score based on its performance relative to the best and worst values of each performance parameter. Specifically, a score of “n” is assigned to the model with the best value for a parameter, where in this study, n equals 12, representing the number of computational models under analysis. Conversely, a score of 1 is given to the model with the worst value for the same parameter, separately for both training and testing results. Subsequently, the total score for each model is computed by summing up its individual scores. In this article, each statistical parameter receives a designated score. Graphical Table 4, show a comparison of the total scores for the models used in predicting the Site Score. As depicted in the table, the total scores for ML-ELM, ELM, MLP-NN and MLR across the three subsets are 109, 105, 97, and 79, respectively. Hence, it is inferred that the accuracy ranking of the models is MLR < ELM < MLP-NN < ML-ELM.
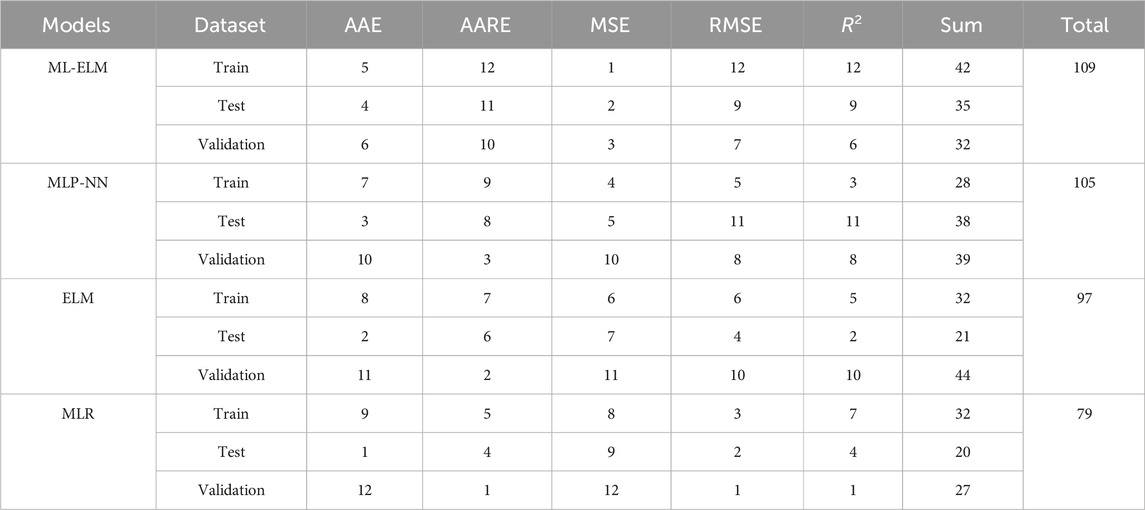
Table 4. Determination of the comparative analysis for four ML models for prediction of Vs to determination of the and enhance the seismic safety of hydropower stations.
Figure 13 illustrates the Taylor diagram, utilized to compare the performance of ML-ELM, ELM, MLP-NN, and MLR models for predicting Vs and enhancing seismic safety at hydropower stations. The x-axis represents the correlation coefficient, ranging from 0 to 1, indicating the correlation between predicted and actual values. A correlation coefficient closer to 1 signifies better model performance. The y-axis denotes the standard deviation, reflecting the dispersion of predicted values. A smaller standard deviation implies greater model accuracy. As depicted, the ML-ELM model exhibits superior performance among the four models, boasting a correlation coefficient of 0.99 and a standard deviation of 0.2. This indicates high accuracy and low dispersion in its predictions. Subsequently, model performance descends in accuracy from MLP-NN, ELM, to MLR.
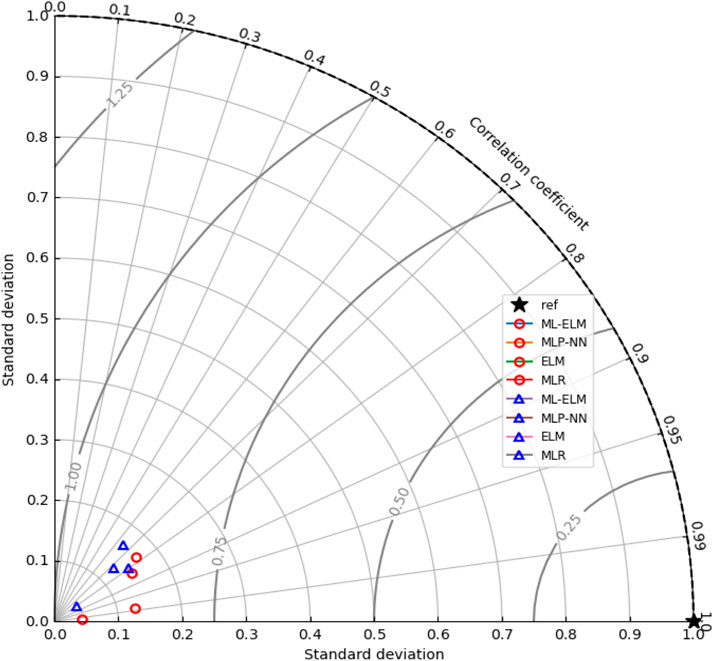
Figure 13. Illustration of the Tylor Diagram for prediction of Vs based on four ML models (ML-ELM, ELM, MLP-NN and MLR) to determination of the and enhance the seismic safety of hydropower stations.
3.4 Shallow and deep learning competition
As shown in the results of this article, both ELM and ML-ELM exhibit higher accuracy compared to other ML models (MLPNN and MLR). In this section, the differences between these two robust ML models are explored. ELM is a single-layer neural network that uses random weights to map input data to output data. The hidden layer of an ELM comprises a large number of neurons, with randomly generated weights between the input layer and hidden layer. The output layer is then trained using a linear regression model to minimize the error between the predicted output and the actual output. On the other hand, ML-ELM is a multi-layer neural network consisting of multiple hidden layers. Each hidden layer in ML-ELM performs a non-linear transformation on the input data before passing it to the next layer. The weights between each layer are trained using backpropagation, adjusting the weights based on the error between predicted output and actual output. The main advantage of ELM over ML-ELM lies in its simplicity and speed. Since ELM has only one hidden layer with random weights, it can be trained much faster than ML-ELM. Additionally, ELM requires fewer computational resources since it does not involve backpropagation. However, ML-ELM also offers advantages over ELM. With multiple hidden layers featuring non-linear transformations, ML-ELM can learn more complex patterns in data, making it more suitable for tasks requiring high accuracy and precision.
3.5 Practical application and limitations
Determining the shear modulus of bedrock is important for superstructures because it helps to understand the ability of the bedrock to resist shearing forces (Van Nguyen et al., 2017). This information is essential in assessing the stability and safety of large structures such as bridges, dams, high-rise buildings, or any structure that has to withstand significant loads. It is also important in designing the appropriate foundation for the structure. In the case of a hydropower station, determining the shear modulus of the foundation bedrock is important in several ways. The shear modulus information enables the engineers to estimate how much load the foundation can support without collapsing or causing any damage to the construction. Moreover, it helps in judging the depth and thickness of the foundation required to ensure the efficient and safe operation of the hydropower station for an extended period. Furthermore, knowing the shear modulus helps in designing a suitable dam foundation that can resist the forces of water pressure and sedimentation. This essential information allows the engineers to design the most resilient dam foundation that will aid in ensuring the efficient operation of the hydropower station, reducing the risk of failure and increasing its lifespan. The primary constraint of this research is the challenge in acquiring petrophysical data exclusive to oil and gas wells, which must be obtained in proximity to hydropower stations within dam structures. While many regions may lack the advantage of oil-rich areas and oil wells being located near hydropower facilities, in regions where such proximity exists, the findings of this study can be effectively applied.
This study has provided an estimation of data that is used following a verification process to construct a calculating model for the shear modulus parameter. Due to the nature of dynamic recording by petrophysical charts, the data needs to be converted into static form in order to be able to use advanced soil/rock mechanics models. Data conversion from dynamic to static form is done by empirical correlation. The converting procedure is validated by conducting a regression model between estimated variables and actual tri-axial static mechanical tests on some core samples extracted from two under-construction dam sites. The framework of the conversation procedure is exhibited in Figure 14. Finally, an integrated depth-dependent data model of the shear modulus of rock layers is created based on the atomic physics and structural features of the rock by ML models. The continuous display of the shear modulus related to the rock layers in this research is shown in Figure 15.
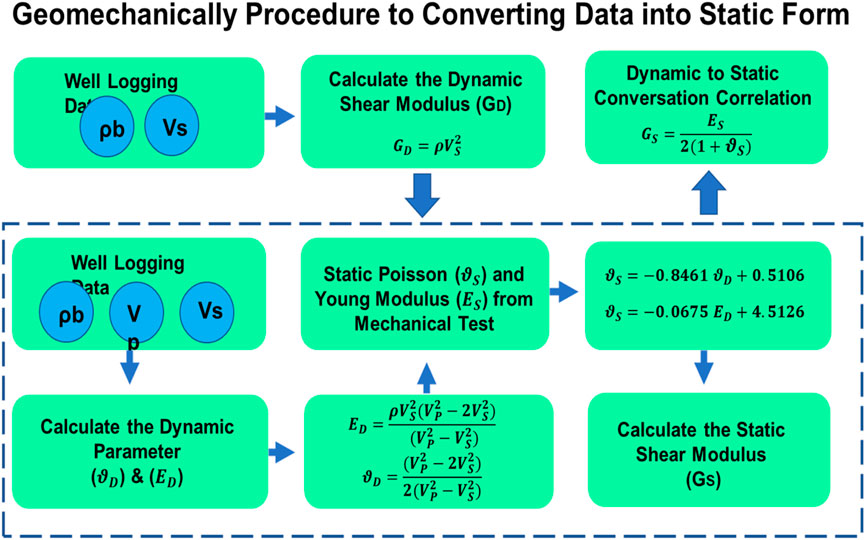
Figure 14. Geomechanically framework for dynamic to static conversation.
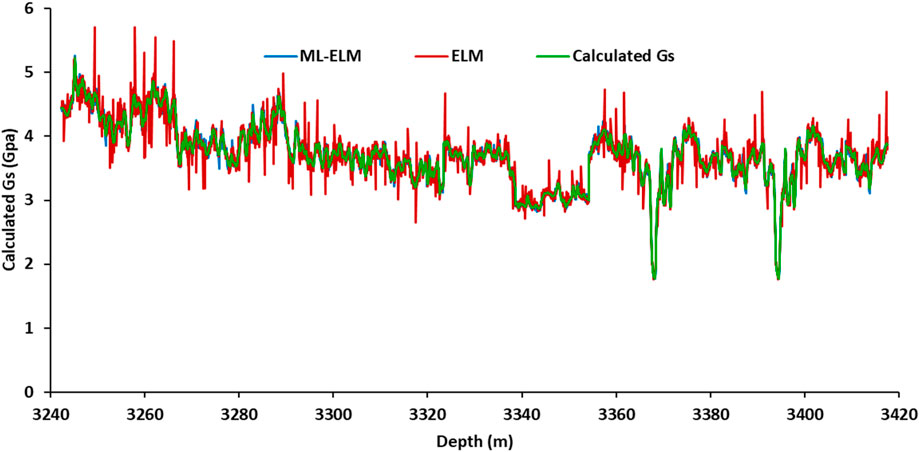
Figure 15. Shear modulus of underground rocks determined by ML models for prediction of Vs to determination of the and enhance the seismic safety of hydropower stations.
4 Conclusion
In this study, a large dataset of 3,200 data points was analyzed to gain insights into the rock formations of hydropower plants’ foundations. The dataset contained information about Measured Depth (MD), Rock Type (RT), Gamma Ray Log (GR), Thermal Neutron Porosity (TNPHI), Shallow Electrical Resistivity (Hall-S), Deep Electrical Resistivity (Hall-D), Photo-electric Index (PEF), Compressive Wave Velocity (Vp), and shear wave velocity (Vs) recorded during vertical seismic logging. Additionally, full-set borehole logging data were used for predicting Vs. To prevent overfitting, cross-validation was used. The study used four newly developed models, multiple linear regression (MLR), ML-ELM, multilayer perceptron neural network (MLP-NN) and extreme learning machine (ELM), to predict Vs. The results shown that four ML models outperformed available empirical correlations for predicting Vs. Although ELM is simpler and faster than ML-ELM since it has only one hidden layer with random weights and does not involve backpropagation, ML-ELM has the advantage of learning more complex patterns in data due to its multiple hidden layers with non-linear transformations. The ML-ELM model achieved higher prediction accuracy than other models which used in this article with an RMSE = 0.0412 μs/ft, AARE = 1.545%, and R2 = 0.9963 compared to ELM, MLR and MLP-NN and empirical models. The ML-ELM model also generated fewer outlier data predictions than other ML models evaluated. These results suggest that the ML-ELM model is a promising tool for predicting Vs in similar settings. Further research could explore the effectiveness of the ML-ELM model on other datasets and its potential application in practical scenarios. Seismic activity is highly complex, and even with advanced data analytics tools, there are still many unknown factors that influence when and where an earthquake will strike. As such, current efforts are focused on improving our understanding of seismic phenomena and developing more sophisticated tools to detect and respond to earthquakes as they occur.
Data availability statement
The data analyzed in this study is subject to the following licenses/restrictions: The datasets will be available from the corresponding author at reasonable request. Requests to access these datasets should be directed to hamzehghobani68@yahoo.com.
Author contributions
TS: Conceptualization, Formal Analysis, Funding acquisition, Methodology, Project administration, Software, Writing–original draft, Writing–review and editing. DG: Conceptualization, Formal Analysis, Funding acquisition, Methodology, Project administration, Resources, Software, Writing–original draft, Writing–review and editing. ZW: Conceptualization, Formal Analysis, Funding acquisition, Methodology, Project administration, Software, Writing–original draft, Writing–review and editing. HGH: Conceptualization, Data curation, Formal Analysis, Investigation, Methodology, Project administration, Resources, Software, Visualization, Writing–original draft, Writing–review and editing.
Funding
The authors declare that no financial support was received for the research, authorship, and/or publication of this article.
Acknowledgments
The authors only used the Chat GPT tool in order to improve the English grammar of the introduction.
Conflict of interest
Authors TS, DG, and ZW were employed by Changjiang Water Resources and Hydropower Development Group (Hubei) Co., Ltd.
The remaining author declares that the research was conducted in the absence of any commercial or financial relationships that could be construed as a potential conflict of interest.
Publisher’s note
All claims expressed in this article are solely those of the authors and do not necessarily represent those of their affiliated organizations, or those of the publisher, the editors and the reviewers. Any product that may be evaluated in this article, or claim that may be made by its manufacturer, is not guaranteed or endorsed by the publisher.
Abbreviations
AARE, Absolute average relative; ARE, Average relative error; BP, Backpropagation; DNN, Deep neural network; ELM, Extreme learning machine; FNN, Feedforward neural networks; GMA, Ground motion amplification; GR, Gamma ray properties; LSTM, Long short-term memory; MD, Depth; ML, Machine learning; ML-ELM, Multi-layer extreme learning machine; MLP-NN, Multilayer Perceptron neural network; MSE, Mean square error; R2, R-square; RES, Electrical resistivity log; RHOB, Bulk density; RMSE, Square error; RMSE, Root square error; RT, Rock type; SD, Standard deviation; Vs, Shear wave velocity; VP, Compressional wave velocity; VSP, Vertical seismic profile; TNPHI, Thermal neutron porosity.
References
Adjei, F., Afare, P., and Osae, T. (2020). Predicting of shear wave velocity using Artificial Neural Networks. Available at: https://arxiv.org/abs/2011.12109.
Afzal, S., Shokri, A., Ziapour, B. M., Shakibi, H., and Sobhani, B. (2024). Building energy consumption prediction and optimization using different neural network-assisted models; comparison of different networks and optimization algorithms. Eng. Appl. Artif. Intell. 127, 107356. doi:10.1016/j.engappai.2023.107356
Albadawy, E. A., Saha, A., and Mazurowski, M. A. (2018). Deep learning for segmentation of brain tumors: impact of cross-institutional training and testing. Med. Phys. 45, 1150–1158. doi:10.1002/mp.12752
Alqadhi, S., Mallick, J., Balha, A., Bindajam, A., Singh, C. K., and Hoa, P. V. (2021). Spatial and decadal prediction of land use/land cover using multi-layer perceptron-neural network (MLP-NN) algorithm for a semi-arid region of Asir, Saudi Arabia. Earth Sci. Inf. 14, 1547–1562. doi:10.1007/s12145-021-00633-2
Antonovskaya, G., Kapustian, N., Basakina, I., Afonin, N., and Moshkunov, K. (2019). Hydropower dam state and its foundation soil survey using industrial seismic oscillations. Geosciences 9, 187. doi:10.3390/geosciences9040187
Baghirli, O. (2015). "Comparison of Lavenberg-Marquardt, scaled conjugate gradient and Bayesian regularization backpropagation algorithms for multistep ahead wind speed forecasting using multilayer perceptron feedforward neural network".).
Bailey, T., and Dutton, D. (2012). "An empirical vp/vs shale trend for the kimmeridge clay of the central North Sea":the Netherlands, EAGE Publications BV), cp-293.
Barton, N. (2006) Rock quality, seismic velocity, attenuation and anisotropy. Boca Raton, Florida, United States: CRC Press.
Bui, K. T. T., Torres, J. F., Gutiérrez-Avilés, D., Nhu, V. H., Bui, D. T., and Martínez-Álvarez, F. (2022). Deformation forecasting of a hydropower dam by hybridizing a long short-term memory deep learning network with the coronavirus optimization algorithm. Computer-Aided Civ. Infrastructure Eng. 37, 1368–1386. doi:10.1111/mice.12810
Cao, X., Chen, L., Chen, J., Li, J., Lu, W., Liu, H., et al. (2023). Seismic damage identification of high arch dams based on an unsupervised deep learning approach. Soil Dyn. Earthq. Eng. 168, 107834. doi:10.1016/j.soildyn.2023.107834
Deng, C., Huang, G., Xu, J., and Tang, J. (2015). Extreme learning machines: new trends and applications. Sci. China. Inf. Sci. 58, 1–16. doi:10.1007/s11432-014-5269-3
Derakhshani, A., and Foruzan, A. H. (2019). Predicting the principal strong ground motion parameters: a deep learning approach. Appl. Soft Comput. 80, 192–201. doi:10.1016/j.asoc.2019.03.029
El-Bably, D. L., and Fouad, K. M. (2022). A hybrid approach for improving data classification based on PCA and enhanced ELM. Int. J. Adv. Intell. Paradigms 23, 1–247. doi:10.1504/ijaip.2018.10013881
Garcia, M. A., Salamero, L. M., and Jammes, B. (2005). Study of support vector machines and comparison with the multi-layer perceptron for 3D non-linear data regression. aut. ind. elec. eng, Univ. Rovira I Virgili Spain.
Goodman, R. E. (1991) Introduction to rock mechanics. Hoboken, New Jersey, United States: John Wiley and Sons.
Han, Z., Li, Y., Zhao, Z., and Zhang, B. (2022). An Online safety monitoring system of hydropower station based on expert system. Energy Rep. 8, 1552–1567. doi:10.1016/j.egyr.2022.02.040
Hariri-Ardebili, M. A., and Pourkamali-Anaraki, F. (2018a). Simplified reliability analysis of multi hazard risk in gravity dams via machine learning techniques. Archives Civ. Mech. Eng. 18, 592–610. doi:10.1016/j.acme.2017.09.003
Hariri-Ardebili, M. A., and Pourkamali-Anaraki, F. (2018b). Support vector machine based reliability analysis of concrete dams. Soil Dyn. Earthq. Eng. 104, 276–295. doi:10.1016/j.soildyn.2017.09.016
Hossain, Z., Mukerji, T., and Fabricius, I. L. (2012). Vp-Vs relationship and amplitude variation with offset modelling of glauconitic greensand‡. Geophys. Prospect. 60, 117–137. doi:10.1111/j.1365-2478.2011.00968.x
Huang, F., Lu, J., Tao, J., Li, L., Tan, X., and Liu, P. (2019). Research on optimization methods of ELM classification algorithm for hyperspectral remote sensing images. IEEE Access 7, 108070–108089. doi:10.1109/access.2019.2932909
Hussien, M. N., and Karray, M. (2015). Shear wave velocity as a geotechnical parameter: an overview. Can. Geotechnical J. 53, 252–272. doi:10.1139/cgj-2014-0524
Jiang, S., Lian, M., Lu, C., Ruan, S., Wang, Z., and Chen, B. (2019). SVM-DS fusion based soft fault detection and diagnosis in solar water heaters. Energy Explor. Exploitation 37, 1125–1146. doi:10.1177/0144598718816604
Kaur, R., Roul, R. K., and Batra, S. (2023). Multilayer extreme learning machine: a systematic review. Multimedia Tools Appl. 82, 40269–40307. doi:10.1007/s11042-023-14634-4
Keefer, D. K. (1984). Landslides caused by earthquakes. Geol. Soc. Am. Bull. 95, 406–421. doi:10.1130/0016-7606(1984)95<406:lcbe>2.0.co;2
Kim, S., Hwang, Y., Seo, H., and Kim, B. (2020). Ground motion amplification models for Japan using machine learning techniques. Soil Dyn. Earthq. Eng. 132, 106095. doi:10.1016/j.soildyn.2020.106095
Krishna, K. S., Gopala Rao, D., Prabhakar S Murty, G., and Ramana, Y. V. (1989). Sound velocity, density, and related properties along a transect across the Bay of Bengal. Geo-marine Lett. 9, 95–102. doi:10.1007/bf02430430
Lee, M. W. (2013) Comparison of methods for predicting shear-wave velocities of unconsolidated shallow sediments in the Gulf of Mexico. Reston, VA, USA: US Department of the Interior, US Geological Survey Reston.
Lee, V. W., and Trifunac, M. D. (2010). Should average shear-wave velocity in the top 30 m of soil be used to describe seismic amplification? Soil Dyn. Earthq. Eng. 30, 1250–1258. doi:10.1016/j.soildyn.2010.05.007
Li, A., Dai, F., Wu, W., Liu, Y., Liu, K., and Wang, K. (2022). Deformation characteristics of sidewall and anchorage mechanisms of prestressed cables in layered rock strata dipping steeply into the inner space of underground powerhouse cavern. Int. J. Rock Mech. Min. Sci. 159, 105234. doi:10.1016/j.ijrmms.2022.105234
Liu, A., Chen, K., and Wu, J. (2010). State of art of seismic design and seismic hazard analysis for oil and gas pipeline system. Earthq. Sci. 23, 259–263. doi:10.1007/s11589-010-0721-y
Maleki, S., Moradzadeh, A., Riabi, R. G., Gholami, R., and Sadeghzadeh, F. (2014). Prediction of shear wave velocity using empirical correlations and artificial intelligence methods. NRIAG J. Astronomy Geophys. 3, 70–81. doi:10.1016/j.nrjag.2014.05.001
Miller, S. L. M., and Stewart, R. R. (1990). Effects of lithology, porosity and shaliness on P-and S-wave velocities from sonic logs. Can. J. Explor. Geophys. 26, 94–103.
Ohta, Y., and Goto, N. (1978). Empirical shear wave velocity equations in terms of characteristic soil indexes. Earthq. Eng. Struct. Dyn. 6, 167–187. doi:10.1002/eqe.4290060205
Owen, A. B., and Perry, P. O. (2009). Bi-cross-validation of the SVD and the nonnegative matrix factorization. Ann. Appl. Statistics 3. doi:10.1214/08-aoas227
Ramakrishna, K., Ramam, V. A., and Rao, R. S. (2014). Mathematical neural network (MaNN) models Part VI: single-layer perceptron [SLP] and multi-layer perceptron [MLP] neural networks in ChEM-lab. J. Appl. Chem. 3, 2209–2311.
Rico, J., Barateiro, J., Mata, J., Antunes, A., and Cardoso, E. (2019). Applying advanced data analytics and machine learning to enhance the safety control of dams. Mach. Learn. Paradigms Appl. Learn. Anal. Intelligent Syst., 315–350. doi:10.1007/978-3-030-15628-2_10
Salahdin, O. D., Salih, S. M., Jalil, A. T., Aravindhan, S., Abdulkadhm, M. M., and Huang, H. (2022). Current challenges in seismic drilling operations: a new perspective for petroleum industries. Asian J. Water, Environ. Pollut. 19, 69–74. doi:10.3233/ajw220041
Schratz, P., Muenchow, J., Iturritxa, E., Richter, J., and Brenning, A. (2019). Hyperparameter tuning and performance assessment of statistical and machine-learning algorithms using spatial data. Ecol. Model. 406, 109–120. doi:10.1016/j.ecolmodel.2019.06.002
Shams, S. R., Jahani, A., Kalantary, S., Moeinaddini, M., and Khorasani, N. (2021). The evaluation on artificial neural networks (ANN) and multiple linear regressions (MLR) models for predicting SO2 concentration. Urban Clim. 37, 100837. doi:10.1016/j.uclim.2021.100837
Shao, D., Li, T., Han, L., and Li, Y. (2022). Noise suppression of distributed acoustic sensing vertical seismic profile data based on time–frequency analysis. Acta Geophys. 70, 1539–1549. doi:10.1007/s11600-022-00820-9
Shreedharan, S., Bolton, D. C., Rivière, J., and Marone, C. (2021). Machine learning predicts the timing and shear stress evolution of lab earthquakes using active seismic monitoring of fault zone processes. J. Geophys. Res. Solid Earth 126, e2020JB021588. doi:10.1029/2020jb021588
Siegel, F. R. (2016) Mitigation of dangers from natural and anthropogenic hazards: prediction, prevention, and preparedness. Berlin, Germany: Springer.
Tang, J., Deng, C., Huang, G.-B., and Hou, J. (2014). “A fast learning algorithm for multi-layer extreme learning machine,” in 2014 IEEE International Conference on Image Processing (ICIP), Paris, France, October, 2014, 175–178. doi:10.1109/icip.2014.7025034
Tang, X., Chen, A., and He, J. (2022). A modelling approach based on Bayesian networks for dam risk analysis: integration of machine learning algorithm and domain knowledge. Int. J. Disaster Risk Reduct. 71, 102818. doi:10.1016/j.ijdrr.2022.102818
Van Nguyen, Q., Fatahi, B., and Hokmabadi, A. S. (2017). Influence of size and load-bearing mechanism of piles on seismic performance of buildings considering soil–pile–structure interaction. Int. J. Geomechanics 17, 04017007. doi:10.1061/(asce)gm.1943-5622.0000869
Verma, M., Singh, R. J., and Bansal, B. K. (2014). Soft sediments and damage pattern: a few case studies from large Indian earthquakes vis-a-vis seismic risk evaluation. Nat. hazards 74, 1829–1851. doi:10.1007/s11069-014-1283-4
Wang, B., Li, Y., Zhao, W., Zhang, Z., Zhang, Y., and Wang, Z. (2019). Effective crack damage detection using multilayer sparse feature representation and incremental extreme learning machine. Appl. Sci. 9, 614. doi:10.3390/app9030614
Wang, C., Zhang, H., Zhang, Y., Guo, L., Wang, Y., and Thira Htun, T. T. (2021). Influences on the seismic response of a gravity dam with different foundation and reservoir modeling assumptions. Water 13, 3072. doi:10.3390/w13213072
Won, J., and Shin, J. (2021). Machine learning-based approach for seismic damage prediction method of building structures considering soil-structure interaction. Sustainability 13, 4334. doi:10.3390/su13084334
Yao, Y., Wang, J., Zhang, Y., Niu, W., and Yang, Z. (2022). Research on safety and emergency management of hydropower engineering in China. Earth 11, 35–49. doi:10.11648/j.earth.20221102.12
Zaefizadeh, M., Jalili, A., Khayatnezhad, M., Gholamin, R., and Mokhtari, T. (2011). Comparison of multiple linear regressions (MLR) and artificial neural network (ANN) in predicting the yield using its components in the hulless barley. Adv. Environ. Biol., 109–114.
Zare Abyaneh, H. (2014). Evaluation of multivariate linear regression and artificial neural networks in prediction of water quality parameters. J. Environ. Health Sci. Eng. 12, 40–48. doi:10.1186/2052-336x-12-40
Zhang, J., Li, C., Yin, Y., Zhang, J., and Grzegorzek, M. (2023). Applications of artificial neural networks in microorganism image analysis: a comprehensive review from conventional multilayer perceptron to popular convolutional neural network and potential visual transformer. Artif. Intell. Rev. 56, 1013–1070. doi:10.1007/s10462-022-10192-7
Zhang, Y., Xie, Y., Zhang, Y., Qiu, J., and Wu, S. (2021). The adoption of deep neural network (DNN) to the prediction of soil liquefaction based on shear wave velocity. Bull. Eng. Geol. Environ. 80, 5053–5060. doi:10.1007/s10064-021-02250-1
Keywords: hydropower station, safety, earthquake, shear wave velocity, machine learning
Citation: Song T, Guan D, Wang Z and Ghorbani H (2024) Maximizing hydropower station safety against earthquake through extreme learning machine-enabled shear waves velocity prediction. Front. Environ. Sci. 12:1414461. doi: 10.3389/fenvs.2024.1414461
Received: 08 April 2024; Accepted: 20 May 2024;
Published: 18 June 2024.
Edited by:
Yong Q. Tian, Central Michigan University, United StatesReviewed by:
Salim Heddam, University of Skikda, AlgeriaGiovanni Martinelli, National Institute of Geophysics and Volcanology, Italy
Copyright © 2024 Song, Guan, Wang and Ghorbani. This is an open-access article distributed under the terms of the Creative Commons Attribution License (CC BY). The use, distribution or reproduction in other forums is permitted, provided the original author(s) and the copyright owner(s) are credited and that the original publication in this journal is cited, in accordance with accepted academic practice. No use, distribution or reproduction is permitted which does not comply with these terms.
*Correspondence: Tao Song, song.t@crhdc.com.cn; Hamzeh Ghorbani, hamzehghorbani68@yahoo.com