 Lu Zhi
 Yuanlong Chai
 Chaowei Sun4
- 1School of Geography and Tourism, Zhengzhou Normal University, Zhengzhou, China
- 2Key Laboratory of Southeast Coast Marine Information Intelligent Perception and Application, Ministry of Natural Resources, Zhangzhou, China
- 3Institute of Data and Target Engineering, PLA Strategic Support Force Information Engineering University, Zhengzhou, China
- 4Henan Academy of Sciences, Zhengzhou, China
Net ecosystem productivity (NEP) is a crucial parameter for assessing the carbon cycle dynamics in terrestrial ecosystems. This study analyzed the spatial and temporal evolution characteristics and future trends of NEP in Henan Province over the past 20 years based on MOD17A3HGF, meteorological, and land-use data, employing the frequency counting method, trend test, Hurst index, and the center of gravity model. Various areas of changes in vegetation carbon sequestration were explored, and the driving factors were quantitatively assessed through correlation analysis, Sankey diagrams, and Geodetector. The results demonstrate that: 1) Continuous temporal changes in NEP in Henan, with annual average values fluctuating between 272.84 and 451.39 gC·m-2·a1, exhibiting an overall upward trend. 2) Spatially, there is a distinct distribution of NEP, concentrating more in the south and less in the north. While the study area generally experiences a dominant gradual enhancement of vegetation carbon sequestration capacity, the middle and north of Zhengzhou City exhibit a significant decline, which is expected to persist in the future. The migration of the centers of gravity of NEP over the past 20 years is characterized by stage-specific differentiation. 3) Among the various land cover types, forests have the strongest carbon sequestration capacity; however, cropland emerges as the province’s main source of NEP due to its extensive size. 4) The driving factors for spatial differentiation in NEP exhibit some temporal variability. Overall, climate factors and atmospheric pollution exert stronger influences, with the interactive explanatory power of the two-factor interaction being higher than that of the single factor. The results of this study can serve as a scientific theoretical basis for ecological policy-making and sustainable development in Henan Province.
1 Introduction
Vegetation is a vital component of terrestrial ecosystems and plays a crucial role in mitigating climate warming (Arora, 2002; Peng J. et al., 2023; Ma et al., 2023). Net ecosystem productivity (NEP) refers to the net accumulation of organic matter by vegetation through photosynthesis, subtracting the portion consumed by autotrophic and heterotrophic respiration. NEP can directly reflect the carbon sequestration capacity of vegetation (Malhi et al., 2021; Wang et al., 2021). Terrestrial ecosystems function as carbon sinks when NEP is positive, transforming into carbon sources when NEP is negative (Cao et al., 2022). Exploring the spatial and temporal evolution of NEP and its driving mechanisms is essential for effective natural resource management, environmental protection, ecological restoration initiatives, and the implementation of the “dual-carbon” strategic goal. In recent years, this field of study has emerged as an important focal point for both domestic and international research on the terrestrial carbon cycle.
Scholars globally have carried out numerous studies on the NEP, mainly focusing on the NEP estimation models (Loescher et al., 2003), spatial and temporal distributions (Aubinet et al., 2018), predictions of future changes (Lue et al., 2023), analysis of influencing factors (Harenda et al., 2021; Liu K. et al., 2023), and carbon sequestration capacities of individual terrestrial ecosystems (Peng R. et al., 2023; Zhu et al., 2023). The scope of these studies focuses on cross-boundary (Zhang et al., 2021), national (Nayak et al., 2015; Zhang et al., 2020), provincial (municipal/county) administrative units (Zhang et al., 2015), ecological functional subregions, and watersheds (Zhou et al., 2023). The early NEP estimation methods, relying heavily on the survey method, were unsuitable for long-term, large-scale studies due to high sampling costs, discontinuous observation data, and limited coverage (Liu D. et al., 2023). Currently, simulations to estimate NEP mainly utilize statistical models, light energy utilization models, and ecological process models (Piao et al., 2022).
In terms of the distribution of carbon sinks/sources, the spatial pattern of NEP exhibits significant regional variability. In China, areas where vegetation acts as a carbon source are mainly concentrated in regions facing ecological challenges such as sandification, salinization, and rocky desertification, exemplified by Tibet (Wu D. et al., 2022), Qinghai (Liu et al., 2021), western Jilin, and the northern part of the Shiyang River Basin. In terms of influencing factors, the current research focuses mainly on exploring the influence of climate and topographic factors on NEP. These studies have found distinct regional variability in the response factors affecting spatial and temporal changes in NEP. For example, precipitation emerges as the dominant factor in Jiangsu Province, Loess Plateau, and Yellow River Basin (Cao et al., 2022). In Anhui Province, precipitation shows a weak correlation, with leaf area index and CO2 being the main influencing factors (Hua et al., 2023). In the Bailongjiang Basin of Gansu Province, topographic factors exert a substantial influence, with shady slopes exhibiting a stronger carbon sink capacity than sunny slopes (Gong et al., 2017). Across various terrestrial ecosystems, forests have been found to demonstrate a more pronounced carbon sequestration capacity of forests (Yang et al., 2022). Spatial and temporal distribution patterns of NEP are diverse, influenced by the distinct geographic and climatic conditions of each study area. The dominant factors driving these changes vary, highlighting the importance of considering regional characteristics to accurately assess carbon sequestration capacity. This is crucial for crafting effective ecological policies and environmental protection initiatives tailored to local conditions, emphasizing the need for further in-depth research.
Located in the middle and lower reaches of the Yellow River, Henan Province is an important food production base, an ecological security barrier, and a densely populated province. It ranks second in carbon emissions among the central and eastern regions of China (Wang C. et al., 2022; Wei et al., 2023). Dominated by cropland and possessing limited forest resources, Henan Province faces significant ecological and environmental pressures with climate change and accelerated urbanization (Fan et al., 2023; Yang et al., 2023). Mapping the vegetation carbon sequestration capacity in Henan Province is pivotal for ecosystem balance, regional resource planning, food production security, and the high-quality development of the Yellow River Basin. The few existing studies on vegetation carbon sequestration in Henan Province have mostly focused on vegetation cover (Li et al., 2015) and vegetation primary productivity analysis (Liu et al., 2021), with limited exploration of the change in net ecosystem productivity of vegetation. These studies largely overlook the influence of atmospheric pollution on vegetation carbon sequestration.
Given these research gaps, this study employs NEP as an indicator and adopts the center of gravity model, Hurst index, and Geodetector to comprehensively assess the spatial and temporal evolution characteristics of vegetation carbon sequestration capacity in Henan Province from 2001 to 2020. The primary objectives of this study include identifying various influencing factors, exploring key areas of change, and predicting future trends. The findings can provide scientific data supporting the formulation of resource utilization policies, ecosystem protection measures, and the implementation of the “dual-carbon” policy in the region.
2 Study area and data
2.1 Study area
Henan Province (31°23′-36°22′E, 110°21′-116°39′N) spans four major river basins: the Yellow River, the Hai River, the Huai River, and the Yangtze River. Covering a total area of 1,65,700 square kilometers, the province comprises 18 prefectural-level municipalities, including Zhengzhou, Kaifeng, and Luoyang (Figure 1).
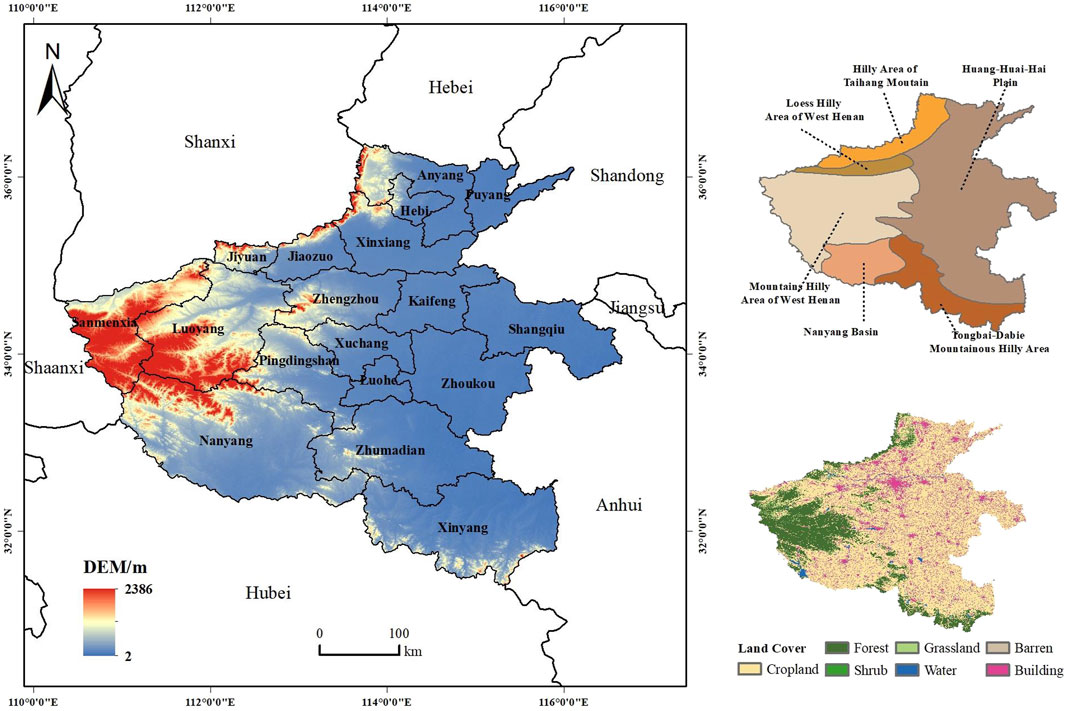
Figure 1. Overview of the study area.
Henan Province is situated in the transitional zone from the second ladder to the third ladder in China. The province is surrounded by mountains in the north, west, and south, with plains in the central and eastern regions, forming a distinct geomorphological pattern known as “three mountains and one plain,” where the west is elevated while the east is relatively low. The temperature increases from the west to the southeast, ranging between 5.8°C and 16.9°C. Annual precipitation follows a pattern of increasing values from the northeast to the southwest, varying from around 559 to 1,479 mm. Henan experiences a transition from a northern subtropical to a warm temperate continental monsoon climate, featuring four distinct seasons, simultaneous rain and warmth, and susceptibility to complex, varied, and frequent meteorological disasters (Liu and Zeng, 2021).
2.2 Data sources and preprocessing
2.2.1 Net primary productivity
The NPP employed in this study is derived from the MOD17A3HGF dataset, estimated using the light energy utilization model (https://ladsweb.modaps.eosdis.nasa.gov/). Compared to the previous version of the MOD17 product, this dataset clears the 8-day synthetic LAI/FPRA quality difference, offers higher accuracy, and has a spatial resolution of 500 m × 500 m. To generate the NPP data of Henan Province for 2001–2020, the dataset underwent preprocessing operations, including splicing, projection, and cropping, which were executed using the Modis Reprojection Tool (MRT) and ArcGIS.
2.2.2 Meteorological
Meteorological data were obtained from the National Earth System Science Data Center (http://www.geodata.cn), encompassing month-by-month mean temperature and month-by-month mean precipitation at a spatial resolution of 1 km × 1 km. This dataset was utilized in the analysis of soil heterotrophic respiration, NEP estimation, and the exploration of driving factors within the study area.
2.2.3 Land use/cover
The land use/cover data used in this study were obtained from the annual China Land Cover Dataset (CLCD) with a spatial resolution of 30 m × 30 m. This dataset, published by Huang L. et al. from Wuhan University, is generated based on all the Landsat data from the Google Earth Engine platform and is produced by combining the Random Forest, spatiotemporal filtering, and logistic inference methods with an overall accuracy of 80%. Extracted using ArcGIS cropping techniques, the land use/cover data were categorized into the following classes: cropland, forest land, shrubs, grassland, watershed, unutilized land, and construction land.
2.2.4 Other thematic data
Population density data and GDP data used in this study were acquired from Word Pop (https://hub.worldpop.org/) and the Center for Resource and Environmental Science and Data of the Chinese Academy of Sciences (https://www.resdc.cn/), respectively. Both datasets are presented in a grid format with a spatial resolution of 1 km × 1 km. The topographic elevation data were obtained from the ASTER DEMv3 dataset released by the National Center for Earth System Science Data (http://www.geodata.cn) with a spatial resolution of 30 m × 30 m.
The above data sources are not uniform, and there are some differences in the format. Therefore, all datasets are harmonized to the WGS84 UTM projection, and the spatial resolution is resampled to 1 km × 1 km.
2.3 Methodology
2.3.1 NEP estimation modeling
NEP is an important metric for ecosystem carbon balance, reflecting the carbon cycling dynamics between terrestrial ecosystems and the atmosphere. When not accounting for the influence of other factors, NEP can be defined as the difference between the net vegetation productivity NPP and soil heterotrophic respiration RH (Noormets et al., 2021). The detailed calculation is as Eq. 1.
RH was estimated using the empirical model developed by Pei Pei et al. (2010) by the Formula 2.
where T is the mean annual temperature (°C) and P is the annual precipitation (mm).
2.3.2 Trend analysis
The Theil-Sen Median (Sen) is a nonparametric statistical trend calculation method that is not sensitive to measurement error (Yilmaz and Tosunoglu, 2019). Similarly, the Mann-Kendall (MK) method is a nonparametric statistical test used for trend analysis; this method does not require measurements to be normally distributed and is not affected by missing values and outliers (Agbo et al., 2023). These two methods have been widely used for trend analysis and trend significance testing of long-time series data in hydrology and meteorology.
In this study, the Sen and MK methods are employed to explore the trend of NEP change in Henan Province from 2001 to 2020 at the image metric scale. The formula for calculating the trend test factor (β) is expressed as the Eq. 3.
where median () denotes the median function; i, j represent the indices for the time series. The trend is interpreted based on the value of β. If β is greater than zero, it suggests an increasing trend in NEP. Conversely, if β is less than zero, it indicates a decreasing trend. The significance of β was further tested by the MK method, using the test statistic S calculated using the Formula 4.
Of these,
where sgn () in the Eq. 5 is the sign function, the standardized test statistic Z is calculated by the Formula 6.
|Z|≥1.65,1.96,2.58 indicates that the trend passes the significance test with 90%, 95%, and 99% confidence levels, and the trend is characterized as highly significant change, significant change, and minimally significant change, respectively.
2.3.3 Analysis of correlation
Pearson correlation analysis was used to explore the correlation between NEP and precipitation, as well as air temperature. The correlation coefficient (rxy) is expressed as the Formula 7.
where t is the total number of time series; xi, yi are the annual mean values of NEP and precipitation (air temperature) in year i; , are the multi-year mean values of the corresponding variables.
2.3.4 Center of gravity
In physics, the center of gravity refers to the geographic location representing the point of equilibrium of forces acting on an object. If the mass of the object is uniformly distributed, the point of equilibrium coincides with its geometric center; otherwise, it deviates from the geometric center (Peng Y. et al., 2023). In this study, the concept of the center of gravity is introduced, and the NEP of each image element is considered its quality factor. The spatial distribution of NEP in Henan Province is quantitatively in terms of aggregation and balance, along with its spatio-temporal evolution characteristics. This is achieved by analyzing the long time series of the center of gravity migration, using the Formula 8:
where
2.3.5 Hurst index
In this study, the Hurst index was estimated using the rescaled polarity R/S (Rescaled Range) method (Tong et al., 2018) to analyze the future trend of vegetation carbon sequestration capacity in Henan Province. The time series n was homogenized into m intervals of length l. The mean value of NEP for subinterval Iα (1<α<m) can be expressed as 9.
The cumulative deviation is calculated by the Formula 10.
The extreme difference is calculated by the Formula 11.
The standard deviation is calculated by the Formula 12.
The re-labeling polarities are calculated by the Formula 13.
The following relationship exists for R, S, and l as 14
In the formula, H is the Hurst index, with the value ranging from 0 to 1. When 0.5 < H < 1, the future trend of NEP is consistent with the past, indicating positive persistence. When 0 < H < 0.5, the future trend of NEP is opposite to the past, signifying anti-sustainability. The closer H is to 0 (or 1), the stronger the anti-sustainability (or persistence). Taking “log” v as the independent variable and “log” (R/S)v as the dependent variable, the least squares method can be used to obtain the H value, given by the expression as the Formula 15.
2.3.6 Geodetector
Geodetector is a scientific statistical method capable of detecting the spatial divergence of multiple data types, including type, order, ratio quantities, and their factorial explanatory power. It is particularly effective in identifying factorial interactions (Yang et al., 2019). Traditional geodetector results are often reliant on the discretization of continuous variables set by humans. However, in this paper, a parameter-optimal geodetector was employed to assess the explanatory power of factors such as precipitation and temperature on NEP (Wang et al., 2023). The R language GD package was used to obtain the factor detection results under different classification methods and parameters. The q value under the optimal parameter combination can be automatically filtered out using the Formula 16.
where l is the total number of categories of NEP variables or factors (e.g., precipitation and temperature); Nt and N are the number of cells in category t and the whole study area, respectively, and σ2 t and σ2 are the variance of NEP in the corresponding area.
3 Results analysis
3.1 Spatial and temporal patterns of NEP change
3.1.1 Temporal change of NEP
The interannual variation of NEP in Henan Province from 2001 to 2020 is depicted in Figure 2. The annual mean value of NEP ranged from 272.84 to 451.39 gC·m-2·a1, with a multi-year average of 382.74 gC·m-2·a1. Overall, NEP in Henan Province exhibited a fluctuating and slightly increasing trend in the past 20 years. Specifically, NEP experienced a rapid increase from 2001 to 2003, with an average growth rate of 3.54%. From 2004 to 2012, NEP showed a small fluctuation at a medium level, oscillating around the multi-year average value, ranging from 355.24 to 419.49 gC·m-2·a1. Following a sharp decline during 2012–2013, the NEP value increased rapidly from 2013 to 2015. NEP maintained an overall high level with significant fluctuations during 2016–2020, surpassing the multi-year average in all years except 2019 when NEP was lower than the average. The peak value was reached in 2020 at 451.39 gC·m-2·a1.
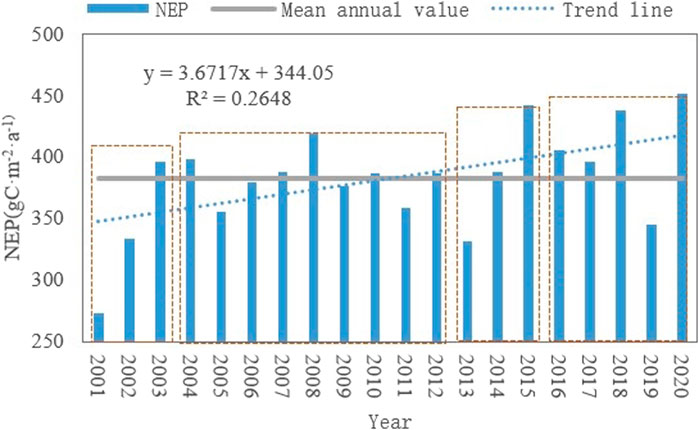
Figure 2. Inter-annual variation of NEP in Henan Province, 2001–2020.
3.1.2 Spatial distribution of NEP
The spatial distribution of NEP in Henan Province from 2001 to 2020 is presented in Figure 3. Overall, Henan Province has exhibited carbon sinks over the past wo decades, with only a few areas in Jiyuan City and Zhengzhou City demonstrating carbon source status in 2001. Meanwhile, the spatial and temporal distribution of NEP varies significantly, showing a spatial distribution pattern of higher values in the south and lower in the north. In particular, the high-value areas are concentrated in the adjacent zones of Sanmenxia, Luoyang, and Nanyang, while the low-value areas are primarily located in the region of the Henan section of the Yellow River Basin. Over the study period, the carbon sequestration capacity of vegetation in most areas of Henan Province gradually increased. However, in certain areas north of central Zhengzhou City, the improvement in carbon sequestration capacity was less pronounced, having NEP below 400 gC·m-2·a1.
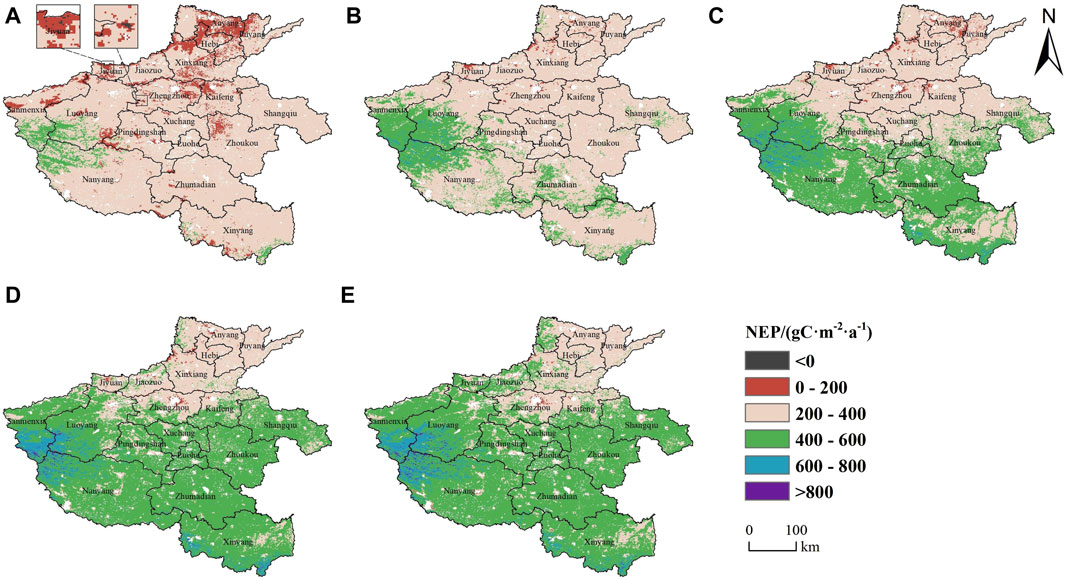
Figure 3. Spatial distribution of NEP in Henan Province for (A) 2001, (B) 2005, and (C) 2010, (D) 2015, and (E) 2020.
To comprehensively examine the significant changes in NEP across prefecture-level cities, the frequency method was employed in estimating the variability of NEP for Henan from 2001 to 2020 at two scales: regional and image metrics. The results are illustrated in Figure 4. As shown in Figures 4A, B, NEP experienced considerable annual fluctuations. Zhengzhou, Jiaozuo, and Pingdingshan cities exhibited slightly more decreases than increases in NEP, while other cities underwent more increases, with Luohe and Shangqiu cities having the most significant improvements. In Figures 4C, D, the spatial distribution of changes in NEP is presented at the metric scale. The figures suggest that the observed changes are generally aggregated, with more pronounced decreases in NEP in the northern part of Zhengzhou City, the southern part of Xinxiang City, and the southern part of Zhumadian.
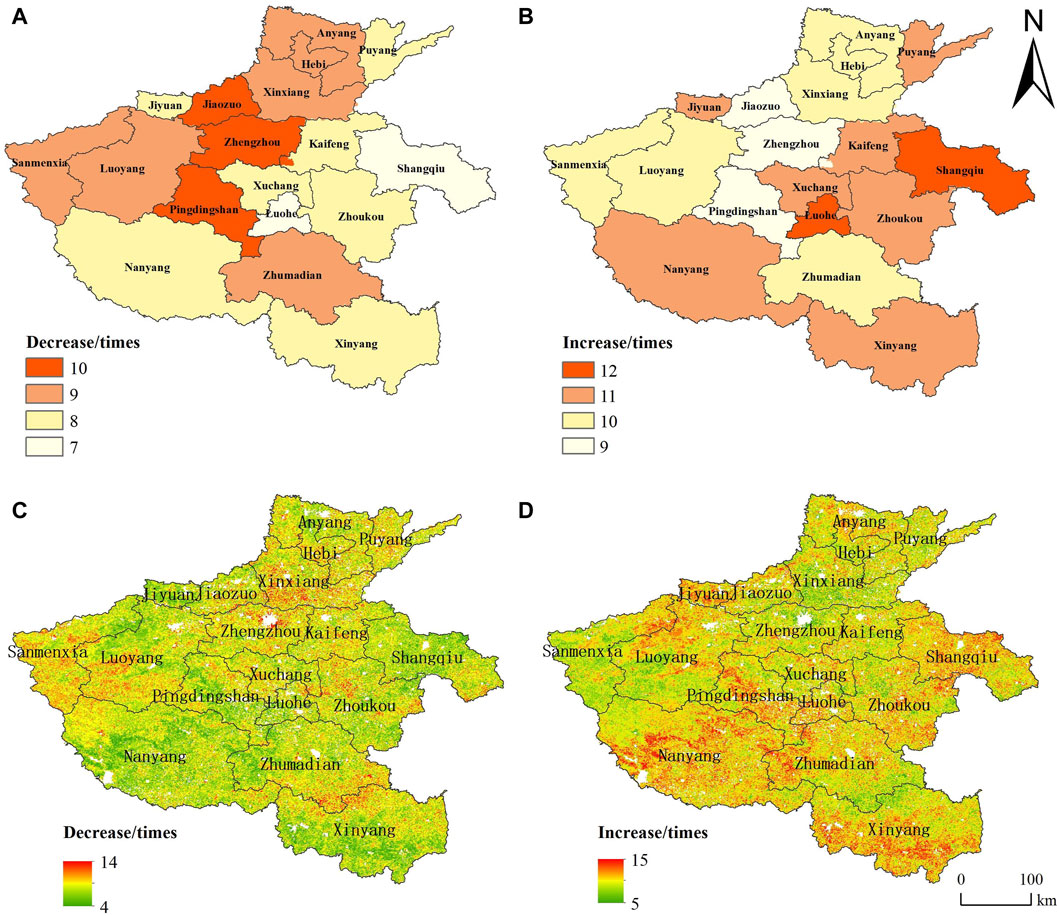
Figure 4. Change of NEP in Henan Province from 2001 to 2020 the frequency of (A) decreased and (B) increased NEP at the regional scale; and the frequency of (C) decreased and (D) increased NEP at the metric.
3.1.3 NEP trends
The joint SEN-MK trend test and center of gravity model were employed to further analyze the spatio-temporal dynamic evolution characteristics of NEP. As shown by the analysis results in Figure 5, the overall trend of NEP in Henan Province in the past 20 years has been increasing, with about 93.1% of Henan’s total area yielding higher NEP values. This suggests that the carbon sequestration capacity of vegetation ecosystems in the province has gradually improved from 2001 to 2020. The non-significantly increased area constituted 41.29% and can be found primarily in the central and eastern plains, while the significantly and extremely significantly increased areas comprised 40.88%, mainly situated in the Taihang Mountains, Xiong’er-FuNiu Mountains, Nanyang Basin, Tongbai-Dabie Mountains, and Tongbai-Dabie Mountains. Areas with decreasing NEP are limited and sporadically distributed in various prefecture-level cities, notably in Zhengzhou, Kaifeng, and Xinyang. Highly significant decreases are concentrated in the central and northern parts of Zhengzhou City.
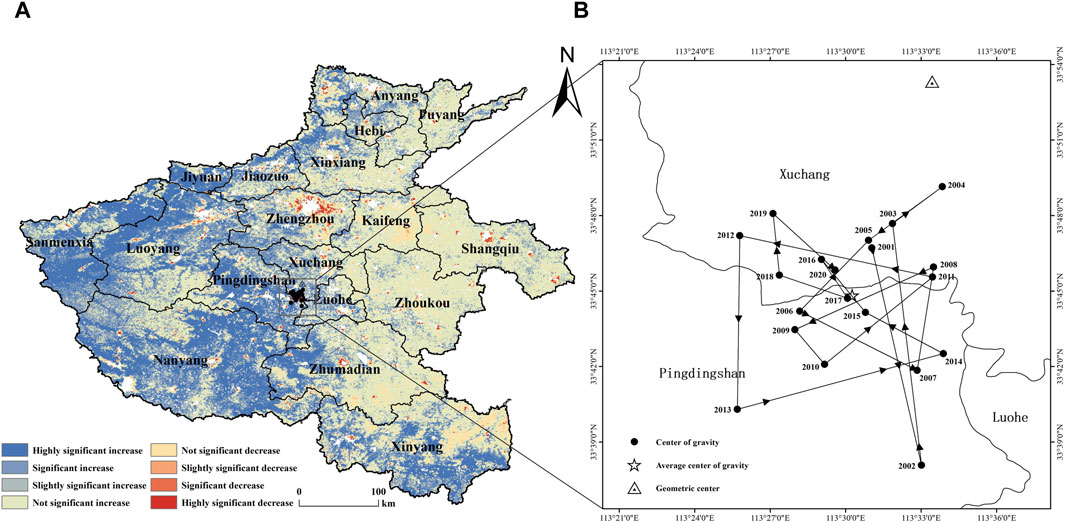
Figure 5. (A) Trend and (B) center of gravity shift of NEP in Henan Province from 2001 to 2020.
Henan’s average center of gravity of NEP in the past 20 years was situated 16.5 km southwest of the province’s geometric center. This suggests that the vegetation in the southwest region demonstrated a slightly stronger carbon sequestration capacity, contributing to a more uniform spatial distribution of NEP. The evolution trajectory of the center of gravity indicates multi-directional changes around the mean center of gravity during the study period, with an average migration distance of 8.19 km per year. In particular, the centers of gravity during the years 2001–2003, 2006–2009, and 2010–2014 exhibited more pronounced directional changes and migration distances, with a minimum migration distance recorded at 7.66 km. The overall trend of the center of gravity from 2014 to 2019 indicates a northwesterly movement.
3.1.4 Future changes of NEP
The Hurst index method was used to analyze the future trend of NEP in Henan Province, and the results are shown in Figure 6. The NEP in Henan showed a positive persistence characteristic area slightly larger than the anti-persistence characteristic area. The positive persistence area accounted for about 53.46% of Henan’s total area, primarily distributed in the northwestern, central-eastern, and southern parts of the province, including Jiaozuo, Xuchang, Luohe, and Shangqiu. The areas with anti-persistence characteristics were mainly located in the north and southwest, encompassing places such as Anyang, Puyang, and Sanmenxia. The overall trend of NEP in these areas over the past 20 years has been increasing, indicating that the carbon sequestration capacity of vegetation ecosystems in nearly half of the province may not maintain the increasing change characteristics observed in the past.
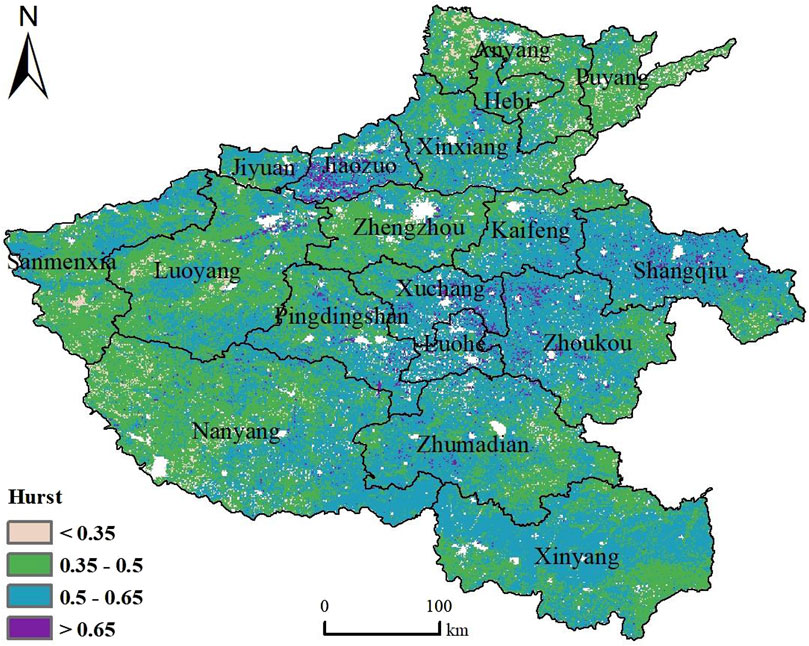
Figure 6. Future trends of NEP in Henan Province.
Based on the NEP trend shown in Figure 6, regions expected to exhibit non-significant increases and strong persistence in the future include Jiaozuo, Kaifeng, Xuchang, Luohe, Zhoukou, and Shangqiu. These areas are projected to maintain a trend of consistent, slight increase in NEP. In comparison, places like Xinxiang, Hebi, Jiyuan, Sanmenxia, and Xinyang demonstrate anti-persistence characteristics in areas with significant increases, while areas with non-significant increases show persistence characteristics. This suggests that the spatial distribution of vegetation carbon sequestration capacity in these areas will likely become more balanced. Zhengzhou City, experiencing a significant decrease in NEP over the last 20 years, shows persistence characteristics in areas with non-significant increases, while areas with significant increases show anti-persistence. In Xinxiang, Hebi, Jiyuan, Sanmenxia, and Xinyang, significantly increasing areas are characterized by anti-persistence, while non-significantly increasing areas exhibit persistence. This implies that the spatial distribution of the vegetation carbon sequestration capacity in these areas will tend to be more balanced. Zhengzhou City, having undergone a significant decrease in the NEP in the last two decades, exhibits persistence characteristics in non-significantly in-creasing areas and anti-persistence in places with significant increases, suggesting a weakening capacity of vegetation in those areas.
3.2 Drivers of NEP change
3.2.1 Response of NEP to climate factors
Precipitation and air temperature, recognized as primary climatic factors affecting vegetation growth (Mao and Shangguan, 2023; Wang et al., 2021), were analyzed for their correlation with NEP in Henan Province (Figure 7). At the annual scale (Figures 7A, B), precipitation significantly affected NEP, while air temperature exhibited a weaker influence. As highlighted in Figures 7C, D, the correlations between NEP and both precipitation and air temperature showed significant spatial distribution variability. Precipitation was positively correlated with NEP across the majority of the province, encompassing about 98.77% of the total area, with the strength of correlation gradually increasing from west to east; the negatively correlated areas were concentrated in Sanmenxia City. Approximately 43.74% of Henan’s total area exhibited a negative correlation between temperature and NEP, mainly located in Zhengzhou City and the cities to its north and east, as well as the southern part of Nanyang City.
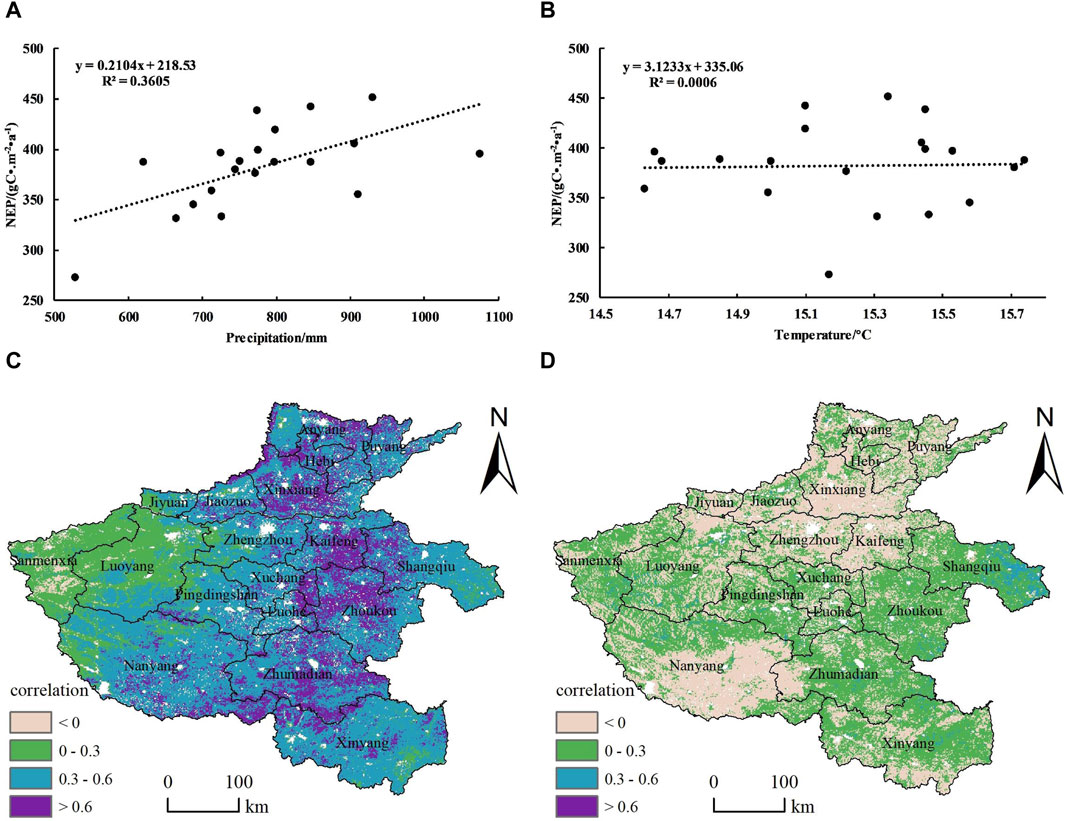
Figure 7. Correlation of NEP with (A) precipitation and (B) temperature; Spatial heterogeneity of the correlation (C) between NEP and precipitation, and (D) between NEP and temperature.
3.2.2 Response of NEP to land use
In Henan Province, which is primarily an agricultural region, the predominant land use type is arable land, followed by forest land and construction land. The temporal evolution of land use in Henan Province from 2001 to 2020 is shown in Figure 8. Over the past two decades, there has been a consistent reduction in the extent of arable land: 70.53% of Henan’s total area was arable land in 2001, 69.48% in 2005, 68.15% in 2010, 66.33% in 2015, and 65.58% in 2020. The decrease is mainly attributed to the conversion of arable land into forest land and construction land, a trend closely associated with policies promoting the return of farmland to forests and the rapid urbanization process.
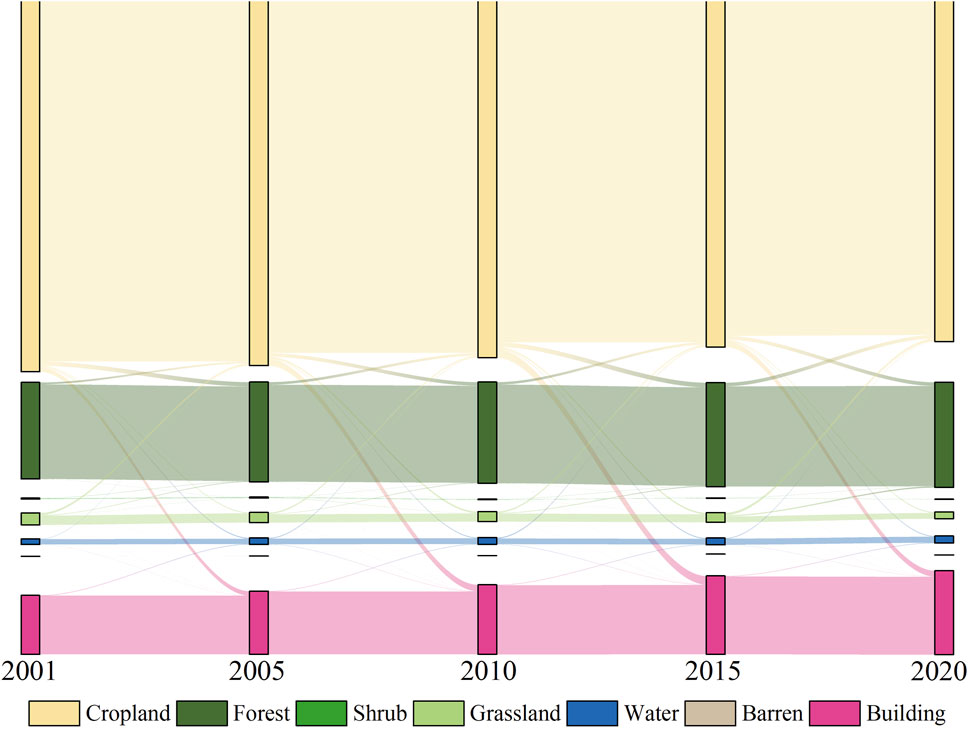
Figure 8. Sanki map of land use transfer in Henan Province, 2001–2020.
The expansion of construction land has been notably significant in the last two decades, accounting for only 9.99% in 2001 and expanding to 10.69% in 2005, 11.78% in 2010, 13.24% in 2015, and 14.21% in 2020. The analysis indicates substantial changes in cropland and construction land, particularly from 2001 to 2015. Since 2015, these two land cover types have an increasing and a decreasing trend, respectively. However, the changes have been significantly reduced, primarily due to the implementation of various policies such as “resolutely guarding the red line of arable land,” and “decelerating urbanization.”
Figure 9 shows the inter-annual changes in NEP for cropland, forest, and grassland vegetation in Henan Province from 2001 to 2020. As presented in Figure 9A, the NEP for cropland, forest, and grassland vegetation all exhibited varying degrees of upward trends. Among them, forest land had the strongest vegetation carbon sequestration capacity, followed by grassland. From 2001 to 2011, the difference between the NEP for cropland and grassland was not particularly pronounced. However, after 2011, the vegetation carbon sequestration capacity of grassland increased at a faster rate, leading to a progressively significant gap between cropland and grassland. As shown in Figure 9B, cropland consistently contributed the most to NEP, a pattern attributed to the extensive distribution of cropland in the province.
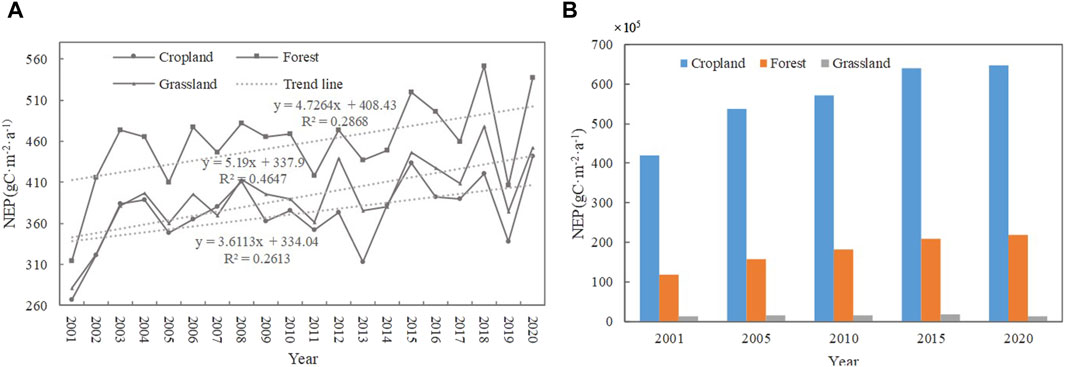
Figure 9. Inter-annual changes in (A) annual mean and (B) total values of NEP for different land cover types in Henan Province, 2001–2020.
3.2.3 Factor impact detection
Geodetector was used to assess the spatial differentiation response of NEP to physical geography, human activities, and air pollution in Henan Province. Considering data availability, precipitation (X1), temperature (X2), elevation (X3), slope (X4), land use (X5), population density (X6), GDP (X7), PM2.5 (X8), and O3 (X9) were selected as driving factors for 2013, 2015, 2017, and 2019. The geodetection q-values are shown in Figure 10.

Figure 10. Response of spatial differentiation of NEP to drivers in Henan Province for (A) 2013, (B) 2015, (C) 2017, and (D) 2019.
The results reveal temporal variability in the response of spatial differentiation of NEP to the driving factors in Henan Province. From a single-factor perspective, the explanatory power of precipitation, temperature, GDP, and PM2.5 on the spatial differentiation of NEP was stronger in 2013 and 2015, precipitation, temperature, PM2.5, and O3 in 2017, and precipitation, elevation, PM2.5, and O3 in 2019. From the perspective of multifactor interactions, the interactions among the factors showed two-factor enhancement or nonlinear enhancement, with their explanatory power significantly higher than that of the single factor.
4 Discussion
NEP in Henan Province has exhibited a fluctuating, although slightly increasing trend in the past 20 years. This pattern indicates the effectiveness of implemented ecological restoration measures, such as increasing forest cover and enriching biodiversity (Huang W. et al., 2023), in improving vegetation productivity and strengthening its carbon sequestration capacity. Trough values in NEP occurred in 2001, 2013, and 2019, aligning with troughs in precipitation and relatively high-temperature periods in Henan Province during the same periods. In particular, 2001 was a megadrought year in China (Wang et al., 2020), and in 2013, the forest cover in Henan declined considerably. This underscores the direct relationship between vegetation growth, climatic factors, and land-use types, as well as its carbon sequestration capacity in Henan Province.
Spatially, NEP in Henan Province exhibits a high-to-low gradient from south to north, with high-value areas concentrated in the western part of the study area. This region, characterized by higher altitude, sparse precipitation, low air humidity, strong solar radiation, and minimal human activities, provides favorable and stable conditions for vegetation growth. These conditions include fertile soil, lower susceptibility to pests and diseases, and reduced human interference. Conversely, the low-value area is mainly located in the plain area in the northern part of the study area, which has a relatively high latitude, low precipitation, low altitude, and high temperatures.
The majority of regions in Henan Province showed an increasing trend in NEP over the past two decades, consistent with the national trend (Wu P. et al., 2022; Huang Y. et al., 2023); however, about 6.9% of the province experienced a declining trend in NEP. At the prefecture-level analysis, Zhengzhou City in the north, Kaifeng City in the west, Luoyang in the north, and Shangqiu City in the middle consistently showed an overall decreasing trend in NEP. In addition, the number of annual decreases surpassed the number of increases in these areas. These trends are particularly pronounced in the main urban areas of prefecture-level cities characterized by high population density, rapid urban construction, and in some instances, elevated air pollution levels. Of particular significance is the large continuous area in the north-central part of Zhengzhou City (i.e., Jinshui, Zhongyuan, and Huiji districts), where NEP is expected to persistently weaken in the future, highlighting the need to prioritize ecological protection and restoration efforts.
The overall trend in NEP in the neighboring areas of Sanmenxia City, Luoyang City, and Nanyang City shows an increasing pattern. Although the number of decreases is greater than the number of increases from year to year, indicating a certain degree of interannual fluctuation in NEP, the magnitude of the increases exceeds the magnitude of the decrease in these regions.
Climate factors exert a significant influence on NEP in Henan Province, with precipitation having a more pronounced impact, while the correlation with temperature is relatively weak. Henan, being a large agricultural province, has experienced a continuous decline in the total area of cultivated land over the past 20 years due to the conversion of farmland into forests and urban areas. Despite this decline, cultivated land remains the primary source of vegetation carbon sequestration in the province, given its extensive coverage.
In contrast, forest land exhibits the strongest carbon sequestration capacity and serves as the second-largest contributor to vegetation carbon sequestration in Henan Province. This affirms that the decrease in NEP in Henan Province in 2013 is closely related to the reduction in forest cover. The influence of human activities on the carbon sequestration capacity of vegetation should not be overlooked, consistent with the findings of previous studies (Wang H. et al., 2022). Given the unique characteristics of Henan Province as a major food production base, a prudent, rational adjustment of forest land resources, within the framework of arable land protection, becomes imperative to enhance the vegetation carbon sink in the region.
Precipitation and temperature play key roles in vegetation growth and photosynthesis. Integrating analyses from annual, pixel scales, and geographical detector results, precipitation emerges as the primary limiting factor for carbon sequestration by vegetation in Henan Province. This finding aligns with other research, largely because Henan enjoys abundant sunshine and falls mostly within a semi-humid region where vegetation generally does not experience optimal moisture levels. Increased rainfall effectively enhances photosynthesis in vegetation. As altitude increases, the limitation of precipitation on vegetation gradually diminishes because it begins to meet the growth needs of the vegetation, resulting in weaker correlations between vegetation NEP and precipitation in regions like Sanmenxia and Luoyang. The correlation between vegetation NEP and temperature in Henan Province is relatively weak and complex. The spatial clustering of these correlations is not strong, which may be due to underlying surface characteristics, vegetation types, etc. The internal mechanisms of these relationships require further elucidation and validation through extended field experiments and monitoring.
Geographical detector results indicate that, besides climatic factors, the q-value for atmospheric pollution is relatively high. Since 2017, the influence of O3 on the spatial variability of vegetation NEP has progressively increased, surpassing the impact of PM2.5 in 2019. This trend coincides with the annual decline in the concentration of major pollutants led by PM2.5 and the gradual exacerbation of ozone pollution (Lu et al., 2020). Numerous studies have confirmed that atmospheric pollution directly or indirectly affects vegetation growth; for example, ozone impairs photosynthesis, reduces crop yields, and impacts tree growth (Zhou et al., 2018; Ma R. et al., 2022; Bo et al., 2023). In summary, PM2.5 and O3 are strongly correlated with the spatial variability of NEP, however, quantifying the causal relationship requires further exploration through field models, mechanistic models, and analyses of internal mechanisms.
Diverging from prior related studies (Gong et al., 2017; Liu et al., 2021; Cao et al., 2022), comprehensive approaches that integrate macroscopic and microscopic perspectives are adopted, and regions, where NEP is likely to continue decreasing, are identified. Additionally, the association between NEP and atmospheric pollution is confirmed through factor detection. Despite these advancements, the study has limitations requiring deeper investigation, particularly: 1) NEP in this study is estimated based on MODIS NPP products, precipitation and temperature, which inherently contain uncertainties due to sensors, cloud coverage, parameter settings, multiple spatiotemporal scales and so on. Meanwhile, there are various models for regional scale NPP estimation, such as statistical models, mechanistic models, and light use efficiency models (Ma W. et al., 2022; Shen et al., 2022). These diverse methodologies involve different principles, parameters and calculation steps, introducing significant variability into NEP estimates. Future research should focus on quantitatively assessing these uncertainties and refining NEP estimation methods. 2) Correlation analyses and geographic detectors primarily utilize statistical approaches to identify the explanatory power of various drivers on the spatiotemporal variations of NEP, however, the methods lack the analysis of the internal linkage mechanisms. 3) Farmland is vital for grain production in Henan Province, whereas forests and grasslands have superior carbon sequestration capabilities compared to croplands. Given this context, there is an urgent need to study the future spatiotemporal distribution of vegetation carbon sequestration capacity in Henan under different scenarios, including natural development, farmland conservation, and ecological protection.
5 Conclusion
(1) During the period from 2001 to 2020, the overall trend of NEP in Henan Province exhibited a fluctuating yet slightly rising pattern, with an average value of 382.74 gC·m-2·a1. Spatially, the overall capacity of vegetation carbon sequestration in Henan Province is gradually increasing from north to south, with high-value areas concentrated in the northwestern part of the province and low-value areas predominantly located in the north.
(2) About 93.1% of the regional NEP in Henan Province exhibited varying degrees of increasing trends. Conversely, areas with decreasing NEP were mainly located in Zhengzhou, Xinxiang, and Zhumadian. Among them, the NEP in Zhengzhou City demonstrated a consistent weakening trend for the future.
(3) In terms of climatic factors, precipitation was found to be the dominant factor affecting the NEP in Henan Province. Among the different land cover types, forests have the strongest carbon sequestration capacity, while cropland is the primary source of carbon sequestration in Henan due to its extensive land area. In terms of complex multi-factors, climate and atmospheric pollution factors have a stronger explanatory power in the spatial differentiation of NEP in the province. Moreover, the interaction power of the two-factor interaction surpasses that of a single factor.
Data availability statement
The original contributions presented in the study are included in the article/Supplementary Material, further inquiries can be directed to the corresponding author.
Author contributions
LZ: Conceptualization, Data curation, Methodology, Project administration, Resources, Supervision, Writing–original draft, Writing–review and editing. YC: Investigation, Methodology, Software, Validation, Visualization, Writing–original draft, Writing–review and editing. CS: Data curation, Investigation, Resources, Supervision, Validation, Writing–review and editing. RL: Methodology, Resources, Supervision, Validation, Writing–review and editing. TH: Conceptualization, Data curation, Resources, Supervision, Validation, Writing–review and editing.
Funding
The author(s) declare that financial support was received for the research, authorship, and/or publication of this article. This research was supported by the Key Laboratory of Southeast Coast Marine Information Intelligent Perception and Application, MNR (No. 23103), and the Open Research Fund Program of Key Laboratory of Metallogenic Prediction of Nonferrous Metals and Geological Environment Monitoring (Ministry of Education), Central South University (No. 2023YSJS03).
Acknowledgments
The authors wish to thank for the data supported from “National Earth System Science Data Center (http://www.geodata.cn)” and Zhangzhou Institute of Surveying and Mapping.
Conflict of interest
The authors declare that the research was conducted in the absence of any commercial or financial relationships that could be construed as a potential conflict of interest.
Publisher’s note
All claims expressed in this article are solely those of the authors and do not necessarily represent those of their affiliated organizations, or those of the publisher, the editors and the reviewers. Any product that may be evaluated in this article, or claim that may be made by its manufacturer, is not guaranteed or endorsed by the publisher.
References
Agbo, E. P., Nkajoe, U., and Edet, C. O. (2023). Comparison of Mann-Kendall and Sens innovative trend method for climatic parameters over Nigeria's climatic zones. Clim. Dyn. 60 (11-12), 3385–3401. doi:10.1007/S00382-022-06521-9
Arora, V. (2002). Modeling vegetation as a dynamic component in soil-vegetation-atmosphere transfer schemes and hydrological models. Rev. Geophys. 40 (2), 3–1. doi:10.1029/2001RG000103
Aubinet, M., Hurdebise, Q., Chopin, H., Debacq, A., Ligne, A. D., Heinesch, B., et al. (2018). Inter-annual variability of net ecosystem productivity for a temperate mixed forest: a predominance of carry-over effects? Agric. Meteorol. 262, 340–353. doi:10.1016/j.agrformet.2018.07.024
Bo, S., Evgenios, A., Vicent, C., et al. (2023). Drought mitigates the adverse effects of O3 on plant photosynthesis rather than growth: a global meta-analysis considering plant functional types. Plant, Cell and Environ., 14808. doi:10.1111/pce.14808
Cao, Y., Sun, Y., Jiang, Y., and Wan, J. (2022). Analysis on temporal-spatial variations and driving factors of net ecosystem productivity in the Yellow River Basin. Ecol. Environ. Sci. 31 (11), 2101–2110. doi:10.16258/j.cnki.1674-5906.2022.11.001
Fan, L., Cai, T., Wen, Q., Han, J., Wang, S., Wang, J., et al. (2023). Scenario simulation of land use change and carbon storage response in Henan Province, China: 1990-2050. Ecol. Indic. 154, 110660. doi:10.1016/J.ECOLIND.2023.110660
Gong, J., Zhang, Y., and Qian, C. (2017). Temporal and spatial distribution of net ecosystem productivity in the Bailonglang Walershed of Gansu Province. Acla Ecol. Sin. 37 (15), 5121–5128. doi:10.5846/stxb201605040840
Harenda, K. M., Samson, M., Juszczak, R., Markowicz, K. M., Stachlewska, I. S., Kleniewska, M., et al. (2021). Impact of atmospheric optical properties on net ecosystem productivity of peatland in Poland. Remote Sens. 13 (11), 2124. doi:10.3390/RS13112124
Hua, L., Zhang, F., Weng, S., and Lu, Y. (2023). Spatio-temporal pattern changes and attribution analysis of net ecosystem productivity in vegetation ecosystems in Anhui Province from 1982 to 2020. Acta Ecol. Sin. 43 (17). doi:10.20103/j.stxb.202207051923
Huang, W., Wang, P., He, L., and Liu, B. (2023a). Improvement of water yield and net primary productivity ecosystem services in the Loess Plateau of China since the "Grain for Green" project. Ecol. Indic. 154, 110707. doi:10.1016/J.ECOLIND.2023.110707
Huang, Y., Wang, F., Zhang, L., Zhao, J., Zheng, H., Zhang, F., et al. (2023b). Corrigendum: changes and net ecosystem productivity of terrestrial ecosystems and their influencing factors in China from 2000 to 2019. Front. Plant Sci. 14, 1259137. doi:10.3389/FPLS.2023.1259137
Li, J., Liu, Y., Cao, M., and Xue, B. (2015). Space-Time Characteristics of vegetation cover and distribution: case of the Henan Province in China. Sustainability 7 (9), 11967–11979. doi:10.3390/su70911967
Liu, D., Yan, H., Yu, C., Yin, S., Wang, C., and Li, J. (2023b). Quantitative assessment of climate change impacts on forest ecosystems. For. Sci. 69 (2), 143–157. doi:10.1093/forsci/fxac054
Liu, F., and Zeng, Y. (2021). Analysis of the spatiotemporal variation of vegetation carbon source/sink in Qinghai Plateau from 2000-2015. Acta Ecol. 41 (14), 5792–5803. doi:10.5846/stxb201909302057
Liu, K., Zhang, H., Kong, L., Qiao, Y., and Hu, M. (2023a). An overview of terrestrial ecosystem carbon sink assessment methods towards achieving carbon neutrality in China. Acta Ecol. Sin. 43 (10), 4294–4307. doi:10.5846/stxb202204020842
Liu, Z., Li, M., Li, J., Yan, H., and Qian, S. (2021). Spatial-temporal changes of vegetation net primary productivity and its response to climate change in Henan Province. J. Henan Agric. Univ. 55 (1), 141–151. doi:10.16445/j.cnki.1000-2340.20210122.001
Loescher, H. W., Oberbauer, S. F., Gholz, H. L., and Clark, D. B. (2003). Environmental controls on net ecosystem-level carbon exchange and productivity in a Central American tropical wet forest. Glob. Change Biol. 9, 396–412. doi:10.1046/j.1365-2486.2003.00599.x
Lu, X., Zhang, L., Wang, X., Gap, M., Li, K., Zhang, Y., et al. (2020). Rapid increases in warm-season surface ozone and resulting health impact in China since 2013. Environ. Sci. Technol. Lett. 7 (4), 240–247. doi:10.1021/acs.estlett.0c00171
Lue, F., Song, Y., and Yan, X. (2023). Evaluating carbon sink potential of forest ecosystems under different climate change scenarios in Yunnan, Southwest China. Remote Sens. 15 (5), 1442. doi:10.3390/RS15051442
Ma, F., Yan, Y., Svenning, J. C., Quan, Q., Peng, J., Zhang, R., et al. (2023). Opposing effects of warming on the stability of above- and belowground productivity in facing an extreme drought event. Ecology 105, e4193. doi:10.1002/ECY.4193
Ma, R., Xia, C., Liu, Y., Wang, Y., Zhang, J., Shen, X., et al. (2022a). Spatiotemporal change of net primary productivity and its response to climate change in temperate grasslands of China. Front. Plant Sci. 13, 899800. doi:10.3389/fpls.2022.899800
Ma, W., Ding, J. L., Wang, J. L., and Zhang, J. (2022b). Effects of aerosol on terrestrial gross primary productivity in Central Asia. Atmos. Environ. 288, 119294. doi:10.1016/j.atmosenv.2022.119294
Malhi, Y., Girardin, C., Metcalfe, D. B., Doughty, C. E., Aragao, L. E. O. C., Rifai, S. W., et al. (2021). The global ecosystems monitoring network: monitoring ecosystem productivity and carbon cycling across the tropics. Biol. Conserv. 253, 108889. doi:10.1016/J.BIOCON.2020.108889
Mao, S., and Shangguan, Z. (2023). Evolution of spatiotemporal patterns in vegetation net primary productivity and the driving forces on the Loess Plateau. Environ. Inf. Remote Sens. 11. doi:10.3389/fenvs.2023.1134917
Nayak, R. K., Pate, N. R., and Dadhwal, V. K. (2015). Spatio-temporal variability of net ecosystem productivity over India and its relationship to climatic variables. Environ. Earth Sci. 74 (2), 1743–1753. doi:10.1007/s12665-015-4182-4
Noormets, A., Bracho, R., Ward, E., Seiler, J., Strahm, B., Lin, W., et al. (2021). Heterotrophic respiration and the divergence of productivity and carbon sequestration. Geophys. Res. Lett. 48 (7), e2020GL092366. doi:10.1029/2020GL092366
Pei, Z., Zhou, C., Ou, Y., and Yang, W. (2010). A carbon budget of alpine steppe area in the Tibetan Plateau. Geogr. Res. 29 (1), 102–110. doi:10.11821/yj2010010010
Peng, J., Wen, L., Mu, X., and Xiao, J. (2023a). The evolving centres of gravity in China’s oil and gas industry: evidence from infrared radiation imaging gas flaring data. Energy Sustain. Dev. 73, 263–279. doi:10.1016/J.ESD.2023.02.002
Peng, R., Tian, X., and Wu, D. (2023b). Spatiotemporal characteristics and zonal analysis of carbon balance in county-level regions: case study of Jiangsu Province. Environ. Inf. Remote Sens. 11. doi:10.3389/fenvs.2023.1330587
Peng, Y., Chang, J., Zhao, X., Shi, Y., Bai, Y., Li, Q., et al. (2023c). Grassland carbon sink in China and its promotion strategies. Bull. Natl. Nat. Sci. Found. China 37 (04), 587–593. doi:10.16262/j.cnki.1000-8217.20230904.001
Piao, S., He, Y., Wang, X., and Chen, F. (2022). Estimation of China's terrestrial ecosystem carbon sink: methods, progress and pro-spects. Sci. Chima Earth Sci. 65 (4), 641–651. doi:10.1007/S11430-021-9892-6
Shen, X., Liu, Y., Zhang, J., Wang, Y., Ma, R., Liu, B., et al. (2022). Asymmetric impacts of diurnal warming on vegetation carbon sequestration of marshes in the Qinghai Tibet Plateau. Glob. Biogeochem. Cycles 36 (7), e2022GB007396. doi:10.1029/2022GB007396
Tong, S., Zhang, J., Bao, Y., Lai, Q., Lian, X., Li, N., et al. (2018). Analyzing vegetation dynamic trend on the Mongolian Plateau based on the Hurst exponent and influencing factors from 1982-2013. J. Geogr. Sci. 28 (5), 595–610. doi:10.1007/s11442-018-1493-x
Wang, C., Zhao, W., and Zhang, Y. (2022a). The change in net ecosystem productivity and its driving mechanism in a mountain eco-system of arid Regions,Northwest China. Remote Sens. 14, 4046. doi:10.3390/RS14164046
Wang, H., Zhu, Y., Wang, J., Han, H., Niu, J., and Chen, X. (2022b). Modeling of spatial pattern and influencing factors of cultivated land quality in Henan Province based on spatial big data. Plos One 17 (4), e0265613. doi:10.1371/JOURNAL.PONE.0265613
Wang, L., Song, W., Zhang, J., Ma, X., Zhao, H., and Huang, X. (2020). Spatio-temporal evolution of vegetation net primary productivity in Oilian Mountan National Park and its driving factors. Pratacultural Sci. 37 (8), 1458–1474. doi:10.11829/j.issn.1001-0629.2019-0613
Wang, M., Zhao, J., Wang, S., Chen, B., and Li, Z. (2021). Detection and attribution of positive net ecosystem productivity extremes in China's terrestrial ecosystems during 2000-2016. Ecol. Indic. 132, 108323. doi:10.1016/J.ECOLIND.2021.108323
Wang, Z., Liu, S., Zhang, Y., Gong, X., Li, S., Liu, D., et al. (2023). Exploring the relative importance and interactive impacts of explanatory variables of the built environment on Ride-Hailing Ridership by using the optimal parameter-based geo-graphical detector(OPGD) model. Appl. Sciences-Basel 13 (4), 2180. doi:10.3390/APP13042180
Wei, Z., Wei, K., and Liu, J. (2023). Decoupling relationship between carbon emissions and economic development and prediction of carbon emissions in Henan Province: based on Tapio method and STIRPAT model. Environ. Sci. Pollut. Res. 30 (18), 52679–52691. doi:10.1007/S11356-023-26051-Z
Wu, D., Hou, W., Sang, H., Zhai, L., and Guo, J. (2022a). Analysis of spatio-temporal variation of vegetation carbon sources/sinks in Tibet and its impact factors. Sci. Surv. Mapp. 47 (8), 105–113. doi:10.16251/j.cnki.1009-2307.2022.08.013
Wu, P., Wang, X., Wu, J., Zhang, X., Lin, Y., and Wang, K. (2022b). Estimation of carbon stock and carbon sequestration potential for China's grain for green project. J. Soil Water Conservation 36 (4), 342–349. doi:10.13870/j.cnki.stbcxb.2022.04.042
Yang, S., Yang, J., Shi, S., Song, S., Luo, Y., and Du, L. (2023). The rising impact of urbanization-caused CO2 emissions on terrestrial vegetation. Ecol. Indic. 148, 110079. doi:10.1016/J.ECOLIND.2023.110079
Yang, T., Sun, F., Liu, W., Wang, H., Wang, T., and Liu, C. (2019). Using geo-detector to attribute spatio-temporal variation of pan evaporation across China in 1961-2001. Int. J. Climatol. 39 (5), 2833–2840. doi:10.1002/joc.5976
Yang, Y., Shi, Y., Sun, W., Chang, J., Zhu, J., Chen, L., et al. (2022). Terrestrial carbon sinks in China and around the world and their contribution to carbon neutrality. Sci. China life Sci. 52 (4), 534–574. doi:10.1360/SSV-2021-0362
Yilmaz, M., and Tosunoglu, F. (2019). Trend assessment of annual instantaneous maximum flows in Turkey. Hydrological Sci. J. 64 (7), 820–834. doi:10.1080/02626667.2019.1608996
Zhang, J., Hao, X., Hao, H., Fan, X., and Li, Y. (2021). Climate change decreased net ecosystem productivity in the arid region of central Asia. Remote Sens. 13 (21), 4449. doi:10.3390/rs13214449
Zhang, L., Wang, J., and Shi, R. (2015). Temporal-spatial variations of carbon sink/source in Northeast China from 2000 to 2010. J. East China Normal Univ. Nat. Sci. 4, 164–173. doi:10.3969/j.issn.1000-5641.2015.04.017
Zhang, M., Huang, X., Chuai, X., Xie, X., Zhu, Z., and Wang, Y. (2020). Spatial distribution and changing trends of net ecosystem productivity in China. Geogr. Geo-Information Sci. 36 (02), 69–74. doi:10.3969/j.issn.1672-0504.2020.02.011
Zhou, L., Chen, X., and Tian, X. (2018). The impact of fine particulate matter (PM2.5) on China's agricultural production from 2001 to 2010. J. Clean. Prod. 178, 133–141. doi:10.1016/j.jclepro.2017.12.204
Zhou, Y., Yan, J., Liu, J., and Wang, Y. (2023). Spatio-temporal variation of NEP in ecological zoning on the Loess Plateau and its driving factors from 2000 to 2021. Environ. Sci., 1–14. doi:10.13227/j.hjkx.202306059
Keywords: Henan Province, vegetation carbon sequestration, net ecosystem productivity, spatial and temporal evolution, driving factors
Citation: Zhi L, Chai Y, Sun C, Li R and Hu T (2024) Spatiotemporal evolution and driving factors of vegetation net ecosystem productivity in Henan Province over the past 20 years. Front. Environ. Sci. 12:1400425. doi: 10.3389/fenvs.2024.1400425
Received: 13 March 2024; Accepted: 11 June 2024;
Published: 03 July 2024.
Edited by:
Sawaid Abbas, University of the Punjab, PakistanReviewed by:
Xiangjin Shen, Chinese Academy of Sciences (CAS), ChinaXianjin Zhu, Shenyang Agricultural University, China
Copyright © 2024 Zhi, Chai, Sun, Li and Hu. This is an open-access article distributed under the terms of the Creative Commons Attribution License (CC BY). The use, distribution or reproduction in other forums is permitted, provided the original author(s) and the copyright owner(s) are credited and that the original publication in this journal is cited, in accordance with accepted academic practice. No use, distribution or reproduction is permitted which does not comply with these terms.
*Correspondence: Tao Hu, aHV0YW9lbmdpbmVlcmluZ0AxNjMuY29t