
95% of researchers rate our articles as excellent or good
Learn more about the work of our research integrity team to safeguard the quality of each article we publish.
Find out more
ORIGINAL RESEARCH article
Front. Environ. Sci. , 25 July 2024
Sec. Environmental Citizen Science
Volume 12 - 2024 | https://doi.org/10.3389/fenvs.2024.1371048
This article is part of the Research Topic Environmental Citizen Studies in Freshwater Science View all 8 articles
 Eleanor Starkey1*†
 Amy Jones2
 Susana Ochoa-Rodriguez3
 Sachit Mahajan4
 Chi-Ling Wei5Pei-Chun Chen5Shau-Yuan Liu6
 Li-Pen Wang5*
 Claire L. Walsh1*
Freshwater pollution is a global challenge that citizens recognise as unacceptable, despite professional efforts to monitor, manage, and regulate it. Water quality is difficult to observe at high spatial and temporal resolutions; it is costly and typically requires trained specialists in the field and in laboratories. However, the rise in citizen science monitoring has generated opportunities to overcome many barriers and fill data gaps. Citizens want access to actionable water quality information that can provide early warnings and drive change. Our bibliographic analysis emphasises that citizen science is rarely paired with the use of continuous sensors, and many monitoring schemes involving the public are unable to offer the detail required. This study has explored the practicalities and competencies associated with community-led (near) continuous water quality monitoring (CWQM), and has generated an extensive checklist containing technical, social, economic, and wider responsibilities that stakeholders should consider. The “UpStream” project has provided a testbed for this exploratory work and the development and deployment of the “WaterBox” CWQM device. Case studies from the UK and Taiwan, where community-led CWQM programmes have been piloted, have provided novel methodological insights. Lessons learnt have enabled researchers to determine whether, and to what extent, community-led CWQM is achievable in practice. Results confirm that 75% of the practicalities observed fall under the “technical” category, despite offering a social and inclusive methodology. Through observational work, it was found that only 34% of the 104 practicalities were led by community groups and community champions. Communities require significant support owing to the sheer number of technical barriers, although some of this could be provided by skilled community champions. These findings have surfaced despite the WaterBox equipment being open, accessible, cost-effective, and adaptable. Unless support is in place and/or technology significantly evolves to reduce the number of challenges, it is unlikely that communities will lead and take full ownership of CWQM programmes. Despite this, the generation of site-specific CWQM data are welcomed by citizens, who can co-design schemes, interpret trends and offer valuable local information that trained scientists cannot achieve alone. These transferable findings are relevant to monitoring initiatives across the environmental sector.
Despite clean water being vital for life, freshwater pollution is one of the biggest global challenges. Water quality has degraded significantly since the 1990s as agricultural runoff, untreated sewage and industrial waste are released into waterbodies (du Plessis, 2022). These activities occur worldwide, causing habitat destruction, spread of diseases and loss of aquatic life. While the UN Sustainable Development Goal (SDG) 6 specifically addresses clean water and sanitation, water pollution is intertwined across many goals given its implications for food security, health, wellbeing, biodiversity, and ecosystems (UN Environment Programme, 2016). The complexity and continued deterioration are why “water crises” have dominated the World Economic Forum’s Risk Report for the past decade (World Economic Forum, 2021). Despite increased awareness and legislation (e.g., European Commission, 2000), a complete national (let alone global) picture of water quality status does not exist. Monitoring of streams, rivers and lakes is hampered by various constraints, spatial and temporal resolutions are limited, and technologies are still unable to observe and precisely characterise every waterbody (Chapman and Sullivan, 2022). Slow progress has meant that the public are increasingly engaged and actively involved in the water pollution debate through citizen science. This includes the UK and Taiwan, where pollution headlines have frequently appeared in the media1,2.
Citizen science and the involvement of volunteers in the water sector have been widely reported over the past decade (Buytaert et al., 2014; Walker et al., 2020; Kelly-Quinn et al., 2022). Alongside its potential to be cost-effective, it is the diverse combination of social and environmental benefits gained, which has made citizen science grow exponentially. Even though reported benefits are often associated with the data (including integration with traditional scientific data and data utilisation), having end users physically involved in the data collection process is also considerably beneficial. Cited activities and associated benefits include encouraging participation, fostering stakeholder collaboration, raising environmental awareness, integrating local knowledge, empowering communities, enhancing community resilience, collecting rare sightings, improving data resolution, enhancing model performance, catalysing direct action, and influencing water management schemes, the latter which often lead to ecosystem health improvements (Starkey et al., 2017; Stepenuck and Genskow, 2019; Walker et al., 2020; von Benzon et al., 2021; Weiner et al., 2022; Collins et al., 2023; Alemu et al., 2023; Moshi et al., 2023). It has also been documented that citizen science or other forms of community involvement can play an important role in delivering the SDGs, particularly SDG 3 (good health and wellbeing), 6 (clean water and sanitation), and 11 (sustainable cities and communities) (Bishop et al., 2020; Quinlivan et al., 2020; Hegarty et al., 2021).
Trained experts (such as scientists and researchers) traditionally perform environmental monitoring activities in isolation; their methods and results are limited, and they often lack relevance beyond their immediate interests. However, in addition to the creation of new data, citizen science is also a collaboration enabler. Co-created monitoring plans are often generated, and projects are tailored to address priorities and needs pertinent to a wide range of end users (Walker et al., 2020; Yevenes et al., 2022). While the level of engagement and participation can vary between projects (Skarlatidou and Haklay, 2020), this alternative way of working has produced valuable results across the water sector and has enabled non-professionals to connect directly with experts on local issues that they deeply care about.
Citizen science has been trialled globally for water quality monitoring. Initiatives such as Arkansas’ StreamSmart programme (Grantz et al., 2023) and the Lake Geneva participation project (Aronoff et al., 2021) demonstrate the possibilities of citizen-driven water quality analyses, while increasing environmental awareness. A study in Turkey (Cakmak et al., 2021) found that citizen science was a viable approach for monitoring water quality in a lake environment, with the motivation of young volunteers and mobile application development being key achievements of the project rather than the generated data. Another study conducted in Ethiopia discovered that citizen scientists can accurately monitor and gather water quality data; they conclude that citizen science has enormous potential to address gaps experienced in the sector while enabling collaboration between researchers and communities (Babiso et al., 2023). Similarly, in India, a citizen science network has been built to analyse water quality in a project centred on a 100 km long tropical lake-estuarine system (Vembanad Lake), which has a substantial impact on local livelihoods (George et al., 2021). An increasing number of volunteer-led water quality monitoring programmes also exist in the United States (Albus et al., 2020). Similar findings prevail in both the UK and Taiwan (Walker et al., 2020; Collins et al., 2023).
In most cases, citizen science for water quality monitoring has involved inexpensive and hands-on (manual) methods or visual (qualitative) observations, often accompanied by simple gauges, test kits, taking photographs using smartphones, or collecting spot samples that are then sent to a laboratory for detailed analysis (Jollymore et al., 2017; Hegarty et al., 2021; Collins et al., 2023; Ramírez et al., 2023). Annual, biannual or seasonal “blitz” style campaigns have also enabled volunteers to collect a large quantity of data on the same day and are often facilitated by environmental NGOs (Bishop et al., 2020; Collins et al., 2023). The success of citizen science programmes in water quality monitoring often depends on a variety of factors, including the individual traits of participating citizens, such as their knowledge, experience, environmental consciousness, motivation, and socioeconomic background (Jollymore et al., 2017; Capdevila et al., 2020). The spatial and temporal precision of sampling in citizen science initiatives varies greatly, requiring thorough method evaluation in terms of sensor reliability, data accuracy, training, cost, and logistics (Jollymore et al., 2017; Ramírez et al., 2023). While citizens have been able to observe vast areas and focus debate, sampling frequency, therefore temporal resolution of the resulting data, has limited their end use and integration into national or formal monitoring networks. More broadly, mainstreaming citizen-led data could further assist stakeholders in making informed decisions, prioritise issues and budgets, and ultimately go on to help shape environmental policies (Schade et al., 2021).
Continuous monitoring is important for building a complete picture of water quality issues. Comparisons of grab samples with near-continuous water quality monitoring (CWQM) show that samples or spot measurements of pollutant concentrations can underestimate their loads (Cassidy and Jordan, 2011). Higher frequency measurements (e.g., every hour or even every 15-min) enable gradual or sudden shifts in water quality status to be detected (Ramírez et al., 2023). In-situ sensors can offer this level of temporal resolution; they detect pollution incidents as they occur and generate long-term trends (O’Flynn et al., 2010; Kruse, 2018). Growth in CWQM has been partially attributed to improvements in telecommunications, the Internet of Things (IoT), and the ability to “telemeter” readily available equipment, and wirelessly transfer “big data” back to servers (Adu-Manu et al., 2020; Jordan and Cassidy, 2022; Reljić et al., 2023). Following this, (near) real-time and archived observations can be made available in various open formats and subsequently viewed, interrogated and/or downloaded by end users (Smith and Turner, 2019; James et al., 2022). The existence of open data acts, smartphones, user-friendly data portals and tailored applications means that non-scientific audiences (including communities) are now exposed to, and can utilise, environmental data more than ever before. Although CWQM is increasing because of these advancements (e.g., the UK’s Environment Act, 2021), it is still relatively scarce because of the costs, maintenance, calibration, technical expertise, and even theft or vandalism involved. Greater involvement, commitment, coordination, and lower costs are necessary (Chapman and Sullivan, 2022) to ensure that more ground-based sites can be monitored to meet the needs of communities.
To explore the combined status of water quality, monitoring, and citizen science, we conducted a widespread analysis of the published literature using a bibliometric analysis approach (Donthu et al., 2021). This review indicates that citizens rarely undertake CWQM and/or studies go unreported. A search for “Water Quality”, “Monitor*”, “Citizen Science”, and “Continuous” found only seven publications in the Web of Science database, implying that the intersection of citizen science and CWQM is still in its infancy. A closer look at the seven studies reveals that most supplement or compare hands-on citizen science observations to continuous datasets collected by “professionals” or explore long-term (continuous) engagement (Baalbaki et al., 2019; Albus et al., 2020; George et al., 2021; Biraghi et al., 2022). In contrast, a search for “Water Quality”, “Monitor*”, and “Citizen Science”, omitting “Continuous”, resulted in a corpus of 170 articles published between 2004 and 2023. A word cloud was created based on the highly occurring keywords in this wider search, offering a visual representation of prevalent research themes (Figure 1).
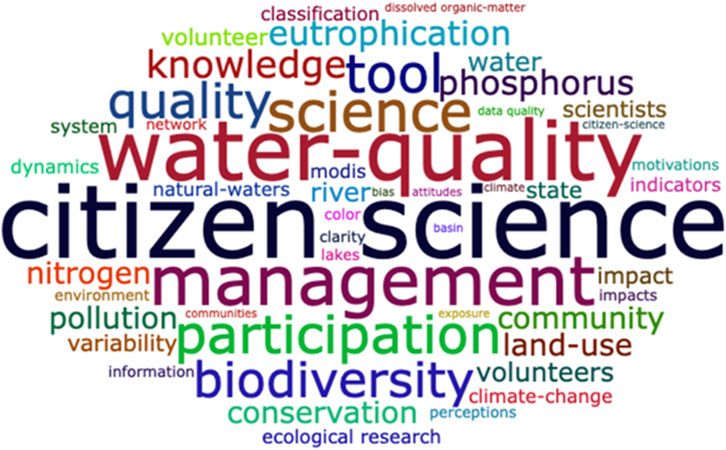
Figure 1. Word cloud visualisation based on highly occurring keywords in the literature. The size of each term is proportional to its frequency in the dataset.
A keyword co-occurrence network for these bibliometric articles is shown in Figure 2. Employing the Leiden clustering algorithm (Traag et al., 2019) and focusing on the top 50 nodes, this network analysis provides an understanding of the interrelations and predominant themes within a given research domain. Keywords such as “Data”, “Community” and “Management” emerged as significant, reflecting the multi-disciplinary nature of the field. One notable omission is the concept of “Continuous Monitoring”, as well as “Real-time” and “Daily”, suggesting a gap in the integration of citizen science initiatives with continuous monitoring systems. This also suggests that studies are not reporting on the practicalities of citizen science and continuous monitoring. Other missing components include the terms “Open Source” and “Technology”. Open-source sensors, platforms and tools can democratise access to scientific data collection and analysis, making citizen science initiatives more inclusive and accessible (Strasser et al., 2019; Mahajan et al., 2021). The bibliometric analysis also identifies a potentially underexplored niche in Cluster 4 (Figure 2), which includes terms like “Classification”, “Modis”, “Natural-Waters”, “Color”, and “Dissolved Organic-Matter”. While a closer inspection of this cluster demonstrates connections specifically associated with satellite-based monitoring (a topic which is beyond the scope of our study), it further emphasises the disconnect between the different methods currently used to monitor water quality. Encouraging a greater overlap of monitoring techniques could boost data availability, increase spatial and temporal resolutions, and improve data quality.
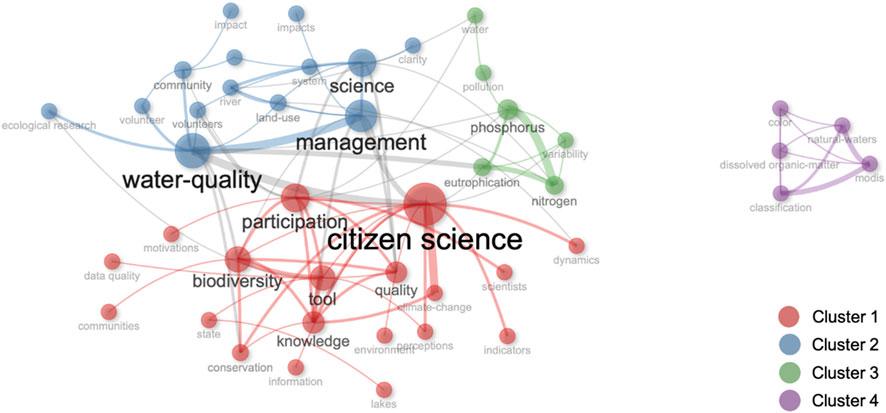
Figure 2. Network visualisation of frequently occurring terms. Clusters demonstrate the connections between keywords, and their size indicate the number of connections.
As the literature and bibliometric analysis demonstrate, individually citizen science and CWQM offer a vast array of benefits, but if combined and are successful, they have the potential to overcome limitations in the freshwater and surface water domains. We have therefore pushed the boundaries of citizen science here knowing that a complete picture of water quality is urgently required. This ambition has been tested by directly combining and exploring community-led monitoring with CWQM.
The “UpStream” project (Newcastle University, 2023) has provided a testbed for this exploratory work and has led to the development and deployment of a cost-effective CWQM device. Riverine case studies from the UK and Taiwan, where community-led CWQM programmes have been piloted, have provided novel methodological insights into such activities. Through observational work and real-life encounters, the lessons learnt and challenges encountered have enabled researchers to determine whether, and to what extent, community-led CWQM is currently achievable in practice.
This paper provides the following findings and transferable guidance:
1. What practicalities should stakeholders consider when selecting and initiating community-led CWQM schemes?
2. What does a community-led CWQM approach look like in the UK and Taiwan?
3. Is community-led CWQM possible and to what extent are community groups likely to take full stewardship?
4. What do these findings mean when looking ahead over the coming years?
The main contribution of this paper is the detailed documentation and discussion of the practicalities and lessons learnt from the UK and Taiwan community-led CWQM pilots; our findings offer essential and transferable guidance for future work in this field and the wider environmental sector.
The remainder of this paper is structured as follows. Section 2 provides an overview of the UpStream project, including the methods applied for CWQM, the data handling and utilisation methods, the UK and Taiwan pilots, and how the practicalities were extracted. The practicalities, competencies, and lessons learnt (in the form of case studies/narratives) from our pilots are summarised in Section 3. Reflections, key challenges and recommendations for community-led CWQM are considered in Section 4 and the conclusions are summarised in Section 5.
The UpStream project (2021–2023) was created to aid improving water quality by working with communities to collect local and actionable data.
Building upon an initial prototype created by researchers at National Taiwan University (NTU), the UpStream project team further developed a device for CWQM, known as the “WaterBox” (Section 2.1), along with methods for transmitting, storing, visualising, and analysing the data collected (Section 2.2). These were tested in pilot catchments in the UK and Taiwan (Section 2.3). By developing monitoring plans and deploying WaterBoxes with citizens in two countries, the UpStream project team was able to identify the practicalities outlined in Section 3.
While the development and deployment of the WaterBox was a short-term goal, it was envisaged that, if successful, open, continuous and actionable data would be readily available and used by stakeholders to instigate behavioural and catchment management changes, leading to improvements in water quality in both countries. The project team also created a new and unique network that brought community groups, interdisciplinary researchers, businesses, students, and charities together to maximise knowledge exchange, including the practicalities of CWQM.
The UpStream project developed a device for CWQM called the “WaterBox”. The latest (2022) design and associated components are shown in Figure 3. The WaterBox was based on a prototype developed by NTU researchers who are also members of the Location Aware Sensing System (LASS) group, a social enterprise founded in 2015 that develops sensors for and with citizens. The design of the WaterBox is open, meaning that the device and its software can be used and modified freely, therefore it is publicly accessible (see GitHub page3). The version of the WaterBox used in this study measured pH, temperature, conductivity and turbidity (Figure 4); however, suitably skilled groups could customise the device to measure other parameters with alternative sensors. The WaterBox can then be used to calibrate the sensors prior to field installation, and on site as part of any ongoing maintenance checks (in our case, using sensor-specific calibration solutions). Power is provided by internal lithium batteries, which can be recharged using solar power.
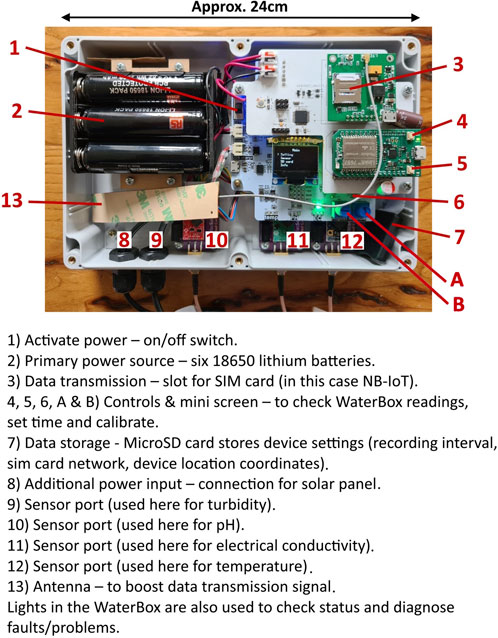
Figure 3. Internal components of the WaterBox which were developed for use in the UK and Taiwan.
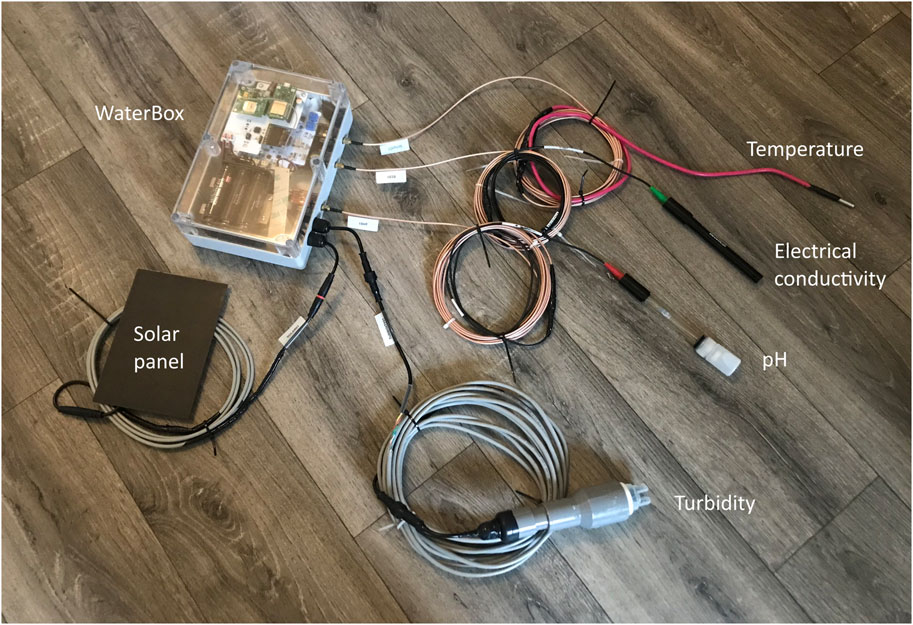
Figure 4. The layout of the WaterBox after the sensors and solar panel were connected.
The installation location (coordinates) and data recording settings for each WaterBox, including the frequency at which readings are taken, are configured by editing a text file (in JSON format) stored on the MicroSD card inserted into the device. The text file can be edited (e.g., using a smartphone or personal computer) and saved onto the MicroSD card, which is then inserted into the WaterBox. For the WaterBox installed in the UK, water quality readings were taken every 15-min. For the Taiwan WaterBox, readings were taken every 5-min.
The WaterBox is regarded as inexpensive by an order of magnitude compared with the costs of similar commercial devices (Lambrou et al., 2012; de Camargo et al., 2023), with the prototype (the WaterBox itself, excluding labour) costing around £800 (GBP). This cost includes all materials, batteries, the four basic sensors4 and associated circuits (the cost of sensors and sensor circuits makes up 50% of the total cost of the WaterBox). In-situ installation costs, including supporting installation equipment, can vary according to location and country. In our experience, the cost of materials and equipment required for installation ranged from £30 (GBP) (a temporary river location in Taiwan) to approximately £500 (GBP) at a river location in the UK, where longer cables, a large solar panel, gabion baskets, a secure enclosure, and fastening accessories were required.
Figure 5 outlines the WaterBox data transmission, handling and utilisation chain. Data packets from the WaterBox are initially transmitted via a Narrowband Internet of Things (NB-IoT) network to a Message Queuing Telemetry Transport (MQTT) broker run by LASS. The broker continuously publishes the data to subscribers, who can be individual developers, other applications, or dedicated time-series management databases, where data are stored and readily accessible for end use. For UpStream, two open-source time-series databases were tested, namely, “istSOS” and “InfluxDB”. Both worked well, but InfluxDB was found to be better tailored to IoT applications, having a more robust backup of all MQTT data, and allowing more customisation. As such, the current WaterBox system utilises InfluxDB. From this database, data can be retrieved via an Application Programming Interface (API) for different applications such as websites, mobile apps, and individual analyses. For UpStream, the “Water Quality Data Hub” (Figure 6) was developed to allow community groups and other interested parties to easily view, interrogate, download and utilise the WaterBox data. The website’s interface and features were co-designed with community groups from both the UK and Taiwan, as described in Section 3. Beyond the Water Quality Data Hub and guided by citizens’ needs, the UpStream team also tested post-analysis applications that can utilise data from the hub to conduct (for example,) spatio-temporal analyses and compliance against water quality standards. Although these applications are not the primary focus here, they offer insights into further possibilities for utilising the data collected and demonstrate flexibility.
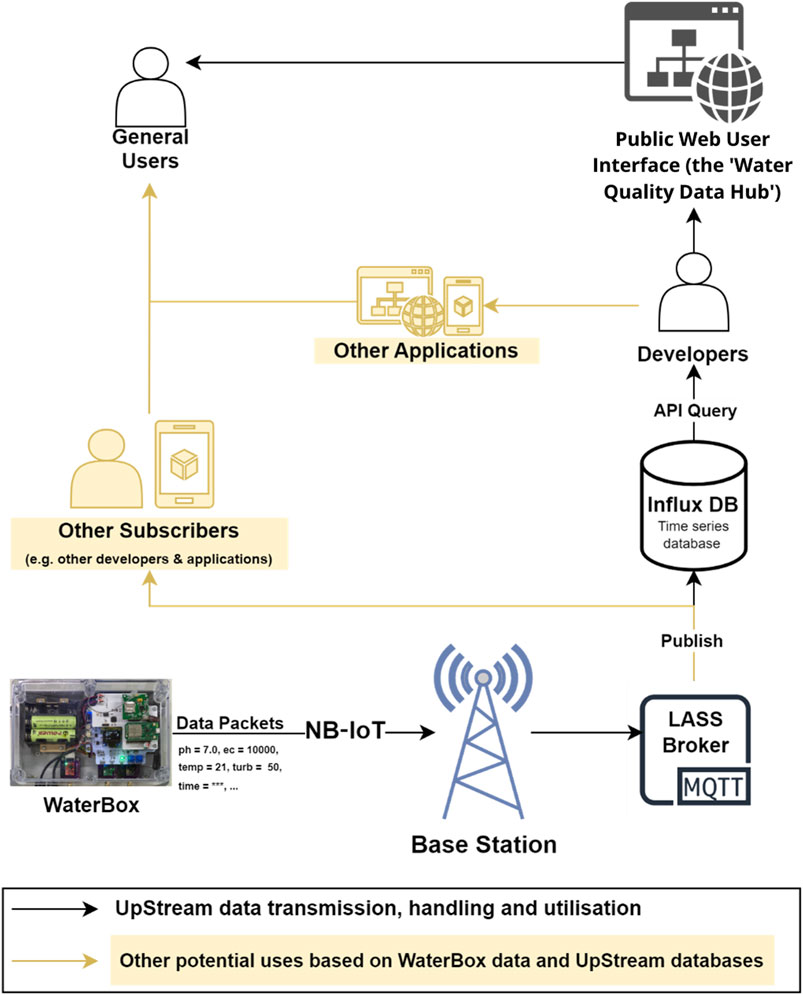
Figure 5. Data handling and processing pathway created and adopted by the UpStream team.
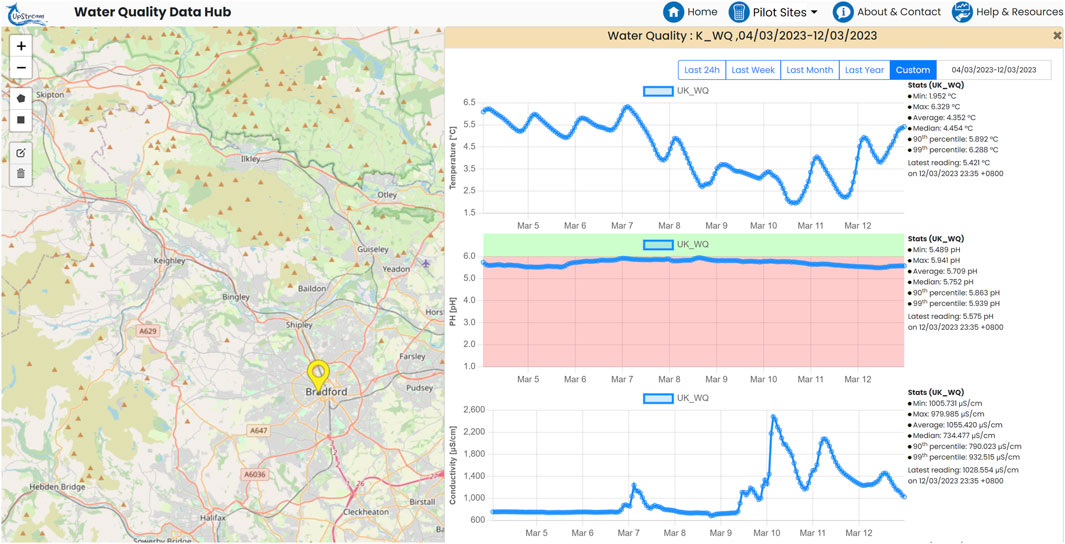
Figure 6. The UpStream data visualisation portal (known as the “Water Quality Data Hub,” see UpStream, 2024). This example (taken from the UK pilot) demonstrates the hub’s overall appearance and functionality. The portal was developed during the funded UpStream project and is not expected to be supported indefinitely.
Site-specific characteristics, available infrastructure (including power supply), and project constraints often dictate the choice of data transmission technology, which then determines factors such as power consumption, scale/range, and performance. With regards to UpStream, Long Range Wide Area Network (LoRaWAN) and NB-IoT were considered. LoRaWAN and NB-IoT are two leading low-cost wireless data transmission solutions available for remote data capture (Mekki et al., 2019). Although both enable IoT connectivity and are low-powered, LoRaWAN is refined for long range communication using nodes, gateways, and radio signals, making it easier to connect multiple devices to a local network. NB-IoT uses optimised (commercial) cellular technology which can cover hard-to-reach locations and benefits from low signal interference.
In Taiwan, NB-IoT emerged as the preferred choice from the outset, bolstered by a well-developed network and a range of practical, cost-effective offerings from network operators (Huang, 2021; Supplementary Material). Conversely, in the UK, the NB-IoT network was less mature, posing initial challenges in sourcing NB-IoT SIM cards for smaller-scale projects such as this. However, an affordable NB-IoT provider (1NCE) was identified in the UK, rendering it a feasible option. The final decision to employ NB-IoT in the UK was based on factors including network quality and reliability, operational costs, and the potential for replication in future studies. Annual data plans of 10 USD (approximately £8 GBP) have been sufficient for operating the test WaterBoxes in the UK and Taiwan, costs of which were covered by the UpStream project.
The UpStream project centred on two citizen groups: Friends of Bradford’s Becks (FoBB) in the UK and Taiwan Clean Water Alliance (TCWA) in Taiwan. These established citizen groups are self-motivated to improve their local water environment, which removed some of the common barriers to effective citizen science (Capdevila et al., 2020; Walker et al., 2020; Walker et al., 2021). The groups cover different geographies and water quality issues, as outlined in Sections 2.3.1, 2.3.2. Both groups were active prior to the UpStream project and were eager to collaborate and explore new opportunities. UpStream was regarded as “community-led” as these two community groups drove the need and desire for CWQM in their local environment.
Bradford Beck and its tributaries (known locally as “Bradford’s Becks”) are a network of predominately urban watercourses located in Northern England, UK (Figure 7). The total distance from the most upstream source to the downstream confluence with the River Aire is approximately 14 km, with a catchment area of 58 km2. The upper reaches begin rural, passing east through pockets of residential areas towards Bradford city centre. Through central Bradford, Bradford Beck itself becomes culverted, running underground until just east of Manningham, where it reemerges again to flow north towards the River Aire.
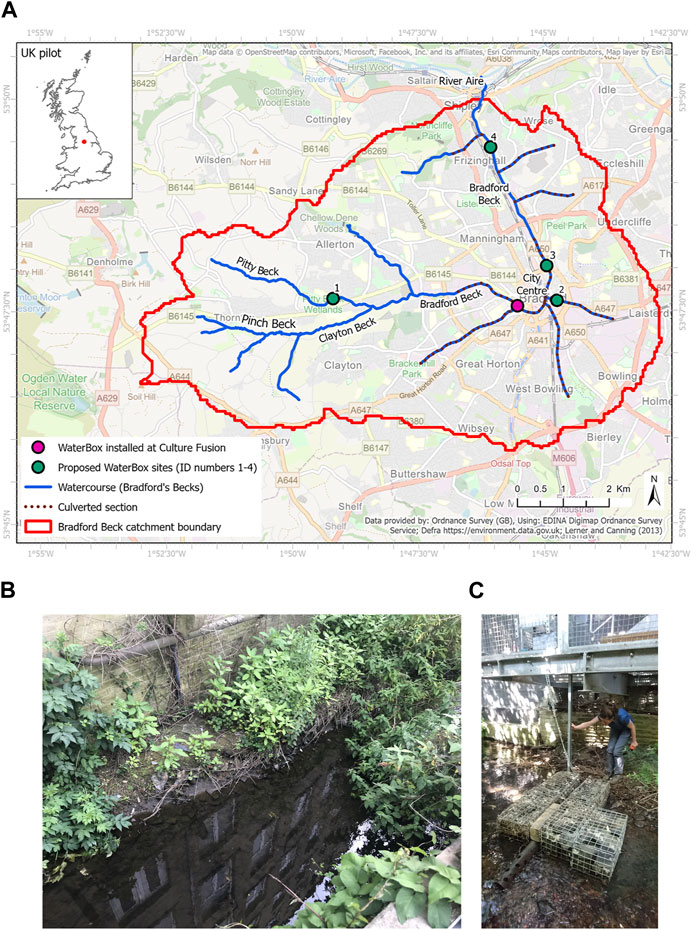
Figure 7. Geographical location of the UK pilot, including the Bradford Beck catchment, watercourses and other locations referred to in the main text (A). The WaterBox was installed in the Bradford Beck at Culture Fusion in 2022 (A,B), with sensors located within a protective pipe (C). This short (non-culverted) stretch of the Bradford Beck is flanked by steep-sided walls, which influenced equipment installation choices and reduced vandalism/theft concerns (B). Four additional sites were also proposed by the local community (A).
FoBB is an active community group that would like to see Bradford’s Becks clean, visible, accessible and thriving (FoBB, 2023b). Since preparing a catchment plan in 2013 (Lerner and Canning, 2013), FoBB has undertaken a range of local initiatives to improve water quality, including litter picks, collecting water samples for analysis, running interactive awareness sessions with schoolchildren, and reporting photographic evidence of pollution via an online app. FoBB has 1,200 members on Facebook5, although the number of active members is thought to be much lower.
The community has reported various water quality concerns over the past decade, including sewage fungus, high silt loads from new housing developments, low fish populations, and polluted reaches that are disconnected from Bradford’s city centre. Water Framework Directive Assessments carried out by England’s Environment Agency show Clayton Beck (Environment Agency, 2023b) failing to achieve the required standards for phosphates and biological quality, and that this “might” be due to poor farming or land management (explanation therefore categorised as “low confidence”). Bradford Beck, the reach that largely runs beneath the city, also fails to meet biological quality standards. Issues with certain hazardous substances such as mercury have also been noted by the Environment Agency (2023a). The causes are thought to be related to the heavily modified nature of the beck, water industry discharges and potential sewer misconnections. As sampling is limited, confidence levels are low when classifying and diagnosing the water quality status within this catchment. FoBB members consider formal water quality sampling as inadequate and infrequent, which is why they have formulated several visions for Bradford’s Becks, including enhanced water quality monitoring via citizens and real-time equipment (Lerner and Canning, 2013). Apart from isolated and short-term monitoring investigations carried out by professional stakeholders, CWQM was absent from the Bradford Beck catchment prior to UpStream.
Five WaterBoxes were initially planned for the UK but only one has been installed in the catchment to date and is located at “Culture Fusion” (Figure 7). While Bradford Beck is largely culverted here, Culture Fusion is part of a short 100 m stretch which as uncovered and accessible. The practicalities associated with installation and community involvement are discussed in Section 3.
The Touqian River is situated in north-west Taiwan, as shown in Figure 8. The total length of the river is approximately 63 km (from the most upstream point to mouth), and the catchment area is 566 km2 (Lee and Huang, 2018). It originates in the mountains of Hsinchu County, flowing north-west towards Hsinchu City, where the heart of Taiwan’s semiconductor industry lies. The river serves as the primary water source for the greater Hsinchu area, both for human consumption and industrial uses. The semiconductor industry, which is both a major user and a source of pollution for the Touqian River, heavily relies on this water. Despite Taiwan having a well-established river pollution index overseen by the Ministry of Environment (2023b), concerns persist about the lack of monitoring and control over industrial discharges into the river network2,6. TCWA was subsequently founded by a group of local mothers in 2016–2017 with the aim of ensuring the quality and long-term availability of clean drinking water. With 6,400 followers on Facebook7, the group undertakes regular river walks, gathers spot samples for analysis, and develops educational kits for use in local schools.
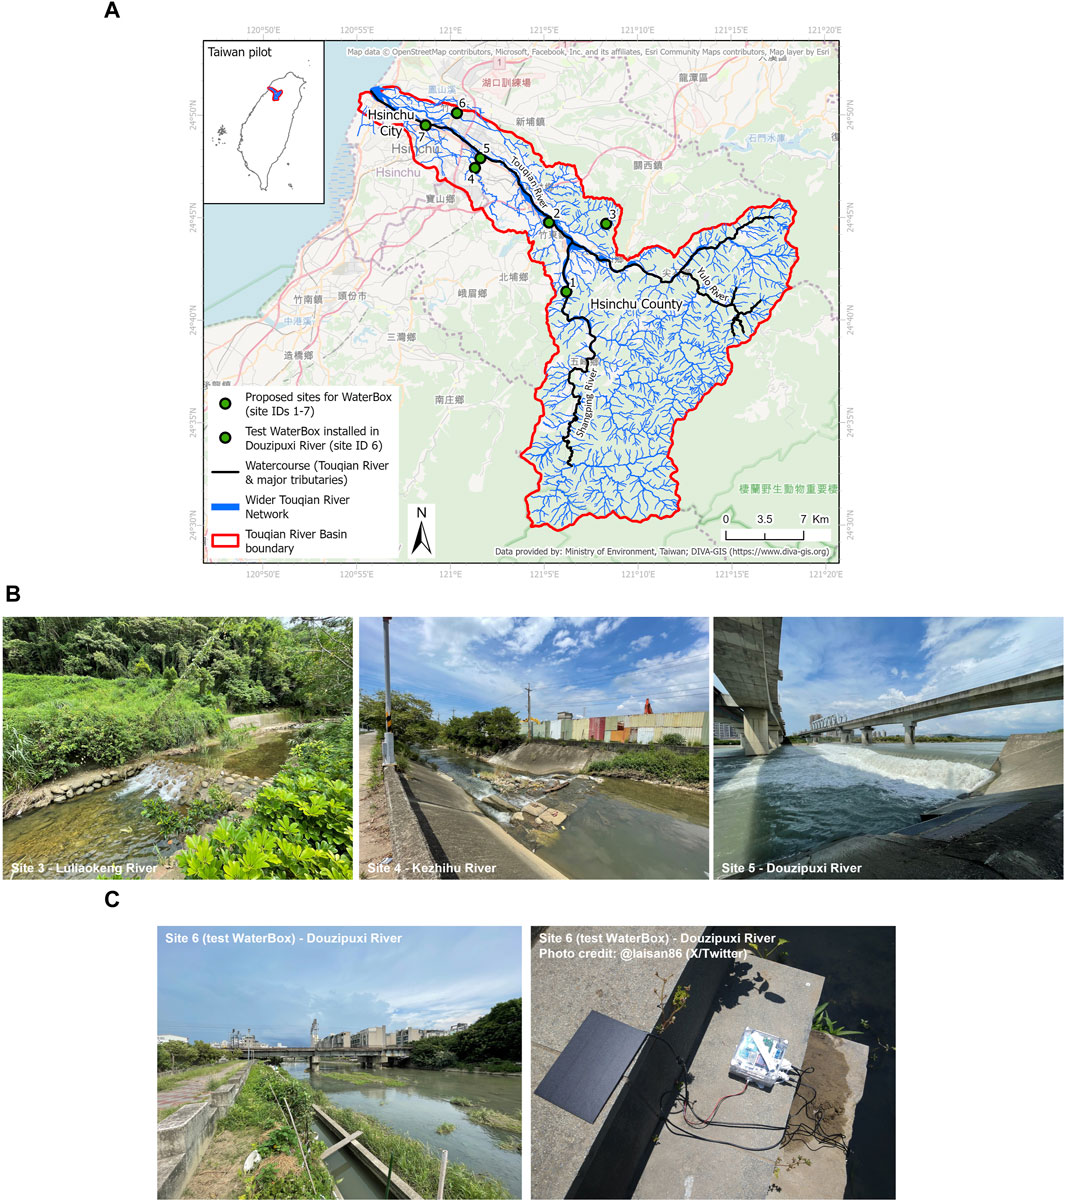
Figure 8. Geographical location of the Taiwan pilot, including the Touqian catchment, the Touqian river network and sites of interest (A). Although an earlier version of the WaterBox was installed in Douzipuxi River (tributary of the Touqian River) back in 2020 as part of a brief testing period (A,C), TCWA identified several locations suitable for CWQM along the Touqian River which also influenced equipment installation choices (B).
Taiwan’s Ministry of Environment routinely samples water quality monthly at nine locations along the Touqian River, and its Water Resources Agency samples at 11 points every 3 months (therefore offering quarterly/seasonal temporal resolution) (Ministry of Environment, 2023a). A range of chemical, physical and ecological parameters are reported and are available to the public via an API (Ministry of Environment, 2023b). Continuous monitoring of waterbodies, including rivers, is not widespread in Taiwan; it is only performed at specific locations during limited periods to inform investigations.
Despite TCWA’s strong motivation and keen interest in monitoring river health, and even though target monitoring locations have been co-identified, it has not yet been possible to install the anticipated WaterBoxes (using the methodology described in Section 2.1) in the Touqian River catchment within the UpStream project. The practical reasons for this and transferable learning points are explored further in Section 3, but are generally related to delays with the WaterBox production, the challenging nature of installation in some of the selected monitoring locations along the Touqian River (Figures 8A, B) and the lack of technical support for TCWA, combined with a shortage of resources from the UpStream team, particularly after project funding ended. However, an earlier version of the WaterBox was installed prior to the UpStream project at a test location on the Douzipuxi River in 2020, a tributary of the Touqian River (site 6 in Figures 8A, C), where sudden fish deaths have been observed on multiple occasions in the past. This test, along with preparing for permanent WaterBox installation at the seven sites identified, provided sufficient observations for TCWA pilot to be a focus for community-led CWQM and are thus reported here.
Table 1 summarises the key stakeholders who interacted with the community-led CWQM pilots. Note that, despite intending to be community-led, a range of stakeholders were involved in this collaborative project due to various challenges encountered (as the practicalities in Section 3 highlight). Stakeholders have been divided into four groups based on their expertise, role, whether they were paid, and whether they were regarded as local members of the community. Although the UpStream project involved stakeholders from specific organisations, these four distinct groups are relatable and hence enhance the transferability of our findings.
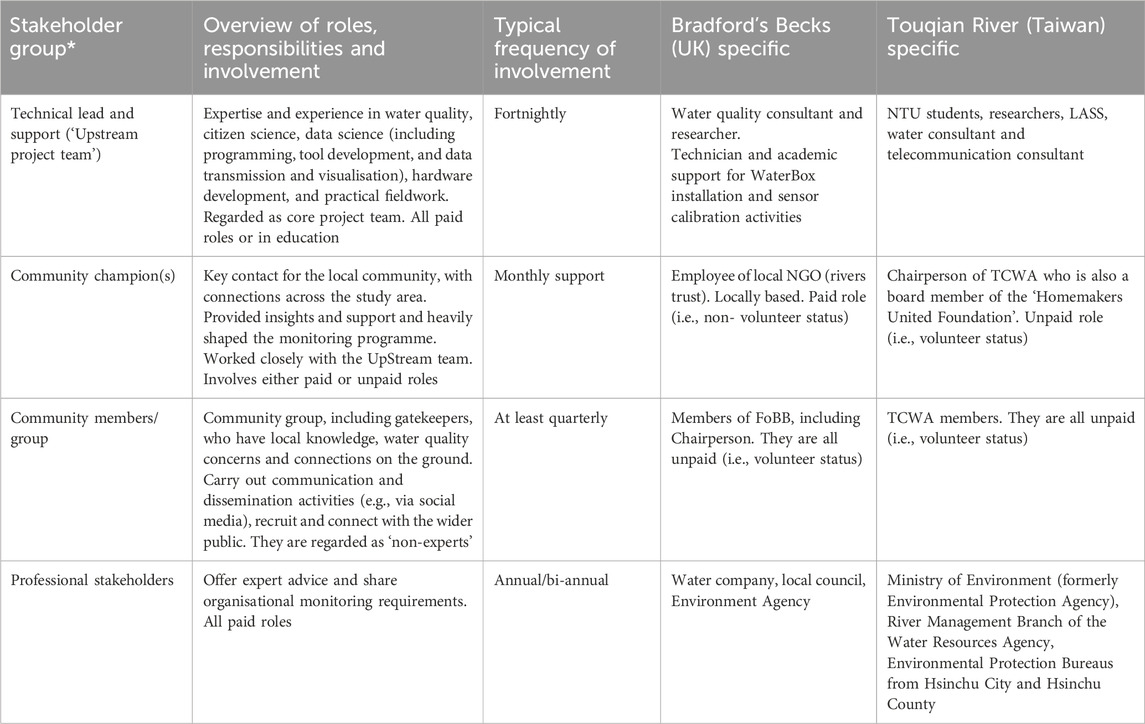
Table 1. Key stakeholders and their involvement in the UK and Taiwan pilots. Frequencies are a simplification and inconsistent over time (estimated values are shown). *Stakeholder group names are referred to throughout the manuscript (Section 3–5) as a way of documenting and discussing practicalities and stakeholder capabilities.
The authors were able to manually observe, document, track, categorise, quantify, and reflect on the practicalities encountered throughout the community-led methodology described. These findings are poorly documented to date; they include considerations and challenges that significantly dictate whether, and to what extent, a community-led CWQM programme of this kind can succeed. Practicalities were recorded within a collaborative (online) whiteboard space so that they could be documented by the project team throughout the CWQM process.
Observational work and documentation of the practicalities have enabled the team to fulfil the objectives outlined in Section 1 through the following in Section 3:
• Generation of a checklist which identifies the practicalities associated with community-led CWQM.
• Sharing examples of experiences and accounts from the UK and Taiwan pilots (in the form of mini case studies/narratives) which put the practicalities into context.
• Manual tracking of the individual practicalities to determine which stakeholder group (outlined in Table 1) was able to lead them in each pilot, and identify any challenges encountered.
As no two catchments (hence no two monitoring networks) are the same, practicalities are presented in a generic and transferable manner (Section 3.1) to enable future users to apply findings to their own sites. This is followed by case study specific examples to put UpStream’s dominant practicalities into context (Sections 3.2, 3.3). Owing to the substantial number of practicalities discovered and considered during the UpStream pilots, a detailed and transferable list of practicalities (our main results) is presented in the Supplementary Material. This resource intends to offer a comprehensive checklist, which we accept may not be fully exhaustive given the complexity of catchment monitoring. Nevertheless, the checklist offers a sufficient number and type of practicalities for community groups (and/or other stakeholders) to appreciate at the outset, and decide whether citizen science, in the form of CWQM, is appropriate for them.
The categories and specific practicalities described relate to the process of implementing community-led CWQM, by, or alongside, citizens. Practicalities do not cover the benefits or limitations of citizen science as a practice within the water sector; these are documented widely elsewhere (for example, Buytaert et al., 2014; Walker et al., 2020; Kelly-Quinn et al., 2022).
Based on the two pilot sites, the UpStream team identified the following four categories to describe the practicalities of community-led CWQM: Technical, Social, Economic, and Wider Responsibilities. These categories were further divided into 23 sub-categories, as presented in Table 2. Within each sub-category lay the individual practicalities (104 in total); Figure 9 presents a visual representation of this hierarchical dataset.
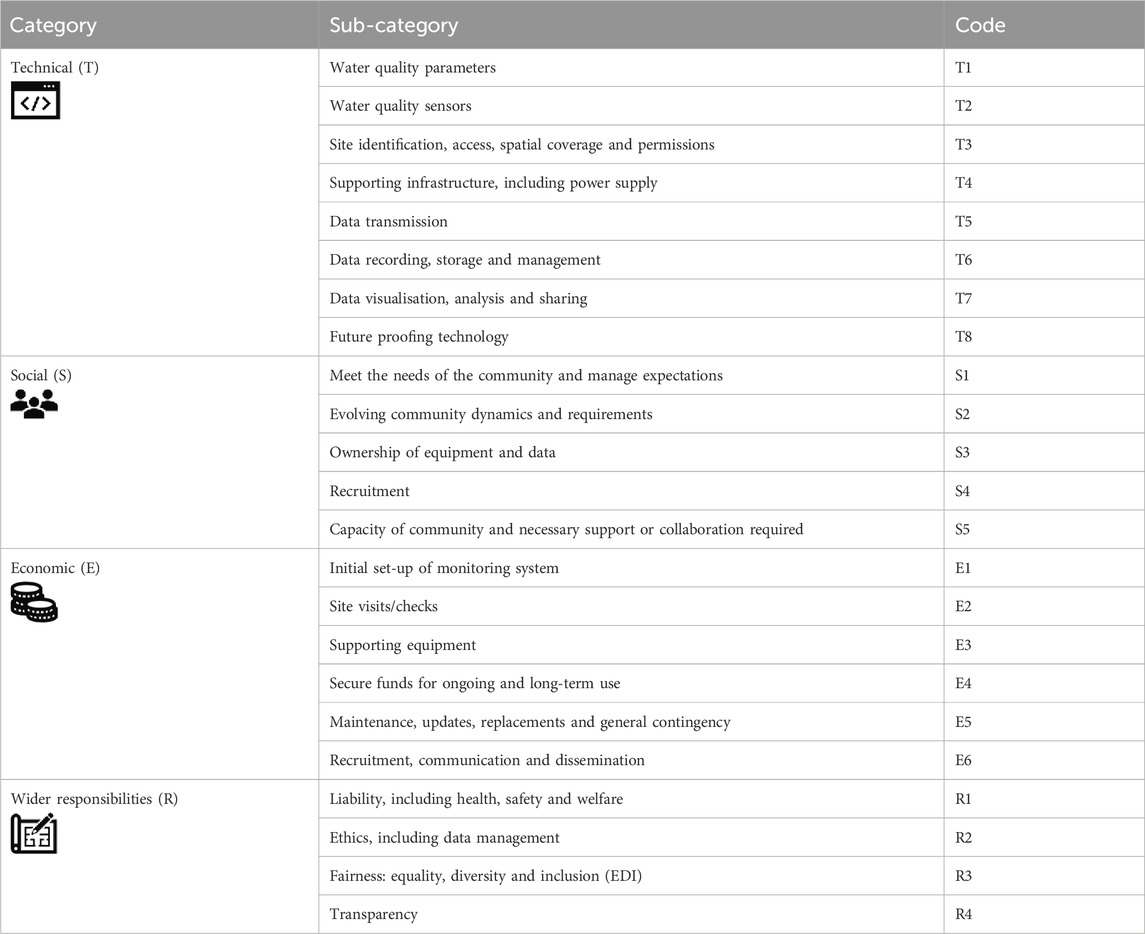
Table 2. Summary of the practicalities discovered by UpStream. Refer to the Supplementary Material for a more detailed list which can be cross-referenced with the assigned codes listed here.
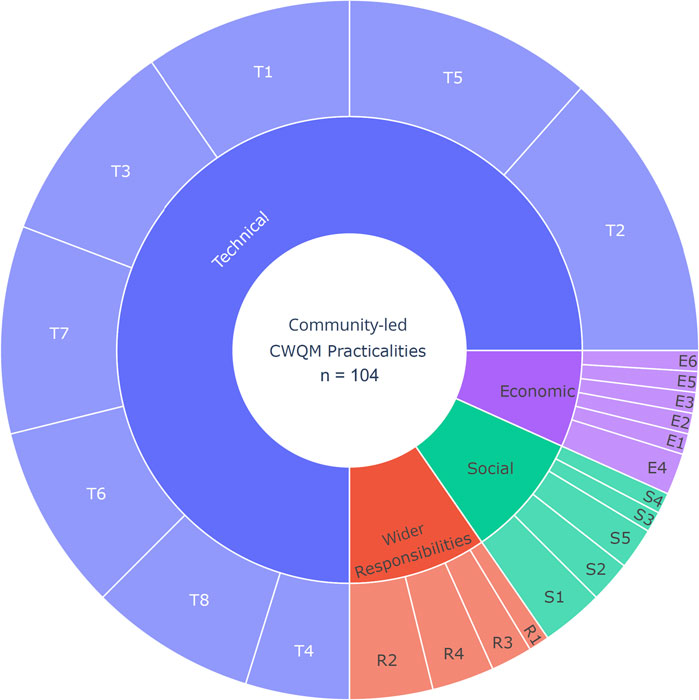
Figure 9. A hierarchical display of the practicalities identified within each category and sub-category (refer to the Supplementary Material for a detailed list and Table 2 for code lookup). Segments are proportional to the number of practicalities encountered in each category.
Out of the 104 individual practicalities identified, 75% (78) were technical, followed by social (9%), wider responsibilities (9%), and economic (7%). Despite community-led monitoring being a much more social, inclusive, and collaborative activity compared to traditional monitoring, technical considerations still exist and dominate. High technical literacy is required to fulfil the practicalities and this requirement is very likely to hamper a monitoring programme fully led by the community. For example, 12 practicalities are listed under “telecommunications and data transmission” alone, and eight practicalities relate to “future proofing technology”. Technical considerations are complicated by the rapid evolution of technology, meaning that a monitoring system can quickly become outdated. Other important technical considerations relate to the physical characteristics or behaviour of the study area, which is where local knowledge is likely to prevail. However, many of the social, economic and wider responsibilities identified are typical of any kind of community-led or community-based activity, or considerations which individuals, community groups or “Friends of” networks encounter. For instance, ownership, management of expectations, evolving groups, volunteer recruitment, advertisement, and sourcing of initial and ongoing funds are common activities fulfilled by established (formal) local community groups.
It has been observed that not all practicalities are relevant in every situation; the degree of relevance depends on how participatory and community-led the “project” is intending to be from the outset (hence the objectives). By implementing the UpStream methodology, it has been found that the following overarching considerations must be addressed before cross-checking against the full list of practicalities:
1. Realistically, are there plans for a full community-led monitoring network (completely led and driven by the community) or are there plans for partial or basic community involvement?
2. How long do you intend the CWQM system to work? Is it a temporary project or is it expected to run indefinitely?
3. Do you have the means to fund a monitoring system (short- or long-term)? What type of funding model does this fall under?
UpStream initially set out to pilot a fully community-led CWQM network that would continue beyond the lifetime of the funded project (2021–2023). This goal, which would ultimately encourage stewardship, data utilisation and sustainable management, is gaining appreciation across the water sector (for example, Njue et al., 2019; de Sherbinin et al., 2021; Starkey and Rollason, 2023). However, the UpStream team discovered that this was not possible at the two pilots presented. This is primarily because of the technical hurdles encountered during the initial setup of the community-led CWQM system, timescales, and the community’s capabilities. Nevertheless, community members engaged with and/or supported many of the 104 practicalities listed, and were able to offer valuable insights, including ground-truthing decisions initially driven and made by the UpStream team (Sections 3.2, 3.3). We therefore found that community-led CWQM is possible, but the extent to which it is “community-led” can vary.
The following accounts (from the perspective of the UpStream team—the authors) were extracted from the pilots as they offer valuable insights and provide practical context, including key competencies and challenges encountered. The narratives have been used to communicate whether tasks were community-led or whether others (predominantly the technical team) were required to overcome specific challenges. Note that not all practicalities are described (all 104 are covered in Section 3.3), we have provided key examples which characterise our experiences. Reference numbers can be cross-checked with the Supplementary Material.
Prior to the UpStream project, the community group (FoBB) and community champion informally observed poor water quality and reported their concerns to relevant authorities. For example, FoBB’s “PollutionWatch” initiative encouraged volunteers to become pollution spotters who took photographs and recorded observations via their website or dedicated pollution app8. Many pollution incidents observed by the community are also posted on FoBB’s Facebook page5 or written up as a report to raise further awareness. The group is therefore aware of the pollution issues and parameters (T1.A, T1.B) and has disseminated these widely using digital and printed materials, for example, “The Bradford Beck Film” (FoBB, 2023a).
FoBB volunteers hosted UpStream team members in July 2021 for a catchment walkover to witness pollution issues firsthand. While FoBB’s ultimate goal is to restore local watercourses and enhance accessibility, they currently prioritise pinpointing, reporting, and reacting to pollution incidents (T1.I). The walkover triggered discussions around monitoring priorities, highlighting major pollution issues such as blocked sewers, litter, sewage fungus, fatbergs, and sediment (Figure 10). However, FoBB recognised the impracticality of directly monitoring all these (T3.G).
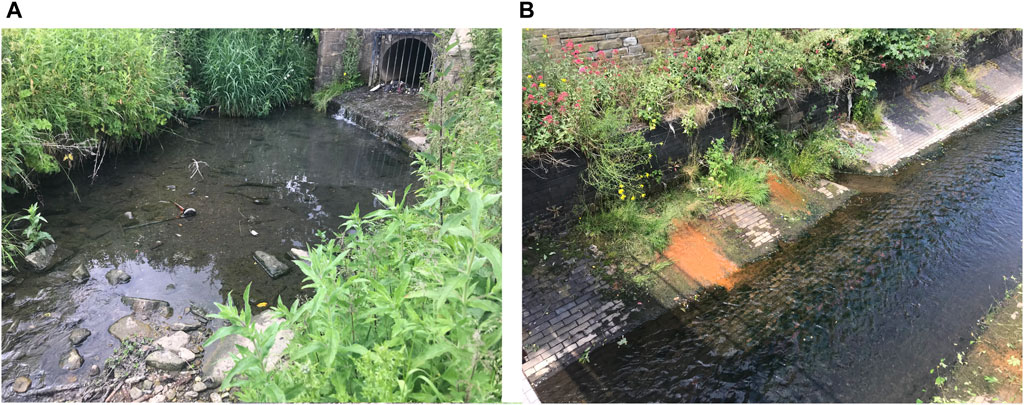
Figure 10. Discoloured and polluted waterbodies identified by the community group (FoBB) and community champion. These two sites ((A) shows site 1 and (B) shows site 4) were identified as possible CWQM locations (see mapped locations in Figure 7).
FoBB and the community champion suggested collecting common continuous water quality indicators like pH, turbidity, temperature, conductivity, ammonia, and dissolved oxygen to track trends and correlations (T2.A). Due to numerous combined sewer overflows being present in the catchment, E. coli (Escherichia coli) monitoring was emphasised as an indicator of sewage contamination. Camera footage was also considered as a visual complement to quantitative datasets obtained from sensors. However, FoBB acknowledged that some of the desired parameters may not align with available sensor technology or be physically practical to observe due to site-specific constraints. For instance, affordable E. coli monitoring technology is not readily available. Despite the community realising these limitations, aligning monitoring technology with end-user needs proved to be challenging.
During the July 2021 catchment walkover, FoBB and the community champion led the UpStream team to various points along Bradford Beck and its tributaries, defining “clean” water at Pinch Beck (a headwater tributary) and degraded water at Pitty Beck and the Bradford Beck itself (Figures 7A, 10). The latter section is largely hidden in culverts beneath the city, posing a significant monitoring challenge which was first acknowledged by FoBB. Despite this, the community group identified five potential monitoring sites (Figure 7A) crucial for understanding pollution sources, types, and concentrations (T3.A, T3.B). These sites, if continuously monitored, would provide valuable insights into ongoing pollution issues and isolated incidents, focusing attention on FoBB’s primary concerns. The distribution of these sites could help calculate pollution travel times between each WaterBox. The UpStream team advised on the feasibility of monitoring each site, considering constraints like power, data transmission, site access, and security, while FoBB filled any gaps with their local knowledge. It was the UpStream team who later identified which sensors were available and could achieve FoBB’s requirements (T2.A).
Of the five monitoring sites identified, one was located within Central Bradford, situated within a culvert (site 2 in Figure 7A). Access to this site for CWQM would be restricted via a manhole cover located on a busy public pavement (T3.C, T3.D, T3.G). Later discussions revealed that access would be restricted to specialists trained to work in confined and hazardous spaces, and permissions would be required for sensor installation immediately below the manhole. Despite logistical challenges, all stakeholders involved agreed that successful monitoring here could yield valuable continuous water quality data for the Bradford Beck, offer learning opportunities for community-led CWQM, and reduce the need for manual water sampling. However, as of April 2024, no equipment had been installed at this location (as Sections 2.3.1, 2.3.2 introduced), therefore we were unable to conclude whether this below-ground site could be feasibly monitored.
Given that FoBB and the community champion anticipated real-time water quality information, data transmission dictated many technical decisions (T5.A, T5.C). Despite the adoption of NB-IoT to transmit data wirelessly from the WaterBox to the web (Figure 5), exploration of alternative transmission solutions took place. The community champion was aware of the local council’s LoRaWAN project (“Smart Street Lighting project”), which provides remote data collection (T5.K). LoRaWAN, as a low-powered wireless network, enables long-range data transmission across kilometers using a single gateway (Sendra et al., 2023), offering cost-effective and bespoke network management. The UpStream team engaged with the council to discuss the LoRaWAN project which revealed the ongoing widespread installation of LoRaWAN gateways for remote control of lamppost lighting across the Bradford District. The council confirmed that their system had available capacity for external projects to connect sensors to their network. While NB-IoT was officially used, the WaterBox equipment successfully connected to the council’s LoRaWAN network during a trial led by the community champion. Such collaborative networks can connect multiple sensors and make data accessible across various sectors relevant to local community groups. Existing networks such as this could also reduce the monitoring (technical) burden on community groups such as FoBB in the long term.
Some of FoBB’s key concerns for CWQM were around theft and vandalism. Given past anti-social behaviour within the area, FoBB knew that it could be an issue so it was considered from the outset when suggesting sites (S2.B). However, given the number of technical practicalities to consider, FoBB, the community champion and the UpStream team had to balance the following needs when sourcing locations:
• Accessibility: A safe location was required for volunteers to access the monitoring equipment over time. Footpaths and proximity to roads make it easier and quicker to complete maintenance.
• Power: solar panels were intended to power the WaterBoxes, but this would require maximising exposure to the sun, rather than hiding them away.
• Communication and knowledge exchange: The WaterBoxes could be used to raise awareness about CWQM, promote the data generated, and recruit new volunteers (e.g., via signage). But this would further maximise their exposure.
• Permissions to install: Landowners would need to approve final locations and often have alternative preferences that can make other technical constraints harder to fulfil.
Despite the importance of the above practical considerations, these security concerns took precedence over other practical considerations. For instance, the final monitoring device installed at Culture Fusion (Figures 7A–C) was strategically placed away from public view, hidden within a secure enclosure, and fastened to a wire cage (Figure 7C). While this approach may contradict a community-led ethos, FoBB deemed it necessary to safeguard the WaterBox against potential issues.
Although only one WaterBox was installed at the time of writing, it still generated numerous tasks that were largely carried out by one person—the community champion (S5.B). Pre- and post-installation checks were required, including obtaining landowner permission, signal testing (NB-IoT and LoRaWAN data transmission), battery replacements/charging, cleaning, and debris removal (to avoid sensor fouling) after heavy rain and high flows. The community champion played a leading role in providing feedback to the UpStream team and FoBB members. Passionate about seeing the WaterBox operate effectively and produce valuable data, they invested considerable time in these tasks. However, such responsibilities could overwhelm unpaid volunteers, especially if they are managing numerous CWQM sensors across a larger catchment area. FoBB disseminated information about the WaterBox and monitoring activities through quarterly meetings, their website, and Facebook page. Despite these efforts, unpaid volunteer involvement has been minimal. Volunteers need to understand the extent of these tasks and have their expectations managed before committing time to them.
Sensor calibration proved difficult for the community champion to undertake; calibration tasks were completed in the laboratory (initially) and thereafter in the field (infrequent—every few months) by the UpStream team. Ongoing calibration is still problematic and is a limitation for the resulting Bradford Beck data, thus should be addressed in future community-led schemes.
As outlined in Section 2.1, the WaterBox and the accompanying four sensors cost approximately £800 (GBP), and a further £500 (GBP) was required for site-specific installation equipment to ensure that the device was safe and secure. The costs associated with the installation of Culture Fusion (Figure 7) were covered by the UpStream research grant (E1). UpStream also allocated funds for the remaining four WaterBoxes which are yet to be installed within the Bradford Beck catchment (as shown in Figure 7A). Although these costs are considerably lower than those of CWQM systems which professionals typically invest in, ongoing costs such as maintenance, power, data transmission, replacements, and travel expenses have not yet been accounted for by FoBB or the community champion (E2, E3, E5). At the time of writing, FoBB has no direct budget set aside for the long-term use of the WaterBox, but they do have the expertise and experience of sourcing funding if members decide to keep the CWQM system going. It was noted that sourcing individual NB-IoT SIM cards from well-known telecommunication providers could be extremely costly for the community group.
As described in Section 2.1, the UpStream portal was developed, remotely linking the Bradford Beck WaterBox to end data users (Figure 6). Despite its creation by the UpStream team, FoBB and the community champion knew that making water quality data accessible and meaningful online was a priority for their pollution detection activities (R2.B). FoBB was able to provide feedback on its usability but acknowledged that they require technical support with the creation and ongoing maintenance of the data portal itself. It is understood that only a limited number of people use the portal; efforts are required to share the tool (therefore data) more widely and maximise end applications.
FoBB engages the wider local community through various activities, while utilising their website and social channels for communication. In-person advertising has been achieved through signage and running local events. FoBB openly promotes their work to encourage new members to join and discuss all environmental (water) matters in their quarterly meetings (R3.A), with detailed minutes available on their website. Their involvement in the CWQM programme and UpStream project follows the same transparent approach. The group’s role, constitution, and Privacy Statement, including details about a Data Protection Officer (R2.A), are openly published online. With a capable team, FoBB actively advertises, recruits, shares knowledge, and provides updates, leveraging these existing attributes to promote the CWQM programme.
FoBB and their community champion carefully selected locations within the Bradford Beck catchment area to install CWQM equipment, understanding the importance of obtaining permission from landowners (R4.B). This permission was necessary to attach WaterBox equipment to nearby structures and guarantee continued access for maintenance. Although most landowners were willing to engage with FoBB, difficulties arose at a particular location because of security worries and a less established relationship with the community group. As a result, this site was not selected for permanent CWQM deployment, but FoBB ensured arrangements were made to maintain ongoing access at the Culture Fusion site.
Founded by five mothers from Hsinchu City after a 2016 Touqian River expedition, TCWA uncovered severe pollution issues upstream of the Longen Weir abstraction point, which supplies 90% of the city’s water. They found industrial and household wastewater contaminating the river, while clean water from the Shangping Weir was diverted to the semiconductor factories in the Hsinchu Science Park. Their efforts led to a successful complaint to Taiwan’s Control Yuan, prompting official investigations and actions to address the situation. TCWA conducts bi-weekly river walks, collects water samples for analysis, develops educational kits, and offers training courses for Water Patrols nationwide. More recently, the group also led a successful referendum campaign for autonomous waste and sewage regulation in Hsinchu City9. TCWA is therefore familiar with the pollution issues and water quality parameters of interest (T1.A, T1.B, T1.F).
In August 2021, TCWA members, including the community champion, hosted some of the UpStream team members for a catchment walkover to inspect key pollution discharge points and potential monitoring sites, and discuss motivations, goals, and requirements. Seven candidate monitoring locations were identified based on resource availability and community capacity to maintain them, as detailed in Table 3 (T3.A, T3.B, T3.G). These sites offer a baseline for assessing “clean” water, upstream of pollution sources, as well as locations close to point pollution sources and others near water intake points. The proposed sites and installation constraints listed in Table 3 were largely identified by the community group and community champion.
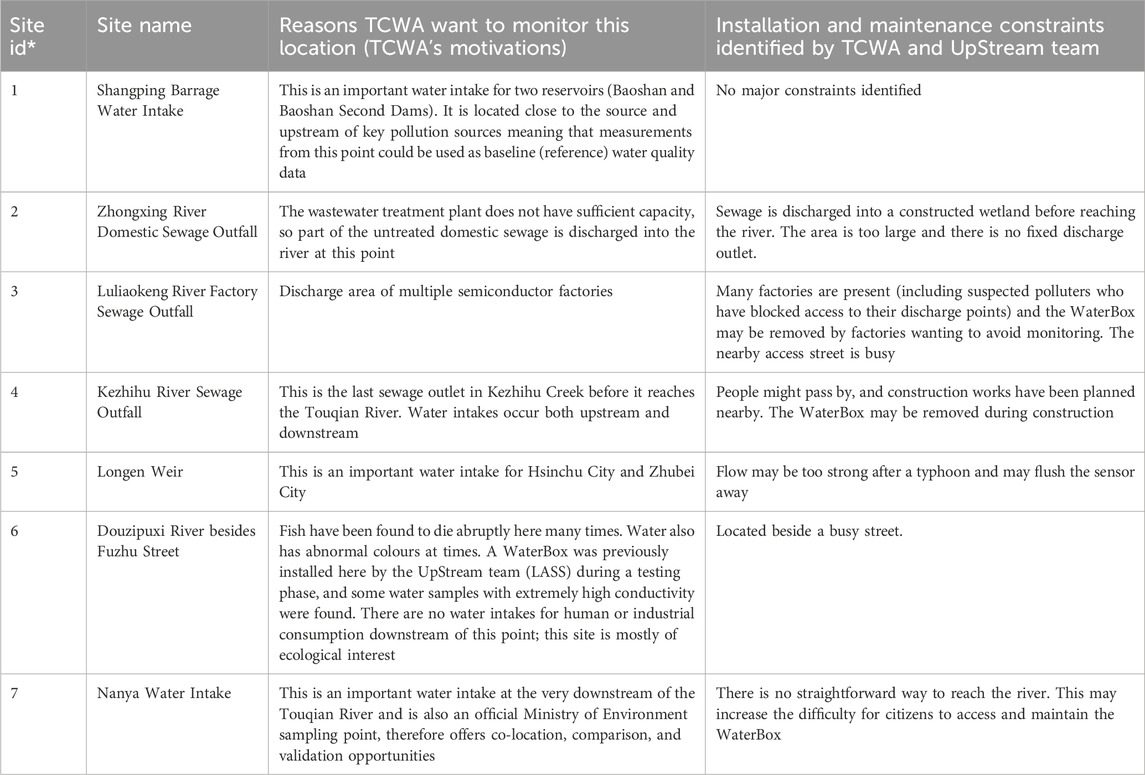
Table 3. The proposed CWQM sites identified by TCWA community group. Table includes reason for inclusion and potential constraints for installation and maintenance. *Refer to Figure 8A for mapped site locations.
TCWA and the community champion proposed collecting common continuous water quality indicators, including temperature, pH, ammonia, phosphorous, and conductivity, while aiming to assess metal-associated pollution from local industries. They also emphasised the importance of E. coli monitoring due to wastewater discharge concerns. While acknowledging limitations of initially monitoring all desired parameters using the WaterBox, they confirmed that pH, temperature, and conductivity would be a useful starting point, enabling the detection of pollution spikes and spatio-temporal patterns (T1.I).
It is acknowledged that the technical practicalities were not explored in as much detail as originally planned given that the new WaterBoxes have not yet been installed in the Touqian pilot. However, we were able to learn from experiences with the previous WaterBox test at the Douzipuxi River (a tributary of the Touqian River). The WaterBox at Douzipuxi was installed by the technical team (LASS) in 2020 during Taiwan’s annual Presidential Hackathon as a proof of concept. It was deployed for less than a month with a simple installation using an existing concrete staircase on the riverbank (Figure 8). During this brief test, the WaterBox performed well with minimal technical adjustments required. Basic visualisation of and access to a subset of the collected data was achieved using open-source software10 (T7.A, T7.B). TCWA were informed about the findings but were not actively involved. Despite its brevity, the test was encouraging, confirming the occasional spikes in electrical conductivity levels reported by TCWA community champion during the August 2021 walkover. This experience and utilisation of the data has further fuelled TCWA’s interest in deploying the proposed WaterBoxes along the Touqian River.
Unlike the UK pilot, TCWA did not view general vandalism as a major issue in Taiwan, but they are wary of potential polluters tampering with the WaterBoxes to evade monitoring. Some industries in the Touqian area have restricted access to discharge points, limiting water quality data capture (S1.C). Social factors played a minor role in site selection; instead locations were primarily chosen based on the practicalities listed in the technical criteria (T1-T8), including water quality significance and accessibility. TCWA identified these social practicalities, but their full impact (S2.B) will be clearer after installing the proposed WaterBoxes.
Volunteer requirements, availability, skill set and commitment (S5.B) are yet to be assessed for the Taiwan pilot as the new WaterBox installations are pending. However, TCWA members have been very responsive throughout the UpStream project and remain keen to support the installation and operation of the WaterBoxes, as long as they receive technical support. Furthermore, they have been informed of UpStream findings to date to ensure that they have a current awareness of requirements. Similar to the UK pilot, long-term sustainability of volunteer efforts and commitment remains to be observed.
Regarding the Touqian pilot, the cost of the first five WaterBoxes has been covered by the UpStream project grant which includes a small allowance for installation accessories (E1.A). This budget has been set aside and is available for the final production and deployment necessary to complete these activities. The final costs (including staff time) required for WaterBox operation and maintenance are yet to be determined; however, TCWA and the community champion are aware of this practicality (E5.A). There are also two other sites which TCWA would like to monitor (Figure 8A), the costs of which are yet to be secured from an alternative source.
Permission for WaterBox installation along the Touqian River is not regarded as a major concern for TCWA as most target sites are easily accessible from public roads. If required later, TCWA can obtain permissions through their government agency contacts (R4.B). Health and safety constraints were also identified during the catchment walkover (Table 3). The UpStream team purchased insurance coverage for team members and developed health and safety checklists prior to site visits. Although examples of good practice can be shared with TCWA, we are yet to observe this once the proposed WaterBoxes are in place.
In terms of data accessibility and management, TCWA’s requirements were integrated into UpStream’s design to ensure open and accessible data, promoting transparency and wider community engagement (R2.B, R4.C). Similar to FoBB, near real-time data access is crucial for TCWA to promptly detect pollution spikes, trigger in-person visits, and take any necessary action. Once the WaterBoxes are installed along the Touqian River, TCWA plans to utilise their dissemination channels (especially Facebook7) to widely share data, and hence fulfil their transparency and educational goals (R2.B, R4.C). Branded UpStream stickers were also designed for the WaterBox lid (Figure 11) which will be used once the devices are installed to further raise awareness and encourage transparency. While Taiwan’s data protection regulations and enforcement are generally more lenient than those in the UK, ethical considerations and data management were discussed with TCWA and other project stakeholders (R2.A). The pilot also refrained from collecting personal information throughout the project to mitigate potential risks given that the collection of water quality data was the end goal, not personal information. For example, user logins were intentionally omitted from the Water Quality Data Hub. Further training may be required with TCWA around these practicalities once the WaterBoxes are ready for installation.
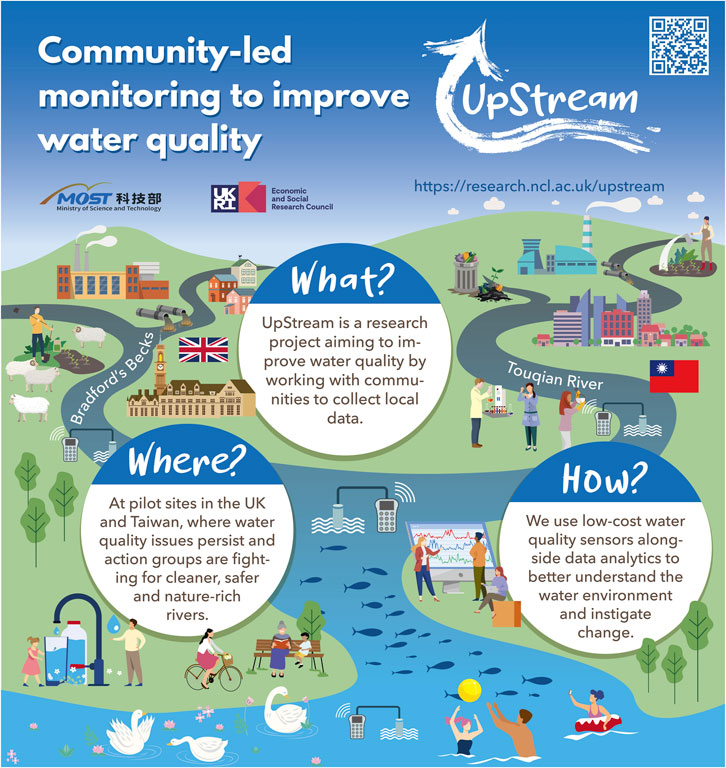
Figure 11. The engagement sticker (Mandarin translated into English) designed by the UpStream team for TCWA to use on their proposed WaterBoxes to raise awareness and encourage transparency.
As briefly introduced in Section 2.2, FoBB and TCWA required access to real-time data in a visual and meaningful format once the WaterBoxes were/are in place. As the WaterBox essentially offers an open and “plug-in” multi-sensor approach to CWQM, a ready-made visualisation solution did not exist (T7.G). Data recording, storage, visualisation, and automatic analysis were beyond the capabilities of FoBB, TCWA and their community champions. As a result, the UpStream team created a simple data visualisation portal (Figure 6) that they could use to view, interrogate, download and utilise the water quality data (T7.A).
The portal is accessed via a URL (UpStream, 2024) that does not require an account or login; once loaded it offers (T7.B, T7.F, T7.I, T8.G, R2.B):
• A map that accurately plots where the WaterBoxes are located.
• Clickable icons for each WaterBox that opens the corresponding dataset.
• Interactive plots showing current and historic water quality data.
• Current and historic battery levels.
• An “About” page which links to various user guides and information on the UpStream website.
• Data download, including raw data in CSV format and graphical plots in PNG format.
• Basic summary statistics of the data.
An API function was also enabled to foster future usability, however it has not yet been launched on the online portal. Combined, these functionalities are not unusual or new for online environmental data portals, but generally require digital expertise to build and run them (for example, Smith and Turner, 2019). It can be complicated to route data from multiple sensors to a server, and then to a data visualisation portal (as Figure 5 illustrates).
Despite the portal’s infrastructure being created and facilitated by the technical team (hence not the community), UpStream’s simple mapped-based graphical user interface (the design) was co-created in consultation with the two community groups via a demonstration workshop and follow-up consultation. The community groups (leads and champions) were specifically tasked with commenting on the portal’s overall look and functionality, availability of supporting information, views on the map layout, presentation of the sensor data, and recommendations for improvement. Feedback included “Looks good to me, it’s simple and intuitive” and they iterated the importance of the public’s “layman” perspective. They asked whether they could see regulatory thresholds using a coloured “traffic light” system (good, moderate, and high) for reference. Participants were primarily interested in accessing simple and relatable information, and ensuring the portal met their primary goal of reacting to pollution incidents. Requests for further improvements and tailoring of the data portal will always exist, particularly as technology evolves.
FoBB and TCWA confirmed that they were content with the tool and type of outputs offered at the time of release. However, while simple statistics are automatically provided on the portal, manual analysis and interpretation of the data are still required. Local knowledge from the community is invaluable during these interpretation and data utilisation tasks. For example, the UpStream team identified a conductivity spike in the Bradford Beck in March 2023 and questioned whether the WaterBox had failed or required maintenance. The community champion noted that it had snowed on the same day and concluded that the spike was more likely due to surface water runoff contaminated with road salt.
We were able to track who dominated (led) each of the practicalities to determine the extent to which “community-led” CWQM is possible in both the UK and Taiwan pilots. Specific examples have already demonstrated that technical considerations and tasks constrain community stewardship in this context, but involvement is possible in some areas. Figure 12 demonstrates exactly which categories and sub-categories were driven by each of the key stakeholders involved in the two pilots, and hence illustrate competencies required to make CWQM a success. Stakeholders included technical staff (i.e., the UpStream team), community champions, community groups (in this case, FoBB and TCWA) and relevant professional stakeholders. An additional category was also included in these results as not all practicalities have been resolved or encountered yet, and hence some also represent key challenges. We acknowledge that the results presented in the section have been shaped by the capacity and capabilities of the UpStream team, however the roles and responsibilities outlined in Table 1 clarify what skills are required.
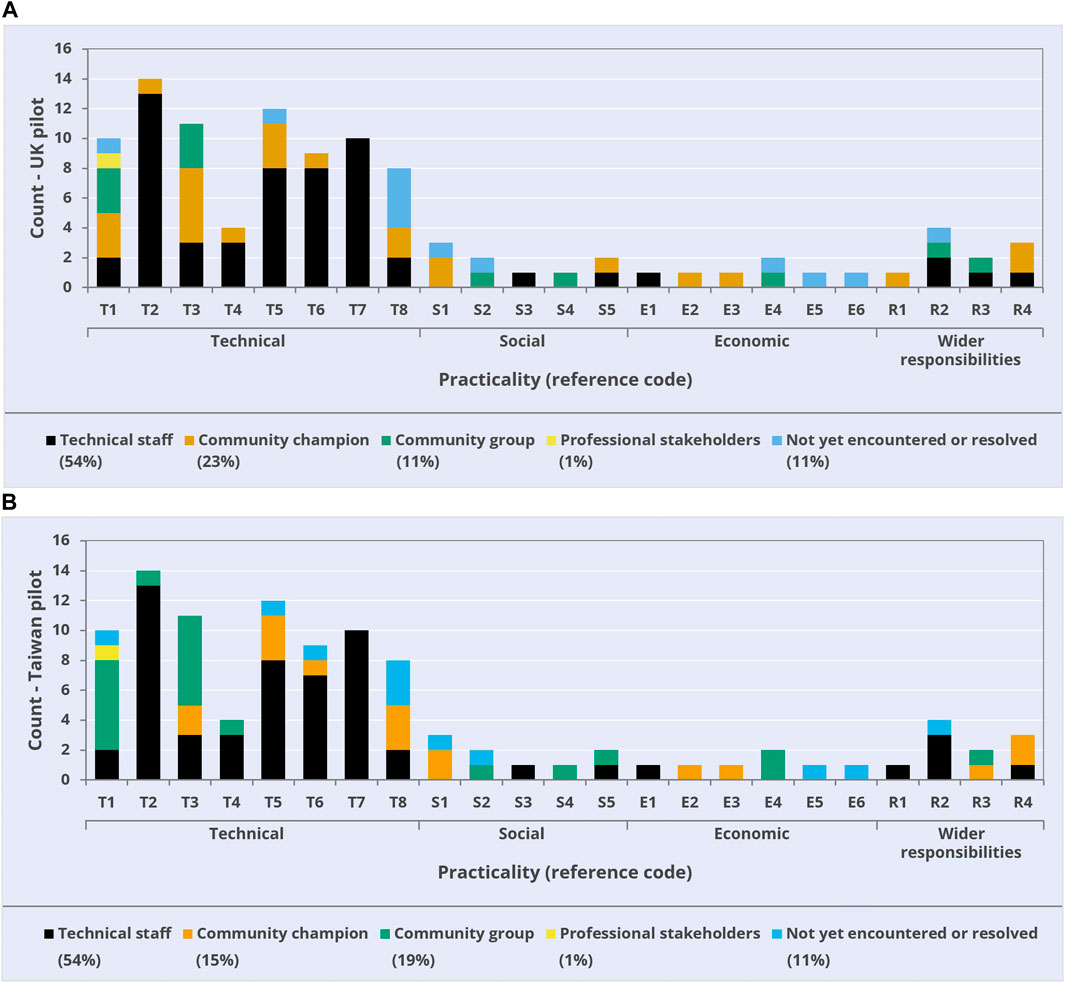
Figure 12. Demonstrating which stakeholder group led each of the practicalities (split by sub-categories, as identified in Table 2) and therefore their overall involvement and competence (as a %) in the UK (A) and Taiwan (B). A total of 104 practicalities were considered, as listed in the detailed checklist provided in the Supplementary Material. Note that the Taiwan data relates to activities associated with preparing for the proposed WaterBoxes and the Douzipuxi test carried out in 2020. The data used to create these plots can also be accessed in the Supplementary Material.
Figure 12A shows that CWQM was community-led to some extent in the UK pilot. Out of a total of 104 practicalities, 23% were driven by the community champion, and a further 11% were driven by the community group. However, 54% of the total practicalities identified were driven by the technical project staff and hence can be regarded as challenges for the community; noticeable input was required for the technical practicalities, particularly categories T2 (water quality sensors), T5 (data transmission), T6 (data recording, storage and management) and T7 (data visualisation, analysis and sharing). In contrast, both the community group and community champion have driven fewer tasks and decisions, but have had an input across a broader range of categories and individual practicalities. The community champion’s capabilities aligned well with T1 (water quality parameters), T3 (site identification, access, spatial coverage and landowner permissions), S1 (meeting the needs of the community), E2 (costs for ongoing site visits and checks), E3 (costs for supporting equipment), R1 (health and safety on site) and R4 (transparency with landowners, community group and wider public). The community champion knew which parameters would be useful pollution indicators, liaised with landowners to obtain permission for CWQM, and considered aspects such as power, maintenance, and safe access to sites. While the community champion, who had a paid role, provided them with support throughout the Bradford pilot, the community group (FoBB) added significant value to T1 (where and what to monitor) and T3 (how many sites to monitor, which would be best for tracking pollution, and which could be easily accessed). Most of the sub-categories were driven by a particular stakeholder group, except for T1 and T3, which lend themselves to a more collaborative approach. This is because technical input is required; however local knowledge is essential for co-developing and implementing an effective monitoring plan. Figure 12A also shows some practicalities which are not yet resolved or encountered such as challenges relating to T8 (future proofing technology), E5 (budget for ongoing maintenance and contingency) and E6 (recruitment of volunteers specifically for CWQM). Some of these are because the community-led aspects of the project are still in their infancy and require, for example, changes to the technology or replacement parts before they can be realised. Other likely reasons relate to community members currently being unaware of them, and thus training may be required.
With respect to the Taiwan plot (Figure 12B), the extent to which CWQM was community-led closely mirrors the UK scenario. Despite different backgrounds, pollution issues, and catchment scales, the patterns displayed across the full range of practicalities are almost identical. Any divergence can be explained by the distribution of tasks shared between community champions and community groups. In the Touqian Basin, the unpaid community group (TCWA) was able to perform more tasks (such as T1 (water quality parameters) and T3 (site identification, access, etc.)), whereas the UK pilot required greater input from the paid community champion. The latter suggests that paid involvement has a greater influence on the extent to which community-led CWQM is possible in the UK. Regardless of which community-based stakeholder group took the lead, both were able to offer valuable local knowledge and tailor the monitoring programme to site-specific requirements; this is essential when trying to streamline monitoring efforts and budgets. However, both pilots required the same level of technical support (T2, T5, T6, and T7) which is crucial for all CWQM schemes.
When combining results from the community group and community champion categories (to represent a single “community” category), 34% of the CWQM scheme was led by the community in both the UK and Taiwan pilots. When removing the “not yet encountered or resolved” category completely from the analysis, this increased to 38% (UK) and 39% (Taiwan). Given these findings, it is unlikely that communities will feasibly take full stewardship of CWQM, instead we have demonstrated that citizens can support, tailor, and improve such schemes. We acknowledge that the data limits our ability to identify long-term trends or comment on data utilisation, but we can speculate that once the initial CWQM scheme is up and running, less technical input is likely to be required, therefore the extent to which it is “community-led” could increase with time. Citizen science training could help facilitate this.
The UK and Taiwan pilot studies have demonstrated that CWQM can be classified as community-led for multiple reasons. While some community-led monitoring schemes are specifically designed for short-term or event-based data collection purposes (e.g., Tsatsaros et al., 2021; Kelly-Quinn et al., 2022) and thus deliberately design their schemes for basic involvement or support from volunteers, our specific case studies can be regarded as community-led based on the following statements:
• The community groups originally raised the need and aspirations for CWQM.
• The community groups shaped and streamlined CWQM into relevant monitoring programmes using their insights and local knowledge.
• The community groups actively led 34% of the practicalities, involving decision making and hands-on activities, all of which were critical to the success of the CWQM programmes.
Using the current technology and riverine sites described, CWQM can be led, to some degree, by knowledgeable and well-established community groups. Even though input was partial and significant technical support was necessary, the CWQM process still fostered engagement with local people, raised awareness, and encouraged collaboration. These wider benefits are familiar and valuable attributes associated with citizen science and wider community-centred techniques (Walker et al., 2020; Pollard et al., 2021; Weiner et al., 2022). Community-led CWQM, which is regarded as an “extreme” form of citizen science here, offers co-design and some monitoring stewardship, but the greatest value associated with this type of involvement is likely to reside with wider water or environmental stewardship, which takes time to manifest. Bridging the gap between data creators and data users not only makes processes more efficient but also offers an educational experience that engages citizens and other stakeholders who would normally remain excluded. FoBB and TCWA are both long-standing community groups and some of their existing skills relating to social, economic and wider responsibilities were directly transferable to CWQM. Less established community groups or individuals hoping to participate elsewhere may struggle to match the required competencies unless technology (CWQM devices and accompanying infrastructure) evolves to accommodate them. Community-led schemes may also become laborious when operating over large spatial scales; as the Taiwan pilot revealed, large catchments, extreme weather systems and rivers with significant flows create additional proximity and logistical barriers. Previous studies, such as Kelly-Quinn et al. (2022), have recognised the issue of scale for citizen science and therefore aligned their work with “small waterbodies”. The Upstream team also observed that the community groups and champions were unable to lead some practicalities or progress their monitoring programmes as far as originally planned due to delays with the WaterBox development. The UpStream team had limited time and expertise to modify the WaterBox (let alone the communities), and hence requires a specific technical skill set to overcome substantial modifications if required. This is a natural constraint of open sensor projects, and success again relies on the status of the current available technologies.
Based on the pilots described and the results explored within this manuscript, the following challenges appeared to dominate our community-led CWQM schemes:
• Concerns about theft and/or vandalism of the equipment.
• Sourcing specific sensors which meet the aspirations and requirements of the community.
• Monitoring within confined or hazardous spaces, such as culverts.
• Monitoring across large spatial areas.
• Cost of data transmission (e.g., SIM cards).
• Carrying out complicated calibration activities, both initial and ongoing.
• Connecting sensors to a live data portal.
• Recruitment for wider community (unpaid volunteer) involvement.
• Securing a budget for ongoing CWQM.
• Overall level of technical support required.
Our novel methodological approach offers a wide range of insights, but the UpStream team acknowledges that more work is required to refine this initial attempt to overcome the various challenges described. Alongside the narratives presented in Section 3.2, the results presented in Figure 12 clearly emphasise where the community’s strengths lie, but also where support or further work is required to enable a stronger community-led approach to CWQM to prevail in the future. The following statements and suggestions will help increase the success of community-led CWQM over the coming years (whether partial or full involvement is anticipated), its wider impact on catchment management activities, and its ability to influence policymakers:
• Before reviewing the checklist of practicalities, ensure that the overarching considerations (anticipated duration of the CWQM scheme, scale of community involvement, and likely funds available to cover initial and ongoing monitoring costs) are discussed at an early stage.
• Once the checklist has been reviewed, a monitoring plan should be co-developed that includes a clear outline of roles and responsibilities, and a long-term plan for maintenance, data use, and data ownership. This plan should be reviewed and updated regularly.
• Ensure that community champions, lead volunteers and/or environmental NGOs, who have the capacity and skills to steer community groups, are part of the monitoring team. This is essential given that less technical citizen science schemes also rely on input from these stakeholders (Collins et al., 2023). Burbach and Reimers-Hild (2019) also recommend “water leaders”, who have a multidisciplinary background and are capable of driving change.
• Consider participant payments, particularly in catchments where capacities and capabilities are lower, or where community champions are less established (e.g., Starkey and Rollason, 2023). Alternative forms of payment (a reward) for participation could also be explored, such as accreditation or certification, offering additional benefits to citizens.
• Training or illustrative guidance manuals should be provided to maximise the number of practicalities carried out by communities, while emphasising the importance of data quality (for example, regular sensor maintenance, T2.L). This will increase the community’s ability to understand and subsequently lead them. Training should prioritise technical practicalities including T2 (water quality sensors), T4 (supporting infrastructure), T6 (data recording, storage and management) and T7 (data visualisation, analysis and sharing). Train the trainer schemes are also an option (Kelly-Quinn et al., 2022).
• Explore options for the challenging practicalities which were categorised here as “not yet encountered or resolved” (T1.J, T8A-H, S1.A, S2.A, and E1-6), many of which relate to the ownership of the monitoring system and resulting data, future-proofing the monitoring programme, raising and setting budget aside for maintenance, and ensuring overall sustainability. Funding citizen science projects is still a major barrier (Walker et al., 2020).
• Adapt, refine and/or create useable, DIY-friendly, plug and play, and compatible CWQM monitoring equipment (the logger, sensors and telemetry involved) to help address T2, T4, T6, and T7. This could include making the most of rapidly evolving telecommunication technologies (e.g., IoT), and the connection of multiple low-powered sensors. A supported and centralised hub led by, or at least recognised by, national or regulatory organisations would also assist with standardising community-led monitoring, enabling participant efforts to be valued and their data to routinely fill data gaps long term. There is also scope for artificial intelligence (AI) to automate some technical barriers within the water sector (Landon et al., 2023), and subsequently lower overall efforts and costs for CWQM.
From a research perspective it is recommended that the practicalities, impacts and benefits associated with long-term community-led CWQM (therefore empowerment and stewardship potential) are monitored. Data quality should also be considered further when operating “low-cost” or “cost-effective” CWQM equipment, particularly when complicated sensor calibration activities are involved. The latter could include developing minimum standards which are appropriate for community-led CWQM, while ensuring the data are fit for purpose and hence can be used by communities and professionals to drive change and improve water quality at a local level.
This study has pushed the boundaries of citizen science; it has generated and tested a new mechanism which combines and attempts to maximise the benefits associated with both citizen science and CWQM using automatic sensors. This has generated tailored and locally rooted monitoring plans, increased the availability of actionable water quality data, bridged the gap between data creators and data users, and created opportunities for citizen involvement and ownership. A novel methodology was implemented within two riverine pilots in the UK and Taiwan to identify, track and understand the practicalities and competencies associated with community-led CWQM. This has enabled the creation of a practical and transferable checklist which communities and other stakeholders involved can use to ensure community-led CWQM is appropriate for them. The practicalities and accompanying capabilities were tracked and quantified over a 2-year period to determine who led what, pinpoint challenges, identify knowledge, capability and capacity gaps, and thus make recommendations for future monitoring and research programmes.
A total of 104 practicalities were observed and categorised as either technical, social, economic or wider responsibilities. Despite community-led CWQM being a social, inclusive and participatory approach, 78 (75%) of the practicalities were still technical. However, not all practicalities will be relevant in every situation and depend on the specific objectives of each CWQM scheme. The anticipated duration of the scheme, the scale of community involvement, and the likely funds available to cover initial and ongoing monitoring costs, are critical considerations and will dictate which practicalities prevail. Different practicalities are also likely to prevail at different stages of a long-term and community-led CWQM scheme.
Narratives from both the UK and Taiwan pilots have demonstrated that there is a strong desire for community-led CWQM, and that established community groups and community champions are already advocating, informally monitoring and trying to mitigate poor water quality in their local river environments. However, our work has enabled these citizens to experience the considerations and co-design activities associated with continuous monitoring, which they had not previously practiced. Despite different pollution concerns, catchment scales and the influence of payment for participation, the community-led CWQM approach was similar for both pilots. However, both were dictated (delayed) by the development of the CWQM device (the WaterBox) and the sheer number of technical practicalities encountered. We conclude that community-led CWQM was possible in both scenarios, and it was well received, but the extent to which it was “community-led” was lower than expected in both cases. Technical support and ongoing funding are therefore essential when overcoming many of the challenges described.
Over half (54%) of the practicalities were led by a skilled “technical team” (the project team), and 34% were driven by either the community groups or community champions. The results are almost identical for the UK and Taiwan pilots. Given these findings, it is unlikely that CWQM will be fully led by citizens using the current technology and methods available. However, the community groups (FoBB and TCWA) initially raised the need and aspirations for CWQM, and they shaped and streamlined CWQM into relevant monitoring programmes using their insights and local knowledge. They were also able to drive many decisions and activities such as pinpointing suitable monitoring locations and identifying relevant water quality parameters. Lead volunteers (such as community champions or environmental NGOs with increased skills, capacity, and knowledge) will play a crucial role in community-led monitoring or similar community-led and co-design activities.
Our study demonstrates that CWQM can be classified as community-led for multiple reasons, and many benefits are gained from the increased availability of local data and citizen involvement. We conclude that CWQM can be led, to some degree, by knowledgeable and well-established community groups. However, less established groups or individuals may struggle to replicate experiences from our pilots, and our methodology is in its infancy. A series of recommendations are provided as the extent to which communities can lead CWQM will increase once the technical burdens are eased, for example, through training, or improved (automatic) sensing technology. This in turn will enable data utilisation and impact of such schemes to be explored.
It is acknowledged that the practicalities presented were subjectively assigned based on observational work and were limited by the development of the WaterBox CWQM device itself. Nevertheless, this initial trial offers valuable learning relevant to freshwater quality and other fields of environmental work.
The original contributions presented in the study are included in the article/Supplementary Material, further inquiries can be directed to the corresponding authors.
ES: Writing–original draft, Writing–review and editing. AJ: Writing–original draft, Writing–review and editing. SO-R: Writing–original draft, Writing–review and editing. SM: Writing–original draft, Writing–review and editing. C-LW: Writing–original draft. P-CC: Writing–original draft. S-YL: Writing–original draft. L-PW: Writing–review and editing. CW: Writing–review and editing.
The author(s) declare financial support was received for the research, authorship, and/or publication of this article. This work has been funded by ESRC (Economic and Social Research Council, UK) research grant number ES/W000202/1 and NSTC (National Science and Technology Council, Taiwan, formerly MOST—(Ministry of Science and Technology)) research grant number 110-2923-E-001-001-MY2. The project has also relied on volunteer and in-kind support from the various project partners and community members involved.
The authors would like to thank all partners and organisations involved in the UpStream project for their in-kind contributions and valuable knowledge, including Academia Sinica, FondUS Technology, CTO AnaSystem, Yorkshire Water, Bradford Council, RPS Group, Aire Rivers Trust, Friends of Bradford’s Becks (FoBB, UK), Taiwan Clean Water Alliance (TCWA, Taiwan), Local Aware Sensing System (LASS, Taiwan) and Chengyuan High School in Taipei. This research would not have been possible without the enthusiasm and hard work of the community groups involved. The authors would also like to thank the reviewers of this manuscript for their time and valuable suggestions.
Author AJ was employed by Water Research Centre Limited. Author SO-R was employed by RainPlusPlus Ltd.
The remaining authors declare that the research was conducted in the absence of any commercial or financial relationships that could be construed as a potential conflict of interest.
All claims expressed in this article are solely those of the authors and do not necessarily represent those of their affiliated organizations, or those of the publisher, the editors and the reviewers. Any product that may be evaluated in this article, or claim that may be made by its manufacturer, is not guaranteed or endorsed by the publisher.
The Supplementary Material for this article can be found online at: https://www.frontiersin.org/articles/10.3389/fenvs.2024.1371048/full#supplementary-material.
API, Application Programming Interface; CWQM, (Near-) Continuous Water Quality Monitoring; FoBB, Friends of Bradford’s Becks; IoT, Internet of Things; LASS, Location Aware Sensing System; LoRaWAN, Long Range Wide Area Network; NB-IoT, Narrowband Internet of Things; NTU, National Taiwan University; SDG, Sustainable Development Goal; TCWA, Taiwan Clean Water Alliance; MQTT, Message Queuing Telemetry Transport.
1https://www.bbc.co.uk/news/uk-england-merseyside-66455794 [Accessed November 15, 2023].
2https://english.cw.com.tw/article/article.action?id=2740 [Accessed November 15, 2023].
3WaterBox GitHub https://github.com/LinkItONEDevGroup/LASS_WaterBoxV2 [Accessed 25 November 2023].
4The pH, electrical conductivity and temperature sensors were sourced from Atlas Scientific, and the turbidity sensors were sourced from DFRobot. Sensors are supplied with calibration solutions—users can programme them in-situ or in a laboratory using the WaterBox. The WaterBox Fact Sheet (Supplementary Material) provides further examples of compatible sensors.
5FoBB’s Facebook page: https://www.facebook.com/groups/BradfordsBecks [Accessed 30 October 2023].
6Taipei Times: https://www.taipeitimes.com/News/taiwan/archives/2019/12/15/2003727582 [Accessed 28 November 2023].
7TCWA Facebook: https://www.facebook.com/hsinchu.drink [Accessed 30 October 2023].
8FoBB’s PollutionWatch initiative https://bradford-beck.org/pollutionwatch/ and pollution app https://survey123.arcgis.com/share/0690b2a5114b440d900f71adc8f253a2.
9Taipei Times: https://www.taipeitimes.com/News/taiwan/archives/2022/04/16/2003776696 [Accessed 30 October 2023].
10Open-source software (“ThingSpeak”) used to share and visualise data generated by the initial WaterBox at site 6 (Douzipuxi River) https://thingspeak.com/channels/1096906.
Adu-Manu, K., Katsriku, F., Abdulai, J., and Engmann, F. (2020). Smart River monitoring using wireless sensor networks. Wirel. Commun. Mob. Comput. 2020, 1–19. Article ID 8897126. doi:10.1155/2020/8897126
Albus, K. H., Thompson, R., Mitchell, F., Kennedy, J., and Ponette-González, A. G. (2020). Accuracy of long-term volunteer water monitoring data: a multiscale analysis from a statewide citizen science program. PLOS ONE 15 (1), e0227540. doi:10.1371/journal.pone.0227540
Alemu, A. N., Haile, A. T., Carr, A. B., Trigg, M. A., Mengistie, G. K., and Walsh, C. L. (2023). Filling data gaps using citizen science for flood modeling in urbanized catchment of akaki. Nat. Hazards Res. 3, 395–407. doi:10.1016/j.nhres.2023.05.002
Aronoff, R., Dussuet, A., Erismann, R., Erismann, S., Patiny, L., and Vivar-Rios, C. (2021). Participatory research to monitor lake water pollution. Ecol. Solutions Evid. 2 (3), e12094. doi:10.1002/2688-8319.12094
Baalbaki, R., Ahmad, S. H., Kays, W., Talhouk, S. N., Saliba, N. A., and Al-Hindi, M. (2019). Citizen science in Lebanon-a case study for groundwater quality monitoring. R. Soc. Open Sci. 276 (2), 181871. doi:10.1098/rsos.181871
Babiso, W. Z., Ayano, K. K., Haile, A. T., Keche, D. D., Acharya, K., and Werner, D. (2023). Citizen science for water quality monitoring in the meki river, Ethiopia: quality assurance and comparison with conventional methods. Water 15 (2), 238. doi:10.3390/w15020238
Biraghi, C. A., Carrion, D., and Brovelli, M. A. (2022). Citizen science impact on environmental monitoring towards SDGs indicators: the CASE of SIMILE project. Sustainability 14, 8107. doi:10.3390/su14138107
Bishop, I. J., Warner, S., van Noordwijk, T. C. G. E., Nyoni, F. C., and Loiselle, S. (2020). Citizen science monitoring for sustainable development goal indicator 6.3.2 in England and Zambia. Sustainability 12, 10271. doi:10.3390/su122410271
Burbach, M. E., and Reimers-Hild, C. (2019). Developing water leaders as catalysts for change: the Nebraska water leaders academy. J. Contemp. Water Res. Educ. 167, 6–22. doi:10.1111/j.1936-704X.2019.03308.x
Buytaert, W., Zulkafli, Z., Grainger, S., Acosta, L., Alemie, T. C., Bastiaensen, J., et al. (2014). Citizen science in hydrology and water resources: opportunities for knowledge generation, ecosystem service management, and sustainable development. Front. Earth Sci. 2 (26), 1–21. doi:10.3389/feart.2014.00026
Cakmak, E. K., Ugurlu, A., and Anbaroglu, B. (2021). Adopting citizen science approach for water quality monitoring in Uzungöl, Turkey. Environ. Monit. Assess. 193 (9), 604. doi:10.1007/s10661-021-09395-2
Capdevila, A. S. L., Kokimova, A., Ray, S. S., Avellán, T., Kim, J., and Kirschke, S. (2020). Success factors for citizen science projects in water quality monitoring. Sci. Total Environ. 728, 137843. doi:10.1016/j.scitotenv.2020.137843
Cassidy, R., and Jordan, P. (2011). Limitations of instantaneous water quality sampling in surface-water catchments: comparison with near-continuous phosphorus time-series data. J. Hydrology 405 (1-2), 182–193. doi:10.1016/j.jhydrol.2011.05.020
Chapman, D. V., and Sullivan, T. (2022). The role of water quality monitoring in the sustainable use of ambient waters. One Earth 5 (2), 132–137. doi:10.1016/j.oneear.2022.01.008
Collins, R., France, A., Walker, M., and Browning, S. (2023). The potential for freshwater citizen science to engage and empower: a case study of the Rivers Trusts, United Kingdom. Front. Environ. Sci. 11, 1218055. doi:10.3389/fenvs.2023.1218055
de Camargo, E. T., Spanhol, F. A., Slongo, J. S., da Silva, M. V. R., Pazinato, J., de Lima Lobo, A. V., et al. (2023). Low-cost water quality sensors for IoT: a systematic review. Sensors 23, 4424. doi:10.3390/s23094424
de Sherbinin, A., Bowser, A., Chuang, T.-R., Cooper, C., Danielsen, F., Edmunds, R., et al. (2021). The critical importance of citizen science data. Front. Clim. 3. doi:10.3389/fclim.2021.650760
Donthu, N., Kumar, S., Mukherjee, D., Pandey, N., and Lim, W. M. (2021). How to conduct a bibliometric analysis: an overview and guidelines. J. Bus. Res. 133, 285–296. doi:10.1016/j.jbusres.2021.04.070
du Plessis, A. (2022). Persistent degradation: global water quality challenges and required actions. One Earth 5 (2), 129–131. doi:10.1016/j.oneear.2022.01.005
Environment Act (2021). Search legislation. Available at: https://www.legislation.gov.uk/ukpga/2012/7/contents/enacted (Accessed November 18, 2023).
Environment Agency (2023a). Bradford beck (Clayton Bk to R Aire) water body. Available at: https://environment.data.gov.uk/catchment-planning/WaterBody/GB104027062862 (Accessed October 30, 2023).
Environment Agency (2023b). Clayton beck (source to Bradford Bk) water body. Available at: https://environment.data.gov.uk/catchment-planning/WaterBody/GB104027062861 (Accessed October 30, 2023).
European Commission (2000). Directive 2000/60/EC of the European Parliament. Establishing a framework for community action in the field of water policy. Official J. Eur. Communities, L 327. Available at: http://data.europa.eu/eli/dir/2000/60/oj (Accessed June 14, 2024).
FoBB (2023a). The Bradford beck Film. Available at: https://www.youtube.com/watch?v=BejVahJX7qQ (Accessed November 20, 2023).
FoBB (2023b). Friends of Bradford’s becks. Available at: https://bradford-beck.org/ (Accessed October 30, 2023).
George, G., Menon, N. N., Abdulaziz, A., Brewin, R. J., Pranav, P., Gopalakrishnan, A., et al. (2021). Citizen scientists contribute to real-time monitoring of lake water quality using 3D printed mini Secchi disks. Front. Water 3, 662142. doi:10.3389/frwa.2021.662142
Grantz, E., and Haggard, B. E., (2023). Informing volunteer water quality monitoring program design and watershed planning: case study of StreamSmart data analysis in the upper white river basin, Arkansas. J. Contemp. Water Res. Educ. 177 (1), 46–62. doi:10.1111/j.1936-704X.2022.3380.x
Hegarty, S., Hayes, A., Regan, F., Bishop, I., and Clinton, R. (2021). Using citizen science to understand river water quality while filling data gaps to meet United Nations Sustainable Development Goal 6 objectives. Sci. Total Environ. 783, 146953. doi:10.1016/j.scitotenv.2021.146953
Huang, R. (2021). Knowledge exchange: Taiwan’s IoT telecommunication journey. Available at: https://research.ncl.ac.uk/upstream/knowledgehub/20220103%20DataTransmissionStory.pdf (Accessed November 25, 2023).
James, P., Jonczyk, J., Smith, L., Harris, N., Komar, T., Bell, D., et al. (2022). Realizing smart city infrastructure at scale, in the wild: a case study. Front. Sustain. Cities 4. doi:10.3389/frsc.2022.767942
Jollymore, A., Haines, M. J., Satterfield, T., and Johnson, M. S. (2017). Citizen science for water quality monitoring: data implications of citizen perspectives. J. Environ. Manag. 200, 456–467. doi:10.1016/j.jenvman.2017.05.083
Jordan, P., and Cassidy, R. (2022). Perspectives on water quality monitoring approaches for behavioral change research. Front. Water 4. doi:10.3389/frwa.2022.917595
Kelly-Quinn, M., Biggs, J. N., Brooks, S., Fortuño, P., Hegarty, S., Jones, J. I., et al. (2022). Opportunities, approaches and challenges to the engagement of citizens in filling small water body data gaps. Hydrobiologia 850, 3419–3439. doi:10.1007/s10750-022-04973-y
Kruse, P. (2018). Review on water quality sensors. J. Phys. D Appl. Phys. 51 (20), 203002. doi:10.1088/1361-6463/aabb93
Lambrou, T. P., Panayiotou, C. G., and Anastasiou, C. C. (2012). A low-cost system for real time monitoring and assessment of potable water quality at consumer sites. Sensors 2012, 1–4. IEEE, Taipei, Taiwan. doi:10.1109/ICSENS.2012.6411190
LandonHalloran, J. S. L. J. S., Mhanna, S., and Brunner, P. (2023). AI tools such as ChatGPT will disrupt hydrology, too. Hydrol. Process. 37 (3), e14843. doi:10.1002/hyp.14843
Lee, K. T., and Huang, P. C. (2018). Assessment of flood mitigation through riparian detention in response to a changing climate – a case study. J. Earth Syst. Sci. 127, 83. doi:10.1007/s12040-018-0983-7
Lerner, D., and Canning, M. (2013). Bradford’s becks: a new lease of life. Available at: https://bradfordbeckdotorg.files.wordpress.com/2013/02/bradfordsbecksfinalweboptimised.pdf (Accessed November 24, 2023).
Mahajan, S., Luo, C. H., Wu, D. Y., and Chen, L. J. (2021). From Do-It-Yourself (DIY) to Do-It-Together (DIT): reflections on designing a citizen-driven air quality monitoring framework in Taiwan. Sustain. Cities Soc. 66, 102628. doi:10.1016/j.scs.2020.102628
Mekki, K., Bajic, E., Chaxel, F., and Meyer, F. (2019). A comparative study of LPWAN technologies for large-scale IoT deployment. ICT Express 5, 1–7. doi:10.1016/j.icte.2017.12.005
Ministry of Environment (2023a). Environmental water quality monitoring. Available at: https://wq.moenv.gov.tw/EWQP/en/ (Accessed November 25, 2023).
Ministry of Environment (2023b). Ministry of environment: Ministry of environment environmental information open platform. Available at: https://data.moenv.gov.tw/en/ (Accessed November 25, 2023).
Moshi, H. A., Shilla, D. A., Brehim, J., Kimirei, I., O’Reilly, C., and Loiselle, S. (2023). Sustainable management of the african great lake coastal areas: motivations and perspectives of community citizen scientists. Environ. Manag. 72, 473–487. doi:10.1007/s00267-023-01824-x
Newcastle University (2023). UpStream: community-led monitoring to improve water quality in the UK and Taiwan. Available at: https://research.ncl.ac.uk/upstream/ (Accessed November 15, 2023).
Njue, N., Stenfert Kroese, J., Gräf, J., Jacobs, S. R., Weeser, B., Breuer, L., et al. (2019). Citizen science in hydrological monitoring and ecosystem services management: state of the art and future prospects. Sci. Total Environ. 693, 133531. doi:10.1016/j.scitotenv.2019.07.337
O'Flynn, B., F Regan, F., Lawlor, A., Wallace, J., Torres, J., and O'Mathuna, C. (2010). Experiences and recommendations in deploying a real-time, water quality monitoring system. Meas. Sci. Technol. 21 (12), 124004. doi:10.1088/0957-0233/21/12/124004
Pollard, G., Studdert, J., and Tiratelli, L. (2021). Community power: the evidence new local. Available at: http://www.newlocal.org.uk/wp-content/uploads/2021/02/Community-Power-The-Evidence.pdf (Accessed December 15, 2023).
Quinlivan, L., Chapman, D. V., and Sullivan, T. (2020). Applying citizen science to monitor for the sustainable development goal indicator 6.3.2: a review. Environ. Monit. Assess. 192, 218. doi:10.1007/s10661-020-8193-6
Ramírez, S. B., van Meerveld, I., and Seibert, J. (2023). Citizen science approaches for water quality measurements. Sci. Total Environ. 897, 165436. doi:10.1016/j.scitotenv.2023.165436
Reljić, M., Romić, M., Romić, D., Gilja, G., Mornar, V., Ondrasek, G., et al. (2023). Advanced continuous monitoring system - tools for water resource management and decision support system in salt affected delta. Agriculture 13 (2), 369. doi:10.3390/agriculture13020369
Schade, S., Pelacho, M., Van Noordwijk, T., Vohland, K., Hecker, S., Manzoni, M., et al. (2021). “Citizen science and policy,” in The science of citizen science Editors K. Vohland, A. Land-Zandstra, L. Ceccaroni, R. Lemmens, J. Perelló, and M. Ponti (Cham: Springer International Publishing). doi:10.1007/978-3-030-58278-4
Sendra, S., Parra, L., Jimenez, J. M., Laura Garcia, l., and Lloret, J. (2023). LoRa-based network for water quality monitoring in coastal areas. Mob. Netw. Appl. 28, 65–81. doi:10.1007/s11036-022-01994-8
Skarlatidou, A., and Haklay, M. (2020). Citizen science impact pathways for a positive contribution to public participation in science. J. Sci. Commun. 20 (06), A02. doi:10.22323/2.20060202
Smith, L., and Turner, M. (2019). Building the Urban Observatory: Engineering the largest set of publicly available real-time environmental urban data in the UK. EGU General Assem. 21, EGU2019–10556.
Starkey, E., Parkin, G., Birkinshaw, S., Large, A., Quinn, P., and Gibson, C. (2017). Demonstrating the value of community-based (‘citizen science’) observations for catchment modelling and characterisation. J. Hydrology 548, 801–817. doi:10.1016/j.jhydrol.2017.03.019
Starkey, E., and Rollason, E. (2023). “SuDS+: establishing a new vision for sustainable drainage in delivering sustainable and resilient urban communities,” in EGU General Assembly 2023 EGU23-3381, Vienna, Austria, 24–28 Apr 2023. doi:10.5194/egusphere-egu23-3381
Stepenuck, K. F., and Genskow, K. D. (2019). Traits of volunteer water monitoring programs that influence natural resource management and policy impacts. Soc. Nat. Resour. 32 (3), 275–291. doi:10.1080/08941920.2018.1511022
Strasser, B., Baudry, J., Mahr, D., Sanchez, G., and Tancoigne, E. (2019). Citizen science"? Rethinking science and public participation. Sci. Technol. Stud. 32 (ARTICLE), 52–76. doi:10.23987/sts.60425
Su, P. W., and Lo, S. L. (2022). Satellite imagery: a way to monitor water quality for the future? Environ. Sci. Pollut. Res. 29, 57022–57029. doi:10.1007/s11356-022-21524-z
Traag, V. A., Waltman, L., and Van Eck, N. J. (2019). From Louvain to Leiden: guaranteeing well-connected communities. Sci. Rep. 9 (1), 5233. doi:10.1038/s41598-019-41695-z
Tsatsaros, J. H., Bohnet, I. C., Brodie, J. E., and Valentine, P. (2021). A transdisciplinary approach supports community-led water quality monitoring in river basins adjacent to the Great Barrier Reef, Australia. Mar. Pollut. Bull. 170, 112629. doi:10.1016/j.marpolbul.2021.112629
UN Environment Programme (2016). Snapshot of the world’s water quality: towards a global assessment. Available at: https://www.unep.org/resources/publication/snapshot-report-worlds-water-quality (Accessed November 15, 2023).
UpStream (2024). Water quality data hub. Available at: http://wq-upstream.net:14299/ (Accessed April 15, 2024).
von Benzon, E., Bagshaw, E., Prior-Jones, M., Sobey, I., Perkins, R., and Browning, S. (2021). “A low-cost wireless sensor network for citizen science water quality monitoring,” in EGU general assembly conference abstracts, EGU21–12426.
Walker, D. W., Śmigaj, M., and Tani, M. (2020). The benefits and negative impacts of citizen science applications to water as experienced by participants and communities. WIREs Water 8 (1). doi:10.1002/wat2.1488
Walker, D. W., Tani, M., Gyawali, N., Chapagain, P. S., Davids, J. C., Ghimire, A., et al. (2021). Citizen science water projects in Nepal: participant motivations and the impacts of involvement. Water Altern. 14 (3), 664–689.
Weiner, D., Bloomer, J., Ó Conchúir, R., and Dalton, C. (2022). The role of volunteers and citizen scientists in addressing declining water quality in Irish river catchments. Citiz. Sci. Theory Pract. 7 (1), 13. doi:10.5334/cstp.447
World Economic Forum (2021). The global risks report 2021. 16. Switzerland: World Economic Forum. Available at: https://www3.weforum.org/docs/WEF_The_Global_Risks_Report_2021.pdf (Accessed November 15, 2023).
Keywords: water quality, continuous monitoring, community-based monitoring, citizen science, practicalities, co-design, low-cost sensors, freshwater
Citation: Starkey E, Jones A, Ochoa-Rodriguez S, Mahajan S, Wei C-L, Chen P-C, Liu S-Y, Wang L-P and Walsh CL (2024) Practicalities of community-led continuous water quality monitoring: lessons from Taiwan and UK pilots. Front. Environ. Sci. 12:1371048. doi: 10.3389/fenvs.2024.1371048
Received: 15 January 2024; Accepted: 24 May 2024;
Published: 25 July 2024.
Edited by:
Igor Ogashawara, Leibniz-Institute of Freshwater Ecology and Inland Fisheries (IGB), GermanyReviewed by:
Viktor Sebestyén, University of Pannonia, HungaryCopyright © 2024 Starkey, Jones, Ochoa-Rodriguez, Mahajan, Wei, Chen, Liu, Wang and Walsh. This is an open-access article distributed under the terms of the Creative Commons Attribution License (CC BY). The use, distribution or reproduction in other forums is permitted, provided the original author(s) and the copyright owner(s) are credited and that the original publication in this journal is cited, in accordance with accepted academic practice. No use, distribution or reproduction is permitted which does not comply with these terms.
*Correspondence: Eleanor Starkey, ZWxlYW5vci5zdGFya2V5QG5vcnRodW1icmlhLmFjLnVr; Li-Pen Wang, bHB3YW5nQG50dS5lZHUudHc=; Claire L. Walsh, Y2xhaXJlLndhbHNoQG5jbC5hYy51aw==
†Present address: Eleanor Starkey, Department of Geography and Environmental Sciences, Northumbria University, Newcastle upon Tyne, United Kingdom
Disclaimer: All claims expressed in this article are solely those of the authors and do not necessarily represent those of their affiliated organizations, or those of the publisher, the editors and the reviewers. Any product that may be evaluated in this article or claim that may be made by its manufacturer is not guaranteed or endorsed by the publisher.
Research integrity at Frontiers
Learn more about the work of our research integrity team to safeguard the quality of each article we publish.