 Xin Zhou
 Nengpan Ju1*
95% of researchers rate our articles as excellent or good
Learn more about the work of our research integrity team to safeguard the quality of each article we publish.
Find out more
ORIGINAL RESEARCH article
Front. Environ. Sci. , 05 April 2024
Sec. Environmental Informatics and Remote Sensing
Volume 12 - 2024 | https://doi.org/10.3389/fenvs.2024.1338016
This article is part of the Research Topic Advances and Applications of Artificial Intelligence and Numerical Simulation in Risk Emergency Management and Treatment, volume II View all 13 articles
Exploring the creep law of sandstone provides a theoretical basis for evaluating the long-term stability of geotechnical engineering projects in red beds. Based on a conventional triaxial test of sandstone, a progressive loading triaxial creep test is conducted. The deformation characteristics and laws of each sample in different deformation stages are summarized, and the laws relating steady creep rate, stress and time are analyzed. On this basis, a nonlinear viscoelastic‒plastic creep model based on fractional derivative theory and damage theory is established. According to the nonlinear fitting results, the parameter sensitivities are analyzed. The results verify the rationality of the model; this model has a good fitting effect for each creep deformation stage, especially for the accelerated creep stage. The constitutive relationship of the model is simple, clear and easily applicable. The research results provide a reference for studying the long-term stability of geotechnical engineering projects.
Rocks are divisible into soft and hard rocks according to their strength characteristics. Soft rock is the most widely distributed rock type, and it is most closely related to human engineering activities (Liu et al., 2023). Soft rock has low strength and shows great rheological properties (Sun, 2007), severely affecting the long-term safety performance of the project. The creep behavior of rock is directly related to the long-term stability of rock slopes and rock engineering activities; additionally, this behavior is an important basis for evaluating the long-term stability of the rock (Yang et al., 2014; Deng et al., 2016; Wang et al., 2018a). Creep is a key mechanical behavior of rock, and it is an important foundation for studying the long-term stability of rock engineering projects (Xu et al., 2004; Chang et al., 2015; Wang et al., 2018a). There are significant differences in the mechanical properties of rocks under different saturated conditions. Sandstone is one of the main rock types in the China red bed area, and it is one of the most extensive strata in the China branch. This kind of stratum is considered prone to landslides (Li et al., 2004), and many red bed landslides (Tang et al., 2015; Hu et al., 2017; Zhang et al., 2018) have developed in the Yangtze River basin. Wang et al. (Wang et al., 2017) found that the strength of sandstone in a saturated state is 40% higher than that under dry conditions. Song et al. (Song et al., 2015) conducted triaxial creep tests on carbonaceous slate and found that under the same stress conditions, the strain value of saturated rock is much larger than that of dry rock.
Many researchers have explored a suitable rock rheological model to describe creep characteristics (Jiang et al., 2018). To date, the commonly used creep models include Maxwell, Kelvin, and Burgers. These models have clear physical definitions and intuitive concepts; however, they must combine more components to meet the experience requirements (Li and Chao, 2014; Luo et al., 2018). This kind of model is generally composed of several mechanical elements in different manners, such as Hooke’s spring body and Newton’s damping body. Based on traditional component models, many scholars have established optimized constitutive models by introducing new theories and methods, such as damage mechanics and fractional derivatives. According to Wang’s concepts of damage and damage acceleration, a constitutive equation (Wang, 2004) is proposed that describes the whole process creep curve of rock. Yang et al. conducted creep tests and theoretical research on the creep characteristics of frozen sand (Yang et al., 2010). Zhou et al. replaced the Newton body in a traditional Xiyuan model with an Abel body and established a new time-based fractional derivative creep constitutive model (Zhou et al., 2018). Wang et al. established the Xiyuan creep constitutive model (Wang et al., 2018b) based on the damage mechanism through creep tests of granite at different temperatures. Zhou et al. used the fractional derivative viscoelastic Kelvin model to describe the creep characteristics of different soft soils and achieved remarkable results (Zhu et al., 2017). Hou et al. suggested that in the nonlinear rheological process of rock, there is a nonlinear functional relationship between the viscosity coefficient and the rheological time and stress level (Hou et al., 2018). Zhou et al. introduced a fractional derivative to describe its constitutive characteristics (Zhou et al., 2018) in salt rock creep tests. Wu improved the Maxwell creep model by introducing a variable fractional derivative (Wu et al., 2015).
In summary, studying rock creep characteristics and constitutive models remain important research topics. Based on a triaxial creep test of sandstone, with the advantages of the fractional derivative creep model and damage theory, a new creep constitutive model is proposed with the characteristics of a simple structure and clear physical parameter definitions. By fitting the test results, the parameters of the creep model are determined. In addition, the triaxial creep law of sandstone is systematically analyzed in this paper; the deformation characteristics of each stage of the rock creep test curve and the relationship between the strain rate and stress level are discussed. This creep model accurately describes the creep characteristics of different stress conditions and creep deformation stages throughout the process and provides an important basis for research in the field of rock creep.
Sandstone is processed into a standard cylinder sample with a diameter of 50 mm and a height of 100 mm according to International Society for Rock Mechanics and Rock Engineering (ISRM) standards (Zhang and Zhou, 2020). As shown in Figures 1, 2, deviations in diameter and height should be controlled within 0.3 mm, and the deviations of both ends should be controlled within 0.05 mm to minimize the end effects. The method of graded loading is adopted to load the sandstone test. First, a triaxial creep test is conducted to confirm the conventional triaxial compressive strength of rock. According to the failure strengths of sandstone under different confining pressures, the conventional triaxial strength obtained is multiplied by an empirical coefficient of 0.8 as the predicted long-term strength. Then, the predicted long-term strength is divided into several grades, and the creep test is conducted through graded loading. The computer control system is used to collect the time and strain data during the test. Before the test, the samples are wrapped with preservative film and held at a constant temperature of 22°C to prevent the influences of air temperature and humidity changes on the samples.
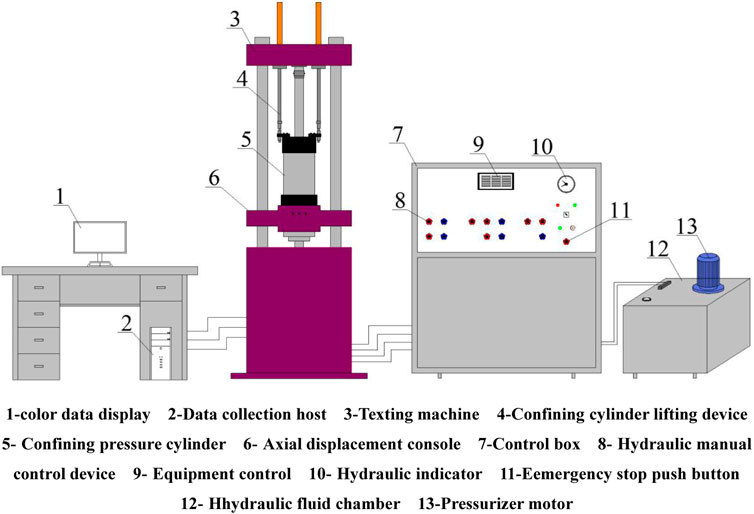
Figure 1. Load testing system.
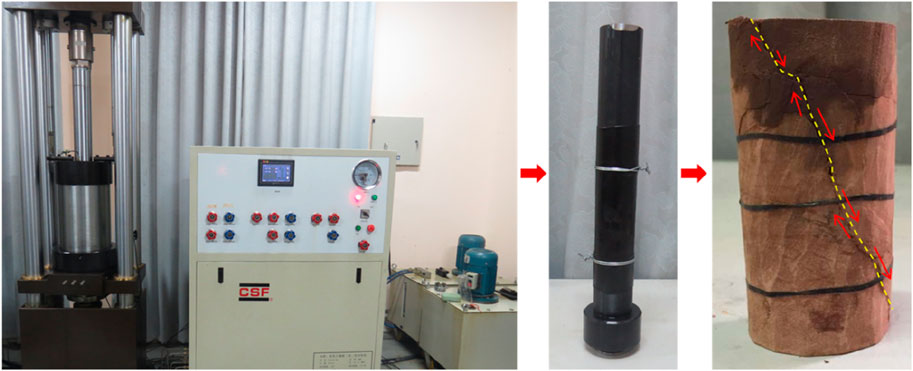
Figure 2. Experimental setup of the long-term creep test.
The test device is a ysj-01-00 rock triaxial creep testing machine, as shown in Figure 1. The system is used for conventional triaxial tests, triaxial rheological tests and uniaxial compression tests. The instrument is controlled by a computer and powered by electricity, gas and liquid. The instrument controls the confining pressure, axial load and axial displacement. The confining pressures are 0–3 30 MPa, and the axial loads are 0–11,000 kN. The accuracies of confining pressure and axial load are 0.5% F.S.
To improve the test efficiency, a load mode of step loading was adopted. The strength of the sample was comprehensively determined according to the results of the conventional triaxial test. The loading curve and stress characteristics are shown in Figure 3. The sample numbers were B-1, B-2 and B-3, and the confining pressure values were 5 MPa, 10 MPa and 15 MPa, respectively. The specific test steps were as follows:
(1) The prepared samples were wrapped with preservative film to prevent water loss. The samples were removed when the test began. When removing the fresh-keeping film, shaking was avoided.
(2) The sample was removed and the preservative film was removed; additionally, the sample was placed in a heat shrinkable sleeve and the upper loading end and the lower loading end of the test device were inserted into the heat shrinkable sleeve. The sample was placed vertically on a horizontal table top after contacting the loading end, and then the loading end was slowly adjusted to make a contact surface from two better contacts and alignments.
(3) A high-power hot air blower was used to blow out hot air from bottom to top, and the hot air shrink tube gradually shrunk. During the blowing process, the blower was screwed and the sample did not move. The shrinkage of each heat shrinkable tube should be reduced as much as possible to place all parts under uniform stress. This method could effectively reduce the error caused by the later loading test.
(4) The initial loading sample was loaded into the middle of the base of the confining pressure cylinder, and then the lower loading end was rotated to optimize the contact surface between the lower loading end and the base. After adjusting the position and installation, the upper loading end was manually controlled to move down slowly to preload the sample. The load value was preset as 0.1 According to the preset value of confining pressure, a computer was used to control the loading of confining pressure.
(5) The axial load control mode was adjusted to the load mode with a loading speed of 0.1 MPa/s, and then the axial load value was preset. The control mode was adjusted from manual mode to computer automatic control, and the load recording time interval was 1 min. Furthermore, the axial load was slowly loaded to the preset value and remained constant.
(6) After the axial strain of each stage of loading was basically stable, the computer was controlled to conduct the next stage of loading, and the loading time of each stage was not less than 72 h. The specimens were subjected to progressive cyclic loading until failure.
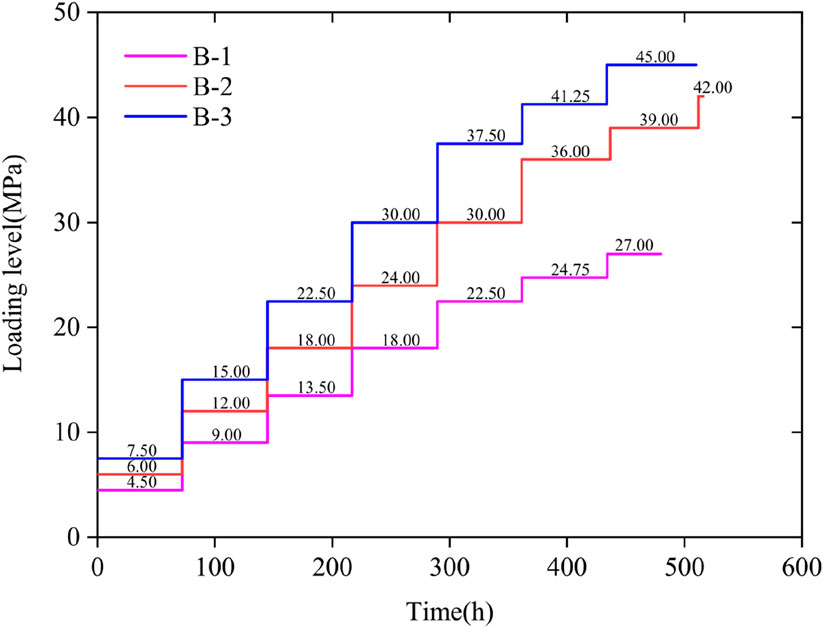
Figure 3. Loading levels and duration at all levels in creep tests.
The test curve is obtained by the triaxial compression creep test, as shown in Figure 4. The B1 sample lasts 480 h, the B2 sample lasts 557 h, and the B3 sample lasts 510 h, totaling 1,547 h. The curve shows that the sample has undergone the stages of instantaneous elastic deformation, initial deceleration creep, constant velocity creep and accelerated creep. Due to the different confining pressures and axial loads of the different specimens, the deformation characteristics of the test curves are different. In addition to the last stage of loading, the creep curves of the other stages only include three stages: the instantaneous elastic deformation stage, initial deceleration creep stage and constant velocity creep stage. Only the last stage of accelerated creep occurs. The appearance of accelerated creep indicates that the microfracture process in rock is accelerated irreversibly until the specimen is destroyed.
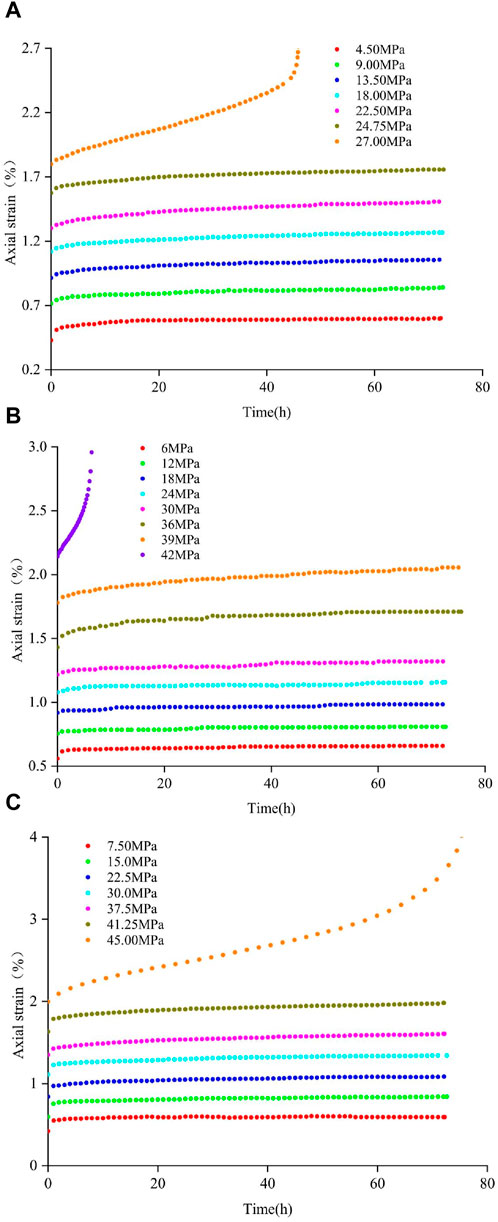
Figure 4. Relationship curves of axial strain with time for sandstone under different confining pressures. (A) σ3 = 5 MPa, (B) σ3 = 10 MPa, (C) σ3 = 15 MPa.
Figure 5 shows a statistical relationship between the steady-state creep rate and the load. The figure shows that with the increase in the load, the steady-state creep rate tends to increase nonlinearly. However, at the last stage of loading, the steady-state creep rate increases rapidly; this turning point is a sign that the specimen is about to enter the accelerated failure stage (Fairhurst and Hudson, 1999; Jian-Zhi et al., 2023). When the confining pressure is 5 MPa, the steady creep rate is 1.075 × 10⁻⁴/h. When the confining pressure is 10 MPa, the steady creep rate is 1.078 × 10⁻⁴/h. When the confining pressure is 15 MPa, the steady creep rate is 1.347 × 10⁻⁴/h, and the values of the steady creep rate are on the same order of magnitude. The evolution law of the steady creep rate with time is represented by a rational number function. Through further analyses and treatments of the test, the creep rate of each specimen under the last stage of loading is obtained, as shown in Figure 6. The results show that the creep rate of the B-1 sample is 0.0113/h, that of the B-2 sample is 0.651/h, and that of the B-3 sample is 0.148/h. There are no obvious correlations between the rates, but they exceed the steady-state creep rate of each sample under the previous loading level. The results show that the deformation rate of the last loading curve of each sample decreases sharply in the early stage, remains stable in the middle stage, and increases sharply in the later stage. This phenomenon occurs because the expansion and penetration characteristics of internal cracks in the rock are near the failure degree of the specimen. The creep rate of the last stage is expressed by a power function with an absolute value function.
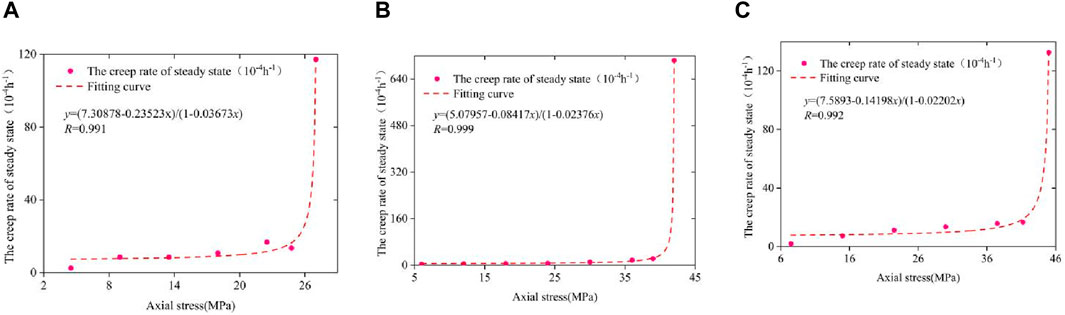
Figure 5. Steady-state creep rates under stress loading at all levels. (A) σ3 = 5 MPa, (B) σ3 = 10 MPa, (C) σ3 = 15 MPa.
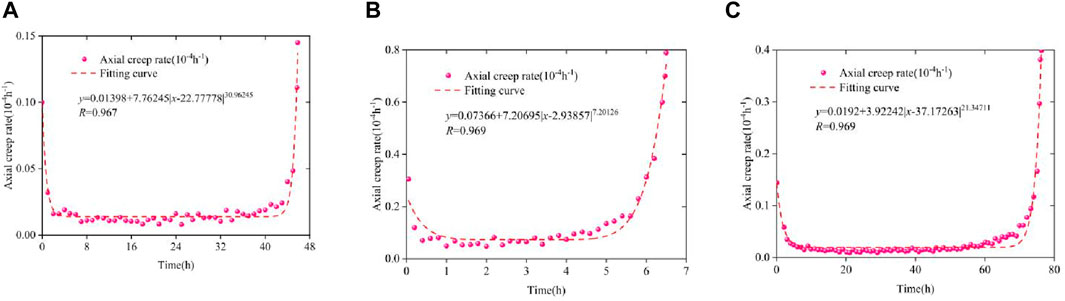
Figure 6. Long-term creep rate vs. last stage loading. (A) σ3 = 5 MPa, (B) σ3 = 10 MPa, (C) σ3 = 15 MPa.
According to an analysis of the whole process creep curve and the change characteristics of the creep rate, the deformation of each creep stage is counted, as shown in Figures 7–9. Figure 7 shows the statistics of the instantaneous deformation of each sample under different confining pressures under various loading conditions. The evolution law of deformation is characterized by an exponential function. The figure shows that with the increase in the loading series, the instantaneous deformation decreases gradually, the amplitude of reduction in the early stage is larger, and the reduction range in the later stage gradually decreases and tends to a fixed value. This phenomenon occurs because the internal cracks gradually close in the initial stage of loading; with the increase in load, the cracks cannot be further closed. Therefore, the reduction range of instantaneous deformation decreases gradually. Additionally, the instantaneous deformation of each sample during the first stage loading is much larger than that of other loading stages. This phenomenon occurs because during sampling, sample preparation and loading, the microcracks in the rock mass are greatly affected by the disturbance; thus, the strain presents the characteristics of maximum value in the first loading.
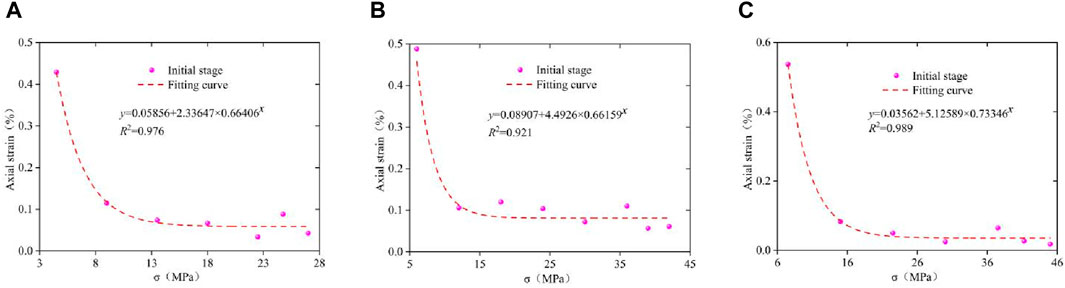
Figure 7. Strain statistics in the instantaneous deformation stage. (A) σ3 = 5 MPa, (B) σ3 = 10 MPa, (C) σ3 = 15 MPa.
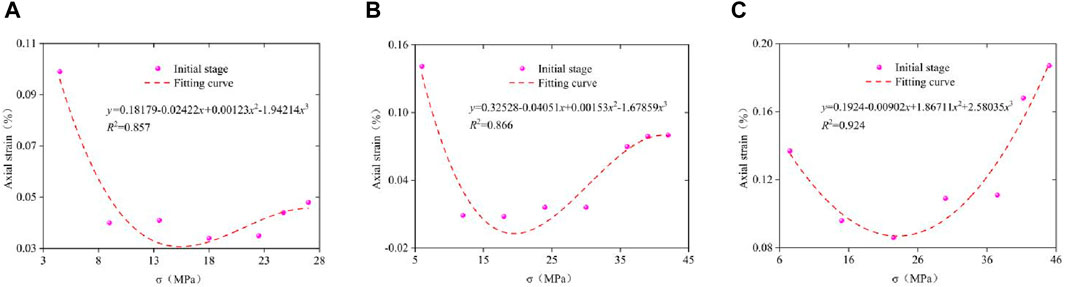
Figure 8. Strain statistics in the decaying creep stage. (A) σ3 = 5 MPa, (B) σ3 = 10 MPa, (C) σ3 = 15 MPa.
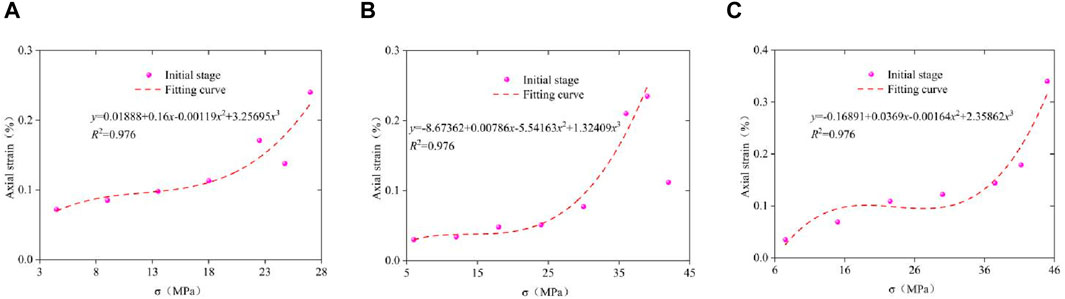
Figure 9. Strain statistics in the constant creep stage. (A) σ3 = 5 MPa, (B) σ3 = 10 MPa, (C) σ3 = 15 MPa.
Figure 8 shows the statistics of the strain in the decay creep stage of each sample under different confining pressure conditions. The strain in the decay creep stage decreases first and then increases. At this stage, the closure of microcracks in the rock is greater than that in the rock; the closure value of the microcracks in the early stage of loading is larger than that in the rock. Furthermore, due to the lower load, there are fewer internal cracks. With increasing load, the closing amount of microcracks gradually decreases; the number of microcracks increases gradually. The macroscopic behavior is that the strain first decreases and then increases until it reaches a relative equilibrium state. Furthermore, the specimen enters the steady-state creep stage. The evolution law of deformation is characterized by a cubic function.
The results show that under the condition of constant loading, the deformation amplitude of each stage increases gradually with increasing total deformation under different loading conditions. However, in the later stage, the strain increases sharply. The evolution law of deformation is characterized by a cubic function.
Studying the creep mechanisms and characteristics of rocks are the basis for understanding the long-term stability of geotechnical engineering activities. As far as rock materials are concerned, many scholars have performed much research on the long-term time effect of rock deformation. Despite the results from the uniaxial compression, triaxial compression and shear tests, it is observed that the creep curve of rock in the whole process has typical zoning characteristics. Generally, the creep deformation characteristics of rock materials are divided into four typical stages, as shown in Figure 10A: (i) the instantaneous elastic deformation stage; (ii) the initial deceleration creep stage; (iii) the intermediate constant velocity creep stage; and (iv) the late accelerated creep stage. Additionally, according to the strain rate and strain curve characteristics of rocks, rock creep is divisible into a deceleration zone, constant velocity zone and acceleration zone, as shown in Figure 10B. Unfortunately, the creep rate in the constant velocity zone is not constant; however, the variation range is relatively small, and the duration of this stage is longer than the time‒strain curve throughout the process. Therefore, these phenomena need to be divided into one stage separately.
(i) Instantaneous elastic deformation stage: the deformation in this stage is only related to the stress level, not time; the deformation in this stage is elastic deformation. The deformation at this stage mainly depends on the stress level σ0 and the elastic modulus E0. This stage is included in the deceleration zone.
(ii) Initial deceleration creep stage: the strain rate in this stage gradually decreases with time and gradually tends to a constant value. The stress curve is convex at this stage. This stage is included in the deceleration zone.
(iii) Intermediate constant velocity creep stage: the overall change in the strain rate in this stage is small. From the microrate, the variable speed in this stage is first negative and then positive, but the overall absolute value is low. At this stage, the generation of new microcracks in the rock mass and the closure of old microcracks reach a relatively balanced state. Furthermore, the applied stress level is insufficent for breaking the above equilibrium state, and the macroscopic deformation rate is relatively stable. The constant velocity zone mainly refers to this deformation stage.
(iv) Late accelerated creep stage: in this stage, the strain rate gradually increases with time and finally tends to infinity, at which time the specimen is destroyed. The acceleration zone mainly refers to the deformation stage. Note that, according to the research of many scholars, the deformation characteristics of different lithologies at this stage are obviously different. Generally, a rock mass with high strength presents the characteristics of brittle failure (Jianchao et al., 2022), and the curve exhibits an obvious sharp turning point. When the intensity of lithology is low, the curve shows the characteristics of flexible failure; additionally, the curve shows the morphological characteristics of a first-out arc.
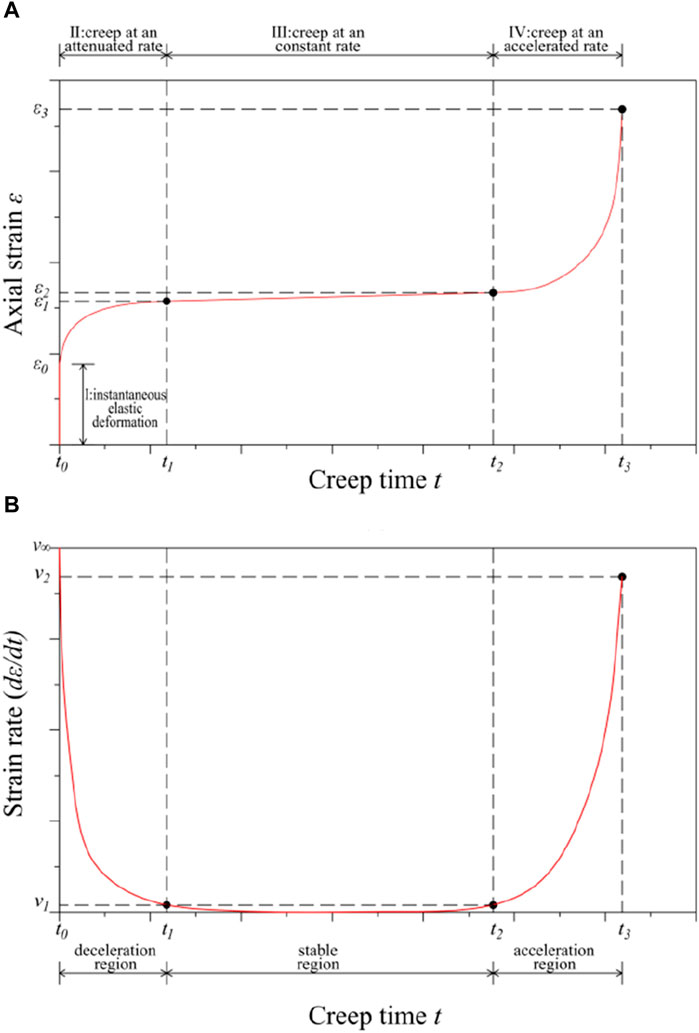
Figure 10. Complete creep curves of rock specimens under multiple stress levels. (A): Typical time-strain curve. (B): Typical time-strain rate curve.
To better describe the creep characteristics of rocks, the Abel clay pot based on a fractional derivative and the nonlinear damage damping element based on damage theory are connected in series to construct a new creep constitutive model, as shown in Figure 11. This model effectively describes the creep characteristics of sandstone. Total strain
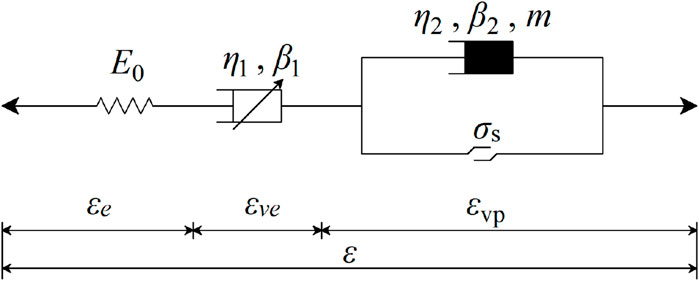
Figure 11. Creep constitutive model.
In the creep test, there is instantaneous deformation with extreme time during initial loading. The deformation
Because of its inherent characteristics, the fractional differential equations better describe the characteristics of nonlinear curves; additionally, the equation has been widely used in research on material rheology in recent years (Papoulia et al., 2010; Mainardi and Spada, 2011; Sapora et al., 2016). Fractional calculus describes derivatives and integrals of any order, and there are many definitions. Operators of fractional integrals mainly include Riemann–Liouville (R–L) fractional differential operator theory (Miller and Ross, 1993) and the Caputo operator. In this paper, Riemann–Liouville fractional differential theory is mainly adopted.
The R–L fractional derivative is one of many definitions developed based on integer differential equations. This definition is as follows:
Abel clay pots represent the rheological properties of geotechnical materials between ideal rheological bodies and ideal rigid bodies. The Abel clay pot stress‒strain relationship is as Eq. (5):
In studying the creep constitutive models of geotechnical materials, it is considered that
The creep rate of the kettle is adhered to by taking the derivative of Eq. 6, as shown in Eq. (7):
where
It is not enough to use elastic elements and Abel clay pot elements to express rock after entering the accelerated creep stage. Zhou et al. (Zhou et al., 2013) established a salt rock rheological model based on fractional derivative and found that the model accurately describes the rheological test curve of salt rock. Subsequently, the researchers proposed the variable coefficient Abel damper. The viscosity coefficient of rock is not constant in the rheological process. Therefore, for crack evolution and damage accumulation on a fine scale, only the effect of load action time is considered; the damage variable D is introduced to describe the deterioration of the viscosity coefficient. The damage variable D can be expressed by Eq. (9).
In Equation (3) (4), D assumes that the damage during rock rheology evolves into a negative exponential function, which is described as Eq. 10 follows:
where α is the coefficient related to the properties of the rock mass. The variation in rock damage variables with loading time based on the Weibull random distribution is described as follows:
where β and m are parameters representing the mechanical properties of the materials.
According to the strain equivalence principle (Lemaitre, 1996) proposed by Lemaitre, the strain of damaged material under full stress is equal to that of undamaged materials under effective stress. Cauchy stress is changed to effective stress
By introducing the damage variable D into the damping element, the constitutive equation of the nonlinear damage damping element is obtained as follows:
Combining the constitutive Eq. 13 of the nonlinear damage damping element with the rock damage variable in Eq. 11yields the following Eq. 14:
As shown in Figure 11, the total strain of unstable creep of rock is obtained by connecting all parts of creep in series:
In summary, the creep constitutive Eq. 16 can be obtained from Eq. Eq. 8 and Eq. 15:
A triaxial creep test of sandstone is conducted; based on the creep test data, the test results under different confining pressures are fitted and analyzed to verify the accuracy and rationality of the model. First, the elastic modulus is determined according to the initial strain and deviator stress in the elastic deformation stage
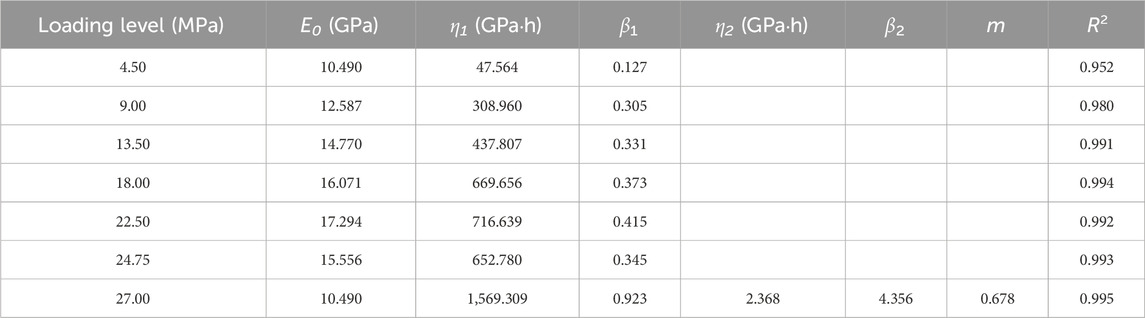
Table 1. Simulation parameters of the nonlinear creep damage constitutive model for sample B-1.
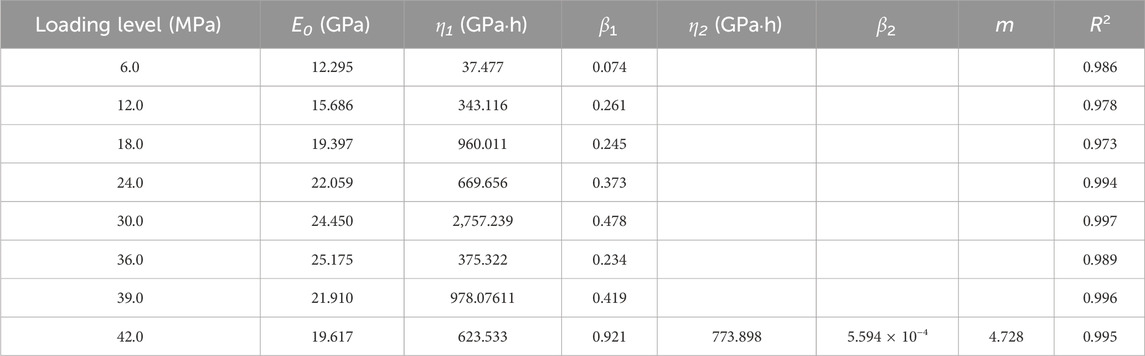
Table 2. Simulation parameters of the nonlinear creep damage constitutive model for sample B-2.
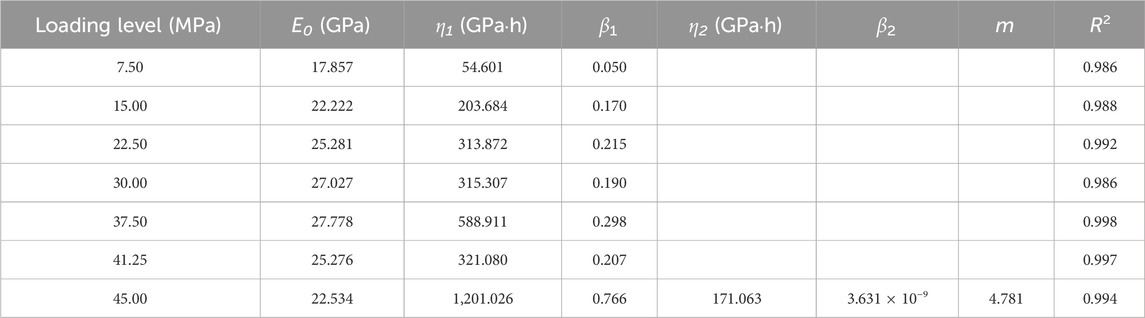
Table 3. Simulation parameters of the nonlinear creep damage constitutive model for sample B-3.
The nonlinear viscoelastic‒plastic creep model proposed in this paper describes the nonlinear creep characteristics of rock masses, especially the irregular nonlinear damage creep in the accelerated creep stage. The creep model is easily used for engineering tests and numerical simulations and effectively predicts and evaluates the long-term stability characteristics of geotechnical engineering projects. All samples show accelerated creep deformation in the last loading stage until the samples are deformed and destroyed. The creep curves of each sample are selected for model verification and fitting, and the fitting results are shown in Figure 12. The correlation coefficient is selected as the evaluation index. The fitting results show that the correlation coefficients are all near 1, proving that the constitutive model has a good fitting effect and effectively describes the nonlinear characteristics of curves.
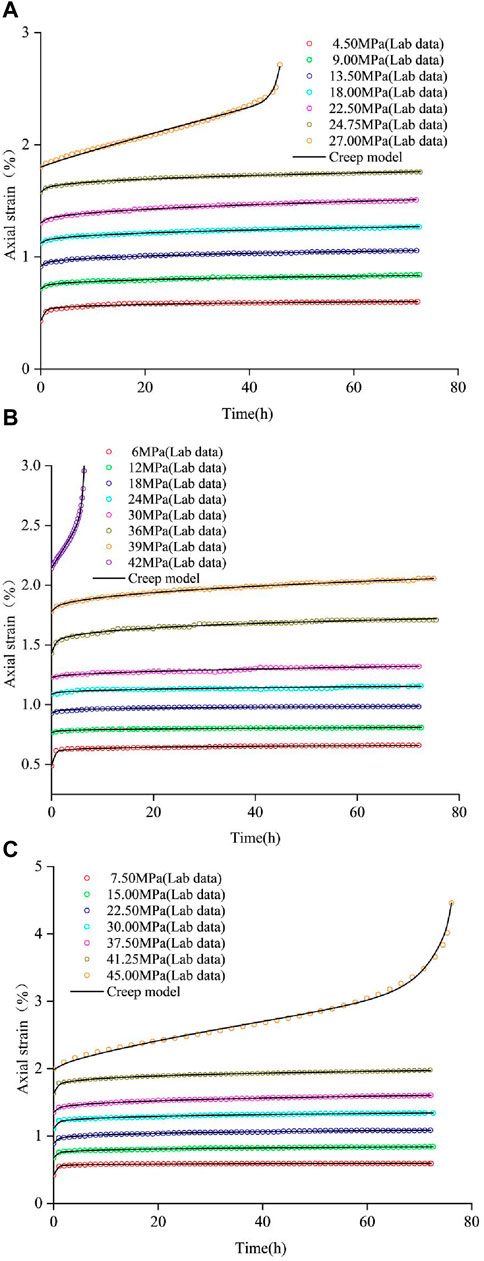
Figure 12. Experimental data and fitting curves by the creep model. (A) σ3 = 5 MPa, (B) σ3 = 10 MPa, (C) σ3 = 15 MPa.
The strain of this model formula depends on six parameters: E0, M, β1, β2, η1 and η2. Considering the deformation curve of the last stage of the specimen under an axial load of 45 MPa when the confining pressure is 15 MPa, parameter sensitivity analysis is conducted. Specifically, certain parameters are set to 70%, 85%, 100%, 115% and 130%, and the remaining parameters remain unchanged. As shown in Figure 13, three parameters—E0, β1 and η1—mainly correspond to the deformation characteristics of the strain curve in the instantaneous deformation stage, attenuation creep stage and steady creep stage. Figure 13A shows that E0 mainly controls the instantaneous elastic deformation stage and mainly determines the amount of elastic strain; however, it has no influence on the decay creep, steady creep and accelerated creep stages. The magnitude of E0 is negatively correlated with the strain. WhenE0 increases, the curve moves downward; while when E0 decreases, the curve moves upward. Figure 13C and Figure 13E show that β1 and η1 are the stages that mainly affect the attenuation creep and steady creep characteristics; their values are not affected in the instantaneous deformation stage. Then, different deformation characteristics appear with curves of β1 and η1, which are negatively correlated with the deformation rate in the steady creep stage. The larger η1 is, the smaller the steady creep rate, and the larger the deformation value in the decay creep stage. Figure 13 shows that m, β2 and η2 jointly determine the deformation at the accelerated creep stage. Figures 13B, F shows that the larger the value of m is, the earlier the creep curve specimen enters the accelerated creep stage; additionally, the larger the value of m is, the higher the curve strain rate. Figures 13D, F show that β2 is generally positively correlated with the deformation rate in the accelerated creep stage, and η2 is generally negatively correlated with the deformation rate in the accelerated creep stage; these parameters determine the slope characteristics in the accelerated creep stage. Therefore, through the different changes in parameters, the curve presents different deformation characteristics and has a high fitting degree in various deformation stages, and the results are more reliable.
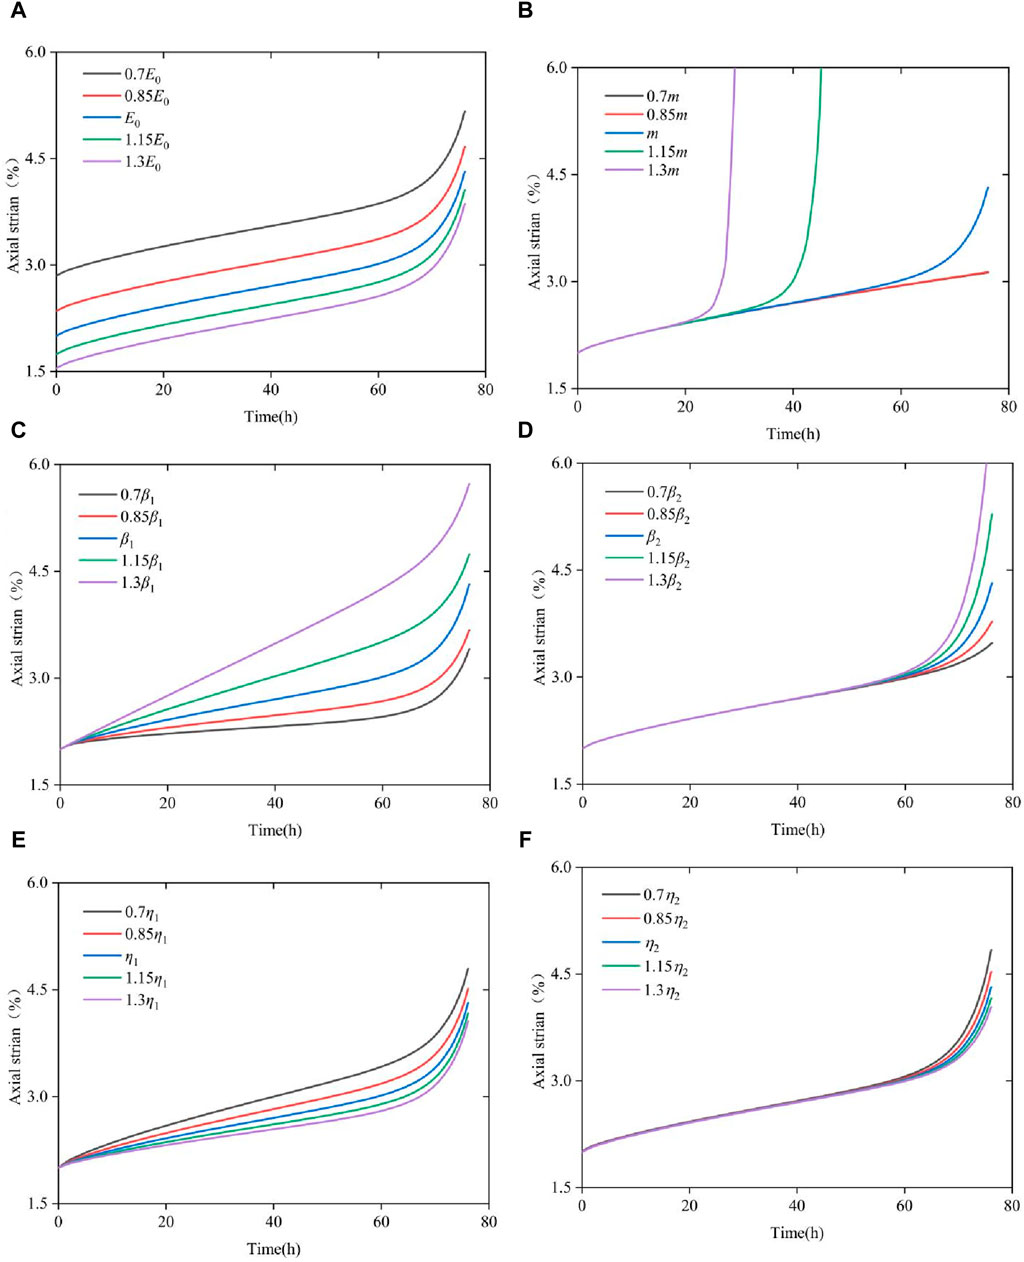
Figure 13. Effects of each parameter on the creep response. (A) E0, (B) m, (C) β1, (D) β2, (E) η1, (F) η2.
The experimental curve obtained in this paper has obvious characteristics of flexible failure, and the final failure of the sample requires a long process. The rheological characteristics are obviously different from those of high-strength hard rock. The creep curve has relatively obvious deformation stages, which are clearly divisible into instantaneous deformation, attenuation creep, constant velocity creep and accelerated creep. The creep model proposed in this paper has a good fitting degree to the experimental data; it is proven to be a model that describes the creep characteristics of rocks well. According to the fitting results, the order of the fractional derivative is always at a minimum when different samples are loaded in the first stage; the order is close to one when the samples are loaded in the last stage. This trend shows that with increasing load, rock elasticity gradually decreases; however, the viscosity gradually increases. In the accelerated creep stage, the accumulation of rock rheological damage and crack propagation are the main influencing factors leading to deformation and failure, which are closely related to the damage characteristics of materials. In this paper, a damage analysis of rock is introduced into the analysis of the constitutive model, providing some reference for the rheological study of rock. Although the introduction of damage theory has promoted the development of research in the field of rock rheology, the rheological research on the accelerated failure stage of rock still needs systematic and in-depth discussion.
Through triaxial creep experiments of sandstone, rock deformation characteristics and mechanisms are studied. By combining fractional derivative theory and damage theory, a new creep constitutive model is established that effectively captures and describes the deformation characteristics of each stage of creep. The conclusions are as follows:
(1) The unified creep model has a simple structure, and the parameters can be determined conveniently; this model describes the deformation characteristics of different creep stages, including instantaneous deformation, attenuation creep, constant velocity creep and accelerated creep. It is proven that the rheological model based on fractional derivative theory and damage theory is reasonable and practical.
(2) According to an analysis of the test curve, the deformation characteristics and rates in different stages of the creep curve are obtained; the causes and mechanisms of these phenomena are analyzed and summarized. During loading, the elastic deformation of rock gradually decreases, while the viscoplastic deformation gradually increases. Damage theory effectively describes the creep accelerated failure deformation stage of a rock mass.
(3) According to the test results, the nonlinear creep parameters under different creep stress conditions are obtained, and the accuracy of the creep model is verified. The fitting curve is in good agreement with a test curve. It is proven that the model describes the creep curve of rock throughout the process, especially the creep curve in the accelerated creep stage. A sensitivity analysis of model parameters is conducted by a quantitative evaluation method for verifying the rationality of the model.
The original contributions presented in the study are included in the article/Supplementary Material, further inquiries can be directed to the corresponding author.
XZ: Conceptualization, Investigation, Writing–original draft, Writing–review and editing. NJ: Conceptualization, Funding acquisition, Resources, Supervision, Writing–review and editing. JC: Data curation, Validation, Writing–review and editing. CH: Funding acquisition, Resources, Writing–review and editing. JW: Investigation, Writing–review and editing. HW: Data curation, Investigation, Writing–review and editing. RL: Data curation, Investigation, Writing–review and editing.
The author(s) declare that financial support was received for the research, authorship, and/or publication of this article. This work was supported by Sichuan Provincial Natural Science Foundation (2023NSFSC0263), State Key Laboratory of Geohazard Prevention and Geoenvironment Protection Independent Research Project (SKLGP2020Z006), State Key Laboratory of Geohazard Prevention and Geoenvironment Protection (Chengdu University of Technology, SKLGP2022K004), Sichuan Science and Technology Program (NO:2022YFG0183).
The authors are also grateful to the referees for their useful comments and careful review of the manuscript.
Author JW was employed by Changjiang Geotechnical Engineering Co., Ltd.
The remaining authors declare that the research was conducted in the absence of any commercial or financial relationships that could be construed as a potential conflict of interest.
All claims expressed in this article are solely those of the authors and do not necessarily represent those of their affiliated organizations, or those of the publisher, the editors and the reviewers. Any product that may be evaluated in this article, or claim that may be made by its manufacturer, is not guaranteed or endorsed by the publisher.
Chang, K. T., Ge, L., and Lin, H. H. (2015). Slope creep behavior: observations and simulations. Environ. Earth Sci. 73 (1), 275–287. doi:10.1007/s12665-014-3423-2
Deng, H. F., Zhou, M. L., Li, J. L., Sun, X., and Huang, Y. (2016). Creep degradation mechanism by water-rock interaction in the red-layer soft rock. Arab. J. Geosci. 9 (12), 601–612. doi:10.1007/s12517-016-2604-6
Fairhurst, C. E., and Hudson, J. A. (1999). Draft ISRM suggested method for the complete stress-strain curve for intact rock in uniaxial compression. Int. J. Rock Mech. Min. Sci. 36 (3), 279–289. doi:10.1016/S0148-9062(99)00006-6
Hou, R., Zhang, K., Tao, J., Xue, X., and Chen, Y. (2018). A nonlinear creep damage coupled model for rock considering the effect of initial damage. Rock Mech. Rock Eng. 52, 1275–1285. doi:10.1007/s00603-018-1626-7
Hu, X., Tan, F., Tang, H., Zhang, G., Su, A., Xu, C., et al. (2017). In-situ monitoring platform and preliminary analysis of monitoring data of Majiagou landslide with stabilizing piles. Eng. Geol. 228, 323–336. doi:10.1016/j.enggeo.2017.09.001
Jianchao, W., Guoqing, C., Yafeng, C., and Serati, M. (2022). Interrelation analysis method of acoustic emission for failure prediction of brittle failure based on vibration mechanics. Bull. Eng. Geol. Environ. 81 (6), 247. doi:10.1007/s10064-022-02752-6
Jiang, P., Pan, P. Z., and Zhao, S. K. (2018). Coupled creep constitutive model of rock viscoelasticplastic damage based on strain energy and its application. J. Coal Mine 43 (11), 2967–2979.
Jian-Zhi, Z., Wen-Tao, W., and Xiao-Ping, Z. (2023). On the predictability of localization instabilities of quasibrittle materials from accelerating rates of acoustic emission. Eng. Fract. Mech. 289, 109455. doi:10.1016/j.engfracmech.2023.109455
Kiryakova, V., and Al-Saqabi, B. (1999). Explicit solutions to hyper-Bessel integral equations of second kind. Comput. Math. Appl. 37 (1), 75–86. doi:10.1016/s0898-1221(98)00243-0
Li, R. D., and Chao, L. J. (2014). Nonlinear rheological constitutive model of soft soil based on fractional derivative. J. Appl. Found. Eng. Sci. 22 (5), 856–864.
Li, S. D., Li, X., Zhang, X. N., et al. (2004). Sedimentation characteristics of the Jurassic sliding-prone stratum in the three gorges reservoir area and their influence on physical and mechanical properties of rock. J. Eng. Geol. 12 (4), 385–389.
Liu, Y., Wang, E., Li, M., Song, Z., Zhang, L., and Zhao, D. (2023). Mechanical response and gas flow characteristics of pre-drilled coal subjected to true triaxial stresses. Gas Sci. Eng. 111, 204927. doi:10.1016/j.jgsce.2023.204927
Luo, Z., Li, J. L., Jiang, Q., Zhang, Y., Huang, Y., Assefa, E., et al. (2018). Effect of the water-rock interaction on the creep mechanical properties of the sandstone rock. Period Polytech. Civ. Eng. 62 (2), 451–461. doi:10.3311/ppci.11788
Mainardi, F., and Spada, G. (2011). Creep, relaxation and viscosity properties for basic fractional models in rheology. Eur. Phys. J. Spec. Top. 193 (1), 133–160. doi:10.1140/epjst/e2011-01387-1
Miller, K. S., and Ross, B. (1993). An introduction to the fractional calculus and fractional differential equations. Hoboken, NJ, USA: Wiley.
Papoulia, K. D., Panoskaltsis, V. P., Kurup, N. V., and Korovajchuk, I. (2010). Rheological representation of fractional order viscoelastic material models. Rheol. Acta 49 (4), 381–400. doi:10.1007/s00397-010-0436-y
Sapora, A., Cornetti, P., Carpinteri, A., Baglieri, O., and Santagata, E. (2016). The use of fractional calculus to model the experimental creep-recovery behavior of modified bituminous binders. Mater Struct. 49 (1–2), 45–55. doi:10.1617/s11527-014-0473-6
Song, Y., Lei, S., Zou, C., et al. (2015). Study on creep characteristics of carbonaceous slates under dry and saturated states. Chin. J. Undergr. Space Eng. 11 (3), 619–664.
Sun, J. (2007). Some advances in rheological mechanics of rock and its engineering applications. Chin. J. Rock Mech. Eng. (06), 1081–1106.
Tang, H., Li, C., Hu, X., Su, A., Wang, L., Wu, Y., et al. (2015). Evolution characteristics of the Huangtupo landslide based on in situ tunneling and monitoring. Landslides 12 (3), 511–521. doi:10.1007/s10346-014-0500-2
Wang, G. J. (2004). A new constitutive creep-damage model for salt rock and its characteristics. Int. J. Rock Mech.Min. Sci. 41, 61–67. doi:10.1016/j.ijrmms.2004.03.020
Wang, H., Yang, T., Liu, H., et al. (2017). Mechanical properties and energy evolution of dry and saturated sandstones under cyclic loading. Rock Soil Mech. 38 (6), 1600–1608.
Wang, X., Huang, Q., Lian, B., Liu, N., and Zhang, J. (2018b). Modified Nishihara rheological model considering the effect of thermal-mechanical coupling and its experimental verification. Adv. Mater Sci. Eng. 2018, 1–9. doi:10.1155/2018/4947561
Wang, X., Yin, Y., Wang, J., Lian, B., Qiu, H., and Gu, T. (2018a). A nonstationary parameter model for the sandstone creep tests. landslides 15 (7), 1377–1389. doi:10.1007/s10346-018-0961-9
Wu, F., Liu, J. F., and Wang, J. (2015). An improved Maxwell creep model for rock based on variable-order fractional derivatives. Environ. Earth Sci. 73 (11), 6965–6971. doi:10.1007/s12665-015-4137-9
Xu, P., Yang, T. Q., and Zhou, H. M. (2004). Study of the creep characterictics and long-term stability of rock masses in the high slopes of the three gorges ship lock, China. Int. J. Rock Mech. Min. Sci. 41 (3), 405. doi:10.1016/j.ijrmms.2003.12.002
Yang, T., Xu, T., Liu, H., Zhang, C., Wang, S., Rui, Y., et al. (2014). Rheological characteristics of weak rock mass and effects on the long-term stability of slopes. Rock Mech. Rock Eng. 47 (6), 2253–2263. doi:10.1007/s00603-013-0527-z
Yang, Y. G., Lai, Y. M., and Chang, X. X. (2010). Experimental and theoretical studies on the creep behavior of warm ice-rich frozen sand. Cold Reg. Sci. Technol. 63 (1-2), 61–67. doi:10.1016/j.coldregions.2010.04.011
Zhang, J., and Zhou, X. (2020). Forecasting catastrophic rupture in brittle rocks using precursory AE time series. J. Geophys. Res. Solid Earth 125 (8). doi:10.1029/2019jb019276
Zhang, Y., Hu, X., Tannant, D. D., Zhang, G., and Tan, F. (2018). Field monitoring and deformation characteristics of a landslide with piles in the Three Gorges Reservoir area. Landslides 15 (3), 581–592. doi:10.1007/s10346-018-0945-9
Zhou, H. W., Liu, D., Lei, G., Xue, D., and Zhao, Y. (2018). The creep-damage model of salt rock based on fractional derivative. Energies 11 (9), 2349. doi:10.3390/en11092349
Zhou, H. W., Wang, C. P., Han, B. B., and Duan, Z. Q. (2011). A creep constitutive model for salt rock based on fractional derivatives. Int. J. Rock Mech. Min. Sci. 48 (1), 116–121. doi:10.1016/j.ijrmms.2010.11.004
Zhou, H. W., Wang, C. P., Mishnaevsky, L., Duan, Z. Q., and Ding, J. Y. (2013). A fractional derivative approach to full creep regions in salt rock. Mech. Time-Dependent Mater 17 (3), 413–425. doi:10.1007/s11043-012-9193-x
Keywords: sandstone, creep test, rock damage, fractional class derivative, accelerated creep
Citation: Zhou X, Ju N, Cai J, He C, Wang J, Wang H and Liu R (2024) Damage creep model of viscoelastic rock based on fractional derivative and experimental verification. Front. Environ. Sci. 12:1338016. doi: 10.3389/fenvs.2024.1338016
Received: 14 November 2023; Accepted: 18 March 2024;
Published: 05 April 2024.
Edited by:
Yunhui Zhang, Southwest Jiaotong University, ChinaReviewed by:
Yubing Liu, China University of Mining and Technology, ChinaCopyright © 2024 Zhou, Ju, Cai, He, Wang, Wang and Liu. This is an open-access article distributed under the terms of the Creative Commons Attribution License (CC BY). The use, distribution or reproduction in other forums is permitted, provided the original author(s) and the copyright owner(s) are credited and that the original publication in this journal is cited, in accordance with accepted academic practice. No use, distribution or reproduction is permitted which does not comply with these terms.
*Correspondence: Nengpan Ju, am5wQGNkdXQuZWR1LmNu
Disclaimer: All claims expressed in this article are solely those of the authors and do not necessarily represent those of their affiliated organizations, or those of the publisher, the editors and the reviewers. Any product that may be evaluated in this article or claim that may be made by its manufacturer is not guaranteed or endorsed by the publisher.
Research integrity at Frontiers
Learn more about the work of our research integrity team to safeguard the quality of each article we publish.