- 1State Key Laboratory of Hydrology, Water Resources and Hydraulic Engineering and Science, Nanjing Hydraulic Research Institute, Nanjing, China
- 2PowerChina Resources Limited., Beijing, China
To systematically explore land use/cover change (LUCC) trends and driving mechanisms at the large watershed scale under the background of climate change and rapid urbanization. Taking the lower reaches of the Yangtze River (LRYR) as the research object, based on the land use remote sensing monitoring data from 1980 to 2020, the spatial and temporal evolution characteristics of LUCC in LRYR were analyzed by adopting the methods of land use dynamics degree (LUDD) and hotspot analysis and used geospatial detectors to quantitatively assess the intensity of the role of the land use change drivers in the LRYR. The results show that: 1) The land-use types in LRYR were dominated by arable land and woodland, accounting for more than 70% of the total area. During the study period, the construction land area increased by 11,835 km2, and became the third largest land-use type in LRYR after 2010 and formed a typical urban contiguous zone along the route from Nanjing to Shanghai. 2) The land use degree comprehensive index (LUDCI) in LRYR at each stage is 270.91, 270.88, 272.22, 272.72, 274.00, 275.57, 276.93 and 280.37, respectively. LUCC in LRYR has become more dramatic, and there is significant spatial heterogeneity. Shanghai has always been a hot area of LUCC and Huangshan and Chizhou are cold spots of LUCC. 3) The driving mechanism of LUCC in LRYR can be divided into three stages. In these three stages, secondary industry output value, precipitation, and elevation are always important factors affecting LUCC. The interaction between driving factors is significant. The strongest interaction is the output value of the secondary industry ∩ precipitation, the interaction reaches above 0.6. The research results are of great significance for promoting the sustainable development of land use in this region.
1 Introduction
Land is the carrier on which humans rely for survival (Tezcan et al., 2020) and plays a key role in the relationship between the development of humans and the natural environment (O’Driscoll et al., 2023). LUCC alters ecosystem patterns, processes, and functions (Yuan et al., 2019), and also influences global and regional climate change (Froese and Schilling, 2019). In recent years, with the rapid increase in urbanization level and rapid social and economic development, land use patterns have undergone dramatic changes (Ustaoglu and Aydınoglu, 2019), with significant changes in spatial structure, and more frequent and complex inter-annual changes in land use (He et al., 2022b). Therefore, among the studies of LUCC at different scales, LUCC caused by urbanization has attracted extensive attention from scholars in various fields (Duraisamy et al., 2018; Niu et al., 2021; Te Wierik et al., 2021). Strengthening the research on regional LUCC and driving mechanisms can provide a scientific basis for understanding the current status of regional land use and further rationally planning the use of land resources to achieve sustainable and high-quality development of regional ecological and economic systems.
Currently, scholars both domestically and internationally have conducted extensive research on LUCC. Those studies focused on the construction of a global-scale land use database (De Rosa et al., 2017; Brown et al., 2022), the analysis of land use hotspots at large scales (Kuemmerle et al., 2016), the administrative district and watershed scale LUCC process (Luo et al., 2022; Wu et al., 2023), the environmental effects of land-use change and ecosystem service value of land use (Wang et al., 2023; Zhao et al., 2023), and simulation of land use pattern (Wu et al., 2018). Under the background of climate change, the driving mechanism of LUCC has gradually become a research focus (Li et al., 2007). The methods adopted are mostly based on principal component analysis (Zhang et al., 2022) logistic regression modeling (Chang et al., 2020), genetic algorithm (Wei et al., 2008), spatial metric regression analysis method (Zong et al., 2023), etc. Such empirical-based statistical analysis models are instructive in qualitatively explaining that socioeconomic and natural factors are the main driving factors of LUCC, but further research is needed in the quantitative evaluation of the drivers.
Due to the large differences in natural base and socioeconomic development conditions between different regions, research on LUCC at different scales and regions has always been the focus of domestic and foreign scholars (Dadashpoor et al., 2019; Chowdhury et al., 2020). There are abundant research results on LUCC at the administrative district scale, but there are few studies on LUCC based on natural boundaries such as watersheds (Loukika et al., 2023; Zhang et al., 2023). At present, relevant research at the natural boundary scale mainly focuses on exploring the interactive relationship between LUCC and natural ecological environmental effects (Li et al., 2020; He et al., 2022a; Liu et al., 2022). There are few studies involving long-sequence land use structure change characteristics and driving mechanisms. In addition, since socioeconomic development data are collected in administrative units, current research mainly focuses on the small watershed/regional scale based on administrative district boundary statistics (Mwangi et al., 2017; Zhou et al., 2023). At the same time, due to the difficulty of data collection and sorting, there is still a lack of certain scientific quantitative research results on long series of LUCC and driving mechanisms at the large watershed scale. Therefore, research on the land use change characteristics and driving mechanisms of long-sequence large watershed areas still need to be further strengthened.
LRYR is one of the highly urbanized regions in China, with a special geographic environment and obvious spatial heterogeneity in resources, economy, and industrial structure (Lin et al., 2019). With the continuous advancement of urbanization, the contradiction between people and land has become increasingly prominent (Jia et al., 2020). Therefore, in the context of rapid urbanization development, it is necessary to conduct in-depth research on the characteristics and driving mechanisms of LUCC in LRYR. Based on land use remote sensing monitoring data and indicators of natural and socio-economic factors, this study investigates the spatial and temporal evolution characteristics of land use in LRYR and reveals the driving mechanisms of natural and socio-economic changes in land use. Selecting typical research areas to systematically analyze the spatiotemporal development characteristics and driving mechanisms of their land use patterns will be beneficial to extending the characteristic data of the land use development process in typical areas. Finally, the research results will provide information for the optimization of land use structure and policy formulation in the lower reaches of the Yangtze River. For reference, it provides certain theoretical support for promoting the healthy and sustainable development of LRYR.
2 Materials and methods
2.1 Study area
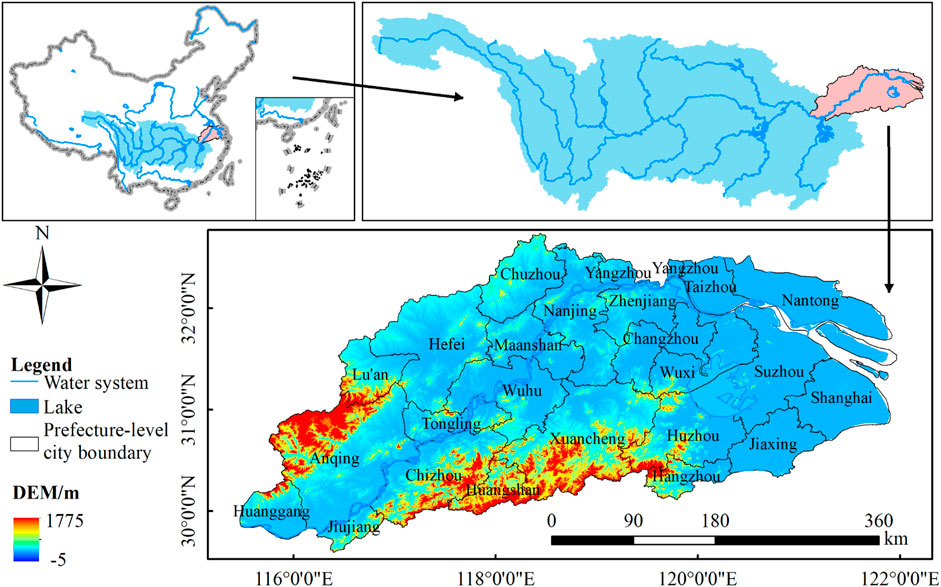
LRYR refers to the Yangtze River basin below Hukou County, Jiujiang, Jiangxi Province (Figure 1), with an administrative scope involving five provinces and one city, Jiangxi, Hubei, Anhui, Jiangsu, Zhejiang, and Shanghai, with an area of about 120,000 km2, accounting for 1.25% of China’s land area, and a GDP of about 25% and a population of about 15% of China in 2020. LRYR is a subtropical humid area with a subtropical monsoon climate. The average annual temperature is 15°C–18°C and the annual precipitation is about 1,300 mm, which is concentrated in the plum rain period at the turn of spring and summer and the typhoon period at the turn of summer and autumn. In addition, under the influence of subtropical monsoons and typhoons, LRYR is one of the regions with the highest rainstorm intensity in China, and also the areas with the most serious threat of floods.
Since China’s reform and opening up, the urbanization process in LRYR has been particularly rapid. LRYR has gradually developed into one of the most economically developed, densely populated, and industrially concentrated areas in China. There is a national-level city cluster, the Yangtze River Delta City Cluster, within the domain (Zhu et al., 2022). In recent years, with the transformation of development models, the characteristics of regional land use changes have undergone significant changes, making the study of the spatiotemporal distribution of land use in LRYR of great practical value.
2.2 Data source and processing
The land-use remote sensing monitoring data and China’s nighttime light annual data used in the article are both from the Resource and Environment Science Data Center of the Chinese Academy of Sciences (http://www.resdc.cn), with a spatial resolution of 1 km. The land-use data spanned the period from 1980 to 2020, including 8 periods of land-use data for 1980, 1990, 1995, 2000, 2005, 2010, 2015 and 2020. The five main land use types involved in this study are arable land, woodland, construction land, waterbody, and grassland. The period of the night lighting data is 1995–2020. DEM data is obtained from a Geospatial Data Cloud with a spatial resolution of 30 m (https://www.gscloud.cn). To ensure that the data coordinate system is consistent, the ArcGIS platform is used to unify the land use data, night light data, and DEM data into the Krasovsky_1940_Albers coordinate system, and resample the data spatial resolution to 1 km. The population density, GDP, secondary industry output value, and precipitation are extracted from the China Urban Statistical Yearbook, Shanghai Statistical Yearbook, Jiangsu Statistical Yearbook, Zhejiang Statistical Yearbook, Anhui Statistical Yearbook, and Hydrological Yearbook of the Yangtze River Basin, and the length of the data series is 1995–2020. A panel dataset was constructed to explore the drivers of LUCC in LRYR by integrating land use data and driver factors for 24 cities from 1995 to 2020.
2.3 Methods
2.3.1 Framework of the research
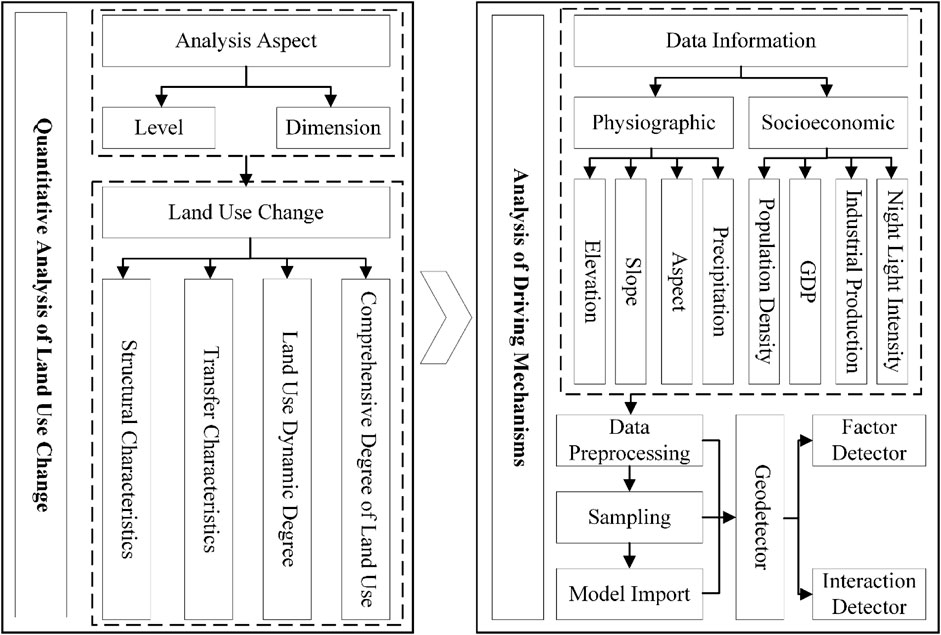
LUCC is the result of the joint action of multiple factors, of which the natural environment and human conditions are the two most important factors. Changes in the natural environment will directly affect the natural endowment of regional land resources and the spatial distribution of land use (Potschin, 2009; Zhou et al., 2019). However, with the development of the social economy, human activities have gradually become another important factor in changing the spatial distribution and pattern of regional land use (Zhou et al., 2020a). Urbanization, population policy, land policy, and so on indirectly affect the land use pattern (Zhou et al., 2020b). Therefore, this research uses the land use dynamic model, the hot and cold spot analysis model, and the transfer matrix to analyze the spatiotemporal evolution characteristics of land use in the lower reaches of the Yangtze River, and refers to the research of relevant scholars (Deng et al., 2022; Wu et al., 2022), comprehensively considers natural and socio-economic factors to select the driving factors of LUCC (Table 1). In this study, the terrain was characterized by altitude, slope, and aspect, and precipitation was selected as the climate feature, population density, GDP, secondary industry output value, and nighttime lighting are used as socio-economic indicators. The intensity of the effects of natural and socio-economic drivers on LUCC in LRYR was quantitatively analyzed using the geographic detection method. The structure of the article is shown in Figure 2.
2.3.2 Land-use dynamic degree
LUDD (Zhu and Li, 2003) can objectively reflect the type changes, degree changes, and regional differences in regional land use. The land use dynamic model describes the annual rate and dynamic trend of a certain type or multiple types of land use area changes in the study area during the study period by constructing LUDD. According to the number of land use types analyzed, the LUDD is divided into a single land use dynamic model (SLUDD) and a comprehensive land use dynamic model (CLUDD), and the calculation formula is as follows Eqs 1, 2:
Single land use dynamic degree (SLUDD):
where Si denotes the dynamic degree of the land-use type i; Ua and Ub represent the area of land-use type i at the beginning and the end of the study period, respectively. T presents the length of the study period.
Comprehensive land use dynamic degree (CLUDD):
where LC denotes the comprehensive land use dynamic degree; n is the number of land use types; Δ LUi-j is the absolute value of the total area of land from one land type i to other land types j during the T period; LUi is the area of the initial land type i; T presents the length of the research period.
2.3.3 Exploratory spatial data analysis
To explore the hotspot areas of land use in LTYR and dissect the spatial variability of the degree of LUCC. Based on calculating the land use degree comprehensive index (LUDCI) in various administrative regions of LRYR (Zhu and Li, 2003), this study combined the cold-hotspot model to identify the cold and hot spot areas with the spatial distribution of LUCC in LRYR since 1980.
Cold-hotspot analysis is one of the global aggregation testing methods (Eqs 3, 4) (Kondo, 2016). It explores spatial autocorrelation by calculating the local autocorrelation index of dataset elements
where:
2.3.4 Geographical detector
LUCC is affected by multiple factors and does not have a linear relationship with strict statistical criteria. It is challenging to explore the effects of multiple factors on LUCC. The geographical detector (Eqs 5, 6) (Wang and Xu, 2017) is a statistical analysis method to detect spatial heterogeneity and reveal the driving force behind it, which can be used for quantitative data as well as qualitative data. This paper utilizes this method to analyze the characteristics of spatial heterogeneity of land use and its drivers in LRYR, which mainly consists of factor detection and interaction detection.
(i) Factor detection is used to reveal the spatial heterogeneity of the dependent variable LUCC (Y) and to detect the degree of explanation of the spatial heterogeneity of LUCC by each driving factor (X). The expression is:
where q is the degree of explanation of spatial heterogeneity of land use by driver X, with a range of [0,1], the larger the value of q, the greater the degree of explanation of LUCC by driver X; h is the number of divisions or classifications of driver X; L is the number of drivers; Nh and N are the number of samples of the h th class of driver X and the total number of regional samples, respectively; σh and σ are the variance of the h th class of driver X and the total regional variance, respectively.
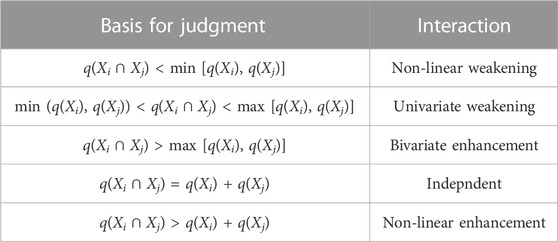
(ii) Interaction detection is used to identify the difference in explanatory power when two drivers Xi and Xj act together relative to when they act as a single factor, mainly by comparing the explanatory power of Y [q(Xi), q(Xj)] when drivers Xi and Xj act independently to the explanatory power of Y [q(Xi ∩ Xj)] when factors Xi and Xj interact. The relationships between the factors can be categorized as follows (Table 2) (Wang and Xu, 2017).
3 Results
3.1 Spatio-temporal pattern of land use and transfer characteristics in LRYR
3.1.1 Spatial and temporal patterns of land-use
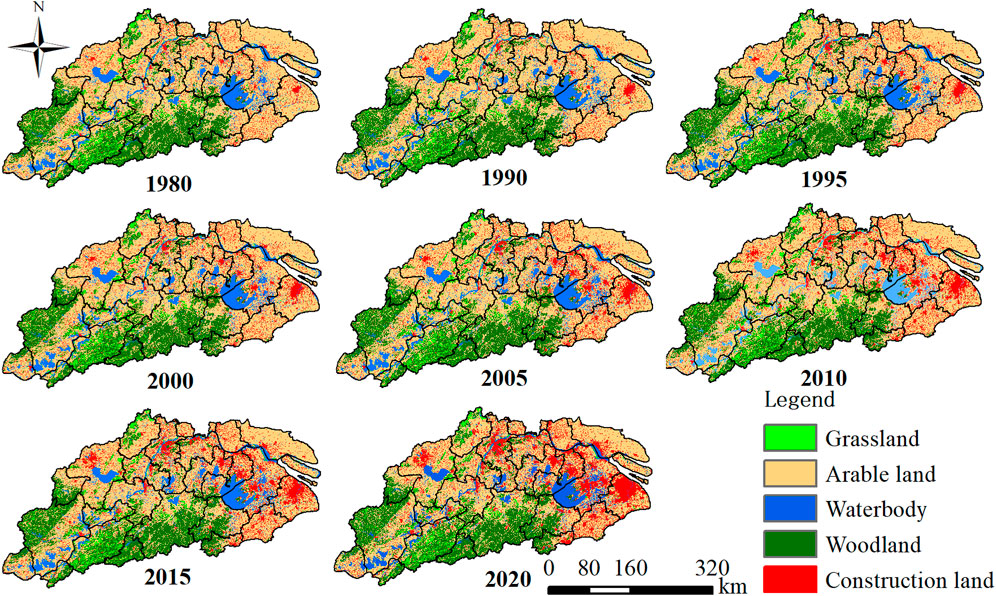
From 1980 to 2020, arable land was the dominant land use type in LRYR, followed by woodland and then waterbody. Spatial distribution of arable land is mainly distributed in the plains on both sides of the Yangtze River; woodland is mainly concentrated in the Dabie Mountain Range and the Huangshan Mountain Range; waterbody is mainly distributed in the Yangtze River, Chaohu Lake, Taihu Lake, and other major rivers and lakes water surface (Figure 3).
LUCC mainly shows the trend of increasing construction land and decreasing arable land, with smaller changes in grassland, woodland, and waterbody. In 1980, the area of arable land, construction land, woodland, grassland, and waterbody in LRYR was 72,081, 7,883, 27,063, 5,082, and 11,778 km2, accounting for 58.18%, 6.36%, 21.84%, 4.10% and 9.21% of the total area, respectively. In 2020, the area of arable land, construction land, woodland, grassland, and waterbody in LRYR is 60,041, 19,718, 26,592, 5,278, and 12,138 km2, accounting for 48.51%, 15.93%, 21.48%, 4.26% and 9.81% of the total area, respectively. After 2000, the rate of expansion of construction land in LRYR was remarkable. From 1980 to 2000, the proportion of construction land increased from 6.36% to 8.50%, totaling an increase of 2,694 km2, while cultivated land decreased from 58.18% to 55.73%, totaling a decrease of 2,723 km2. From 2000 to 2020, the share of construction land increased from 8.50% to 15.93%, totaling an increase of 9,141 km2, while cultivated land decreased from 55.73% to 48.51%, totaling a decrease of 9,317 km2. The spatial change of construction land shows the characteristic of expanding to the outer circle with large and medium-sized cities such as Shanghai, Suzhou, Wuxi, Changzhou, Hangzhou, Jiaxing, Nanjing, Hefei, and other cities as the core, and formed urban agglomerations along the lines from Nanjing to Shanghai and Hangzhou to Shanghai (Figures 3, 4).
3.1.2 Changes in land-use dynamics
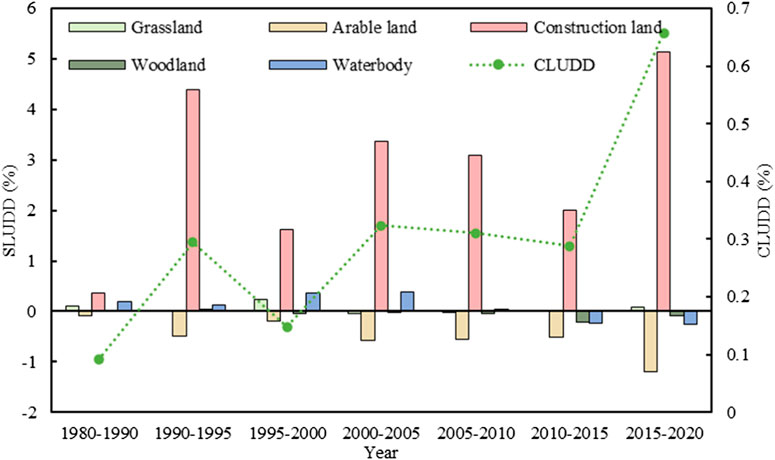
In 1980–2020, the CLUDD of the seven time periods in LRYR was 0.05%, 0.29%, 0.15%, 0.32%, 0.31%, 0.29%, 0.66%, respectively, and CLUDD generally showed a fluctuating upward trend of change. From 1980 to 2000, China was in the early stage of urbanization, and land use changes in LRYR were relatively slow. From 2000 to 2020, the rate of land-use change increased considerably compared with the previous period, especially from 2015 to 2020, the LUCC in LRYR was the most drastic, and the CLUDD reached 0.66% (Figure 5).
From 1980 to 2020, the dynamic degree of arable land was always negative, and the dynamic degree of construction land was always positive, indicating that arable land was continuously declining and construction land was continuously increasing. The dynamic attitude of other land use types had positive and negative fluctuations, but the magnitude of the change was not large. The two fastest growth rates of construction land were in 1990–1995 and 2015–2020, respectively. During these two phases, the construction land mobilization rate was 4.39% and 5.13%, respectively.
3.1.3 Evolution of land-use levels
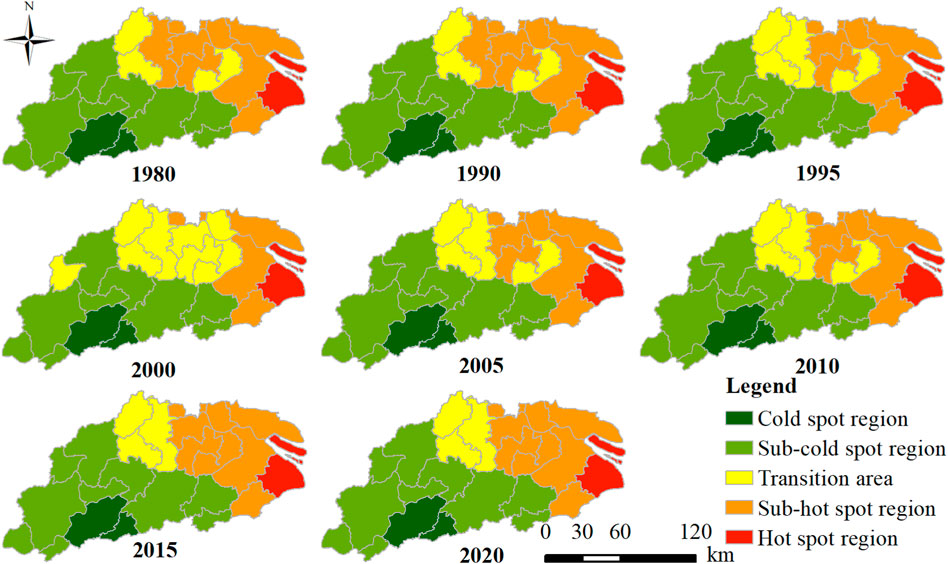
Taking one municipality and 23 prefectural-level cities in LRYR as the research units, the impact of human activities on land use was quantified by measuring the LUDCI of each city (Figure 6). On this basis, the cold-hot spot analysis model was used to dissect the land use hot and cold spot areas in LRYR (Figure 7).
From 1980 to 2020, the LUDCI of each city in LRYR showed an increasing trend year by year, and the high-value areas of LUDCI were mainly concentrated in Shanghai, Jiangsu cities, and Jiaxing of Zhejiang Province. The low-value areas are mainly concentrated in Anhui cities, Jiujiang in Jiangxi Province, Huanggang in Hubei Province, and Huzhou and Hangzhou in Zhejiang Province. Among them, the small LUDCI in Hangzhou is related to the fact that the area involving LRYR in this city is mainly forested. The LUDCI in LRYR at each stage is 270.91, 270.88, 272.22, 272.72, 274.00, 275.57, 276.93 and 280.37, respectively. Over the past 41 years, the LUDCI has shown an overall upward trend, with a total increase of 9.46, indicating that the impact of human activities on land use in LRYR has been increasing.
From 1980 to 2020, the spatial distribution of hot and cold areas in LRYR was relatively consistent. Shanghai has always been a hot spot for land use. Nanjing in Jiangsu Province, Chuzhou, and Ma’anshan in Anhui Province were transitional areas. Huangshan and Chizhou City in Anhui Province are cold spots of LUCC. The remaining cities are sub-cold spot areas. From the cold and hot spot zoning of land use in LRYR, it can be found that the distribution of cold and hot spots in this region is closely related to the regional socioeconomic distribution.
3.1.4 Land-use transfer characteristics
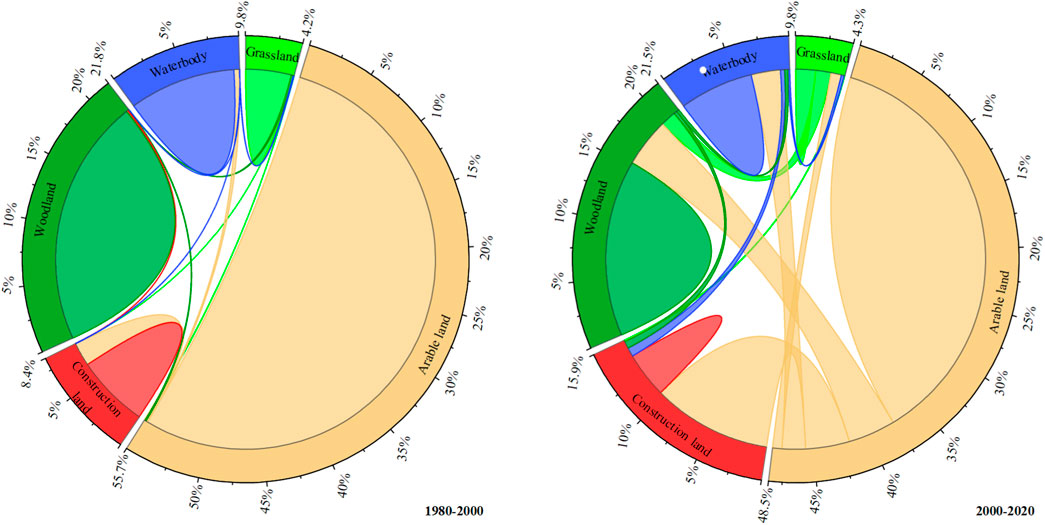
During the study period, the most important manifestation in LRYR was the mutual conversion of construction land and arable land. From 1980 to 2000, 3.54% of the arable land was transformed into construction land, with an area of 2,562 km2. During this period, 3.21% of the area of construction land was transformed into woodland, which was closely related to the rapid development of towns and cities and large-scale afforestation in that period. The changes in the remaining land categories are not obvious (Figure 8).
From 2000 to 2020, the changes between different land use types were more complicated. Combined with Figure 3, it can be found that the arable land around the city is transformed into construction land, while with the development of urbanization, the construction land in small towns far away from urban centers is transforming into arable land. However, the area of construction land increased by 9,141 km2 and the area of arable land decreased by 9,317 km2 during this period. 19.47% of the grassland was transformed into arable land, and 32.26% was transformed into woodland, with the former related to the transformation of cultivated crops, and the latter related to the large-scale afforestation of LRYR during that period. However, on the whole, except for construction land and arable land, the areas of the other three land types have not yet changed significantly.
3.2 Analysis of land-use drivers
3.2.1 Factor detection analysis
Based on the research scale of 10 km × 10 km grid unit, the LUDCI in LRYR is used as the dependent variable Y of the geographical detector, and eight driving factors are used as the independent variables X. Explore the driving mechanisms of LUCC in LRYR in different years. The explanatory power q value and changes of each driving factor are shown in Table 3 and Figure 9. The impact of various factors on LUCC in LRYR in different years is inconsistent, but generally, it can be divided into three stages.
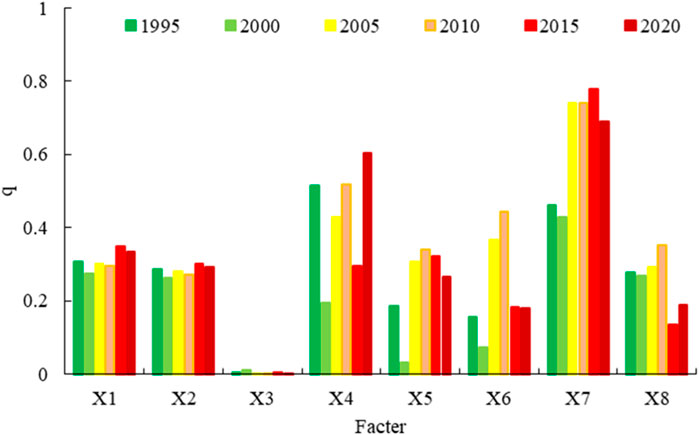
FIGURE 9. Changes in the explanatory power q value of driving factors for LUCC in LRYR from 1995 to 2020.
The first stage is from 1995 to 2000. In 1995, the ranking of the explanatory power (q) of various factors on LUCC in LRYR is X4 (0.514) > X7 (0.462) > X1 (0.307) > X2 (0.286) > X8 (0.277) > X5 (0.187) > X6 (0.156) > X3 (0.004). The explanatory power (q) of each factor in 2000 is ranked as follows: X7 (0.429) > X1 (0.274) > X8 (0.267) > X2 (0.263) > X4 (0.194) > X6 (0.072) > X5 (0.033) > X3 (0.009). The factors with strong explanatory power in 1995 and 2000 (explanatory power q is greater than 0.1) are X1, X2, X4, X7, and X8. During this period, the explanatory power of natural factors was stronger than socioeconomic factors. Therefore, before 2000, LUCC in LRYR was mainly affected by natural factors. Comparing the explanatory power of various factors in 2000 and 1995, it can be found that with the development of China’s economy, the driving force of socioeconomic factors has begun to increase.
The second stage is from 2000 to 2010. The first three driving factors in 2005 and 2010 were X7, X4, and X6. Among them, the q value of X7 is 0.742, which is much larger than before 2000. The secondary industry output value reflects the level of economic development of a region, indicating that the secondary industry output value has an important impact on LUCC at this stage. The reason is that in the 21st century, China’s reform and opening up has accelerated, and the secondary industry has developed rapidly, which has promoted the adjustment of industry and employment structures, thereby changing the land use pattern. At this stage, except for X3, the explanatory power q of all other factors is greater than 0.1, indicating that the driving factors of LUCC during this period are more complex and are not dominated by a single factor. The explanatory power of socioeconomic factors on LUCC shows an increasing trend, which further verifies that with economic development, LUCC is increasingly driven by socioeconomic factors.
The third stage is from 2010 to 2020. The explanatory power (q) of the driving factors of lLUCC in LRYR in 2015 is ranked as follows: X7 (0.780) > X1 (0.349) > X5 (0.323) > X2 (0.303) > X4 (0.294) > X6 (0.183) > X8 (0.134) > X3 (0.004); The explanatory power (q) of each factor in 2020 is ranked as follows: X7 (0.690) > X4 (0.605) > X1 (0.334) > X2 (0.292) > X5 (0.265) > X8 (0.190) > X6 (0.180) > X3 (0.002). The secondary industry output value is the factor with the strongest explanatory power of LUCC, with the explanatory powers of 0.780 and 0.690 respectively, indicating that at this stage, the secondary industry output value is still the dominant factor in LUCC in LRYR. From 2010 to 2020, the explanatory power of X1, X2, and X4 began to increase. Compared with 2000–2010, the impact of natural factors on LUCC is more prominent. This is closely related to the fact that after 2015, China began to implement the development strategy of “lucid waters and lush mountains are invaluable assets.” China’s economic development has shifted from “rough” to “high-quality” (Niu et al., 2022). The development of cities and towns continues to be based on socioeconomics and guided by geographical characteristics and comprehensively considers socioeconomic and geographical characteristics, increasing the driving role of natural factors.
3.2.2 Factor interaction analysis
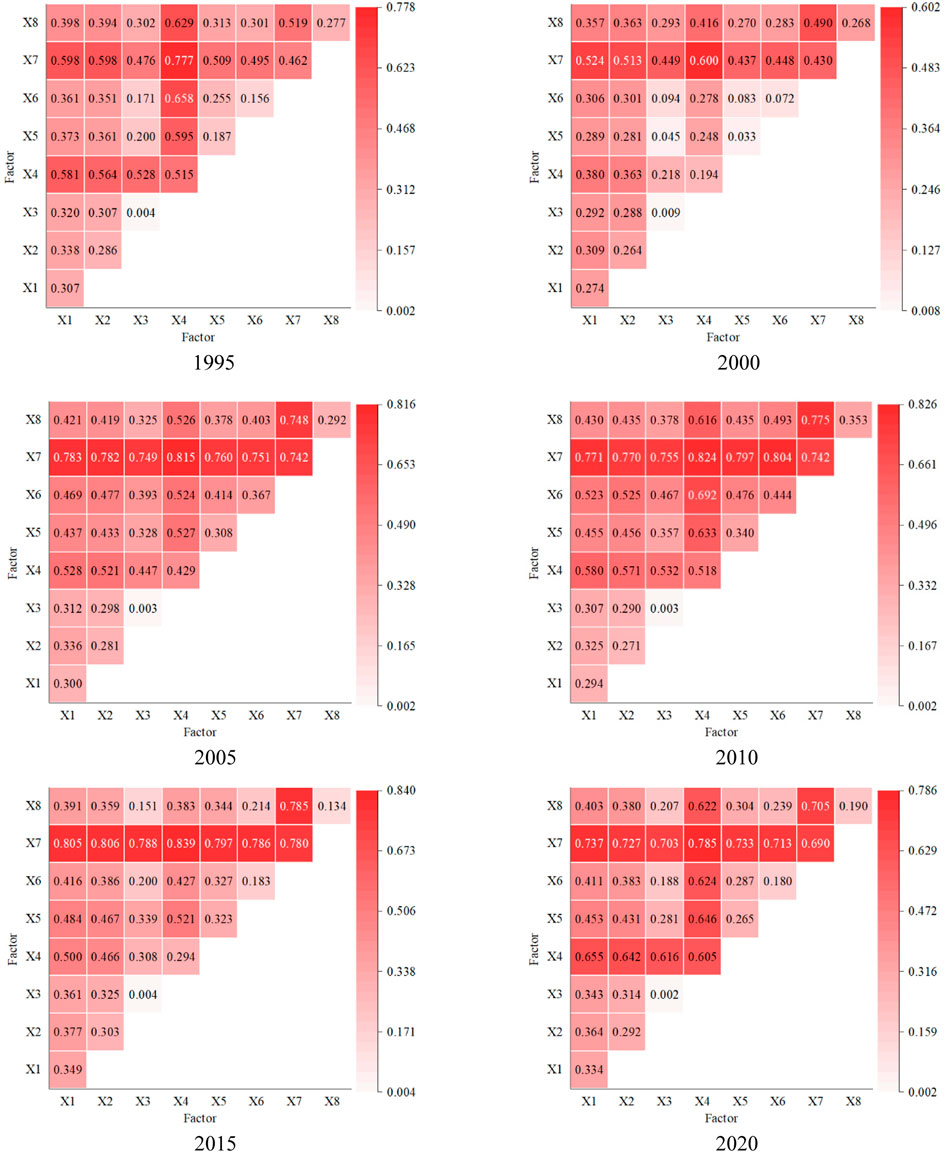
LUCC is affected by the comprehensive effects of multiple factors. The interaction detection reflects the difference in the impact of the driving factors on LUCC compared with that of a single factor. The interactive detection results of driving factors of LUCC in LRYR in different periods are shown in Figure 10. The results show that the interaction detection results between the driving factors in different periods showed a bivariate enhancement effect, indicating that the explanatory power of the interaction between the factors on LUCC has enhanced effect to different degrees compared with that of the single factor. At the same time, the strongest interaction in 1995–2020 is the secondary industry output value ∩ precipitation, which indicates that the secondary industry output value in the socio-economic factors and the precipitation in the natural factors jointly dominate the land use changes. From the perspective of the whole study period, the interaction between the secondary industry output value and other factors is the strongest, followed by the interaction between precipitation and other factors, which further verifies that the secondary industry output value and precipitation are more active on land use changes in all periods (Table 4).
4 Discussion
4.1 Spatial and temporal changes in land use in LRYR
Firstly, the characteristics of LUCC in LRYR from 1980 to 2020 were systematically analyzed in terms of spatial and temporal patterns of land use, LUDD, and LUDCI, and the land use changes in LRYR were classified into two phases, of which 1980–2000 was the beginning stage of urbanization, and 2000–2020 was the stage of rapid urbanization. Based on the above stage division, the land use transfer characteristics in LRYR were further analyzed. The SLUDD, CLUDD, land use change transfer matrix, and LUDCI not only provide a comprehensive picture of the intensity of spatial and temporal land-use changes but also enhance the comparability of changes in different land-use types.
Several scholars have explored the land use change characteristics of the Southeast Rivers Basin (Zhang and Zang, 2019), Tien Shan region (Wei et al., 2021), Weihe River Basin (Xu et al., 2023), and Selenge River Basin (Ren et al., 2022), etc., respectively, using the above single or multiple indicators. The results of the studies all show that the rate of LUCC in each region has increased to different degrees over time, and the impact of human activities on land use has gradually increased. The above results are similar to this study. There is a large difference in the distribution of land use in the east-west direction in LRYR from 1980 to 2020, which is mainly closely related to the socio-economic development of the region and the utilization of land resources, etc. Shanghai, the southern region of Jiangsu, Hangzhou, Jiaxing, and Huzhou of Zhejiang Province are the highly urbanized areas in China, with a developed socio-economy and the expansion of the urban construction land. It directly affects the transformation of construction land and other land types, which leads to the continuous zone of construction land along the line from Shanghai to Nanjing and from Shanghai to Hangzhou.
On the other hand, land policies and measures have also had a large impact on changes in woodland, arable land, and waterbody. The afforestation policy in the 1990s caused a small increase in the area of woodland in LRYR and caused the conversion of construction land to woodland. The construction of water conservancy projects and the rise of the aquaculture industry led to an increase in water body area during the period from 1980 to 2010. Into the 21st century, influenced by rapid socio-economic development and new urbanization policies (Yang et al., 2017), the area of arable land converted to construction land has increased dramatically, and the scale of cities has continued to expand. Combining the spatial distribution of land use in LRYR, it can be found that construction land in remote rural areas continues to decrease, rural construction land is reclaimed as arable land, and construction land on the edge of cities continues to expand. This is closely related to the policy of integrating rural villages into towns. After 2010, large-scale demolition and reclamation of rural areas were carried out, and the scale of cities and medium-sized villages and towns continued to expand. As the urbanization of cities in Shanghai, southern Jiangsu, and northern Zhejiang gradually reached a mature stage, the areas with drastic LUCC began to shift to the central and western regions in LRYR. Especially after 2015, with the promulgation and implementation of the Yangtze River Delta City Circle Development Plan (2014–2020), the central and western cities in the region have benefited from the integrated development of the Yangtze River Delta and have experienced rapid social and economic development (Ganguly et al., 2016). This further promoted the rapid transformation of land use types in LRYR. Therefore, between 2015 and 2020, CLUDD in LRYR is the largest at this stage, reaching 0.66%.
4.2 Drivers of land-use change
The dominant factors of LUCC in LRYR were quantitatively identified through the geographical detector, and the degree of influence of the interaction between the factors on land use change was explained. Before 2015, the main drivers of land use change in the lower reaches of the Yangtze River were socio-economic factors, and this conclusion was also supported by related studies (Song et al., 2018). By 2020, natural factors in the land use change in LRYR gradually become the main driving factor, and the explanatory power of topographic factors such as elevation and slope among natural factors gradually increases, which is closely related to China’s policy of gradually shifting from the rough development mode to the refined and green development mode since China’s Reform and Opening Up (Wu et al., 2006; Li et al., 2023).
In terms of the influence of two-factor interaction on LUCC, the strongest explanatory power of the interaction in 1995–2020 is the output value of the secondary industry ∩ precipitation, which indicates that the output value of the secondary industry and precipitation jointly dominate the change of land use. On a comprehensive view, the interaction between the output value of the secondary industry and other factors is the strongest, followed by the interaction between precipitation and other factors, which also further verified that the secondary industry output value and precipitation are more important to land use changes in all periods.
4.3 Limitations and future directions
This study integrates multiple methods to explore the spatial and temporal land use change characteristics and driving mechanisms in LRYR. However, the land use change characteristics and driving mechanisms in this region should be improved in the following aspects in the future: 1) Land use policy, land use policy has always been an important factor affecting urban or regional land use, but the impact mechanism of the policy has always been a hot and difficult point of scientific research, so it is necessary to delve deeper in this area. 2) The spatial resolution of land use adopted in the article is 1 km, and the time scale is 5 years, with coarse spatial and temporal resolution. In the future, we can consider combining the multi-source remote sensing data to optimize the database of this study. 3) In terms of the driving mechanism methodology, although the geographical detector can describe quantitatively the driving force of factors on the change of land use, they can not show whether the influence is positive or negative. Meanwhile, the discretization of data and the density of sampling points can have an impact on the results. In the future, it is necessary to consider combining the geographical detector, traditional correlation analysis methods, and geo-artificial intelligence methods to reveal the complex relationship between land use changes in different regions and the factors of nature, economy, and development of provincial capitals.
5 Conclusion
This paper discusses the spatiotemporal pattern, dynamic changes, and transfer characteristics of land use in LRYR from 1980 to 2020, studies the distribution of land use degree in LRYR using the cold-hotspot analysis method, and finally quantitatively discusses the driving mechanism of land use changes in LRYR by combining with geographical detectors. The following are specific conclusions:
(1) From 1980 to 2020, the dominant land use types in LRYR were changed from arable land, woodland, and waterbody to arable land, woodland, and construction land. From 1980 to 2000, the area of construction land increased by 2,694 km2 and the area of arable land decreased by 2,723 km2. From 2000 to 2020, the area of construction land increased by 9,141 km2, and the area of arable land decreased by 9,317 km2. There is not much change in other land use types. LUCC has been more significant since 2000. The area of construction land exceeded the area of the watershed after 2010 to become the third largest land use type in LRYR and formed a typical urban contiguous area along the line from Nanjing to Shanghai.
(2) From 1980 to 2020, the CLUDD in LRYR showed a fluctuating upward trend, and the speed of LUCC increased significantly after 2000. It indicates that the LUCC in LRYR was more drastic after 2000. During the past 41 years, the dynamic degree of arable land has always been negative, while the dynamic degree of construction land has always been positive. The dynamic degree of other land use types has fluctuated positively and negatively, but the change is not significant.
(3) There is significant spatial heterogeneity in the degree of land use in LRYR, with obvious cold and hot areas. Shanghai is always the hot spot of land use; Nanjing, Chuzhou, and Ma’anshan are the transition areas; Huangshan and Chizhou are the cold spot areas of land use changes.
(4) The driving mechanism of LUCC in LRYR can be divided into three stages. Before 2000, LUCC in LRYR was greatly affected by natural factors. From 2000 to 2010, socioeconomic factors became the dominant factor driving LUCC. After 2010, the driving force of natural factors gradually increased. The explanatory power of the interaction between the driving factors on LUCC is also enhanced to different degrees compared with that of the single factors. The strongest explanatory power of the interaction is the output value of the secondary industry ∩ precipitation, which indicates that the output value of the secondary industry and the precipitation jointly dominate LUCC.
Data availability statement
The original contributions presented in the study are included in the article/Supplementary Material, further inquiries can be directed to the corresponding author.
Author contributions
SS: Data curation, Formal Analysis, Methodology, Writing–original draft. TC: Conceptualization, Writing–review and editing. YW: Writing–review and editing. QG: Writing–review and editing. YL: Writing–review and editing.
Funding
The author(s) declare financial support was received for the research, authorship, and/or publication of this article. This research was funded by the National Key R&D Program of China (2021YFC3000101).
Conflict of interest
Author QG was employed by PowerChina Resources Limited.
The remaining authors declare that the research was conducted in the absence of any commercial or financial relationships that could be construed as a potential conflict of interest.
Publisher’s note
All claims expressed in this article are solely those of the authors and do not necessarily represent those of their affiliated organizations, or those of the publisher, the editors and the reviewers. Any product that may be evaluated in this article, or claim that may be made by its manufacturer, is not guaranteed or endorsed by the publisher.
References
Brown, C. F., Brumby, S. P., Guzder-Williams, B., Birch, T., Hyde, S. B., Mazzariello, J., et al. (2022). Dynamic World, Near real-time global 10 m land use land cover mapping. Sci. Data 9, 251. doi:10.1038/s41597-022-01307-4
Chang, X., Li, X., and Diao, H. (2020). Analysis of the driving forces of the landscape pattern evolution in a coal-mining subsided area. J. Agric. Resour. Environ. 37, 169–178. doi:10.13254/j.jare.2019.0238
Chowdhury, M., Hasan, M. E., and Abdullah-Al-Mamun, M. M. (2020). Land use/land cover change assessment of Halda watershed using remote sensing and GIS. Egypt. J. Remote Sens. Space Sci. 23, 63–75. doi:10.1016/j.ejrs.2018.11.003
Dadashpoor, H., Azizi, P., and Moghadasi, M. (2019). Land use change, urbanization, and change in landscape pattern in a metropolitan area. Sci. Total Environ. 655, 707–719. doi:10.1016/j.scitotenv.2018.11.267
Deng, X., Hu, S., and Zhan, C. (2022). Attribution of vegetation coverage change to climate change and human activities based on the geographic detectors in the Yellow River Basin, China. Environ. Sci. Pollut. Res. Int. 29, 44693–44708. doi:10.1007/s11356-022-18744-8
De Rosa, M., Vestergaard Odgaard, M., Staunstrup, J. K., Trydeman Knudsen, M., and Hermansen, J. E. (2017). Identifying land use and land-use changes (luluc): a global luluc matrix. Environ. Sci. Technol. 51, 7954–7962. doi:10.1021/acs.est.6b04684
Duraisamy, V., Bendapudi, R., and Jadhav, A. (2018). Identifying hotspots in land use land cover change and the drivers in a semi-arid region of India. Environ. Monit. Assess. 190, 535. doi:10.1007/s10661-018-6919-5
Froese, R., and Schilling, J. (2019). The nexus of climate change, land use, and conflicts. Curr. Clim. Change Rep. 5, 24–35. doi:10.1007/s40641-019-00122-1
Ganguly, K., Kumar, R., Mruthyunjaya Reddy, K., Jagadeeswara Rao, P., Raj Saxena, M., and Ravi Shankar, G. (2016). Optimization of spatial statistical approaches to identify land use/land cover change hot spots of Pune region of Maharashtra using remote sensing and GIS techniques. Geocarto Int. 32, 777–796. doi:10.1080/10106049.2016.1178813
He, J., Yu, Y., Sun, L., Zhang, H., Malik, I., Wistuba, M., et al. (2022a). Spatiotemporal change in the land use and ecosystem service value in the Aral Sea basin (1993-2018). Environ. Sci. Pollut. Res. Int. 29, 74416–74427. doi:10.1007/s11356-022-21094-0
He, Y., Chipman, J., Siegert, N., and Mankin, J. S. (2022b). Rapid land-cover and land-use change in the indo-Malaysian region over the last thirty-four years based on AVHRR NDVI data. Ann. Am. Assoc. Geogr. 112, 2131–2151. doi:10.1080/24694452.2022.2077168
Jia, Y., Tang, X., Tang, F., and Yang, Y. (2020). Spatial-temporal evolution of landscape pattern in the middle and lower reaches of the Yangtze River basin from 1995 to 2015. J. Nanjing For. Univ. Sci. Ed. 44, 185–194.
Kondo, K. (2016). Hot and cold spot analysis using stata. Stata J. Promot. Commun. statistics Stata 16, 613–631. doi:10.1177/1536867x1601600304
Kuemmerle, T., Levers, C., Erb, K., Estel, S., Jepsen, M. R., Müller, D., et al. (2016). Hotspots of land use change in Europe. Environ. Res. Lett. 11, 064020. doi:10.1088/1748-9326/11/6/064020
Li, D., Tian, P., Luo, H., Hu, T., Dong, B., Cui, Y., et al. (2020). Impacts of land use and land cover changes on regional climate in the Lhasa River basin, Tibetan Plateau. Sci. Total Environ. 742, 140570. doi:10.1016/j.scitotenv.2020.140570
Li, H., Wang, Z., Zhu, M., Hu, C., and Liu, C. (2023). Study on the spatial–temporal evolution and driving mechanism of urban land green use efficiency in the Yellow River Basin cities. Ecol. Indic. 154, 110672. doi:10.1016/j.ecolind.2023.110672
Lin, Z., Xu, Y., Dai, X., Wang, Q., Yuan, J., and Xu, Y. (2019). Effect of urbanization on the plain river network structure in the lower reaches of the Yangtze River. Resour. Environ. Yangtze Basin 28, 2612–2620.
Liu, W., Zhan, J., Zhao, F., Wang, C., Zhang, F., Teng, Y., et al. (2022). Spatio-temporal variations of ecosystem services and their drivers in the Pearl River Delta, China. J. Clean. Prod. 337, 130466. doi:10.1016/j.jclepro.2022.130466
Li, Z., Song, G., Lü, H., Bao, Y., Gao, J., Wang, H., et al. (2007). Analysis of land use change and its driving force in the Longitudinal Range-Gorge Region. Chin. Sci. Bull. 52, 10–20. doi:10.1007/s11434-007-7002-8
Loukika, K. N., Keesara, V. R., Buri, E. S., and Sridhar, V. (2023). Future prediction of scenario based land use land cover (LU&LC) using DynaCLUE model for a river basin. Ecol. Inf. 77, 102223. doi:10.1016/j.ecoinf.2023.102223
Luo, J., Xin, L., Liu, F., Chen, Q., Zhou, Q., and Zhang, Y. (2022). Study of the intensity and driving factors of land use/cover change in the yarlung zangbo river, nyang qu river, and lhasa river region, qinghai-tibet plateau of China. J. Arid Land 14, 411–425. doi:10.1007/s40333-022-0093-x
Mwangi, H., Lariu, P., Julich, S., Patil, S., Mcdonald, M., and Feger, K.-H. (2017). Characterizing the intensity and dynamics of land-use change in the mara River Basin, east africa. Forests 9, 8. doi:10.3390/f9010008
Niu, B., Ge, D., Yan, R., Ma, Y., Sun, D., Lu, M., et al. (2021). The evolution of the interactive relationship between urbanization and land-use transition: a case study of the Yangtze River Delta. Land 10, 804. doi:10.3390/land10080804
Niu, X., Liao, F., Liu, Z., and Wu, G. (2022). Spatial–temporal characteristics and driving mechanisms of land–use transition from the perspective of urban–rural transformation development: a case study of the Yangtze River Delta. Land 11, 631. doi:10.3390/land11050631
O’Driscoll, C., Crowley, F., Doran, J., and Mccarthy, N. (2023). Land-use mixing in Irish cities: implications for sustainable development. Land Use Policy 128, 106615. doi:10.1016/j.landusepol.2023.106615
Potschin, M. (2009). Land use and the state of the natural environment. Land Use Policy 26, S170–S177. doi:10.1016/j.landusepol.2009.08.008
Ren, Y., Li, Z., Li, J., Dashtseren, A., Li, Y., and Altanbagana, M. (2022). Comparative analysis of driving forces of land use/cover change in the upper, middle and lower reaches of the Selenga River Basin. Land Use Policy 117, 106118. doi:10.1016/j.landusepol.2022.106118
Song, X. P., Hansen, M. C., Stehman, S. V., Potapov, P. V., Tyukavina, A., Vermote, E. F., et al. (2018). Global land change from 1982 to 2016. Nature 560, 639–643. doi:10.1038/s41586-018-0411-9
Te Wierik, S. A., Cammeraat, E. L. H., Gupta, J., and Artzy-Randrup, Y. A. (2021). Reviewing the impact of land use and land-use change on moisture recycling and precipitation patterns. Water Resour. Res. 57. doi:10.1029/2020wr029234
Tezcan, A., BüYüKTAŞ, K., and Akkaya Aslan, Ş. T. (2020). A multi-criteria model for land valuation in the land consolidation. Land Use Policy 95, 104572. doi:10.1016/j.landusepol.2020.104572
Ustaoglu, E., and Aydinoglu, A. C. (2019). Regional variations of land-use development and land-use/cover change dynamics: a case study of Turkey. Remote Sens. 11, 885. doi:10.3390/rs11070885
Wang, Z., Meng, L., Li, L., Xu, F., and Li, Q. (2023). Multi-scenario simulation of land use and ecosystem services in Beijing under the background of low-carbon development. Acta Ecol. Sin. 43, 3571–3581. doi:10.5846/stxb202202050296
Wei, H., Xiong, L., Tang, G., Strobl, J., and Xue, K. (2021). Spatial–temporal variation of land use and land cover change in the glacial affected area of the Tianshan Mountains. Catena 202, 105256. doi:10.1016/j.catena.2021.105256
Wei, X., Liu, Y., and Yao, P. (2008). Study on driving forces of land use change based on simulated annealing genetic algorithm. China land Sci. 22 (07), 4.
Wu, J., Luo, J., Zhang, H., and Yu, M. (2023). Driving forces behind the spatiotemporal heterogeneity of land-use and land-cover change: a case study of the Weihe River Basin, China. J. Arid Land 15, 253–273. doi:10.1007/s40333-023-0052-1
Wu, L., Liu, X., and Ma, X. (2018). Prediction of land-use change and its driving forces in an ecological restoration watershed of the Loess hilly region. Environ. Earth Sci. 77, 238. doi:10.1007/s12665-018-7413-7
Wu, W., Zhang, J., Sun, Z., Yu, J., Liu, W., Yu, R., et al. (2022). Attribution analysis of land degradation in Hainan Island based on geographical detector. Ecol. Indic. 141, 109119. doi:10.1016/j.ecolind.2022.109119
Wu, Y., Su, Y., and Zhang, L. (2006). Economic structure transformation and land use change of the Changjiang River Basin. Chin. Geogr. Sci. 16, 289–293. doi:10.1007/s11769-006-0289-6
Xu, W., Song, J., Long, Y., Mao, R., Tang, B., and Li, B. (2023). Analysis and simulation of the driving mechanism and ecological effects of land cover change in the Weihe River basin, China. J. Environ. Manage 344, 118320. doi:10.1016/j.jenvman.2023.118320
Yang, J., Wu, T., and Gong, P. (2017). Implementation of China's new urbanization strategy requires new thinking. Sci. Bull. (Beijing) 62, 81–82. doi:10.1016/j.scib.2016.12.013
Yuan, K., Li, F., Yang, H., and Wang, Y. (2019). The influence of land use change on ecosystem service value in shangzhou district. Int. J. Environ. Res. Public Health 16, 1321. doi:10.3390/ijerph16081321
Zhang, J., and Zang, C. (2019). Spatial and temporal variability characteristics and driving mechanisms of land use in the Southeastern River Basin from 1990 to 2015. Acta Ecol. Sin. 39 (24), 12. doi:10.5846/stxb201810102187
Zhang, S., Yang, P., Xia, J., Wang, W., Cai, W., Chen, N., et al. (2023). Remote sensing inversion and prediction of land use land cover in the middle reaches of the Yangtze River basin, China. Environ. Sci. Pollut. Res. Int. 30, 46306–46320. doi:10.1007/s11356-023-25424-8
Zhang, Y., Niu, X., Hu, Y., Yan, H., and Zhen, L. (2022). Temporal and spatial evolution characteristics and its driving mechanism of land use/land cover change in Laos from 2000 to 2020. Land 11, 1188. doi:10.3390/land11081188
Zhao, X., Tian, Y., and Zhang, X. (2023). Spatio-temporal relationship between land use carbon emissions and ecosystem service valuein changzhutan urban agglomeration. J. Soil. Water Conservation 37 (05), 11. doi:10.13870/j.cnki.stbcxb.2023.05.026
Zhou, J., Gao, P., Wu, C., and Mu, X. (2023). Analysis of land use change characteristics and its driving forces in the loess plateau: a case study in the yan River Basin. Land 12, 1653. doi:10.3390/land12091653
Zhou, X., Chen, W., Wang, Y., Zhang, D., Wang, Q., Zhao, M., et al. (2019). Suitability evaluation of large-scale farmland transfer on the Loess Plateau of Northern Shaanxi, China. Land Degrad. Dev. 30, 1258–1269. doi:10.1002/ldr.3313
Zhou, Y., Li, X., and Liu, Y. (2020a). Rural land system reforms in China: history, issues, measures and prospects. Land Use Policy 91, 104330. doi:10.1016/j.landusepol.2019.104330
Zhou, Y., Li, Y., and Xu, C. (2020b). Land consolidation and rural revitalization in China: mechanisms and paths. Land Use Policy 91, 104379. doi:10.1016/j.landusepol.2019.104379
Zhu, H., and Li, X. (2003). Discussion on the index method of regional land use change. Acta Geogr. Sin. 05, 643–650.
Zhu, H., Ou, X., Yang, Z., Yang, Y., Ren, H., and Tang, L. (2022). Spatiotemporal dynamics and driving forces of land urbanization in the Yangtze River Delta urban agglomeration. Land 11, 1365. doi:10.3390/land11081365
Keywords: LUCC, cold-hotspots, geo-detector, driving mechanisms, the lower reaches of the Yangtze River
Citation: Shang S, Cui T, Wang Y, Gao Q and Liu Y (2024) Dynamic variation and driving mechanisms of land use change from 1980 to 2020 in the lower reaches of the Yangtze River, China. Front. Environ. Sci. 11:1335624. doi: 10.3389/fenvs.2023.1335624
Received: 09 November 2023; Accepted: 11 December 2023;
Published: 04 January 2024.
Edited by:
Salvador García-Ayllón Veintimilla, Polytechnic University of Cartagena, SpainReviewed by:
Wei Liu, Shandong Normal University, ChinaChong Jiang, Guangdong Academy of Science (CAS), China
Wanxu Chen, China University of Geosciences Wuhan, China
Copyright © 2024 Shang, Cui, Wang, Gao and Liu. This is an open-access article distributed under the terms of the Creative Commons Attribution License (CC BY). The use, distribution or reproduction in other forums is permitted, provided the original author(s) and the copyright owner(s) are credited and that the original publication in this journal is cited, in accordance with accepted academic practice. No use, distribution or reproduction is permitted which does not comply with these terms.
*Correspondence: Tingting Cui, dHRjdWlAbmhyaS5jbg==
 Shouwei Shang
 Tingting Cui1*