
95% of researchers rate our articles as excellent or good
Learn more about the work of our research integrity team to safeguard the quality of each article we publish.
Find out more
ORIGINAL RESEARCH article
Front. Environ. Sci. , 06 July 2023
Sec. Environmental Informatics and Remote Sensing
Volume 11 - 2023 | https://doi.org/10.3389/fenvs.2023.1178540
This article is part of the Research Topic Geophysical, Climatological and Anthropogenic Hazards and Disaster: Vulnerability, Risk Assessment, and Sustainability View all 11 articles
 Zahid Ur Rahman1,2
 Waheed Ullah3*
 Shibiao Bai4*
 Safi Ullah5,6
 Mushtaq Ahmad Jan7Mohsin Khan8
 Muhammad Tayyab9
Frequent flooding can greatly jeopardize local people’s lives, properties, agriculture, economy, etc. The Swat River Basin (SRB), in the eastern Hindukush region of Pakistan, is a major flood-prone basin with a long history of devastating floods and substantial socioeconomic and physical damages. Here we produced a flood susceptibility map of the SRB, using the frequency ratio (FR) bivariate statistical model. A database was created that comprised flood inventory as a dependent variable and causative factors of the flood (slope, elevation, curvature, drainage density, topographic wetness index, stream power index, land use land cover, normalized difference vegetation index, and rainfall) as independent variables and the association between them were quantified. Data were collected using remote sensing sources, field surveys, and available literature, and all the studied variables were resampled to 30 m resolution and spatially distributed. The results show that about 26% of areas are very high and highly susceptible to flooding, 19% are moderate, whereas 55% are low and very low susceptible to flood in the SRB. Overall, the southern areas of the SRB were highly susceptible compared to their northern counterparts, while slope, elevation, and curvature were vital factors in flood susceptibility. Our model’s success and prediction rates were 91.6% and 90.3%, respectively, based on the ROC (receiver operating characteristic) curve. The findings of this study will lead to better management and control of flood risk in the SRB region. The study’s findings can assist the decision-makers to make appropriate sustainable management strategies for the mitigation of future damage in the study region.
Floods are considered the major natural disasters globally, posing significant threats to human lives, livelihoods, properties as well as socio-cultural heritage (Billa et al., 2006; Samanta S. et al., 2018b; Rentschler et al., 2022; Shen et al., 2022; Liu et al., 2023). The number of major flood disasters in the last three decades was more pronounced indicating climate change (Sarkar and Mondal, 2020; Tariq et al., 2023). Flooding causes more than 2,000 deaths annually and affects over 75 million people worldwide in different ways (Zou et al., 2013; Rentschler et al., 2022; Abbas et al., 2023).
Pakistan is among the worst climate change-affected countries, experiencing extreme hydrometeorological events (Bhatti et al., 2020; Abbas et al., 2022; Baqa et al., 2022). The recent catastrophic flooding events are the eye-witness of climate change in Pakistan (Khan I. et al., 2022a; Shah et al., 2023). The country has witnessed approximately 25 devastating floods between 1950 and 2020 that killed more than 9,088 people with a total estimated loss of 20 billion USD (Khan et al., 2021; Ahmed et al., 2023). Pakistan was struck by one of the most devastating floods in its history in 2010 due to brutal monsoon precipitation that caused substantial damages across the country (Gaurav et al., 2011; Khan et al., 2016; Farooq et al., 2019), affecting around 20 million people in 78 districts, and killed 1,985 people causing an estimated 9.7 billion USD loss to Pakistan’s economy (F. Ullah et al., 2021; Ahmed et al., 2023).
In 2012, heavy monsoon rains triggered floods in major parts of the country, including the Khyber Pakhtunkhwa, Upper Sindh, Southern Punjab, and Balochistan provinces (Saeed et al., 2021; Shah et al., 2023). Following these devastating flooding events, the country was struck by catastrophic flash flooding in August 2013 (Butt et al., 2020). In the recent monsoon floods of 28 August 2022, Pakistan suffered 1,033 deaths, 949,858 people were affected, over 450,000 residential structures were damaged, 149 bridges were destroyed, and 110 districts were affected (Crisis24, 2022; NDMA, 2022; PMD, 2022; ReliefWeb, 2022). Overall, Pakistan faced about 6 major floods in the last 12 years, i.e., 2010, 2011, 2012, 2013, 2020, and 2022, highlighting Pakistan’s vulnerability to climate extremes (Ahmed et al., 2023; Majeed et al., 2023).
Although flooding is inevitable and hard to avoid, appropriate analysis and susceptibility mapping techniques can assess and manage future floods (Hussain et al., 2021; Henao and Nájera, 2022). Depending upon the flood’s nature, different information and techniques are required for its assessment and management. These include information from hydrological, meteorological, geo-morphological, and socioeconomic sectors. Consequently, flood susceptibility maps are drawn that greatly assist in flood mitigation and planning by providing regional planners and decision-makers with a better understanding of flood attributes thus, ensuring a sustainable and safe future (Youssef et al., 2016; Mahmood and Rahman, 2019; Hussain et al., 2021). Identifying flood-prone locations and mapping the flood hazard areas is key to its management and/or timely prevention (Hussain et al., 2023b). Alternatively, selecting areas that have less exposure to flooding may be an indication of ideal regions for residency and operation development (Hizbaron et al., 2021).
A plethora of research has been done, which indicates that accurate flood risk assessment and modeling can help decision-makers in the development of sustainable risk reduction strategies (Arnell and Gosling, 2016; Dawood et al., 2021; Malik et al., 2021) and used both qualitative and quantitative techniques for flood susceptibility assessment and mapping. Likewise, Saeed et al. (2021) used Artificial Neural Network (ANN) algorithm to effectively determine flood-inundated areas in Peshawar Vale with nine geospatial flood causative factors. A study conducted by Khoirunisa et al. (2021) used a GIS-based artificial neural network (GANN) model based on a Back-Propagation Neural Network (BPNN) to provide flood susceptibility; the proposed method provided good accuracy in predicting flood susceptibility of Keelung City, Taiwan. To model and simulate flood-prone regions of the Johor River Basin, Malaysia, Kia et al. (2012) also attempted to construct a flood model considering seven flood causative factors utilizing ANN approaches and geographic information systems (GIS). Similarly, Ahmadlou et al. (2019) utilized an adaptive neuro-fuzzy interface system (ANFIS) for flood susceptibility assessment in contrast with biogeography-based optimization (BBO) and BAT algorithms. McGrath and Gohl, (2022) also stressed the impact of meteorological variables on flood vulnerability mapping using machine learning approaches. Moreover; Liu et al. (2021) proposed a hybrid model by integrating fuzzy membership value (FMV) and three machine learning models of convolutional neural network (CNN), classification and regression trees (CART), and support vector machine (SVM) for flood assessment. In another study, Ha et al. (2022) combined machine learning (ML) and analytical hierarchy process (AHP) techniques to analyze and map flood hazards, vulnerabilities, and risks in Quang Binh province, Vietnam. Recently, Liu et al. (2023) utilized a hybrid approach, combining ResNet-18 and a hydrological model based on remote sensing data, to create a map of global flood susceptibility; Majeed et al. (2023) applied an integrated algorithm, combining the AHP technique and frequency ratio (FR) model to predict susceptibility to flash floods. The AHP, relative frequency ratio (RFR), ANFIS, fuzzy variable theory, logistic regression, ANN, Shannon’s entropy, and others are notable among them. Irrespective of their inherent pros and cons, the performance of each technique is dependent on the selected variables as well as the case study (Tehrany et al., 2014; Hong et al., 2018; Kadam et al., 2018; Ahmed et al., 2023). In addition, advanced GIS and remote sensing (RS) techniques are prominently used for flood hazard calculation and risk analysis modeling (Ali et al., 2016; Khoirunisa et al., 2021; Tayyab et al., 2021).
GIS and RS are emerging tools that provide various types of advanced data access and manipulation tools for flood susceptibility mapping and its forecast with proper justification (Vojtek and Vojteková, 2019; Rehman et al., 2022). Both GIS and RS images can assist in assessing flood regions and are effective tools for creating land use/land cover (LULC) maps and detecting their changes (Feloni et al., 2020). This technology makes an incredibly wonderful environment in which various models can run and modify data to assess the impacts of flooding with coherent and logical outcomes (Khosravi et al., 2016a). Moreover, these techniques provide an authentic and simple way to prepare flood susceptibility maps using the FR model (Sarkar and Mondal, 2020; Islam et al., 2022). The FR model is a profoundly satisfactory method for highly precise hazard evaluation (Althuwaynee et al., 2014; Ullah and Zhang, 2020; Majeed et al., 2023). Rehman et al. (2022) and Shu et al. (2021) define FR as the probability of occurrence of a phenomenon concerning the absence of a phenomenon. The FR model is a bivariate statistical model that gives weightage to every factor class of each variable and assesses its effects on flood occurrence (Jebur et al., 2014; Ullah and Zhang, 2020; Shah et al., 2023). It is a foremost well-known bivariate statistical approach to determine the flood hazard zones (Ullah and Zhang, 2020; Rehman et al., 2022) and potential landslide zones (Wang et al., 2020; Islam et al., 2022) based on the relationship between their inventory (dependent) and causative factors (independent). As a simple and widespread bivariate statistical method, the FR model is commonly used in many research fields, including geosciences, hazards and disaster management, physical sciences, environmental sciences, etc., (Althuwaynee et al., 2014; Arabameri et al., 2019; Rehman et al., 2022; Majeed et al., 2023). Therefore, it is imperative to assess the degree of vulnerability to flood hazards and develop a flood susceptibility map to reduce the potential risks of floods in the future. It is worth mentioning that flood susceptibility maps are also useful for policymakers and planners to formulate flood risk management plans (Kia et al., 2012; Esteves, 2013; Haghizadeh et al., 2017).
Swat River Basin (SRB) is experiencing frequent and intense floods due to climatic variations and diverse topography. Over the past few decades, this region has witnessed several catastrophic flooding events, including the historic 2010 and 2022 floods (Figure 1). However, it is worth stating that a very limited number of studies on flood susceptibility assessment and/or flood management have been conducted in the SRB. Considering the SRB’s vulnerability and exposure to flood hazards, there is an urgent need for flood susceptibility mapping using advanced techniques and models. Here we aimed to construct the first-ever flood susceptibility mapping of the SRB, in the eastern Hindu Kush region of Pakistan through a GIS-based FR model. Moreover, the study determined the relative contributions of the selected flood-causing factors in exacerbating the susceptibility of the region to flooding. The study also evaluated the efficiency of the FR bivariate statistical model in mapping the flood susceptibility of the SRB. We believe that our study could provide valuable information to the relevant stakeholders for effective flood risk management and sustainable development.
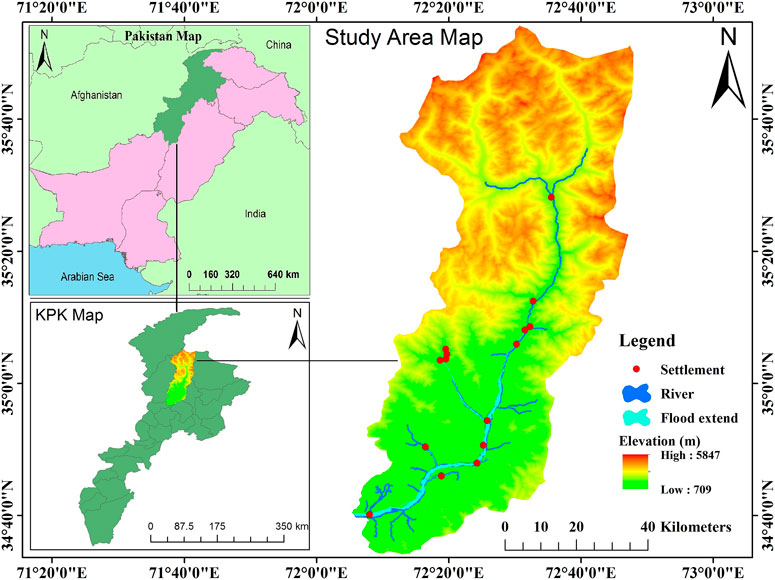
FIGURE 1. Location map of the Swat River Basin (SRB) with elevation.
An integrated approach is adopted to construct a flood susceptibility map for the SRB, eastern Hindu Kush region, Pakistan. The flood susceptibility map was developed by integrating remote sensing and field data on flood causal factors. The overall methodology consists of seven main steps (Figure 2). These include; 1) study area, 2) data collection and analysis, 3) flood inventory map, 4) flood-causing factors, 5) frequency ratio (FR) model, 6) flood susceptibility mapping, and 7) receiver operating characteristic (ROC) technique. All these steps are discussed in detail in the following sections.
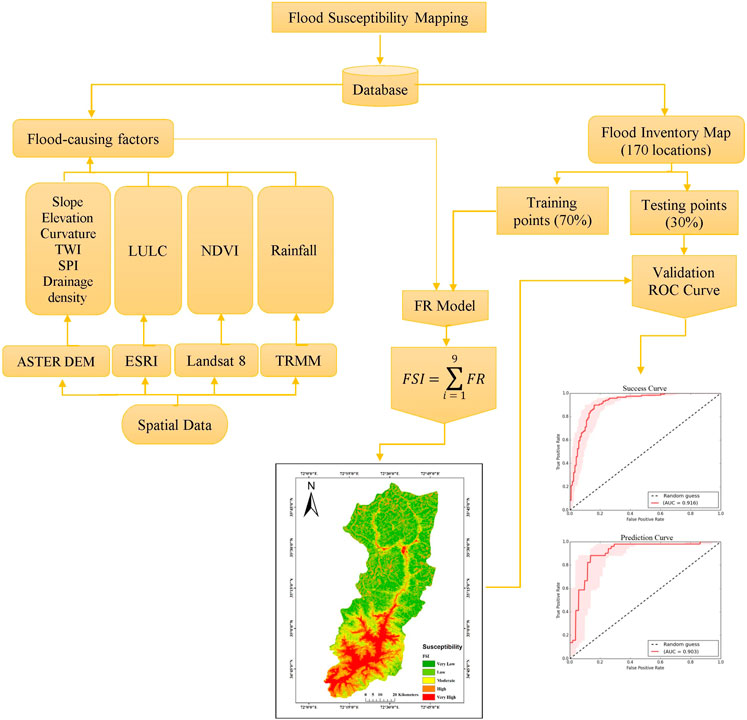
FIGURE 2. Flow chart showing steps adopted for the construction of flood susceptibility map in the SRB.
This study covers the SRB, located in the eastern Hindu Kush region of Pakistan, with geographical coordinates of 34° 35′60″and 35° 43′52″north latitudes and 72° 08′53″and 72° 30′50″east longitudes (Khan W. et al., 2022; Islam et al., 2022). The region covers a total area of 5,065.28 km2 (Nasir et al., 2020; Islam et al., 2022). Across the basin, the northern parts contain high snow-covered mountains featuring rough territory, while the southern parts are rather plain having farmland along the riverbank. The precipitation pattern in the high-altitude northern region is influenced by winter precipitation received from the Mediterranean Sea mainly in the form of snow (Ullah et al., 2018; Rebi et al., 2023), whereas, the lower southern region is dominated by summer monsoon rainfall (Khan et al., 2020; W; Ullah et al., 2021). Extremely low winter temperatures facilitate snow and glacier accumulation while the melting of snow and glaciers is triggered by high summer temperatures (Hussain et al., 2023a; Rahman et al., 2019; S; Ullah et al., 2019a; b, 2023).
River Swat originates from the Hindu Kush Mountains and generally flows from the northern high-elevated areas to the southern plains (Ahmad et al., 2018; Farooq et al., 2019; Dawood et al., 2021; Islam et al., 2022). At Kalam, the river Ushu and river Gabral converge into river Swat, which flows down through the entire Swat District, joining River Panjkora in District Dir Lower, and finally outflows into the River Kabul at Nisatta, District Charsadda. Geomorphologically, the river channel is steep in the northern area and gentle in the southern part. Due to the physical terrain, flash floods dominate the upstream areas, and river floods in the gently sloping low-lying areas of the basin (Mahmood and Rahman, 2019; Rahman et al., 2019; Nasir et al., 2020) such as (Figure 1).
The approximate altitude of the basin in the northern area is 5800 m which gradually decreases up to 710 m downstream at Shamozai valley. Swat River is a natural living space for fish and birds and a wellspring of irrigation and electric power generation. Currently, three hydroelectric power plants with a total 123 MW capacity are operational on water from the river Swat and one more hydroelectric power plant with a capacity of 740 MW of electricity is under construction (Dawood et al., 2021). The region experiences disastrous floods almost yearly, especially in the monsoon season between June and September. Climate change, complex topography, and socioeconomic vulnerability in the region intensify the risk of flooding in the study area (Rahman et al., 2019; Dawood et al., 2021).
SRB is one of the major flood-prone basins in Pakistan (Ahmad et al., 2015; Nasir et al., 2020). The diverse climatic conditions, complex topography, and fragile socioeconomic conditions have exacerbated the risk of flooding in the region (Mahmood and Rahman, 2019). The region has a long history of devastating floods, which caused substantial socioeconomic and physical damages (Khan et al., 2021). In 2010, the monsoon system caused heavy rainfalls, leading to disastrous floods in various tributaries of the Swat, ultimately destroying whatever stood in its path (Butt et al., 2020; Hussain et al., 2021). The deadly water surge started in the mountainous region, while the peculiar terrain of the valley gave this surge an enormous force that destroyed infrastructure, human settlements, buildings, cropped lands, irrigation networks highways, and bridges, and made communication inaccessible (Tehrany et al., 2014; Farooq et al., 2019). It has been reported that in the 2010 floods, a total of 2,751 families were displaced, 988 houses and 26 water channels were completely or partially damaged in the region (Butt et al., 2020). Similarly, on 29 August 2020, a heavy rainfall-induced flash flood in the Shagram torrent of the SRB, resulted in the deaths of at least 14 people coupled with complete or partial damages to 45 houses, and over 3 bridges (Nasir et al., 2020). Despite the frequent and intense occurrence of flooding in the SRB, no suitable measures have been taken in the region so far to hinder or reduce the losses from flood hazards.
To develop a flood susceptibility map of the SRB, various types of data were collected from several government agencies and official web sources, as outlined in Table 1. Literature and historical flood data were collected from the National Disaster Management Authority (NDMA), Pakistan, Provincial Disaster Management Authority (PDMA), Khyber Pakhtunkhwa, and Regional Irrigation Department Swat. The Advanced Spaceborne Thermal Emission and Reflection Radiometer Digital Elevation Model (ASTER DEM) with a 30 m spatial resolution was obtained from the official website of the National Aeronautics and Space Administration (NASA) (www.search.earthdata.nasa.gov.us). Land use/land cover (LULC) imagery was downloaded from the Environmental Systems Research Institute (ESRI) 2020 LULC data. Landsat 8 (OLI) imagery was obtained from the official website of the United States Geological Survey (USGS) (https://earthexplorer.usgs.gov), and the average annual rainfall of the case study was obtained using the Tropical Rainfall Measuring Mission (TRMM) data, which were retrieved from the NASA official website (https://gpm.nasa.gov/data) (S. Ullah et al., 2018; W; Ullah et al., 2019; Arshad et al., 2021). The amalgamation and analysis of these multiple data sources facilitated the creation of the flood susceptibility map of the SRB.
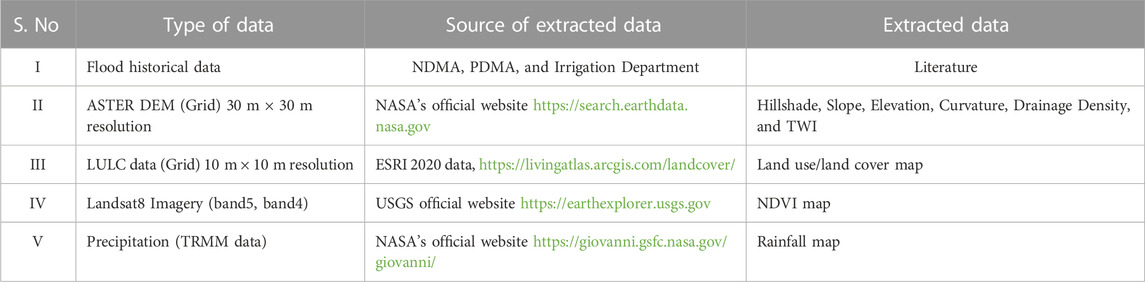
TABLE 1. Types of data and their sources.
To study the correlation between flood-causing factors and flood occurrence, a database of historical floods and their damages is very important (Kia et al., 2012; Liu et al., 2021). Appropriate data with high accuracy are vital to constructing the flood inventory mapping (Tehrany et al., 2015; Ullah and Zhang, 2020). In the current study, a flood inventory map was prepared with a total of 170 flood-affected locations identified in the whole SRB through a field survey using handheld GPS and satellite imagery. The points of inundation were validated with historical flood data and previous reports of NDMA Pakistan, PDMA Khyber Pakhtunkhwa, and Regional Irrigation Department Swat, Pakistan. The flood-affected locations were divided into 51 (30%) testing points and 119 (70%) training points using the geo-statistical tool in ArcGIS 10.2.2 (Figure 3). The training points were randomly used for the development of the model whereas; the efficiency of the model was validated with the testing points.
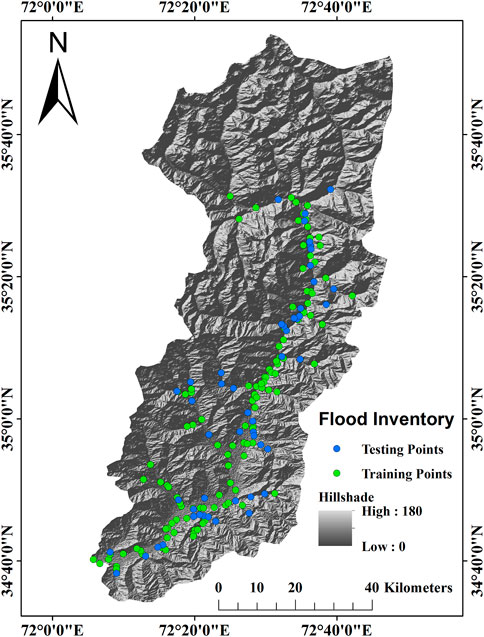
FIGURE 3. Flood inventory map, showing the training and testing points in the SRB.
To build a comprehensive strategy for assessing flood susceptibility, it is critical to determine the impact and linkage between flood-causing factors and flood occurrence (Wang et al., 2018; El-Magd, 2019; Khoirunisa et al., 2021; Ha et al., 2022). It should be noted that various natural and anthropogenic factors, which cause floods in a specific region and the same factors may not be effective for another region. Therefore, to get reliable results, the selection of relevant factors is extremely important (Tehrany et al., 2015; Zhao et al., 2022). A total of nine flood-causing factors were selected due to their critical roles in causing flooding in the study region (Ullah and Zhang, 2020; Saeed et al., 2021). These factors include; slope, elevation, curvature, drainage density, topographic wetness index (TWI), stream power index (SPI), LULC, normalized difference vegetation index (NDVI), and rainfall. These selected factors have been used by various studies to assess the relationship between flood-causing factors and flood occurrence in the study area and other regions (Samanta S. et al., 2018; Sarkar and Mondal, 2020; Thongley and Vansarochana, 2021). All flood-causing variables were changed into raster maps and resampled with 30 m × 30 m resolution (pixel) (Jensen, 2005; Sabatakakis et al., 2013). The selected factors were reclassified for FR analysis using the popular natural breaks (Jenks) method by reclassifying (spatial analyst) tools in ArcGIS 10.2 (Ullah and Zhang, 2020; Majeed et al., 2023). The selected flood-causing factors are discussed one by one below.
The slope is one of the most important factors in hydrological studies because it controls surface runoff and water flow intensity that incites soil erosion and vertical infiltration process (Tehrany et al., 2015; Khosravi et al., 2016b). The area with a higher slope gradient has low exposure to flooding while the area with a low slope gradient is highly exposed to flooding (Liuzzo et al., 2019). We derived a slope map from the ASTER DEM of 30 m resolution utilizing the slope tool in ArcGIS and categorized it into five sub-classes ranging from 0o–75.74o (Figure 4A).
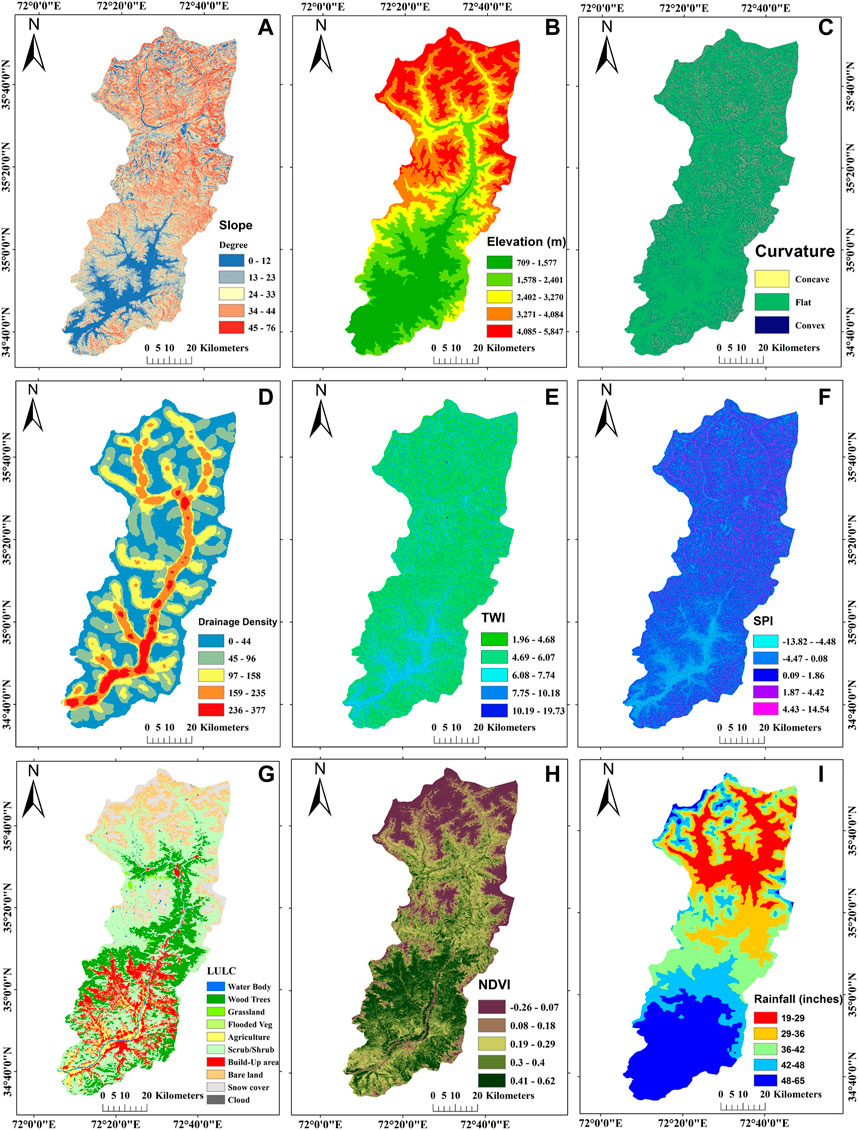
FIGURE 4. Spatial distributions of the flood-causing factors in the SRB; (A) Slope, (B) Elevation, (C) Curvature, (D) Drainage density, (E) TWI, (F) SPI, (G) LULC, (H) NDVI, and (I) Rainfall.
The elevation is a prime factor in flood vulnerability assessment (Rahmati et al., 2016; Das, 2019; Shen et al., 2021). Usually, water flow is from high-altitude areas towards low-altitude areas, so low-lying areas may get flooded rapidly. The probability of flooding is higher in low-elevated areas as compared to the areas of high elevation (Das, 2018; Liuzzo et al., 2019; Elkhrachy, 2022). The elevation map of the SRB was prepared from the ASTER DEM using spatial analyst tools in the ArcGIS environment and split into five categories. As shown in Figure 4B, the altitude of the study area ranges from 709 to 5,847 m above mean sea level.
Curvature is another extremely necessary factor for flood mapping. Curvature is the rate at which gradients change in a specific direction, and the values indicate the morphological feature of topography (Wang et al., 2015; M Amen et al., 2023). The curvature map of the SRB was prepared from the ASTER DEM and divided into three classes; concave, flat, and convex (Figure 4C). A negative value is allocated to upward concave curvature, a zero value is allocated to the flat surface whereas, a positive value indicates a convex curvature (Charlton et al., 2006; Ullah and Zhang, 2020). Areas of zero values (flat surface) are most exposed to flooding as compared to the convex and concave curvature (Nachappa et al., 2020).
Drainage density is characterized as the entire length of the waterways and streams in a river basin divided by the whole area of the basin (Rahmati et al., 2016). Areas of higher drainage density have greater chances of flooding whereas; areas of lower drainage density have fewer chances of flooding (Paul et al., 2019). Drainage density measures how well and how poorly the basin is drained by streams. To calculate the drainage density of the SRB, the stream order was taken from the ASTER DEM through the line density tool in the ArcGIS environment and classified into five classes utilizing the natural break (Jenks) tool (Figure 4D). The following equation (Eq. (1)) was used to calculate the drainage of the SRB.
Where drainage density is denoted by Dd, the length of waterways is signified by L, and the total area of the basin is signified with symbol A.
The topographic wetness index (TWI) is another important factor for flood susceptibility mapping. TWI has a direct relationship with flood vulnerability (Chapi et al., 2017; Costache, 2019). The region with high TWI is more vulnerable to flooding whereas, the region with low TWI is less vulnerable to flooding (Paul et al., 2019). The TWI was calculated from the ASTER DEM with the following formula (Eq. 2).
Where the upstream contributing area is denoted by AS and the gradient of the slope is denoted by β. The final TWI map was divided into five classes ranging from 1.96 to 19.73 (Figure 4E).
The stream power index (SPI) refers to an estimate of the erosional power of water flows in a catchment area (Jebur et al., 2014; Wang et al., 2023). A greater distance to the stream and a lower SPI increases the chances of flood occurrence (Tehrany et al., 2014; Wang et al., 2023). The SPI map was constructed with the given equation (Eq. 3).
Similar to TWI, the upstream drainage area is denoted by AS, and the slope gradient (in degrees) is denoted with β. The SPI map of the case study was prepared in the ArcGIS environment and split into five classes ranging from −13.82 to 14.54 (Figure 4F).
Land use/land cover (LULC) is vital in producing water runoff and causing floods in a catchment area (Khosravi et al., 2016b; Das, 2019; Riazi et al., 2023). The strong nexus between LULC and flooding is unquestionable since land use and land cover have their influence on increasing or reducing the flow of water (Samanta S. et al., 2018; Hussain et al., 2021). The LULC data were collected from the ESRI 2020 data source of global land use and land cover published in July 2021 (Areu-Rangel et al., 2019; Karra et al., 2021; Tariq and Mumtaz, 2022). The LULC data were classified into ten classes, namely, water bodies, wood trees, grassland, flooded vegetation, agriculture, scrub/shrub, built-up area, barren land, snow cover, and clouds (Figure 4G).
Normalized difference vegetation index (NDVI) is another main ecological flood-causing factor. The normal value of the NDVI is ranging from −1 to +1 (Khosravi et al., 2016b; Riazi et al., 2023). The positive NDVI value is considered active vegetation coverage like dense forest, the value close to zero represents barren areas, while the negative values are referred to the water body (Wang et al., 2020; Ziwei et al., 2023). For the preparation of the NDVI map, satellite data were collected from the Landsat 8 collection 1, of the USGS department, and the value was calculated with the following formula (Eq. 4).
Where the NIR represents near-infrared light and the Red is the visible light. The NDVI map of the SRB was categorized into five sub-categories ranging from −0.26 to 0.62 using the natural break tool (Figure 4H).
`Heavy rainfall is a common flood-triggering factor. According to Liuzzo et al. (2019) and Paul et al. (2019), rainfall has a direct relationship with flood hazards. For rainfall map preparation, the TRMM data were downloaded for the period 2000–2020 (Arshad et al., 2021; W; Ullah et al., 2021). The rainfall map of the SRB was classified into five sub-classes (Figure 4I). Since the TRMM data have performed well over different climatic regions of Pakistan, including the study region (Arshad et al., 2021); therefore, we preferred the use of this dataset over other gridded precipitation products.
Flood susceptibility mapping is the foremost important method to identify the high-risk zone and the factors-affecting floods in a river basin. Flood is triggered by natural and socioeconomic factors and it is usual to assume that future floods will be caused by the same causative factors as the previous floods (Tehrany et al., 2013; Kadam et al., 2018; Moazzam et al., 2018). The FR model is a quantitative bivariate statistical analysis technique commonly used for flood and landslide susceptibility mapping (Tehrany et al., 2015; Islam et al., 2022). The FR model shows the spatial relationship between flood inventory (dependent factors) and flood-causing factors (independent factors). In the current study, the FR bivariate statistical model was used to prepare the flood susceptibility map of the SRB. The FR value of each factor was calculated by determining the quantitative relationship of independent factors with respect to flood occurrence (Pradhan and Lee, 2010; Khosravi et al., 2016a; Ahmadlou et al., 2019). When the FR weightage is more than 1, it indicates a strong correlation whereas, when the weightage is below 1, it shows a weak correlation between dependent and independent factors (Pradhan and Lee, 2010; Akgun et al., 2012; Rehman et al., 2022). The FR is characterized as the percent of the flood locations within the factor class divided by the percentage of individual class areas. The FR model was calculated with the following Eq. 5.
Where FP is the flood point in factor class, P is the total flood Points, FA is the factor class area, and A is the total area.
After that, the RF was calculated to normalize the FR in probability ranges (0, 1) using the following Eq. 6.
After the calculation of RF, the prediction rate (PR) was also calculated to find the interrelationship between flood-causing factors and the training data set using the given Eq. 7.
The flood susceptibility map of the SRB was developed by calculating and classifying the flood susceptibility index (FSI). The FSI indicates the degree of susceptibility of the area to flood occurrences. Areas with greater FSI indicate high susceptibility to flooding occurrence and vice versa. The FSI was calculated based on the RF values and PR values, which were determined in the above Eqs 6, 7, respectively. The calculation of FSI is shown in Eq. 8.
In the above equation, 9 indicates flood-causing factors (slope, elevation, curvature, drainage density, TWI, SPI, LULC, NDVI, and rainfall). The final flood susceptibility map was categorized into five categories: very high, high, moderate, low, and very low (Figure 5).
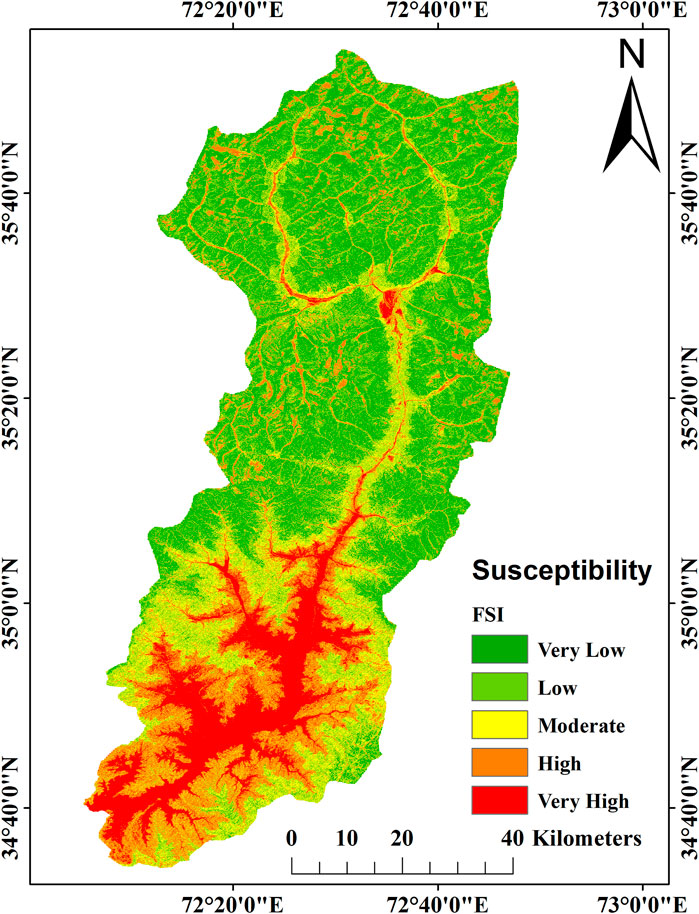
FIGURE 5. Flood susceptibility map, showing susceptible areas in the SRB.
The performance and efficiency of the flood susceptibility map were validated with the ROC technique. The ROC curve is one of the most effective techniques used for susceptibility map validation (Chung and Fabbri, 2003; Tehrany et al., 2013; Liuzzo et al., 2019). The ROC curve was developed with the ArcSDM tool in ArcGIS 10.2. The training points were used to check the success rate whereas, the testing points were used for the prediction rate of the flood (Zhao et al., 2019; Tayyab et al., 2021). The area under the curve (AUC) for the success and the prediction rates were 0.916 and 0.903, respectively, which are significant and greatly acceptable in hydrometeorological studies (Sharif et al., 2016; Wang et al., 2023).
We developed a flood susceptibility map of the SRB by employing FR bivariate statistical model. As shown in Table 2, the relationship between flood-causing factors and flood occurrence was assessed using FR values. The slope was classified into five classes: 0°–12°, 13°–23°, 24°–33°, 34°–44°, and 45°–76°. Overall, FR weightage had a negative relationship with slope. For example, the lower slope class (0°–12°) has a greater FR weightage (4.64). In contrast, as the slope increased, the FR weightage decreased gradually until the highest degree slope class (45°–76°) had a zero FR value. This means that locations with a steep slope are less likely to flood, and vice versa. In terms of slope spatial pattern, the northern part of the SRB has a higher slope than the southern part (Figure 4A). In a nutshell, the northern areas of the SRB are less prone to flooding than the southern parts.
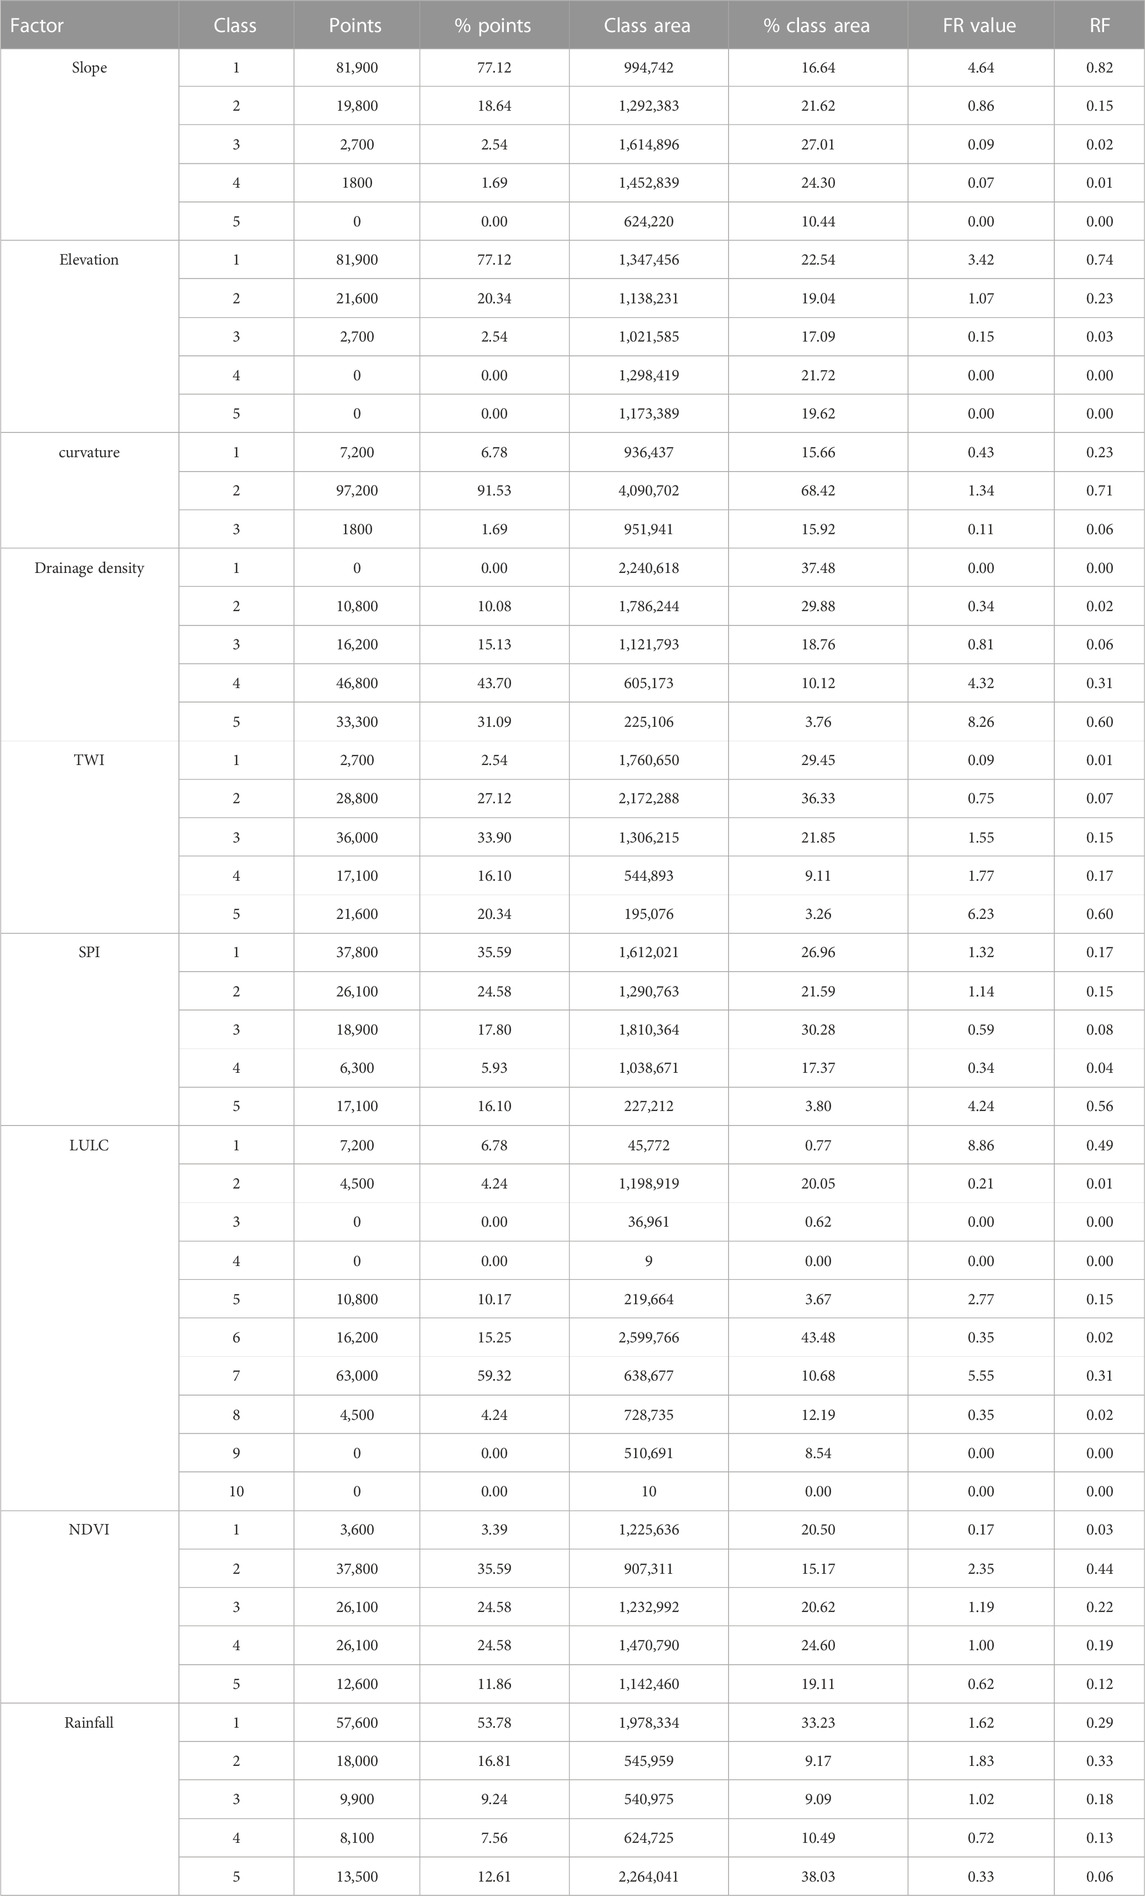
TABLE 2. Details of the flood-causing factors and their FR values.
Furthermore, when the elevation of the area increased, the FR value declined steadily, resulting in a negative relationship between the two variables. The first two classes of lowest elevated places (709–1,577 m and 1,578–2,401 m) have greater FR values (3.42 and 1.07) than the next three higher elevation classes, according to Table 2. Recent studies show that areas with the highest elevations are less prone to flooding than those with lower elevations (Yu et al., 2022; Majeed et al., 2023; Wang et al., 2023). The regional elevation pattern of the SRB (Figure 4B) verifies the findings that the high-altitude areas are less susceptible to flooding. In addition, the curvature map has been divided into three categories: concave, flat, and convex. Concave, flat, and convex surfaces had FR values of 0.43, 1.34, and 0.11, respectively. Floods are more likely to occur in flat areas than in concave or convex areas, as shown by the FR values and consistent with the curvature map (Figure 4C).
We further analyzed our data based on drainage density values and have classified SRB into five major categories (i.e., 0–44, 45–96, 97–158, 159–235, and 236–377). Our analysis indicated a positive correlation between drainage density and FR values. As an example, the highest FR value was assigned to class 5 (8.26) followed by class 4 (4.32), class 3 (0.81), class 2 (0.34), and class 1 (0.00). These results can be confirmed by the spatial distribution of the drainage density in the study area (Figure 4D). On the other hand, data on the TWI were obtained and then divided into five classes for analysis. Class 1 had the lowest FR value (0.09) and class 5 had the highest (6.23), showing that class 5 is very susceptible to flooding and vice versa (Figure 4E). In the case of SPI, the map was divided into five classes: Class 1 (−13.82 to −4.48), class 2 (−4.47 to −0.08), class 3 (0.09–1.86), class 4 (1.87–4.42), and class 5 (4.43–14.54). The highest FR value (4.24) was allocated to class 5, thus indicating a direct relationship between the SPI value and the FR weightage. Interestingly, lower flat areas situated on the southern belt of the SRB have the lowest SPI, whereas the mountainous and steep slope areas situated on the northern side of the SRB have higher SPI (Figure 4F).
Similarly, the data obtained on land use/land cover (LULC) was classified into ten distinct classes: water bodies, wood trees, grassland, flooded vegetation, agriculture, scrub/shrub, build-up area, bare land, snow cover, and cloud (Figure 4E). According to our findings, the highest FR value was assigned to water bodies (8.86), followed by build-up areas (5.55) and agriculture areas (2.77). We further retrieved and analyzed data regarding the normalized difference vegetation index (NDVI) of the SRB. Of the total 5 NDVI classes, excluding the first class, the FR value was positive for the remaining four classes. The highest FR values were allocated to class 2, and class 3 (2.35, and 1.19, respectively). Besides, the rainfall data were divided into five classes, the highest FR values were calculated to be 1.62, 1.83, and 1.02, for classes 1, 2, and 3, respectively (Figure 4I).
Overall, the FSI values in our study revealed a broad range, ranging from 2,896 to 97,44. The map was categorized into five classes based on the natural break technique, namely, very low (2,896 to 16,996), low (16,997 to 27,581), moderate (27,582 to 39,280), high (39,281 to 59,142), and very high (59,143 to 97,440) (Figure 5). Our findings generally indicate that very high and high flood-susceptible areas are those situated in the southern plain areas along the river banks. In contrast, the northern parts of the SRB have a relatively steep slope, high elevation, convex curvature, high SPI and NDVI, vegetation land cover, low drainage density, and TWI with a minimum tendency of rainfall, which can be attributed to their lower susceptibility to flood hazards. Furthermore, our findings indicate that approximately 26% of the study area is characterized as being at a very high or high susceptibility to flooding, 19% as moderate, while the remaining 55% is classified as having low or very low susceptibility to flooding in the SRB. (Figure 6).
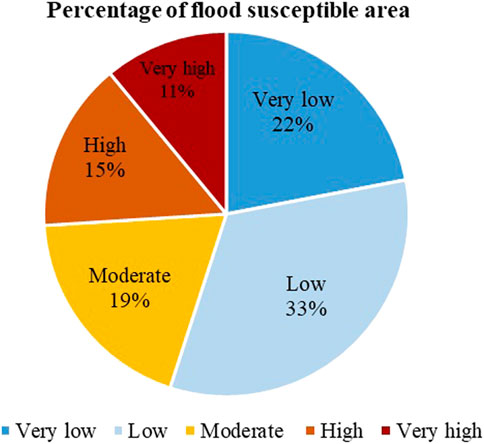
FIGURE 6. Percentage of the flood susceptible area in the SRB.
The validity of the flood susceptibility model was assessed through a rigorous process of comparing the flood inventory data, which represents past flood occurrences, with the newly developed flood susceptibility map. In the validation process, flood testing points (30%) that have not been used for the preparation of the FR model are generally considered as the future flood location. It is noteworthy that the AUC value of the success rate was 91.6% and the prediction rate was 90.3%, respectively (Figure 7). These results demonstrate the effectiveness of the flood susceptibility model in predicting the likelihood of future floods and provide valuable insights for flood risk management and mitigation.
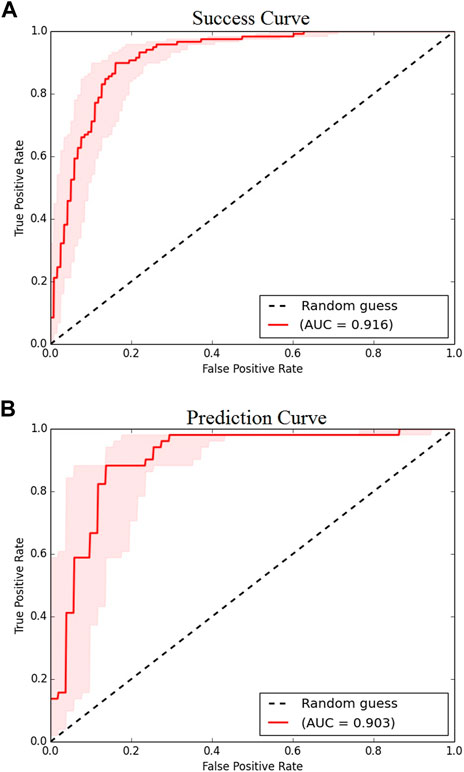
FIGURE 7. ROC curve for validation of flood susceptibility map of the SRB; (A) Success curve and (B) Prediction curve.
Overall, the study provides valuable insights into the factors that contribute to flood susceptibility in the SRB. As shown in Table 3, the slope with the highest PR value (3.01) has emerged as the foremost contributor to flood susceptibility in the study area. Moreover, elevation and curvature have the second and third highest PR values at the rate of 2.71 and 2.41, respectively, suggesting their prominent roles in flood susceptibility. In contrast, rainfall is considered the least flood-contributing factor bearing 1 PR value. The overall results infer that the susceptibility of the SRB in general, and low-lying southern flat areas in particular, are more dependent on the topographic and meteorological conditions in northern mountainous regions. The spatial pattern of flood susceptibility indicates that the areas located in the southern plain along the river banks are highly susceptible to floods.
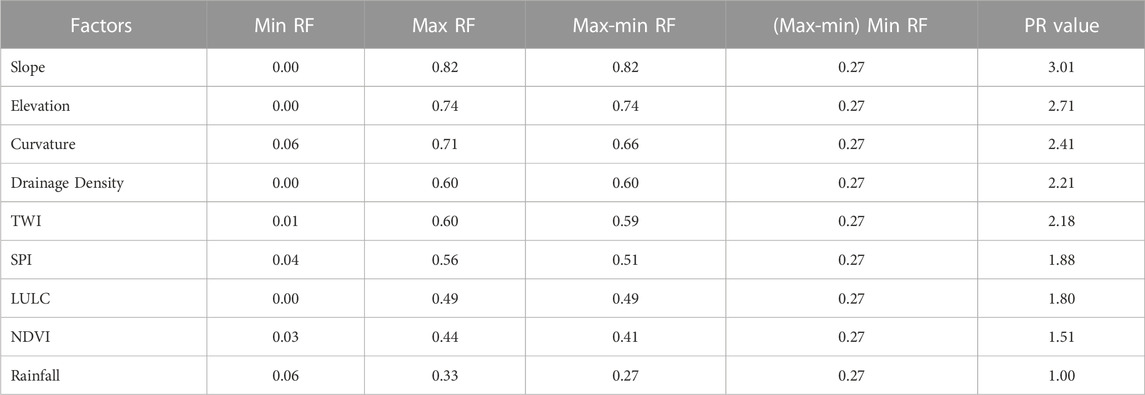
TABLE 3. PR values of flood-causing factors, and their contributions to flood Susceptibility.
In this work, we created a flood susceptibility map of the SRB in the Eastern Hindukush region of Pakistan by applying a GIS-based bivariate statistical model, and further leveraged the correlation between various flood-causing variables and the occurrence of floods in the area. To achieve our desired goals, data were obtained and analyzed on a total of nine independent variables (slope, elevation, curvature, drainage density, TWI, SPI, LULC, NDVI, and rainfall).
Consistent with several previous reports by Sarkar and Mondal, (2020) and Ullah and Zhang, (2020), our analysis showed a negative correlation between slope and flood occurrence, highlighting the fact that low-lying areas in the southern parts of the SRB are highly susceptible to floods. Similarly, elevation was found inversely proportional to flood susceptibility, indicating that elevated areas with steep slopes are relatively less susceptible to flood hazards compared to their counterparts. These findings are largely concordant with similar previous reports (Samanta R. K. et al., 2018; Majeed et al., 2023). Based on our curvature map, we have found that floods are more likely to hit flat areas in contrast to concave or convex areas. For example, we have seen maximum areas in the SRB are flat surfaces, especially the areas nearby the river and tributaries, thus making them highly susceptible to flooding. This is understandable as topography or curvature of the area plays an important role in flood susceptibility. Our analysis together with a set of literature (Khosravi et al., 2016b; Das, 2019; M Amen et al., 2023) has confirmed that flat areas are relatively more susceptible to floods than convex or concave areas. Our results also support earlier studies, reporting about 83% of floods on flat and/or convex surfaces (Ullah and Zhang, 2020; Amen et al., 2023).
Drainage density is an important flood-causing factor and has a direct relationship with flooding as it depends on surface runoff (Tehrany et al., 2015; Kadam et al., 2018). The likelihood of flooding is increasing as the drainage density increases and the likelihood of flood is decreasing with decreasing drainage density (Ullah and Zhang, 2020; Ha et al., 2022). Consistent with these findings and as confirmed by our spatial distribution of the drainage density data, we uncovered a direct relationship between floods and drainage density, substantiating previous reports. TWI represents the soil moisture status of an area and the saturated source of topography. It is a very important factor for the prediction of future floods because there is a direct relationship between TWI and flood occurrence (Sarkar and Mondal, 2020). Our analysis found that TWI was positively associated with floods in the SRB, thus supporting all previous assertions (Khoirunisa et al., 2021). The designated relationship between the SPI value and the FR weightage shows that lower flat areas situated in the southern belt of SRB have low SPI whereas, the mountainous and steep slope areas have high SPI. This is in line with a previous study warranting that flooding is more likely to occur in an area with a lower SPI (Arnell and Gosling, 2016; Wang et al., 2023).
There is a solid relationship between LULC and flood since land use strongly influences decreasing and increasing surface runoff (Ahmad et al., 2018; Ziwei et al., 2023). A LULC pattern determines the type of land use by individuals and natural processes (Ullah et al., 2019b). The area where there is no vegetation covers bear more probability of flooding and soil erosion, and the areas are considered highly vulnerable to floods. Consistently, we have found that areas, such as agricultural land, and built-up areas were highly likely to face flooding. This suggests that rapid urbanization in the southern flat areas is greatly responsible for changes in hydrological processes and disturbing drainage networks, ultimately resulting in flooding (Butt et al., 2020). Likewise, ever-growing croplands along the river banks are highly susceptible to flooding (Youssef et al., 2016).
The NDVI is another key flood-causing factor in the way that lower NDVI weights indicate high flood susceptibility while higher NDVI weights represent a lower risk of flooding (Ullah et al., 2019b; Rehman et al., 2022). Alternatively, the lowest NDVI values represent unhealthy vegetation, mostly occupying the elevated snowcapped northern areas (Shrestha et al., 2020; Ziwei et al., 2023). Based on the NDVI measurements, our analysis revealed that all, except one, classes are highly flood susceptible. Rainfall is undoubtedly the most common cause of floods in any area where sudden and heavy rainfall can exceed the capability of an area and thus lead to floods (Samanta R. K. et al., 2018). Using rainfall data from NASA, we found that southern parts of the SRB were comparatively more susceptible to floods than its northern territories. This is because SRB has semi-arid climatic conditions where the rainfall pattern in lower southern parts is influenced by the summer monsoon, while in upper northern parts, the rainfall pattern is dominated by the winter rainfall, occurring due to the western disturbance of the Mediterranean Sea (Khan et al., 2020; Wang et al., 2020; Hussain et al., 2021; Xu et al., 2022).
Furthermore, we calculated FSI by translating FR and PR values for all variables under our investigation. Overall, the FSI value ranged from 2,896 to 97,440. The resulting flood susceptibility map showed that very high and high flood susceptible areas were mostly situated in the southern plain areas and along the river banks. Thus, people living in the low-lying southern parts and along the river banks are more exposed to both riverine and flash floods. It should be noted that the southern parts of the SRB have lower slope angles, less elevation, flat curvature, lower SPI, and NDVI, improper land use, high drainage density, and TWI with maximum rainfall intensity, which could be the possible reasons for their higher susceptibility to floods. On the other hand, the northern parts of the SRB have a relatively steep slope, high elevation, convex curvature, high SPI and NDVI, vegetation land cover, low drainage density, and TWI with a minimum tendency of rainfall, which can be attributed to their lower susceptibility to flooding hazards. The results further show that about 26% of areas are very high and highly susceptible to flooding, 19% are moderate whereas 55% are low and very low susceptible to flood in the SRB. The AUC value of the prediction rate was 90.3% and that of the success rate was 91.6%, which is highly acceptable and important in hydrometeorological studies (Sharif et al., 2016; Tayyab et al., 2021; Wang et al., 2023).
The prediction rate (PR) of every flood-causing factor was calculated in order to find out the maximum and minimum contribution of an individual factor in exacerbating flood susceptibility in the SRB (Ullah and Zhang, 2020; Wang et al., 2020; Hussain et al., 2021). Collectively, the slope has the highest PR values (3.01), showing that the slope is the prime contributor to exacerbating the susceptibility of the study area to flooding. Moreover, elevation and curvature have the second and third-highest PR values at the rate of 2.71 and 2.41, respectively. This suggests that both elevation and curvature also significantly contributed to flood susceptibility in the SRB. Rainfall, however, emerged as the least flood-contributing factor bearing 1 PR value. This is not surprising as a similar study by (Ullah and Zhang, 2020) identified rainfall as the least contributor to flooding in the Panjkora river basin.
The present work generated a GIS-based flood susceptibility mapping of the SRB using the FR bivariate statistical model. The results indicate that flood susceptibility of the SRB in general, and low-lying southern flat areas in particular, are more dependent on the topographic and meteorological conditions of the northern mountainous regions. The spatial pattern of flood susceptibility shows that highly susceptible areas were primarily located along the river banks and in the southern plain of the SRB. Based on the ROC curve, the efficiency of the model was found to be high with a success rate of 91.6% and a prediction rate of 90.3%. Of the nine independent variables; slope, elevation, and curvature played an intensifying role in increasing flood susceptibility in the SRB. The findings of this study provide useful information for land-use planners, engineers, decision-makers, and relevant authorities to effectively manage flood hazards in the SRB. The findings of this study could be used as leverage for developing flood risk assessment plans, devising mitigation measures, establishing early warning systems, etc., in the study region. Based on the study findings, we recommend the adaptation of a comprehensive approach that integrates multiple flood management and mitigation strategies, including risk assessment, evacuation plans, early warning systems, resilient infrastructures, and construction of dams and levees, to minimize flood risks in the study SRB. Although this study provides a comprehensive and diligent assessment of flood susceptibility in the SRB, future research should use high-resolution satellite imagery and other cutting-edge analytical techniques like ML, CNN, and ANN algorithms to enhance the effectiveness, accuracy, and reliability of the model outputs.
Publicly available datasets were analyzed in this study. This data can be found here: The data that support the findings of this study are openly accessible. The following publicly available sources were used to derive these data. NASA (www.search.earthdata.nasa.gov.us), ESRI 2020 (https://livingatlas.arcgis.com/landcover/), and USGS (https://earthexplorer.usgs.gov). The field data that support the findings of this study are available on request from the corresponding authors.
Conceptualization: ZR and SB; Methodology: ZR, SB, WU, and SU; Formal analysis and investigation: ZR, SB, and MJ; Writing—original draft preparation: ZR; Writing—review and editing: ZR, SB, MK, and MT; Funding acquisition: WU; Resources: SB and ZR; Supervision: SB. All authors contributed to the article and approved the submitted version.
This work was supported by the National Natural Science Foundation of China (Grant Nos 41941017 and 41877522).
The authors acknowledge the National Disaster Management Authority (NDMA), Pakistan, and Provincial Disaster Management Authority (PDMA), Khyber Pakhtunkhwa, Pakistan for providing historical and spatial data on flood damages. The authors acknowledge Rabdan Academy, UAE for supporting Article Processing Charges (APC). The authors are thankful to the National Aeronautics and Space Administration (NASA) for TRMM data, Environmental Systems Research Institute (ESRI) for land use land/cover data, and the United States Geological Survey (USGS) for Landsat 8 images, and DEM.
The authors declare that the research was conducted in the absence of any commercial or financial relationships that could be construed as a potential conflict of interest.
All claims expressed in this article are solely those of the authors and do not necessarily represent those of their affiliated organizations, or those of the publisher, the editors and the reviewers. Any product that may be evaluated in this article, or claim that may be made by its manufacturer, is not guaranteed or endorsed by the publisher.
Abbas, A., Bhatti, A. S., Ullah, S., Ullah, W., Waseem, M., Zhao, C., et al. (2023). Projection of precipitation extremes over south asia from CMIP6 GCMs. J. Arid. Land 15, 274–296. doi:10.1007/s40333-023-0050-3
Abbas, A., Ullah, S., Ullah, W., Waseem, M., Dou, X., Zhao, C., et al. (2022). Evaluation and projection of precipitation in Pakistan using the coupled model intercomparison project phase 6 model simulations. Int. J. Climatol. 42, 6665–6684. doi:10.1002/joc.7602
Ahmad, I., Tang, D., Wang, T., Wang, M., and Wagan, B. (2015). Precipitation trends over time using mann-kendall and spearman’s rho tests in swat River Basin, Pakistan. Adv. Meteorology 2015, 1–15. doi:10.1155/2015/431860
Ahmad, I., Zhang, F., Liu, J., Anjum, M. N., Zaman, M., Tayyab, M., et al. (2018). A linear bi-level multi-objective program for optimal allocation of water resources. PLoS One 13, e0192294. doi:10.1371/journal.pone.0192294
Ahmadlou, M., Karimi, M., Alizadeh, S., Shirzadi, A., Parvinnejhad, D., Shahabi, H., et al. (2019). Flood susceptibility assessment using integration of adaptive network-based fuzzy inference system (ANFIS) and biogeography-based optimization (BBO) and BAT algorithms (BA). Geocarto Int. 34, 1252–1272. doi:10.1080/10106049.2018.1474276
Ahmed, E., Saddique, N., Al Janabi, F., Barfus, K., Asghar, M. R., Sarwar, A., et al. (2023). Flood predictability of one-way and two-way WRF nesting coupled hydrometeorological flow simulations in a transboundary chenab River Basin, Pakistan. Remote Sens. (Basel) 15, 457. doi:10.3390/rs15020457
Akgun, A., Sezer, E. A., Nefeslioglu, H. A., Gokceoglu, C., and Pradhan, B. (2012). An easy-to-use MATLAB program (MamLand) for the assessment of landslide susceptibility using a Mamdani fuzzy algorithm. Comput. Geosci. 38, 23–34. doi:10.1016/j.cageo.2011.04.012
Ali, K., Bajracharya, R. M., and KoiralaLal, H. (2016). A review of flood risk assessment. Int. J. Environ. Agric. Biotechnol. 1, 1065–1077. doi:10.22161/ijeab/1.4.62
Althuwaynee, O. F., Pradhan, B., Park, H.-J., and Lee, J. H. (2014). A novel ensemble bivariate statistical evidential belief function with knowledge-based analytical hierarchy process and multivariate statistical logistic regression for landslide susceptibility mapping. Catena (Amst) 114, 21–36. doi:10.1016/j.catena.2013.10.011
Arabameri, A., Pradhan, B., Rezaei, K., and Lee, C.-W. (2019). Assessment of landslide susceptibility using statistical- and artificial intelligence-based FR–RF integrated model and multiresolution DEMs. Remote Sens. 11 (9), 999.
Areu-Rangel, O., Cea, L., Bonasia, R., and Espinosa-Echavarria, V. (2019). Impact of urban growth and changes in land use on river flood hazard in villahermosa, tabasco (Mexico). Water (Basel) 11, 304. doi:10.3390/w11020304
Arnell, N. W., and Gosling, S. N. (2016). The impacts of climate change on river flood risk at the global scale. Clim. Change 134, 387–401. doi:10.1007/s10584-014-1084-5
Arshad, M., Ma, X., Yin, J., Ullah, W., Ali, G., Ullah, S., et al. (2021). Evaluation of GPM-IMERG and TRMM-3B42 precipitation products over Pakistan. Atmos. Res. 249, 105341. doi:10.1016/j.atmosres.2020.105341
Baqa, M. F., Lu, L., Chen, F., Nawaz-ul-Huda, S., Pan, L., Tariq, A., et al. (2022). Characterizing spatiotemporal variations in the urban thermal environment related to land cover changes in karachi, Pakistan, from 2000 to 2020. Remote Sens. (Basel) 14, 2164. doi:10.3390/rs14092164
Bhatti, A. S., Wang, G., Ullah, W., Ullah, S., Fiifi Tawia Hagan, D., Kwesi Nooni, I., et al. (2020). Trend in extreme precipitation indices based on long term in situ precipitation records over Pakistan. Water (Basel) 12, 797. doi:10.3390/w12030797
Billa, L., Shattri, M., Rodzi Mahmud, A., and Halim Ghazali, A. (2006). Comprehensive planning and the role of SDSS in flood disaster management in Malaysia. Disaster Prev. Manag. Int. J. 15, 233–240. doi:10.1108/09653560610659775
Butt, A. A., Aslam, H. M. U., Shabir, H., Javed, M., Hussain, S., Nadeem, S., et al. (2020). Climatic events and natural disasters of 21st century: A perspective of Pakistan. Int. J. Econ. Environ. Geol. 11, 46–54. doi:10.46660/ijeeg.Vol11.Iss2.2020.445
Chapi, K., Singh, V. P., Shirzadi, A., Shahabi, H., Bui, D. T., Pham, B. T., et al. (2017). A novel hybrid artificial intelligence approach for flood susceptibility assessment. Environ. Model. Softw. 95, 229–245. doi:10.1016/j.envsoft.2017.06.012
Charlton, R., Fealy, R., Moore, S., Sweeney, J., and Murphy, C. (2006). Assessing the impact of climate change on water supply and flood hazard in Ireland using statistical downscaling and hydrological modelling techniques. Clim. Change 74, 475–491. doi:10.1007/s10584-006-0472-x
Chung, C.-J. F., and Fabbri, A. G. (2003). Validation of spatial prediction models for landslide hazard mapping. Nat. Hazards 30, 451–472. doi:10.1023/B:NHAZ.0000007172.62651.2b
Costache, R. (2019). Flash-flood Potential Index mapping using weights of evidence, decision Trees models and their novel hybrid integration. Stoch. Environ. Res. Risk Assess. 33, 1375–1402. doi:10.1007/s00477-019-01689-9
Crisis24 (2022). A Gardaworld Company. Disruptions due to flooding are ongoing across many parts of Pakistan as of Aug 28. Available at: https://crisis24.garda.com/alerts/2022/08/pakistan-disruptions-due-to-flooding-are-ongoing-across-many-parts-of-the-country-as-of-aug-28-update-1#:∼:text=Event,the%20past%2024%2D36%20hours (Accessed October 21, 2022).
Das, S. (2018). Geographic information system and AHP-based flood hazard zonation of Vaitarna basin, Maharashtra, India. Arabian J. Geosciences 11, 576. doi:10.1007/s12517-018-3933-4
Das, S. (2019). Geospatial mapping of flood susceptibility and hydro-geomorphic response to the floods in Ulhas basin, India. Remote Sens. Appl. 14, 60–74. doi:10.1016/j.rsase.2019.02.006
Dawood, M., Rahman, A., Mahmood, S., Rahman, G., and Nazir, S. (2021). Assessing the impact of climatic change on discharge in Swat river basin using fuzzy logic model. Arabian J. Geosciences 14, 1850. doi:10.1007/s12517-021-08219-4
El-Magd, Sh. A. A. (2019). Flash flood hazard mapping using GIS and bivariate statistical method at wadi bada’a, gulf of suez, Egypt. J. Geoscience Environ. Prot. 07, 372–385. doi:10.4236/gep.2019.78025
Elkhrachy, I. (2022). Flash flood water depth estimation using SAR images, digital elevation models, and machine learning algorithms. Remote Sens. (Basel) 14, 440. doi:10.3390/RS14030440
Esteves, L. S. (2013). Consequences to flood management of using different probability distributions to estimate extreme rainfall. J. Environ. Manage 115, 98–105. doi:10.1016/j.jenvman.2012.11.013
Farooq, M., Shafique, M., and Khattak, M. S. (2019). Flood hazard assessment and mapping of River Swat using HEC-RAS 2D model and high-resolution 12-m TanDEM-X DEM (WorldDEM). Nat. Hazards 97:2 97, 477–492. doi:10.1007/S11069-019-03638-9
Gaurav, K., Sinha, R., and Panda, P. K. (2011). The indus flood of 2010 in Pakistan: A perspective analysis using remote sensing data. Nat. Hazards 59, 1815–1826. doi:10.1007/s11069-011-9869-6
Gudiyangada Nachappa, T., Tavakkoli Piralilou, S., Gholamnia, K., Ghorbanzadeh, O., Rahmati, O., and Blaschke, T. (2020). Flood susceptibility mapping with machine learning, multi-criteria decision analysis and ensemble using Dempster Shafer Theory. J. Hydrol. (Amst) 590, 125275. doi:10.1016/j.jhydrol.2020.125275
Ha, H., Bui, Q. D., Nguyen, H. D., Pham, B. T., Lai, T. D., and Luu, C. (2022). A practical approach to flood hazard, vulnerability, and risk assessing and mapping for Quang Binh province. Vietnam: Environment, Development and Sustainability 2021, 1–30. doi:10.1007/S10668-021-02041-4
Haghizadeh, A., Siahkamari, S., Haghiabi, A. H., and Rahmati, O. (2017). Forecasting flood-prone areas using Shannon’s entropy model. J. Earth Syst. Sci. 126, 39. doi:10.1007/s12040-017-0819-x
Henao Salgado, M. J., and Zambrano Nájera, J. (2022). Assessing flood early warning systems for flash floods. Front. Clim. 4. doi:10.3389/fclim.2022.787042
Hizbaron, D. R., Ismayani, N., Ernawan, F. N., Puspitasari, N. N. A., Yulianda, Y., and Jati, R. (2021). Comparative urban capacity analysis for flood-prone areas: Method and a case study of sidoarjo, Indonesia. Environ. Dev. Sustain. 23(9 23), 14027–14045. doi:10.1007/S10668-021-01249-8
Hong, H., Panahi, M., Shirzadi, A., Ma, T., Liu, J., Zhu, A.-X., et al. (2018). Flood susceptibility assessment in Hengfeng area coupling adaptive neuro-fuzzy inference system with genetic algorithm and differential evolution. Sci. Total Environ. 621, 1124–1141. doi:10.1016/j.scitotenv.2017.10.114
Hussain, M., Tayyab, M., Zhang, J., Shah, A. A., Ullah, K., Mehmood, U., et al. (2021). GIS-based multi-criteria approach for flood vulnerability assessment and mapping in district shangla: Khyber Pakhtunkhwa, Pakistan. Sustainability 13, 3126. doi:10.3390/su13063126
Hussain, A., Hussain, I., Ali, S., Ullah, W., Khan, K., Ullah, S., et al. (2023a). Spatiotemporal temperature trends over homogenous climatic regions of Pakistan during 1961–2017. Theor. Appl. Climatol., 1–19. doi:10.3390/su13063126
Hussain, M., Tayyab, M., Ullah, K., Ullah, S., Rahman, Z. U., Zhang, J., et al. (2023b). Development of a new integrated flood resilience model using machine learning with GIS-based multi-criteria decision analysis. Urban Cli. 50, 101589. doi:10.1016/j.uclim.2023.101589
Islam, F., Riaz, S., Ghaffar, B., Tariq, A., Shah, S. U., Nawaz, M., et al. (2022). Landslide susceptibility mapping (LSM) of Swat District, Hindu Kush Himalayan region of Pakistan, using GIS-based bivariate modeling. Front. Environ. Sci. 10. doi:10.3389/fenvs.2022.1027423
Jebur, M. N., Pradhan, B., and Tehrany, M. S. (2014). Optimization of landslide conditioning factors using very high-resolution airborne laser scanning (LiDAR) data at catchment scale. Remote Sens. Environ. 152, 150–165. doi:10.1016/j.rse.2014.05.013
Jensen, J. R. (2005). Introductory digital image processing: A remote sensing perspective. 3rd ed. Prentice-Hall Inc.
Kadam, A., Karnewar, A. S., Umrikar, B., and Sankhua, R. N. (2018). Hydrological response-based watershed prioritization in semiarid, basaltic region of Western India using frequency ratio, fuzzy logic and AHP method. Environ. Dev. Sustain. 21, 1809–1833. doi:10.1007/S10668-018-0104-4
Karra, K., Kontgis, C., Statman-Weil, Z., Mazzariello, J. C., Mathis, M., and Brumby, S. P. (2021). “Global land use/land cover with Sentinel 2 and deep learning,” in 2021 IEEE international geoscience and remote sensing symposium IGARSS (IEEE), 4704–4707. doi:10.1109/IGARSS47720.2021.9553499
Khan, A. N., Khan, S. N., Ullah, S., Aqil, M., et al. (2016). Flood vulnerability assessment in union council, jahangira, district nowshera, Pakistan. J. Sci. Technol. 40, 21–30.
Khan, I., Ali, A., Waqas, T., Ullah, S., Ullah, S., Shah, A. A., et al. (2022a). Investing in disaster relief and recovery: A reactive approach of disaster management in Pakistan. Int. J. Disaster Risk Reduct. 75, 102975. doi:10.1016/j.ijdrr.2022.102975
Khan, I., Lei, H., Shah, A. A., Khan, I., and Muhammad, I. (2021). Climate change impact assessment, flood management, and mitigation strategies in Pakistan for sustainable future. Environ. Sci. Pollut. Res. 28, 29720–29731. doi:10.1007/s11356-021-12801-4
Khan, I., Waqas, T., Samiullah, , , and Ullah, S. (2020). Precipitation variability and its trend detection for monitoring of drought hazard in northern mountainous region of Pakistan. Arab. J. Geosci. 13, 1–18.
Khan, W., Naqvi, S. M. H. M., Ahmad, N., Kamal, M., Hassan, H., Noor, A., et al. (2022b). Prevalence of rhabdochoniasis in snow trout of river Swat and river Panjkora, Khyber Pakhtunkhwa province, Pakistan. Braz. J. Biol. 82, e238874. doi:10.1590/1519-6984.238874
Khoirunisa, N., Ku, C.-Y., and Liu, C.-Y. (2021). A GIS-based artificial neural network model for flood susceptibility assessment. Int. J. Environ. Res. Public Health 18, 1072. doi:10.3390/ijerph18031072
Khosravi, K., Nohani, E., Maroufinia, E., and Pourghasemi, H. R. (2016a). A GIS-based flood susceptibility assessment and its mapping in Iran: A comparison between frequency ratio and weights-of-evidence bivariate statistical models with multi-criteria decision-making technique. Nat. Hazards 83, 947–987. doi:10.1007/s11069-016-2357-2
Khosravi, K., Pourghasemi, H. R., Chapi, K., and Bahri, M. (2016b). Flash flood susceptibility analysis and its mapping using different bivariate models in Iran: A comparison between Shannon’s entropy, statistical index, and weighting factor models. Environ. Monit. Assess. 188, 656. doi:10.1007/s10661-016-5665-9
Kia, M. B., Pirasteh, S., Pradhan, B., Mahmud, A. R., Sulaiman, W. N. A., and Moradi, A. (2012). An artificial neural network model for flood simulation using GIS: Johor River Basin, Malaysia. Environ. Earth Sci. 67, 251–264. doi:10.1007/s12665-011-1504-z
Liu, J., Liu, K., and Wang, M. (2023). Residual neural network integrated with a hydrological model for global flood susceptibility mapping based A residual neural network integrated with a hydrological model for global flood susceptibility mapping based on remote sensing datasets. doi:10.3390/rs15092447
Liu, J., Wang, J., Xiong, J., Cheng, W., Sun, H., Yong, Z., et al. (2021). Hybrid models incorporating bivariate statistics and machine learning methods for flash flood susceptibility assessment based on remote sensing datasets. Remote Sens. (Basel) 13, 4945. doi:10.3390/rs13234945
Liuzzo, L., Sammartano, V., and Freni, G. (2019). Comparison between different distributed methods for flood susceptibility mapping. Water Resour. Manag. 33, 3155–3173. doi:10.1007/s11269-019-02293-w
M Amen, A. R., Mustafa, A., Kareem, D. A., Hameed, H. M., Mirza, A. A., Szydłowski, M., et al. (2023). Mapping of flood-prone areas utilizing GIS techniques and remote sensing: A case study of duhok, kurdistan region of Iraq. Remote Sens. (Basel) 15, 1102. doi:10.3390/rs15041102
Mahmood, S., and Rahman, A. (2019). Flash flood susceptibility modeling using geo-morphometric and hydrological approaches in Panjkora Basin, Eastern Hindu Kush, Pakistan. Environ. Earth Sci. 78, 43. doi:10.1007/s12665-018-8041-y
Majeed, M., Lu, L., Anwar, M. M., Tariq, A., Qin, S., El-Hefnawy, M. E., et al. (2023). Prediction of flash flood susceptibility using integrating analytic hierarchy process (AHP) and frequency ratio (FR) algorithms. Front. Environ. Sci. 10. doi:10.3389/fenvs.2022.1037547
Malik, S., Pal, S. C., Arabameri, A., Chowdhuri, I., Saha, A., Chakrabortty, R., et al. (2021). GIS-based statistical model for the prediction of flood hazard susceptibility. Environ. Dev. Sustain. 23(11 23), 16713–16743. doi:10.1007/S10668-021-01377-1
McGrath, H., and Gohl, P. N. (2022). Accessing the impact of meteorological variables on machine learning flood susceptibility mapping. Remote Sens. (Basel) 14, 1656. doi:10.3390/rs14071656
Moazzam, M. F. U., Vansarochana, A., and Rahman, A. (2018). Analysis of flood susceptibility and zonation for risk management using frequency ratio model in District Charsadda, Pakistan. Int. J. Environ. Geoinformatics 5, 140–153. doi:10.30897/ijegeo.407260
Nasir, M. J., Iqbal, J., and Ahmad, W. (2020). Flash flood risk modeling of Swat River sub-watershed: A comparative analysis of morphometric ranking approach and el-shamy approach. Arabian J. Geosciences 13, 1082. doi:10.1007/s12517-020-06064-5
NDMA (2022). National disaster management authority, Pakistan. Available at: http://cms.ndma.gov.pk/news (Accessed October 21, 2022).
Paul, G. C., Saha, S., and Hembram, T. K. (2019). Application of the GIS-based probabilistic models for mapping the flood susceptibility in bansloi sub-basin of ganga-bhagirathi river and their comparison. Remote Sens. Earth Syst. Sci. 2, 120–146. doi:10.1007/s41976-019-00018-6
PMD (2022). Pakistan meteorological department. Available at: https://www.pmd.gov.pk/en/ (Accessed October 21, 2022).
Pradhan, B., and Lee, S. (2010). Delineation of landslide hazard areas on Penang Island, Malaysia, by using frequency ratio, logistic regression, and artificial neural network models. Environ. Earth Sci. 60, 1037–1054. doi:10.1007/s12665-009-0245-8
Rahman, A., Mahmood, S., Dawood, M., Rahman, G., and Chen, F. (2019). “Impact of climate change on flood factors and extent of damages in the Hindu Kush region,” in Oxford research encyclopedia of natural hazard science (Oxford University Press). doi:10.1093/acrefore/9780199389407.013.316
Rahmati, O., Haghizadeh, A., Pourghasemi, H. R., and Noormohamadi, F. (2016). Gully erosion susceptibility mapping: The role of GIS-based bivariate statistical models and their comparison. Nat. Hazards 82, 1231–1258. doi:10.1007/s11069-016-2239-7
Rebi, A., Hussain, A., Hussain, I., Cao, J., Ullah, W., Abbas, H., et al. (2023). Spatiotemporal precipitation trends and associated large-scale teleconnections in northern Pakistan. Atmos. (Basel) 14, 871. doi:10.3390/atmos14050871
Rehman, A., Song, J., Haq, F., Mahmood, S., Ahamad, M. I., Basharat, M., et al. (2022). Multi-hazard susceptibility assessment using the analytical hierarchy process and frequency ratio techniques in the northwest himalayas, Pakistan. Remote Sens. (Basel) 14, 554. doi:10.3390/rs14030554
ReliefWeb (2022). Rapid need assessment flood emergency - balochistan & sind (28th aug 2022) - Pakistan. Available at: https://reliefweb.int/report/pakistan/rapid-need-assessment-flood-emergency-balochistan-sind-28th-aug-2022 (Accessed October 21, 2022).
Rentschler, J., Salhab, M., and Jafino, B. A. (2022). Flood exposure and poverty in 188 countries. Nat. Commun. 13, 3527. doi:10.1038/s41467-022-30727-4
Riazi, M., Khosravi, K., Shahedi, K., Ahmad, S., Jun, C., Bateni, S. M., et al. (2023). Enhancing flood susceptibility modeling using multi-temporal SAR images, CHIRPS data, and hybrid machine learning algorithms. Sci. Total Environ. 871, 162066. doi:10.1016/j.scitotenv.2023.162066
Sabatakakis, N., Koukis, G., Vassiliades, E., and Lainas, S. (2013). Landslide susceptibility zonation in Greece. Nat. Hazards 65, 523–543. doi:10.1007/s11069-012-0381-4
Saeed, M., Li, H., Ullah, S., Rahman, A., Ali, A., Khan, R., et al. (2021). Flood hazard zonation using an artificial neural network model: A case study of Kabul River Basin, Pakistan. Sustainability 13, 13953. doi:10.3390/su132413953
Samanta, R. K., Bhunia, G. S., Shit, P. K., and Pourghasemi, H. R. (2018a). Flood susceptibility mapping using geospatial frequency ratio technique: A case study of subarnarekha River Basin, India. Model. Earth Syst. Environ. 4, 395–408. doi:10.1007/s40808-018-0427-z
Samanta, S., Pal, D. K., and Palsamanta, B. (2018b). Flood susceptibility analysis through remote sensing, GIS and frequency ratio model. Appl. Water Sci. 8, 66. doi:10.1007/s13201-018-0710-1
Sarkar, D., and Mondal, P. (2020). Flood vulnerability mapping using frequency ratio (FR) model: A case study on kulik river basin, indo-Bangladesh barind region. Appl. Water Sci. 10, 17. doi:10.1007/s13201-019-1102-x
Shah, A. A., Ullah, A., Khan, N. A., Shah, M. H., Ahmed, R., Hassan, S. T., et al. (2023). Identifying obstacles encountered at different stages of the disaster management cycle (DMC) and its implications for rural flooding in Pakistan. Front. Environ. Sci. 11. doi:10.3389/fenvs.2023.1088126
Sharif, H. O., Al-Juaidi, F. H., Al-Othman, A., Al-Dousary, I., Fadda, E., Jamal-Uddeen, S., et al. (2016). Flood hazards in an urbanizing watershed in Riyadh, Saudi Arabia. Geomatics, Nat. Hazards Risk 7, 702–720. doi:10.1080/19475705.2014.945101
Shen, L., Wen, J., Zhang, Y., Ullah, S., Cheng, J., and Meng, X. (2022). Changes in population exposure to extreme precipitation in the Yangtze River Delta, China. Clim. Serv. 27, 100317.
Shen, L., Zhang, Y., Ullah, S., Pepin, N., and Ma, Q. (2021). Changes in snow depth under elevation-dependent warming over the Tibetan Plateau. Atmos. Sci. Lett. 22. doi:10.1002/asl.1041
Shrestha, S., Sattar, H., Khattak, M. S., Wang, G., and Babur, M. (2020). Evaluation of adaptation options for reducing soil erosion due to climate change in the Swat River Basin of Pakistan. Ecol. Eng. 158, 106017. doi:10.1016/j.ecoleng.2020.106017
Shu, H., Guo, Z., Qi, S., Song, D., Pourghasemi, H. R., and Ma, J. (2021). Integrating landslide typology with weighted frequency ratio model for landslide susceptibility mapping: A case study from lanzhou city of northwestern China. Remote Sens. (Basel) 13, 3623. doi:10.3390/rs13183623
Tariq, A., Mumtaz, F., Majeed, M., and Zeng, X. (2023). Spatio-temporal assessment of land use land cover based on trajectories and cellular automata Markov modelling and its impact on land surface temperature of Lahore district Pakistan. Environ. Monit. Assess. 195, 114. doi:10.1007/s10661-022-10738-w
Tariq, A., and Mumtaz, F. (2022). Modeling spatio-temporal assessment of land use land cover of Lahore and its impact on land surface temperature using multi-spectral remote sensing data. Environ. Sci. Pollut. Res. 30, 23908–23924. doi:10.1007/s11356-022-23928-3
Tayyab, M., Zhang, J., Hussain, M., Ullah, S., Liu, X., Khan, S. N., et al. (2021). GIS-based urban flood resilience assessment using urban flood resilience model: A case study of peshawar city, khyber Pakhtunkhwa, Pakistan. Remote Sens. (Basel) 13, 1864. doi:10.3390/rs13101864
Tehrany, M. S., Lee, M.-J., Pradhan, B., Jebur, M. N., and Lee, S. (2014). Flood susceptibility mapping using integrated bivariate and multivariate statistical models. Environ. Earth Sci. 72, 4001–4015. doi:10.1007/s12665-014-3289-3
Tehrany, M. S., Pradhan, B., and Jebur, M. N. (2015). Flood susceptibility analysis and its verification using a novel ensemble support vector machine and frequency ratio method. Stoch. Environ. Res. Risk Assess. 29, 1149–1165. doi:10.1007/s00477-015-1021-9
Tehrany, M. S., Pradhan, B., and Jebur, M. N. (2013). Spatial prediction of flood susceptible areas using rule based decision tree (DT) and a novel ensemble bivariate and multivariate statistical models in GIS. J. Hydrol. (Amst) 504, 69–79. doi:10.1016/j.jhydrol.2013.09.034
Thongley, T., and Vansarochana, C. (2021). Landslide susceptibility assessment using frequency ratio model at ossey watershed area in Bhutan. Eng. Appl. Sci. Res. 48, 56–64. doi:10.14456/easr.2021.7
Ullah, F., Ali Shah, S. A., Saqib, S. E., Yaseen, M., and Haider, M. S. (2021). Households’ flood vulnerability and adaptation: Empirical evidence from mountainous regions of Pakistan. Int. J. Disaster Risk Reduct. 52, 101967. doi:10.1016/j.ijdrr.2020.101967
Ullah, K., and Zhang, J. (2020). GIS-based flood hazard mapping using relative frequency ratio method: A case study of Panjkora River Basin, eastern Hindu Kush, Pakistan. PLoS One 15, e0229153. doi:10.1371/journal.pone.0229153
Ullah, S., You, Q., Ali, A., Ullah, W., Jan, M. A., Zhang, Y., et al. (2019b). Observed changes in maximum and minimum temperatures over China- Pakistan economic corridor during 1980–2016. Atmos. Res. 216, 37–51. doi:10.1016/j.atmosres.2018.09.020
Ullah, S., You, Q., Ullah, W., and Ali, A. (2018). Observed changes in precipitation in China-Pakistan economic corridor during 1980–2016. Atmos. Res. 210, 1–14. doi:10.1016/j.atmosres.2018.04.007
Ullah, S., You, Q., Ullah, W., Ali, A., Xie, W., and Xie, X. (2019a). Observed changes in temperature extremes over China-Pakistan Economic Corridor during 1980-2016. Int. J. Climatol. 39, 1457–1475. doi:10.1002/joc.5894
Ullah, S., You, Q., Ullah, W., Sachindra, D. A., Ali, A., Bhatti, A. S., et al. (2023). Climate change will exacerbate population exposure to future heat waves in the China-Pakistan economic corridor. Weather Clim. Extrem 40, 100570. doi:10.1016/j.wace.2023.100570
Ullah, W., Wang, G., Ali, G., Tawia Hagan, D., Bhatti, A., and Lou, D. (2019). Comparing multiple precipitation products against iIn-sSitu observations over different climate regions of Pakistan. Remote Sens. (Basel) 11, 628. doi:10.3390/rs11060628
Ullah, W., Wang, G., Lou, D., Ullah, S., Bhatti, A. S., Ullah, S., et al. (2021). Large-scale atmospheric circulation patterns associated with extreme monsoon precipitation in Pakistan during 1981–2018. Atmos. Res. 253, 105489. doi:10.1016/j.atmosres.2021.105489
Vojtek, M., and Vojteková, J. (2019). Flood susceptibility mapping on a national scale in Slovakia using the analytical hierarchy process. Water (Basel) 11, 364. doi:10.3390/w11020364
Wang, Y., Hong, H., Chen, W., Li, S., Pamučar, D., Gigović, L., et al. (2018). A hybrid GIS multi-criteria decision-making method for flood susceptibility mapping at shangyou, China. Remote Sens. (Basel) 11, 62. doi:10.3390/rs11010062
Wang, Y., Sun, D., Wen, H., Zhang, H., and Zhang, F. (2020). Comparison of random forest model and frequency ratio model for landslide susceptibility mapping (LSM) in yunyang county (chongqing, China). Int. J. Environ. Res. Public Health 17, 4206. doi:10.3390/ijerph17124206
Wang, Z., Chen, X., Qi, Z., and Cui, C. (2023). Flood sensitivity assessment of super cities. Sci. Rep. 13(1), 5582.
Wang, Z., Lai, C., Chen, X., Yang, B., Zhao, S., and Bai, X. (2015). Flood hazard risk assessment model based on random forest. J. Hydrol. (Amst) 527, 1130–1141. doi:10.1016/j.jhydrol.2015.06.008
Xu, H., Xu, K., Wang, T., and Xue, W. (2022). Investigating flood risks of rainfall and storm tides affected by the parameter estimation coupling bivariate statistics and hydrodynamic models in the coastal city. Int. J. Environ. Res. Public Health 19, 12592. doi:10.3390/ijerph191912592
Youssef, A. M., Pradhan, B., and Sefry, S. A. (2016). Flash flood susceptibility assessment in Jeddah city (Kingdom of Saudi Arabia) using bivariate and multivariate statistical models. Environ. Earth Sci. 75, 12. doi:10.1007/s12665-015-4830-8
Yu, P., Ma, H., Qiu, L., Zhang, T., and Li, S. (2022). Optimization of a flood diversion gate scheme in flood storage and detention areas based on flood numerical simulation. Front. Environ. Sci. 10. doi:10.3389/fenvs.2022.978385
Zhao, G., Pang, B., Xu, Z., Peng, D., and Xu, L. (2019). Assessment of urban flood susceptibility using semi-supervised machine learning model. Sci. Total Environ. 659, 940–949. doi:10.1016/j.scitotenv.2018.12.217
Zhao, P., Masoumi, Z., Kalantari, M., Aflaki, M., and Mansourian, A. (2022). A GIS-based landslide susceptibility mapping and variable importance analysis using artificial intelligent training-based methods. Remote Sens. (Basel) 14, 211. doi:10.3390/rs14010211
Ziwei, L., Xiangling, T., Liju, L., Yanqi, C., Xingming, W., and Dishan, Y. (2023). GIS-based risk assessment of flood disaster in the Lijiang River Basin. Sci. Rep. 13, 6160. doi:10.1038/s41598-023-32829-5
Keywords: flood susceptibility map, frequency ratio (FR) model, Swat River Basin (SRB), eastern Hindu Kush region, Pakistan
Citation: Rahman ZU, Ullah W, Bai S, Ullah S, Jan MA, Khan M and Tayyab M (2023) GIS-based flood susceptibility mapping using bivariate statistical model in Swat River Basin, Eastern Hindukush region, Pakistan. Front. Environ. Sci. 11:1178540. doi: 10.3389/fenvs.2023.1178540
Received: 02 March 2023; Accepted: 27 June 2023;
Published: 06 July 2023.
Edited by:
Sandipan Das, Symbiosis International University, IndiaReviewed by:
Zerouali Bilel, University of Chlef, AlgeriaCopyright © 2023 Rahman, Ullah, Bai, Ullah, Jan, Khan and Tayyab. This is an open-access article distributed under the terms of the Creative Commons Attribution License (CC BY). The use, distribution or reproduction in other forums is permitted, provided the original author(s) and the copyright owner(s) are credited and that the original publication in this journal is cited, in accordance with accepted academic practice. No use, distribution or reproduction is permitted which does not comply with these terms.
*Correspondence: Waheed Ullah, d3VsbGFoQHJhLmFjLmFl, Shibiao Bai, c2hpYmlhb2JhaUBuam51LmVkdS5jbg==
Disclaimer: All claims expressed in this article are solely those of the authors and do not necessarily represent those of their affiliated organizations, or those of the publisher, the editors and the reviewers. Any product that may be evaluated in this article or claim that may be made by its manufacturer is not guaranteed or endorsed by the publisher.
Research integrity at Frontiers
Learn more about the work of our research integrity team to safeguard the quality of each article we publish.