- 1School of Economics and Management, China University of Petroleum (East China), Qingdao, China
- 2College of Oceanography and Space Informatics, China University of Petroleum (East China), Qingdao, China
- 3Party-Masses Work Department, China University of Petroleum-Beijing at Karamay, Karamay, China
- 4Department of Publicity, Shandong University, Jinan, China
The largest ever investment in shale gas resources has induced potential environmental threats in China. The assessment and forecasting of environmental impacts associated with shale gas production is highly challenging due to the characteristics of high uncertainty, nonlinearity, and complexity. This paper proposes a new hybrid model by combining the pressure-state-response (PSR) framework with the firefly algorithm (FA) and a nonlinear auto-regressive (NAR) dynamic neural network (the PSR-FA-NAR model) to detect and forecast the state of the environment as well as send warning signals for shale gas production. Then, an empirical sample, the Changning-Weiyuan national-level shale gas pilot zone that produces more than 50% of Chinese shale gas output, is used to test the effectiveness of the proposed model. The results show that Changning play will predictably face severe environmental threats imposed by rapid development, and the model is not only able to capture nonlinearity time-series and present cause-effect relationships but is also able to improve the predictive performance and forecasting accuracy. It proves that the PSR-FA-NAR model can effectively address the problems with high dimensionality, complexity, and nonlinearity and provides a practical methodology to quantify and identify the potential environmental impacts of unconventional oil and gas production.
1 Introduction
The fossil fuel long-term dominated energy mix has resulted in serious environmental problems in China (Yuan et al., 2016; Wang and Zhan, 2019). To achieve Peak Carbon Emissions by 2030 and Carbon Neutrality by 2060 and to enlarge clean energy supply capacity while contributing to national energy security, China, which owns the largest shale gas reserves in the world, is sharply stepping up its exploration and development. The state-owned oil and gas companies that produce almost all of China’s shale gas, e.g. China National Petroleum Corporation (CNPC) and China Petrochemical Corporation (Sinopec), are making the investment as “unprecedented”, that is, the largest ever investment in shale oil and gas resources.
Shale gas trapped within an impermeable shale formation is a kind of unconventional natural gas that is squeezed into shocks (Bilgili et al., 2016). Shale gas development with large-scale and commercial viability mainly depends on horizontal drilling with multistage hydraulic fracturing (Hughes, 2013), which might often cause huge negative impacts on the local environment. China’s shale gas plans should be prudently made trade-offs between environmental risks and scale profits (Wang et al., 2014; Wang et al., 2018). Chinese shale gas has produced more than 20 billion cubic meters (Bcm) in 2020. The Changning-Weiyuan play, the largest national-level shale gas pilot zone, produced more than 10 Bcm in 2020, which accounts for more than 50% of the total volume of produced shale gas in China. Moreover, compared to the proved reserves with their trillion cubic meters, the actual shale gas production is still low in the Changning-Weiyuan play. Therefore, the current and future status of the environment associated with Changning-Weiyuan shale gas production is typical and could be used as a representative to be studied.
The purpose of this study is to present a novel hybrid PSR-FA-NAR model to detect and forecast the environmental status as well as send early-warning signals of the potential environmental threats and changes for shale gas production. The rest of this paper is organized as follows. In section 2, we review the literature on shale gas development, the potential environmental impacts, as well as assessing and forecasting methods. Section 3 proposes a novel forecasting methodology for the environmental impacts of shale gas production. Section 4 demonstrates an empirical analysis. In section 5, we present the environmental impact forecasting results and construct a four-tier color-coded warning system for Changning play. Section 6 concludes the paper.
2 Literature review
2.1 Review of the literature on shale gas development and its environmental issues
Many researchers have studied shale gas development, including shale gas prospects, shale gas properties, and the social, economic, technical, and environmental issues of shale gas production. Shale gas production was expected to supply 50% of the total natural gas in the U.S. by 2040 (Jackson et al., 2014), and in fact, the proportion reached 68.5% in 2018. Matthew et al. pointed out that shale gas has become an energy policy priority in the United Kingdom (Cotton and Cotton, 2016). It is noted that unconventional extraction for shale gas resources, that is, multistage horizontal drilling and high volume hydraulic fracturing, are fundamentally different from and significantly more challenging than conventional exploration (Navarette et al., 2014). The increased energy security and potential economic benefits promote rapid development in spite of the controversy about potential environmental impacts of fracking goes on (Andersson-Hudson et al., 2019). Bilgili et al. examined the potential influence of shale gas extraction and concluded that new technologies might be developed to reduce the possible negative environmental impacts (Bilgili et al., 2016). Stamford and Azapagic assessed the environmental impacts based on life cycle assessment methodology and made comparisons with fossil-fuel alternatives and low-carbon options (Stamford and Azapagic, 2014). Wang et al. studied the economic, social, and environmental impacts of shale gas development by integrating driving force-pressure-state-impact-response (DPSIRM), the real-coded accelerated genetic algorithm, and projection pursuit (Wang and Zhan, 2019).
The potential threats associated with shale gas extraction have begun to threaten the ecological environment due to water consumption (Vidic et al., 2013; Loh and Loh, 2016), water contamination (Rahm, 2011; Chang et al., 2014; Gallegos et al., 2015; Harkness et al., 2015), air pollution (Roy et al., 2014; Sun et al., 2016), noise pollution (Streich et al., 2010; Rutqvist et al., 2013), induced earthquakes (Litovitz et al., 2013; Shirzaei, 2016), and greenhouse gas emissions (Howarth et al., 2011; MacKay and Stone, 2013; Melikoglu, 2014). MacKay and Stone examined local greenhouse gas emissions associated with shale gas development based on the life cycle (MacKay and Stone, 2013). Howarth et al. evaluated greenhouse gases based on the available data from the oil and gas industry by the U.S. Environmental Protection Agency (Howarth et al., 2011). The rapid development of shale gas has triggered an intense public debate over the possible environmental and human health implications (Vengosh et al., 2014). However, there is no unified assessment, forecasting and warning system of the environment on shale gas production for now. Therefore, it is necessary to develop a scientific and reliable system to detect, forecast, and identify the potential environmental threats associated with shale gas extraction. Given the specific properties of shale gas resources and the unconventional extraction techniques, the development of shale gas should require a different thought process to achieve a fully optimized solution based on the interdependency between multiple disciplines (Navarette et al., 2014).
It can be seen that most of the literature mainly focuses on the qualitative analysis and description of the potential challenges posed by shale gas production. Meanwhile, some researchers began to quantify the environmental impacts by using evaluation methods and tried to assess these impacts objectively and scientifically, which made great progress in the sustainability of the shale gas industry. However, most of the research studies environmental impacts from a macro perspective dedicated to the assessment in a country or in a basin, and few of the research studies a specific shale gas play or field from a micro perspective. There is no doubt that the environmental impact assessment did play an irreplaceable role in preventing or mitigating adverse environmental impacts. However, the related results of the assessment mainly show what happened in the past and cannot effectively predict the future of environmental conditions, that is, what will happen in the future cannot be answered. China’s shale gas is growing at an exponential rate thanks to national support policies and huge investments by CNPC and Sinopec. Therefore, it is urgent to predict and identify the potential environmental threats posed by shale gas exploitation and development. In view of high heterogeneity and the intrinsic nature of shale gas play, it is necessary to construct a novel forecasting system to detect and reveal the future status of the environment as a result of shale gas production.
2.2 Review of the literature on the PSR-FA-NAR model
Researchers have developed many models for assessing the environmental impacts associated with shale gas development. The environmental impacts were summarized and studied by using the life cycle method (Stamford and Azapagic, 2014), the correlation matrix method (Sun and Wang, 2015), curve projection pursuit dynamic cluster, the Driving-Force-Pressure-State-Impact-Response (DPSIR), and the PSR model (Xing et al., 2016). However, the various methods combined with the DPSIR framework have some shortcomings, such as covering system complexity, over-representation of those impacts of indicator changes, and an increasing insensitivity of the assessment model with increasing complexity (Wolfslehner and Vacik, 2008). It is worth pointing out that the PSR framework has been applied to evaluate sustainable forest management strategies (Wolfslehner and Vacik, 2008), assess secondary soil salinization risk (Zhou et al., 2013), and forecast security warning of energy consumption carbon emissions (Liang et al., 2014), which have achieved great performance. Therefore, the PSR framework that covers causes, impacts, and effects on the environment was selected to develop the forecasting system for shale gas production.
Shale gas development is a dynamic process with uncertainty and complexity, so that nonlinear time-series models are viewed as an effective tool with better performance. However, the PSR model demonstrates a linear relationship between human beings and the environment while having limited regard to scientific analysis (Wolfslehner and Vacik, 2008). In fact, how to formulate an appropriate nonlinear model is very difficult since more mistakes can be made by more possibilities and more parameters (Zhang et al., 2001). It can be proved that neural networks show a lot of promise for nonlinear time-series forecasting (McKenzie et al., 1995). An artificial neural network (ANN) is a valuable tool for modeling and forecasting time series, which has been commonly applied to model dynamic nonlinear time series (Benmouiza and Cheknane, 2013; Yolcu et al., 2013). To predict the change in electric load consumption, Chow and Leung proposed a NAR model to provide more accurate forecasts (Chow and Leung, 1996). Besides, the NAR neural network has been applied in monitoring total suspended solids concentrations in Lake Mead (Imen et al., 2015), detecting warning signals for chemical industry (Jiang et al., 2017), enhancing the warning system of drinking water source intake (Burchard-Levine et al., 2014), and forecasting financial issues (Qi and Zhang, 2001; Zhang et al., 2001; Panda and Narasimhan, 2007; Yu et al., 2009). The NAR neural network with feedback and memory has obvious strengths that provide more accuracy in time-series forecasting and simulation (Benmouiza and Cheknane, 2013) and has been proven to be well-suited for forecasting complex and nonlinear time series (Cheng et al., 2019). There is still limited research about environmental state forecasting applying the NAR model. Therefore, this paper applies the NAR neural network to address high uncertainty, high complexity, and nonlinearity in the process of shale gas production.
The prediction accuracy of the dynamic NAR neural network mainly depends on the parameters, including lag orders and the number of neurons in the hidden layer. However, the two important parameters are often subjective, even sometimes random, so that the NAR neural network might not be used well in actual engineering applications. There is no specific mathematical formula to obtain the number of neurons. Although too many neurons can improve the learning ability of the network, it leads to overfitting and reduces the generalization ability. If too little, the network’s learning ability is poor and it cannot capture the rules and characteristics of sample data well. How to determine the two parameters is a complex nonlinear optimization problem. The general optimization algorithms including genetic algorithms (GA) and particle swarm optimization (PSO), could be used to solve the problem, while preliminary studies indicate that the Firefly Algorithm (FA) is superior to GA and PSO (Goos et al., 2009). The FA proposed by Yang (Goos et al., 2009) is a very promising metaheuristic algorithm, which mimics the social behavior of fireflies while flying such as searching for prey and finding mates by bioluminescence with varied flashing patterns (Gandomi et al., 2011). Compared to other traditional deterministic optimization algorithms, the FA is simple and independent of the mathematical properties of the optimization problem itself, so that it has been widely used due to its calculation with high efficiency and less time-consuming (Shuling et al., 2019). It has been proved that the FA has the advantages of the global optimum, fast convergence, easy operation, and good robustness and has been applied in many areas, such as demand estimation of water resources (Wang et al., 2018), mid-term interval load forecasting (Hu et al., 2015), feature selection for classification and regression models (Zhang et al., 2018), forecasting modeling and optimization of a multi-zone HVAC system (Zeng et al., 2015). Therefore, this paper uses the FA, one of the metaheuristic optimization algorithms, to adjust and optimize the parameters of the NAR neural network and improve the performance of the network. Accordingly, the optimal lag order and the optimal number of neurons in the hidden layer were obtained objectively and scientifically by applying the FA-NAR model.
3 Methodology
3.1 Model description
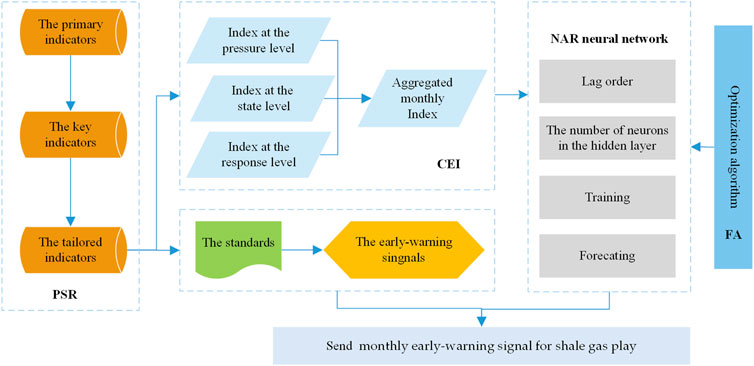
To address the cause-effect relationship, nonlinearity time-series, and subjective or random parameters of the neural network, we proposed a novel PSR-NAR-FA model which combines the PSR framework with the NAR neural network and the FA optimization algorithm. Firstly, the primary indicators set up in the PSR framework should be screened to be the key (or candidate) ones, then tailored ones according to the actual status quo of shale gas plays. Secondly, the composite environmental index (CEI) in environmental systems analysis is calculated to delegate the whole state of the environment during shale gas production. Thirdly, the aggregated monthly indexes are used as input variables into a dynamic NAR model that can effectively predict the environmental status of shale gas development. Meanwhile, the FA optimization algorithm is used to obtain the two important parameters, that is, the lag orders and the number of neurons in the hidden layer. Finally, the different warning signals are to be sent based on the local environmental standards and the forecasting results of the PSR-NAR-FA model. The proposed model is demonstrated in Figure 1.
3.2 The indicator system within the PSR framework
3.2.1 The PSR framework
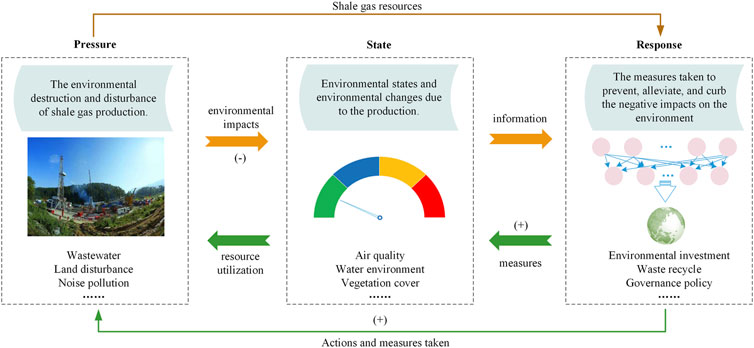
The PSR framework, developed by the Organization for Economic Co-operation and Development (OECD) (OECD, 1993), is an efficient framework for studying environmental issues since it covers causes and effects influencing a measurable state. Human beings have to obtain essentially natural resources for survival and development, various kinds of waste are emitted to affect the environment at the same time, subsequently the responding actions and measures are taken to reduce and curb the negative effects, finally changing human behavior and decisions. Such interesting recycling constitutes a pressure-state-response relationship which consists of three categories of indicators: pressure indicators (indicators of P-layer), state indicators (indicators of S-layer), and response indicators (indicators of R-layer), as shown in Figure 2.
The PSR framework is good at answering the basic questions: “what happened, why happened, and how we will do it.” The PSR model shown in Figure 2 illustrates the logic structure during shale gas development. The indicators of the P-layer describe the potential environmental impacts of production activities, the indicators of the S-layer express the status quo of the environment and corresponding changes as a result of the activities; and the indicators of the R-layer present the actions taken by companies to alleviate or curb the corresponding negative changes (Wolfslehner and Vacik, 2008; Sun et al., 2020).
3.2.2 The screening of indicators
A set of thirty-six primary indicators were summarized and elaborated on in the previous study (Sun et al., 2020). Given a set of those, we interviewed the experts, managers, operators, and workers on site and screened the key indicators in order to enhance the implementation and application of the indicators system in practice. The detailed calculation process is omitted here because the method is popular and mature and is applied in a lot of literature (Saaty, 1990; Zhou et al., 2006; Liu et al., 2022). Then, the set of the key indicators is constituted based on the data availability and the applicability of the indicator system. Finally, the tailored indicator system should be further studied due to the typical heterogeneity of the shale gas plays according to the optimization theory. To simultaneously ensure the completeness of the indicator system and reduce the redundancy of indicators, the number of indicators within the PSR framework should be a minimum, which belongs to an optimization problem. Then, a screening model is constructed based on this objective optimization theory.
where
where
3.3 Aggregated monthly index
The CEI usually offers condensed environmental information for decision making and performance monitoring (Zhou et al., 2006). Hope and Park highlighted the necessity of the monthly CEI and pointed out that the index might be good since it is more practical (Hope and Parker, 1990). Based on the above valuable research results, we construct a monthly CEI and apply the simple weighted sum method to calculate and rank the values of the monthly CEI.
Suppose that there are
Let
Meanwhile, the sub-index of the composite index within the PSR framework could be obtained by the same method and procedure.
Here,
3.4 The FA-NAR model
3.4.1 The NAR neural network
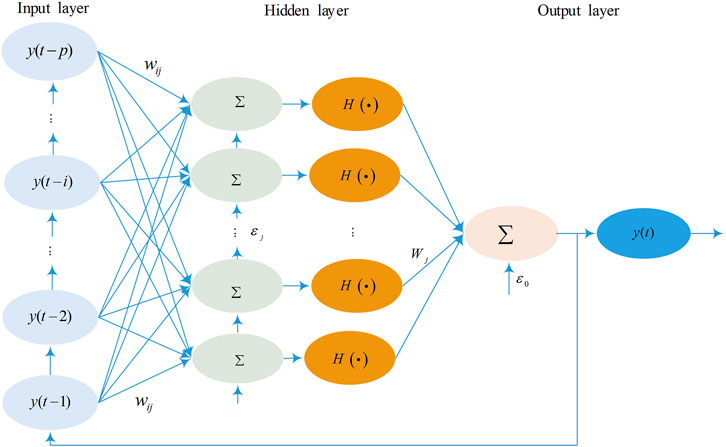
The NAR is a recurrent neural network with a strong dynamic performance and a high immunity to noise since it combines the nonlinear mapping ability of a neural network with the time-series characteristics of the linear autogressive model (Cheng et al., 2019). Therefore, a NAR model is applied to detect and forecast the state of the environment in a given period
where
The input layer receives the variables
3.4.2 The FA optimization algorithm
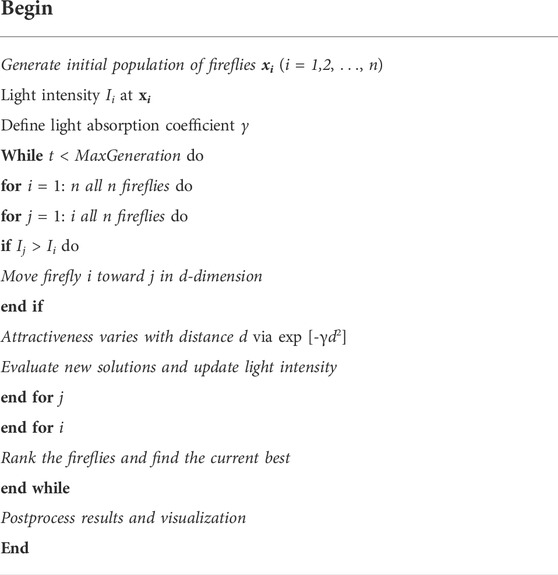
The basic procedures of the FA optimization algorithm are demonstrated by the pseudo code shown in Table1 (Gerhard Goos, Juris Hartmanis, 2009; Gandomi et al., 2011).
The FA is a modern metaheuristic optimization algorithm that can find the global and local optima simultaneously (Gerhard Goos, Juris Hartmanis, 2009; Gandomi et al., 2011). The process of search mimics the mating behavior of flashing fireflies, and each one delegates a candidate solution. All feasible solutions in the search space are regarded as firefly individuals. When the less bright firefly is attracted by other brighter ones, it can move toward other new positions and find potential solutions (Wang, 2018). To simply describe the search model, Yang (Gerhard Goos, Juris Hartmanis, 2009; Gandomi et al., 2011) proposed three rules: 1) one firefly is attracted to other brighter fireflies regardless of their gender; 2) the attractiveness is proportional to firefly brightness; 3) the brightness is determined by the landscape of objective function.
In the FA algorithm, the variation of light intensity and the formulation of the attractiveness are the two key issues. The light intensity
where
where the step factor
3.4.3 The FA-NAR neural network
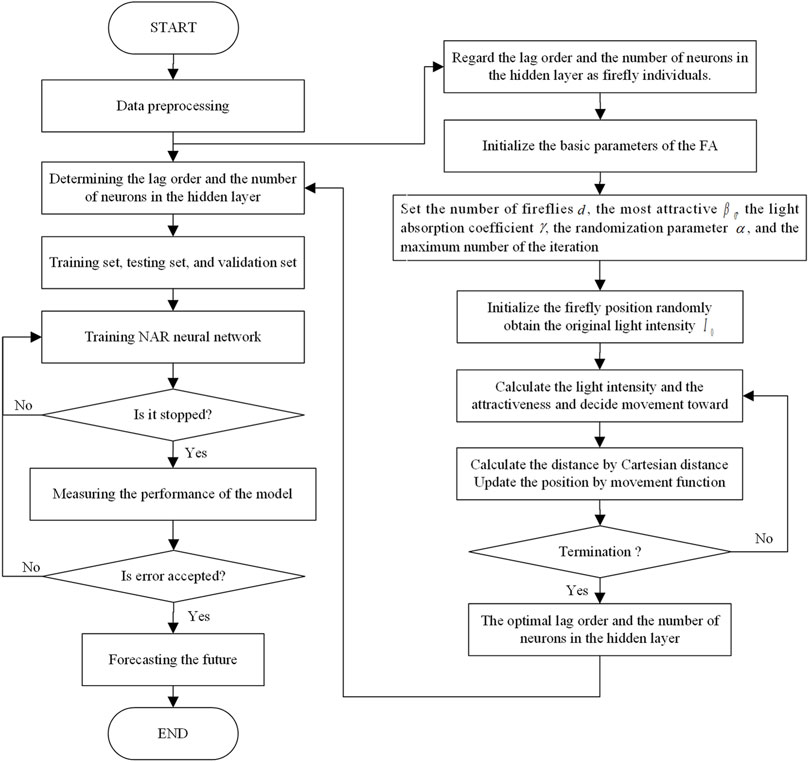
The principle and the process of optimizing the NAR neural network by using the FA algorithm are outlined in Figure 4.
The performance and accuracy of forecasting by using the NAR model mainly depend on the parameters, especially the number of neurons in the hidden layer and lag order. The FA is superior to the GA and PSO in optimizing the NAR network parameters because fireflies aggregate more closely around each optimum (Mandal et al., 2013). The network parameters, that is, the lag order and the number of neurons in the hidden layer, are regarded as firefly individuals, and the optimal network parameters are derived after constantly updating the firefly locations by using the global search ability of the FA. As for the objective function of the algorithm, we use the mean square error to make the judgement. Then the optimal parameters by the FA are integrated into the NAR model, which effectively describes the nonlinear component to predict the state of the environment.
4 Empirical analysis
4.1 The tailored indicator system of changning shale gas play
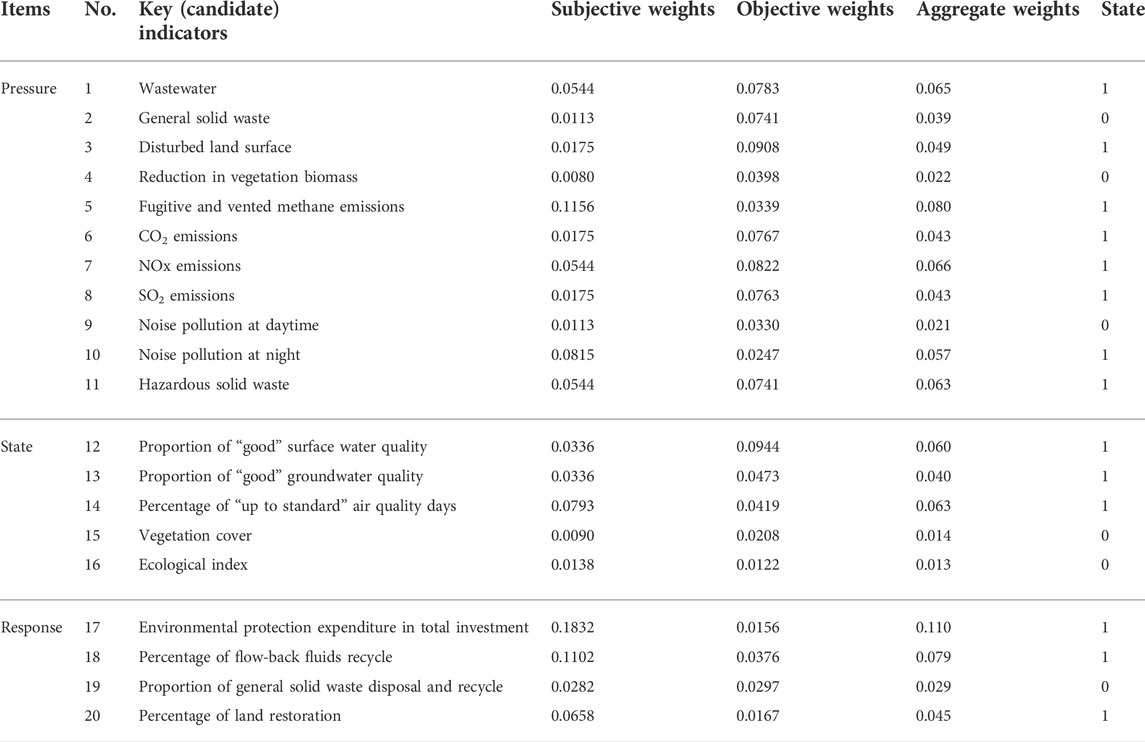
The Changning National Shale Gas Demonstration Zone, approved by the National Development and Reform Commission (NDRC) and the National Energy Administration (NEA) in 2012 and operated by PetroChina Southwest Oil & Gas Field Company, spans four counties in Sichuan province, that is, Changning County, Gong County, Xingwen County, and Junlian County in Sichuan province. In October 2020, Changning’s daily shale gas output broke through 0.02 Bcm, ranking first in China’s shale gas fields’ daily production. The annual shale gas output of the Changning-Weiyuan play now exceeds 10 Bcm, accounting for more than 50% of total shale gas in China. Compared with reservoirs in North America, Chinese shale gas reservoirs are deeply buried and have more complex surface conditions, which might produce much more negative impacts on the local environment. Twenty key indicators shown in Table 2 are selected.
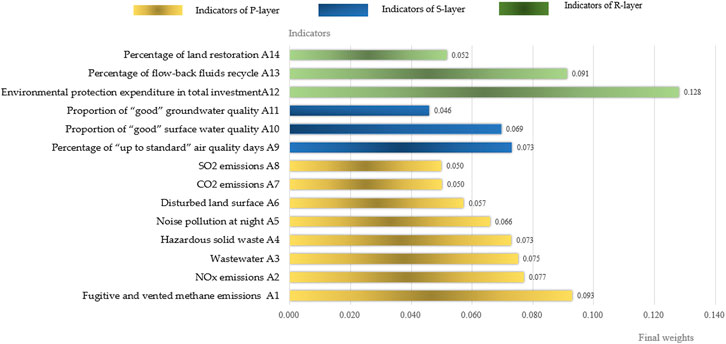
The tailored indicators are obtained via the screening method shown in section 3.2.2. The indicator is kept if the outcome is 1, and the indicator is deleted if the outcome is 0. In this case, the environmental indicators are optimized from 20 to 14, with 70% of the indicators expressing 86.3% of the information, which could reflect the important aspects of the environmental status comprehensively and eliminate the subjective influence of humans. The whole algorithm is implemented in Matlab software. The final weights of the fourteen tailored indicators are recalculated and shown in Figure 5.
4.2 The CEI of changning play from 2014 to 2019
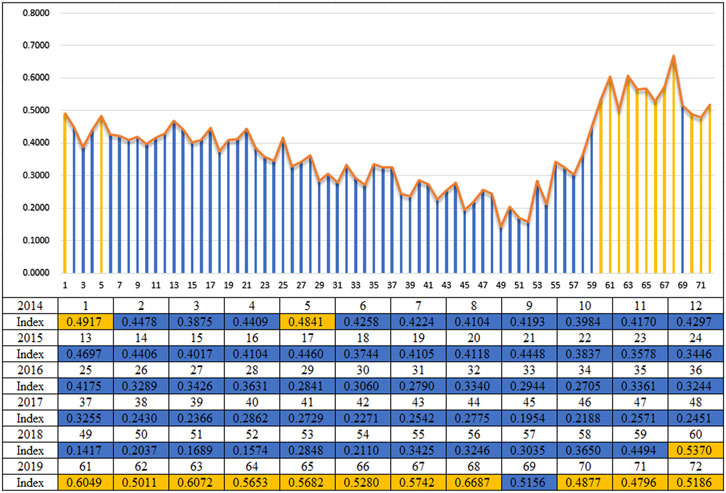
By applying the methodology in section 3.3, the monthly CEIs of shale gas production in the Changning play from 2014 to 2019 are calculated as shown in Figure 6.
4.3 Implementation of the FA-NAR model
The CEIs of Changning play are inputs to the NAR model. The output parameter of the FA-NAR model is the forecasting results. In this paper, we assign 70%, 15%, and 15% of the sample data from 2014 to 2019 to the training set, validation set, and testing set, respectively. The training process aims to adjust and optimize the neural network based on the error term for the training set. The validation process aims at the improvement of the generalization ability of the neural network, and the training will have to stop immediately once the generalization cannot be improved. Thus, overfitting can be effectively prevented. Then, the testing set offers a measure that can be used to evaluate and judge the neural network performance during and after training. It is noted that only the predictions of the NAR model that passed the error autocorrelation test are effective (Cheng et al., 2019).
The learning and prediction performance of NAR is tied to lag order and the numbers of neurons in the hidden layer. Hence, we would strongly suggest that the two parameters should be obtained by global search algorithms such as the FA optimization algorithm proposed in section 3.4.2 rather than any rules of thumb. In theory, the range of
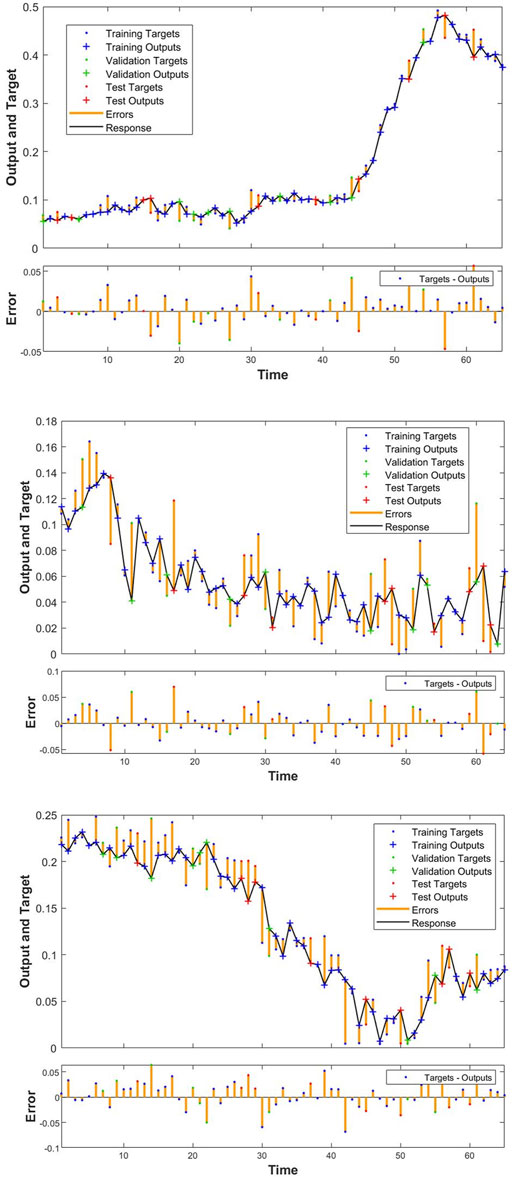
FIGURE 7. The specific results of training, validation, and testing of the FA-NAR model. (A) Results of training, verification, and testing at the pressure level. (B) Results of training, verification, and testing at the state level. (C) Results of training, verification, and testing at the response level.
The prediction performance of the FA-NAR model is determined by the degree of correlation errors that can be tested by error autocorrelation analysis (Cheng et al., 2019). It is well known that the stronger the autocorrelation, the smaller the prediction error. Only the degrees of correlation errors that are lower than the confidence level can pass the error autocorrelation test (Cheng et al., 2019). The error autocorrelation analysis of the FA-NAR model is illustrated in Figure 8.
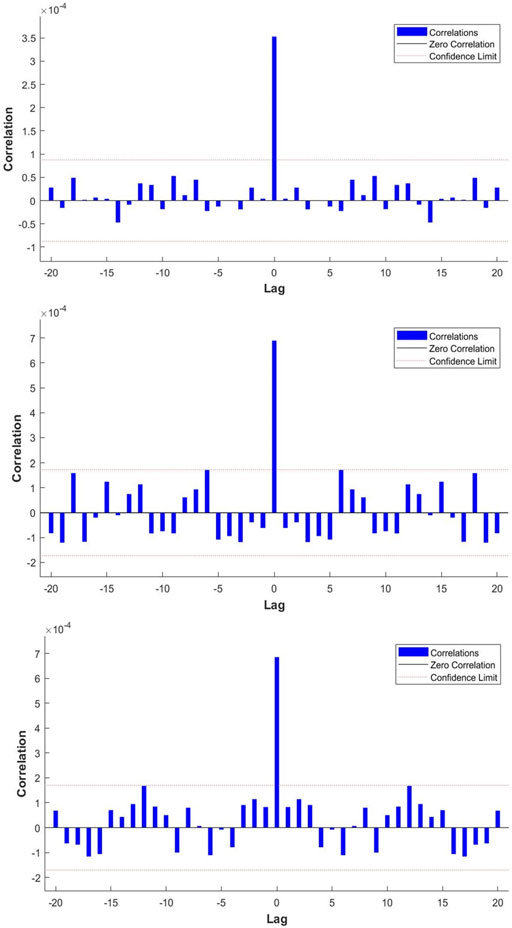
FIGURE 8. The results of error autocorrelation analysis of the FA-NAR model (A) Error autocorrelation analysis at the pressure level (B) Error autocorrelation analysis at the state level (C) Error autocorrelation analysis at the response level.
We can see that the autocorrelation of errors is within the range of the confidence levels except when the lag order is zero, which denotes that the FA-NAR model is effective and the prediction performance of the model is good and accepted. Therefore, we could apply the FA-NAR model with good prediction performance to forecast the monthly environmental state within the next 2 years.
5 Prediction results and analysis
5.1 Prediction results
In this section, the effectiveness of the FA-NAR model is evaluated and discussed by predicting the state of the environment from 2020 to 2021. If the error between the actual value and the obtained value is accepted, then the model could be used for forecasting the future state of the environment in the process of shale gas production. Given that the proposed model is a data extrapolation method, short-term predictions could be made. In this paper, 1 month is selected as the length of the short-term prediction. The forecasting results of monthly CEIs at the pressure, state, and response levels are illustrated in Figures 9A–C, respectively.
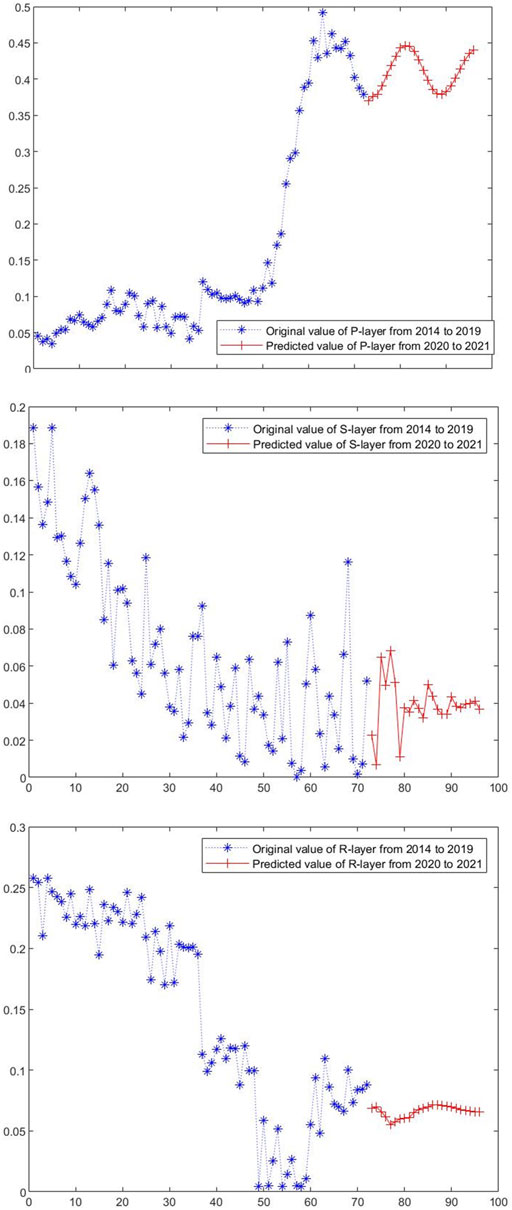
FIGURE 9. The forecasting results of monthly composite environmental indexes. (A) The forecasting results of monthly CEIs at the pressure level. (B) The forecasting results of monthly CEIs at the state level. (C) The forecasting results of monthly CEIs at the response level.
Subsequently, the results of monthly CEIs are summarized and aggregated in Figure 10.
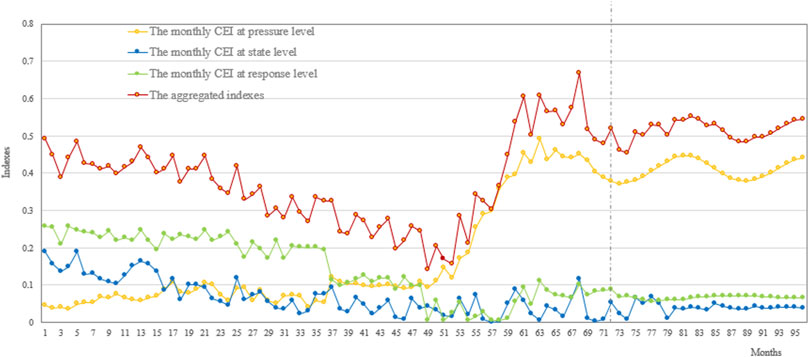
FIGURE 10. The monthly CEI and the aggregated indexes from 2014 to 2021 in the Changning shale gas play.
5.2 Error analysis
The prediction performance of the forecasting model is usually estimated by error functions such as the sum of squared errors, the mean absolute percentage error, the least absolute deviations, the mean square error (MSE), and percentage differences. In this paper, the MSE is selected to analyze the predictive performance and accuracy of the FA-NAR neural network. And the MSE can be obtained by formula (9).
where
Based on the differences between the forecasting results and the recorded actual values from January 2020 to December 2021, the predictive performance measure, MSE, is calculated by using the NAR and the FA-NAR models. Then the MSEs at the P-layer, S-layer, and R-layer by the FA-NAR are 0.0768, 0.0020, and 0.0110, respectively, and the corresponding MSE by the NAR is 0.0945, 0.0033, and 0.0131, respectively. It can be seen that the MSE at different layers corresponding to the FA-NAR model is less than the MSE by the NAR model, which indicates that the proposed FA-NAR model outperforms the contrasted NAR model in predictive performance and accuracy. Whereas, the computing time by the FA-NAR model is much higher than the traditional NAR model. The computing time by the FA-NAR model is from 264 sec to 290 sec far beyond only 0.6 sec, by the NAR model. If the problem to be solved is super large-scale, how to improve the forecasting efficiency should be further studied.
5.3 The standards of environmental protection in changning play
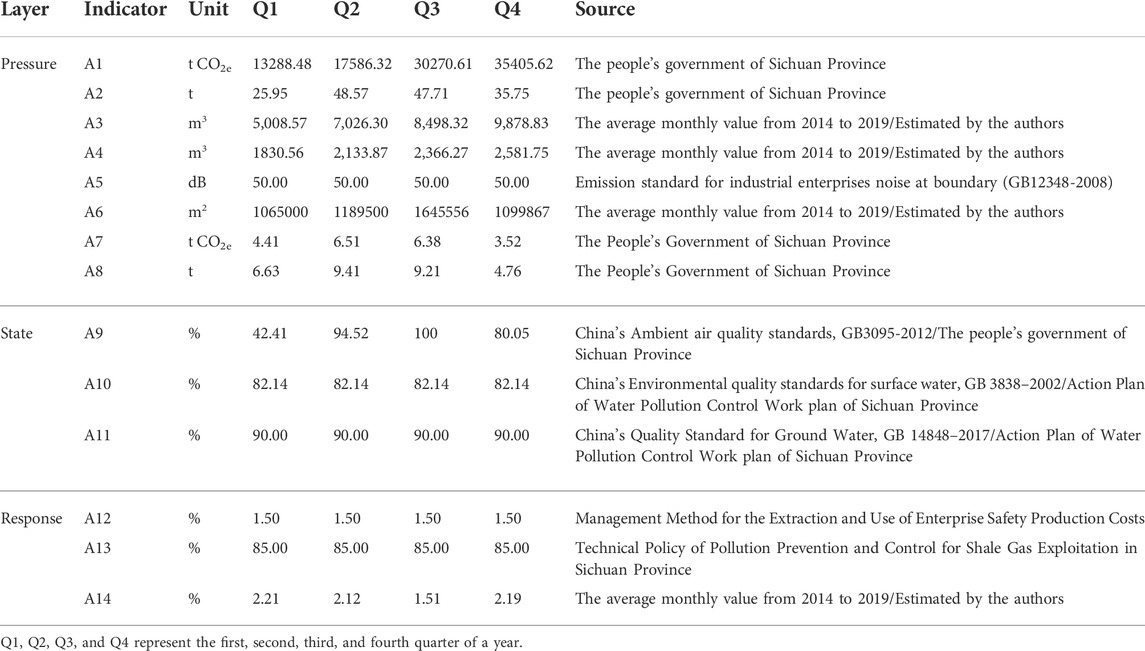
The environmental protection standards in the Changning shale gas play are given in Table 3.
5.4 Warning signals for changning play
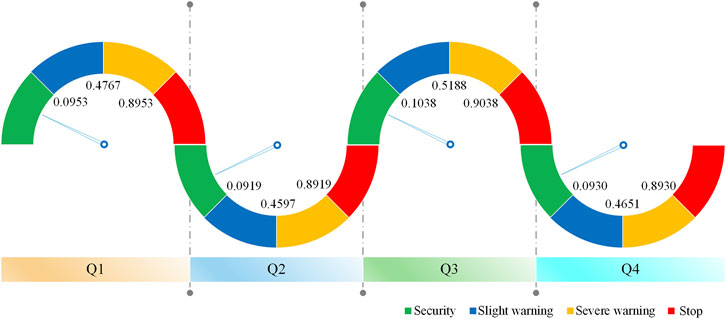
According to the CEIs shown in Figure 6 and the standards of environmental protection shown in Table 3, the warning signals are designed for Changning play by the aggregating weight method, which is shown and visualized in Figure 11.
The state of the environment is healthy when the index is below 0.0953, 0.0919, 0.1038, and 0.0930 in the first, second, third, and fourth quarters, respectively. When the index is from 0.0953 to 0.4767 and from 0.0919 to 0.4597 in the first and second quarters, respectively, it is a slight warning without substantial pollution in the process of shale gas extraction. When the index is above 0.5188 and below 0.9038 in the third quarter, the warning signal is yellow with a severe warning, which denotes serious environmental problems, the same principle applies to other quarters. Subsequently, if the index in the four quarters is above 0.8953, 0.8919, 0.9038, and 0.8930, respectively, all the projects must be stopped immediately because the catastrophic consequence would be caused with an extremely great possibility.
6 Discussion
The aggregated monthly warning indexes from 2014 to 2021 are eventually illustrated in Figure 12 based on the monthly aggregated indexes of the environment shown in Figure 10 and the warning signals for Changning play shown in Figure 11.
The blue parts of the table in the latter half of Figure 12 and the vertical blue lines in the upper half of Figure 12 denote a slight warning in the months. The yellow parts and the vertical yellow lines mean that there are some seriously negative environmental impacts, and the shale gas company and the local government agencies have to take much more effective measures and actions to alleviate and curb the bad situation. Next, we need to do the analysis and discussion in detail. We have found that the warning signals during the first month and the fifth month of 2014 were yellow. The reasons are that shale gas production in Changning play was still at an early stage at that time and the company did not take proactive actions enough to address the potential threats. As an enhancement in technology, capital, and equipment, the severe situation has been changed, and the general state of the environment was accepted without substantial pollution and sent blue signals from 2014 to 2018. Actually, the real reason might be that the output of shale gas is still limited, so that the negative effects on the local environment are controllable on the whole. However, the status quo of the environment was not always optimistic with the rapid development of shale gas and sent yellow alarms in December 2018 again. The aggregated monthly CEI has been increasing year by year since 2018, which might mean that the Changning play will face severe environmental risks and threats imposed by the shale gas acceleration.
As expected, the status of the ecological environment became worse and worse, up to eleven-times yellow alarms in 2019, which indicated that a severe warning was coming again and the environmental impacts were threatening the local ecosystem. The main reason why the state of the environment has deteriorated sharply is the great breakthrough of the large-scale development of shale gas resources in the Changning-Weiyuan national-level shale gas pilot zone after a long period of huge investments in unconventional natural gas resources. From 2016 to October 2018, it took two and a half years for the Changning shale gas play to increase by three million cubic meters. According to the development plans, the number of drilling wells in the Changning shale gas field began to increase greatly in the middle of 2018. On May 20, 2019, the daily production of the Changning shale gas block reached 10.06 million cubic meters with the faster development. In 2019, the volume of shale gas production increased to 3.486 Bcm, accounting for 43% of Petro China’s total shale gas production in Southern Sichuan. Therefore, the aggregated environmental indexes at the pressure level increased sharply due to the rapid development of shale gas, and the warning signals are all yellow except for July of 2019.
By the end of 2020, the annual output in the Changning-Weiyuan national-level shale gas pilot zone exceeded 10 Bcm to be the largest shale gas development demonstration zone in China. China is now the world’s second largest shale gas producer, making it the third country, after the United States and Canada, to have the capacity to develop shale gas commercially. Furthermore, the state-owned oil companies have made an unprecedented investment in shale gas exploration and production since the end of 2020. In August 2021, the NEA hosted a working talk on enhancing oil and gas exploration and production in Beijing once again after May 2019, which called for the domestic oil and gas producers, that is, CNPC, Sinopec, CNOOC (China National Offshore Oil Corporation), and Shaanxi Yanchang Petroleum, to continuously improve the intensity of oil and gas exploration and production and investment. The oil giants, in response to the national strategic plan, began to invest and accelerate in oil and gas, especially unconventional oil and gas, even if the oil price was very low at that time. The “unprecedented” investment in shale oil and gas resources, especially in the Changning-Weiyuan national-level shale gas pilot zone, is exacerbating the local environmental threats and challenges.
The state of the environment is not optimistic, and the environmental risks and threats are increasing month by month. The worst thing is that there are nineteen severe warnings with yellow signals from 2020 to 2021. The aggregated indexes for the first 6 months of 2021 show a declining trend, which indicates that the effort made by the company and the government achieved remarkable success. However, the state of the environment has changed and has again presented yellow warning signals since August of 2021, and the aggregated indexes are continuously rising. The negative impacts of the P-layer surpass the positive effects of the S-layer, which leads to the increase of the aggregated indexes. As for why that happened, it can be seen that the sub-indexes at the response level are not improved obviously and almost keep a straight line, which might denote that the environmental protection expenditure is not enough to deal with the negative impacts in the future. The company that is involved in shale gas development in Changning play, that is, PetroChina Southwest Oil and Gas Field Company, whose target output of shale gas production will reach 27 Bcm by 2025, will face much more serious environmental problems if they do not keep increasing concerns and expenditures. Hence, the company and the local government should take much more proactive and effective measures and actions to curb environmental deterioration.
Methane is a more potent greenhouse gas than carbon dioxide in the process of shale gas extraction, so even small emissions matter. Howarth stated that methane is a major component of the greenhouse gas footprint of shale gas and estimated that 3.6–7.9 percent of the lifetime production of a shale gas well is vented from the pipelines, wellhead, and storage facilities (Howarth and Ingraffea, 2011). However, methane leakage and emissions from natural gas industry operations are not known due to the poor quality of estimates available (Kirchgessner et al., 1997). Methane emissions from U.S. and Canadian natural gas systems appear larger than official estimates (Brandt et al., 2014). In addition, the issue of possible induced earthquakes due to shale gas extraction might be further discussed and studied since researchers or institutes hold different viewpoints. For instance, many people doubted that the 6-moment magnitude earthquake event that occurred on June 17, 2019 in Changning County might result from shale gas production, whereas the Sichuan Earthquake Administration stated that it was natural rather than induced seismic. Many international experts or professionals thought the earthquake might not be triggered in the period of shale gas production, but the controversial issue is still worth discussing and has raised the public’s concerns. Nevertheless, all the shale gas projects located in Rong County, Sichuan Province, were stopped on February 25, 2019. The debates over hydraulic fracking’s impacts on increased levels of induced seismicity are likely to endure, while the existing literature shows that it is possible to produce shale gas sustainably.
7 Conclusion
The rapid development of Chinese shale gas does have a strategic role in improving the energy mix and energy dependency in the future. The contribution made by shale gas is most likely to increase a lot thanks to “unprecedented” investment from the state-owned oil giants and better national policies in favor of its use in China. China’s “unprecedented” investment in shale gas is exacerbating ongoing negative environmental impacts. The environmental impacts and threats corresponding to shale gas production are becoming an urgent task as the state of the environment is not optimistic with the rapid expansion of shale gas production. Given that high uncertainty, nonlinearity, and complexity, this paper proposes a new hybrid PSR-FA-NAR methodology which combines the PSR framework with the NAR neural network and the FA optimization algorithm to forecast the state of the environment as well as send warning signals of the potential environmental threats to shale gas production. In the hybrid methodology, the metaheuristic optimization algorithm is applied to adjust and optimize the parameters of the NAR neural network, such as the optimal lag order and the optimal number of neurons in the hidden layer. Moreover, a practical four-tier warning system has been designed based on the standards of environmental protection in China, Sichuan province, and the Changning shale gas play, which can visually display the state of the environment in the process of shale gas production. The empirical study demonstrates that the proposed model is not only able to capture nonlinearity time-series and present cause-effect relationships, but is also able to improve the predictive performance and forecasting accuracy. The empirical results show that the FA-NAR model that can reduce the subjectivity of input network parameters is superior to the traditional NAR prediction methods in predictive performance and accuracy, while it is inferior to the NAR in computing efficiency. It is predicted that the state of the environment will become worse and worse with the rapid expansion of shale gas production in the Changning-Weiyuan national-level shale gas pilot. Changning play will predictably face severe environmental threats with a breakthrough development. Given the complexity, dynamics, and uncertainties of the state of the environment in the process of shale gas production and the high heterogeneity and intrinsic nature of shale gas plays, more empirical cases are still needed to further verify the stability and general adaptability. The state of the environment is not optimistic, mainly due to poor environmental protection expenditure and underestimated methane emissions. In any case, Chinese government agencies should pay much more attention to environmental protection and implement more strict environmental policies, even if they might constrain China’s shale gas industry to some extent. Otherwise, the status quo of the environment could not be fundamentally improved with the sharp acceleration of shale gas production.
Data availability statement
The original contributions presented in the study are included in the article/supplementary material; further inquiries can be directed to the corresponding author.
Author contributions
Conceptualization, JS; methodology, JS, WW, XM, and YY; formal analysis, JS and XS; investigation, YY and XZ; data curation, YY and XZ; writing—original draft preparation, JS and XZ; writing—review and editing, JS and YY; supervision, JS.
Funding
This work is supported by the National Natural Science Foundation of China [grant number 71801223], the Shandong Key R&D Program of Soft Sciences Research [grant number 2021RKY07131], and the Fundamental Research Funds for the Central Universities [grant number 19CX04009B].
Acknowledgments
We are also grateful for the comments and criticisms of the journal’s reviewers.
Conflict of interest
The authors declare that they have no known competing financial interests or personal relationships that could have appeared to influence the work reported in this paper.
Publisher’s note
All claims expressed in this article are solely those of the authors and do not necessarily represent those of their affiliated organizations, or those of the publisher, the editors, and the reviewers. Any product that may be evaluated in this article, or claim that may be made by its manufacturer, is not guaranteed or endorsed by the publisher.
References
Andersson-Hudson, J., Rose, J., Humphrey, M., Knight, W., and O’Hara, S. (2019). The structure of attitudes towards shale gas extraction in the United Kingdom. Energy Policy 129, 693–697. doi:10.1016/j.enpol.2019.02.056
Benmouiza, K., and Cheknane, A. (2013). Forecasting hourly global solar radiation using hybrid k-means and nonlinear autoregressive neural network models. Energy Convers. Manag. 75, 561–569. doi:10.1016/j.enconman.2013.07.003
Bilgili, F., Koçak, E., Bulut, ü., and Sualp, M. N. (2016). How did the US economy react to shale gas production revolution? An advanced time series approach. Energy 116, 963–977. doi:10.1016/j.energy.2016.10.056
Brandt, A. R., Heath, G. A., Kort, E. A., O’Sullivan, F., Pétron, G., Jordaan, S. M., et al. (2014). Energy and environment. methane leaks from North American natural gas systems. Science 343, 733–735. doi:10.1126/science.1247045
Burchard-Levine, A., Liu, S., Vince, F., Li, M., and Ostfeld, A. (2014). A hybrid evolutionary data driven model for river water quality early warning. J. Environ. Manage. 143, 8–16. doi:10.1016/j.jenvman.2014.04.017
Chang, Y., Huang, R., and Masanet, E. (2014). The energy, water, and air pollution implications of tapping China's shale gas reserves. Resour. Conserv. Recycl. 91, 100–108. doi:10.1016/j.resconrec.2014.07.015
Cheng, F., Li, T., Wei, Y., and Fan, T. (2019). The VEC-NAR model for short-term forecasting of oil prices. Energy Econ. 78, 656–667. doi:10.1016/j.eneco.2017.12.035
Chow, T. W. S., and Leung, C. (1996). Nonlinear autoregressive integrated neural network model for short-term load forecasting. IEE Proc. Gener. Transm. Distrib. 143, 500. doi:10.1049/ip-gtd:19960600
Cotton, M., and Cotton, M. (2016). Fair fracking ? Ethics and environmental justice in United Kingdom shale gas policy and planning. Local Environ. 22, 185–202. doi:10.1080/13549839.2016.1186613
Gallegos, T. J., Varela, B. A., Haines, S. S., and Engle, M. A. (2015). Hydraulic fracturing water use variability in the United States and potential environmental implications. Water Resour. Res. 51, 5839–5845. doi:10.1002/2015wr017278
Gandomi, A. H., Yang, X. S., and Alavi, A. H. (2011). Mixed variable structural optimization using Firefly Algorithm. Comput. Struct. 89, 2325–2336. doi:10.1016/j.compstruc.2011.08.002
Goos, G., Hartmanis, J., and van, L. J. (2009). “Firefly algorithms for multimodal optimization,” in 5th International Symposium, SAGA 2009, Sapporo, Japan, October 26-28, 2009 (Springer), 169–178.
Harkness, J. S., Dwyer, G. S., Warner, N. R., Parker, K. M., Mitch, W. A., and Avner, V. (2015). Iodide, bromide, and ammonium in hydraulic fracturing and oil and gas wastewaters: environmental implications. Environ. Sci. Technol. 49, 1955–1963. doi:10.1021/es504654n
Hope, C., and Parker, J. (1990). Environmental information for all. the need of a monthly inde. Energy Policy 18, 312–319. doi:10.1016/0301-4215(90)90189-B
Howarth, R. W., Ingraffea, A., and Engelder, T. (2011). Natural gas: should fracking stop? Nature 477, 271–275. doi:10.1038/477271a
Howarth, R. W., Santoro, R., and Ingraffea, A. (2011). Methane and the greenhouse-gas footprint of natural gas from shale formations. Clim. Change 106, 679–690. doi:10.1007/s10584-011-0061-5
Hu, Z., Bao, Y., Chiong, R., and Xiong, T. (2015). Mid-term interval load forecasting using multi-output support vector regression with a memetic algorithm for feature selection. Energy 84, 419–431. doi:10.1016/j.energy.2015.03.054
Hughes, J. D. (2013). A reality check on the shale revolution. Nature 494, 307–308. doi:10.1038/494307a
Ibrahim, M., Jemei, S., Wimmer, G., and Hissel, D. (2016). Nonlinear autoregressive neural network in an energy management strategy for battery/ultra-capacitor hybrid electrical vehicles. Electr. Power Syst. Res. 136, 262–269. doi:10.1016/j.epsr.2016.03.005
Imen, S., Chang, N. B., and Yang, Y. J. (2015). Developing the remote sensing-based early warning system for monitoring TSS concentrations in Lake Mead. J. Environ. Manage. 160, 73–89. doi:10.1016/j.jenvman.2015.06.003
Jackson, R., HughMeasham, T. G., Fleming, D. A., Marchese, A. J., and Sweeney, C. (2014). Energizing consensus. Science 340, 172. doi:10.1126/science.1243171
Jiang, D., Gong, J., and Garg, A. (2017). Design of early warning model based on time series data for production safety. Meas. (. Mahwah. N. J). 101, 62–71. doi:10.1016/j.measurement.2017.01.033
Kirchgessner, D. A., Lotf, R. A., Cowgiilp, R. M., Harrison, M. R., and Shires, T. M. (1997). Estimate of methane emissions from the. U.S. Nat. Gas. ind. 6535, 35. doi:10.1016/S0045-6535(97)00236-1
Lapedes, A., and Farber, R. (1987). Nonlinear signal processing using neural networks: prediction and modeling. Alamos: The UNT libraries government documents department.
Li, Y. (2015). Parameter study on firefly algorithm. Logistic Eng. 37, 195–197. doi:10.3969/j.issn1674-4993.2015.09.076
Liang, R., Tong, L., Xiang, Q., Zhuang, S., and Zhou, X. (2014). Management of and proposals on environmental impact assessment (EIA) for shale gas development in China. Nat. Gas. Ind. 34, 135–140. doi:10.3787/j.issn.1000-0976.2014.06.022
Litovitz, A., Curtright, A., Abramzon, S., Burger, N., and Samaras, C. (2013). Estimation of regional air-quality damages from Marcellus Shale natural gas extraction in Pennsylvania. Environ. Res. Lett. 8, 014017. doi:10.1088/1748-9326/8/1/014017
Liu, J., Cao, X., Zhao, L., Dong, G., and Jia, K. (2022). Spatiotemporal differentiation of land ecological security and its influencing factors: a case study in jinan, Shandong province, China. Front. Environ. Sci. 10, 1–12. doi:10.3389/fenvs.2022.824254
Loh, H. P., and Loh, N. (2016). Hydraulic fracturing and shale gas: environmental and health impacts. Switzerland: Springer International Publishing.
MacKay, D., and Stone, T. (2013). Potential greenhouse gas emissions associated with shale gas production and use. Resour. Energy Econ. Available at: https://www.gov.uk/government/publications/potential-greenhouse-gas-emissions-associated-with-shale-gas-production-and-use. (Accessed September 9, 2013).
Mahmoud, T. S., Habibi, D., Hassan, M. Y., and Bass, O. (2015). Modelling self-optimised short term load forecasting for medium voltage loads using tunning fuzzy systems and Artificial Neural Networks. Energy Convers. Manag. 106, 1396–1408. doi:10.1016/j.enconman.2015.10.066
Mandal, P., Haque, A. U., Meng, J., Srivastava, A. K., and Martinez, R. (2013). A novel hybrid approach using wavelet, firefly algorithm, and fuzzy ARTMAP for day-ahead electricity price forecasting. IEEE Trans. Power Syst. 28, 1041–1051. doi:10.1109/TPWRS.2012.2222452
McKenzie, S., Granger, C. W. J., and Terasvirta, T. (1995). Modelling nonlinear economic relationships. J. Am. Stat. Assoc. 90, 1491. doi:10.2307/2291548
Melikoglu, M. (2014). Shale gas: Analysis of its role in the global energy market. Renew. Sustain. Energy Rev. 37, 460. doi:10.1016/j.rser.2014.05.002
Navarette, M., Chorn, L., and Maucec, M. (2014). A holistic approach to the development stage of shale gas resources. International Petroleum Technology Conference, Doha, Qatar.
Panda, C., and Narasimhan, V. (2007). Forecasting exchange rate better with artificial neural network. J. Policy Model. 29, 227–236. doi:10.1016/j.jpolmod.2006.01.005
Qi, M., and Zhang, G. P. (2001). An investigation of model selection criteria for neural network time series forecasting. Eur. J. Oper. Res. 132, 666–680. doi:10.1016/S0377-2217(00)00171-5
Rahm, D. (2011). Regulating hydraulic fracturing in shale gas plays: the case of Texas. Energy Policy 39, 2974–2981. doi:10.1016/j.enpol.2011.03.009
Roy, A. A., Adams, P. J., and Robinson, A. L. (2014). Air pollutant emissions from the development, production, and processing of Marcellus Shale natural gas. J. Air Waste Manag. Assoc. 64, 19–37. doi:10.1080/10962247.2013.826151
Rutqvist, J., Rinaldi, A. P., Cappa, F., and Moridis, G. J. (2013). Modeling of fault reactivation and induced seismicity during hydraulic fracturing of shale-gas reservoirs. J. Pet. Sci. Eng. 107, 31–44. doi:10.1016/j.petrol.2013.04.023
Saaty, T. L. (1990). How to make a decision: The analytic hierarchy process. Eur. J. Oper. Res. 48, 9–26. doi:10.1016/0377-2217(90)90057
Shirzaei, M. (2016). Surface uplift and time-dependent seismic hazard due to fluid injection in eastern Texas. Science 353, 2118–2122. doi:10.1130/abs/2016am-282140
Shuling, C. A. I., Erbing, L. I., Liang, C., Lei, G. A. O., Shikun, P. U., and Jianli, D., et al. (2019). The time series prediction of tunnel surrounding rock deformation based on FA-NAR dynamic neural network. Chines. J. Rock Mech. Eng.. 38, 3346–3353. doi:10.13722/j.cnki.jrme.2018.0757
Stamford, L., and Azapagic, A. (2014). Life cycle environmental impacts of UK shale gas. Appl. Energy 134, 506–518. doi:10.1016/j.apenergy.2014.08.063
Streich, R., Becken, M., and Ritter, O. (2010). Imaging of CO2 storage sites, geothermal reservoirs, and gas shales using controlled-source magnetotellurics: modeling studies. Geochemistry 70, 63–75. doi:10.1016/j.chemer.2010.05.004
Sun, J., Zhang, Z., and Sun, X. (2016). The intelligent crude oil anti-theft system based on IoT under different scenarios. Procedia Comput. Sci. 96, 1581–1588. doi:10.1016/j.procs.2016.08.205
Sun, J., Zhu, X., and Sun, X. (2020). Assessment and forecasting of eco-environmental early-warning system for shale gas production in a pressure-state-response framework. Energy Sources Part A Recovery Util. Environ. Eff. 8, 1–20. doi:10.1080/15567036.2020.1826019
Sun, R., and Wang, Z. (2015). A comprehensive environmental impact assessment method for shale gas development. Nat. Gas. Ind. B 2, 203–210. doi:10.1016/j.ngib.2015.07.012
Tealab, A., Hefny, H., and Badr, A. (2017). Forecasting of nonlinear time series using ANN. Future Comput. Inf. J. 2, 39–47. doi:10.1016/j.fcij.2017.05.001
Vengosh, A., Jackson, R. B., Warner, N., Darrah, T. H., and Kondash, A. (2014). A critical review of the risks to water resources from unconventional shale gas development and hydraulic fracturing in the United States. Environ. Sci. Technol. 48, 8334–8348. doi:10.1021/es405118y
Vidic, R. D., Brantley, S. L., Vandenbossche, J. M., Yoxtheimer, D., and Abad, J. D. (2013). Impact of shale gas development on regional water quality. Science 340, 1235009. doi:10.1126/science.1235009
Wang, C., Wang, F., Du, H., and Zhang, X. (2014). Is China really ready for shale gas revolution—Re-Evaluating shale gas challenges. Environ. Sci. Policy 39, 49–55. doi:10.1016/j.envsci.2014.02.007
Wang, H., Wang, W., Cui, Z., Zhou, X., Zhao, J., Li, Y., et al. (2018). A new dynamic firefly algorithm for demand estimation of water resources. Inf. Sci. (N. Y). 438, 95–106. doi:10.1016/j.ins.2018.01.041
Wang, Q., and Zhan, L. (2019). Assessing the sustainability of the shale gas industry by combining DPSIRM model and Raga-PP techniques: an empirical analysis of Sichuan and Chongqing, China. Energy 176, 353–364. doi:10.1016/j.energy.2019.03.158
Wang, S. (2018). Shale gas exploitation: status, problems and prospect. Nat. Gas. Ind. B 5, 60–74. doi:10.1016/j.ngib.2017.12.004
Wang, X., Lin, M., Ding, Z., Zhou, Y., Wang, C., and Chen, J. (2020). Ecological health assessment of Kaikong River Basin based on automatic screening of indicators in Xinjiang. Acta Ecol. Sin. 40, 4302–4315. doi:10.5846/stxb201911142415
Wolfslehner, B., and Vacik, H. (2008). Evaluating sustainable forest management strategies with the Analytic Network Process in a Pressure-State-Response framework. J. Environ. Manage. 88, 1–10. doi:10.1016/j.jenvman.2007.01.027
Xing, W., Zhang, Y., and Wu, S. (2016). Quantitative evaluation model of ecological environment influence on shale gas development. China Popul. Environ. 26, 137–144. doi:10.3969/j.issn.1002-2104.2016.07.017
Yolcu, U., Egrioglu, E., and Aladag, C. H. (2013). A new linear & nonlinear artificial neural network model for time series forecasting. Decis. Support Syst. 54, 1340–1347. doi:10.1016/j.dss.2012.12.006
Yu, L., Wang, S., and Lai, K. K. (2009). A neural-network-based nonlinear metamodeling approach to financial time series forecasting. Appl. Soft Comput. 9, 563–574. doi:10.1016/j.asoc.2008.08.001
Yuan, X., Ma, R., Zuo, J., and Mu, R. (2016). Towards a sustainable society: the status and future of energy performance contracting in China. J. Clean. Prod. 112, 1608–1618. doi:10.1016/j.jclepro.2015.07.057
Zeng, Y., Zhang, Z., and Kusiak, A. (2015). Predictive modeling and optimization of a multi-zone HVAC system with data mining and firefly algorithms. Energy 86, 393–402. doi:10.1016/j.energy.2015.04.045
Zhang, G. P., Patuwo, B. E., and Hu, M. Y. (2001). A simulation study of artificial neural networks for nonlinear time-series forecasting. Comput. Oper. Res. 28, 381–396. doi:10.1016/s0305-0548(99)00123-9
Zhang, L., Mistry, K., Lim, C. P., and Neoh, S. C. (2018). Feature selection using firefly optimization for classification and regression models. Decis. Support Syst. 106, 64–85. doi:10.1016/j.dss.2017.12.001
Zhou, D., Lin, Z., Liu, L., and Zimmermann, D. (2013). Assessing secondary soil salinization risk based on the PSR sustainability framework. J. Environ. Manage. 128, 642–654. doi:10.1016/j.jenvman.2013.06.025
Keywords: shale gas, sustainability, environmental impacts, PSR framework, NAR neural network, FA optimization algorithm
Citation: Sun J, Yu Y, Wang W, Zhu X, Ma X and Sun X (2022) The PSR-FA-NAR model for assessing and forecasting environmental impacts: An empirical analysis of Changning–Weiyuan shale gas play in China. Front. Environ. Sci. 10:965728. doi: 10.3389/fenvs.2022.965728
Received: 10 June 2022; Accepted: 30 June 2022;
Published: 26 July 2022.
Edited by:
Shuhong Wang, Shandong University of Finance and Economics, ChinaCopyright © 2022 Sun, Yu, Wang, Zhu, Ma and Sun. This is an open-access article distributed under the terms of the Creative Commons Attribution License (CC BY). The use, distribution or reproduction in other forums is permitted, provided the original author(s) and the copyright owner(s) are credited and that the original publication in this journal is cited, in accordance with accepted academic practice. No use, distribution or reproduction is permitted which does not comply with these terms.
*Correspondence: Jinfeng Sun, c3VuamluZmVuZzEyM0B1cGMuZWR1LmNu
 Jinfeng Sun
 Yu Yu1
 Xiaohu Ma