Corrigendum: Spatial and temporal characteristics of surface solar radiation in China and its influencing factors
 Hongmei Jin1,2
 Pengcheng Yan
 Liang Qiao
- 1Gansu Meteorological Information and Technical Equip Safeguard Center, Gansu Meteorological Bureau, Lanzhou, China
- 2Lanzhou Resources & Environment Voc-Tech University, Key Laboratory of Climate Resources Utilization and Disaster Prevention and Mitigation of Gansu Province, Lanzhou, China
- 3Institute of Arid Meteorology of CMA, Key Open Laboratory of Arid Climatic Change and Disaster Reduction of CMA, Key Laboratory of Arid Climatic Change and Reducing Disaster of Gansu Province, Lanzhou, China
- 4Department of Atmospheric and Oceanic Sciences/Institute of Atmospheric Sciences, Fudan University, Shanghai, China
The total-sky direct solar radiation at Earth’s surface (SRS) not only has an important impact on the earth’s climate and ecology, but also is a crucial parameter for solar photovoltaic power. SRS determines whether photovoltaic power plants can be built in the region and directly affects the efficiency of photovoltaic power generation. Therefore, the spatial and temporal distribution characteristics of SRS have a very important guiding significance for the construction of photovoltaic power stations. This study discusses the temporal and spatial characteristics of SRS and its influencing factors in China during 1961–2020 using ERA5 data and the empirical orthogonal function (EOF), rotated empirical orthogonal function (REOF), and ensemble empirical model decomposition (EEMD) methods. Our investigation reveals that the high-value SRS center is located on the southwestern Tibetan Plateau, while the low-value center occurs on the northeastern Yunnan–Guizhou Plateau and in the Sichuan Basin. Seasonal variability in SRS means that maximum values occur uniformly in summer, followed sequentially by spring, autumn, and winter. The spatial distribution of the leading SRS EOF mode exhibits a dipole pattern between the southern Tibetan Plateau and other regions. Combined with the time series, SRS in China underwent an interdecadal transition around the year 2000. The regression analysis shows that this pattern is mainly affected by surface air temperature, total precipitation, relative humidity and cloud cover. The time series evolution of SRS primarily reflects the interannual variability in annual-mean and four seasons; the variance contributions of decadal variability and secular trend are minor through the EEMD. The REOF separates Chinese SRS into 11 central regions, the top 5 being the western Tibetan Plateau, western Northwest China, the eastern Tibetan Plateau, northern Xinjiang, and North China. The relationship between SRS and meteorological parameters shows that SRS is positively correlated with surface air temperature and wind speed but negatively correlated with total precipitation, relative humidity, low and total cloud cover, and aerosol concentrations.
Introduction
Solar radiation is the dominant source of energy received by Earth’s surface, where it not only constitutes a valuable source of renewable energy for use by humans but also plays a driving role in global climate (Dickinson and Cheremisinoff, 1980; Yan et al., 2014; Huang et al., 2017). Climate change is closely related to the solar radiation reaching Earth’s surface; changes in insolation directly affect surface temperature, and in turn evaporation, hydrology, human living environments, and ecosystem. Consequently, spatial and temporal variability in solar radiation also influences the distribution of all climate-related resources (Wu et al., 2009; You et al., 2013; Wang, 2015; Jin et al., 2019; Zhang et al., 2020). As the primary energy source for biological, physical, and chemical processes at Earth’s surface, solar radiation plays a central role in local climate and the development of plant communities and forms a key parameter in numerical models simulating the land surface, hydrology, ecology, climate, and environment. Ultimately, a robust understanding of solar radiation is vital to these research fields (Meza and Varas, 2000; Winslow et al., 2001; Zhou et al., 2012; Blanka et al., 2017; Huang et al., 2017; Guan et al., 2018). To support the development and utilization of solar energy resources, it is first necessary to critically assess the distribution and variability of solar energy resources (Xu et al., 2010). As an essential input parameter for net primary productivity of vegetation, the accuracy and quantitative evaluation of solar radiation can help refine our knowledge of regional and global carbon cycles (Zhang et al., 2020).
To accurately evaluate the nature of solar energy resources throughout China, we first need to understand the spatial and temporal distribution characteristics of solar radiation (He et al., 2003; Huang et al., 2017). In their study of regional insolation characteristics, Wen et al. (2008) employed ground radiation observational data collected by 122 radiation stations throughout China between 1961 and 2000 to study the regional characteristics of solar radiation in China. Similarly, Li et al. explored spatial and temporal variability in surface solar radiation, and the factors influencing this variability, in China for the period 2003–2012. The results of both studies indicate that insolation is highest on the Tibetan Plateau and lowest in the Sichuan Basin, and suggest that the receipt of solar radiation in China is impacted by both seasonal and interannual variations. Meanwhile, Yang et al. (2007) analyzed monthly averaged total radiation data from sixty stations in mainland China between 1961 and 2002. They observed that most stations reported a declining trend over the 40-year period, with the decline being significantly greater in eastern regions than in the west. More recently, Tao et al. (2016) proposed that spatial variability in seasonal trends of total solar radiation varies considerably throughout China, and Qi et al., 2014, Qi et al. (2015) implicated aerosol pollution arising from urbanization and industrialization in the observed insolation decrease. As the primary factor is the dispersal of atmospheric pollutants, wind plays a central role in the impact of tropospheric haze on insolation levels. This relationship supports the model that air pollution is an increasingly important driver of changes in surface solar radiation, especially in eastern China. Climatically, Shen and Wang, 2011 reported that observed changes in surface solar radiation have played a significant role in climate change in southeast China over the past 50 years. Where radiation increased, average surface air temperatures have also risen, and vice versa.
A key limitation of the existing body of research is that most studies are based on short time series of comparatively low temporal and spatial resolution. At present, there are few studies of Chinese insolation spanning more than a few decades and utilizing high-resolution radiation data. To help address this shortcoming, we utilized total-sky direct solar radiation data derived from ERA5 reanalysis for the period 1961–2020 to 1) analyze the spatial and temporal distribution characteristics of solar radiation throughout China and 2) identify the factors influencing these characteristics. Our overarching goal in this research is to deliver valuable new insight into the effective development of solar energy resources in China and scientific support for the siting of photovoltaic power stations, both of which are vital to growing the viability of clean energy, helping China achieve carbon neutrality, and slowing the rate of global warming.
Data and methods
Data
ERA5 is the most up to date set of global atmospheric, land, and oceanic reanalysis products derived from the European Centre for Medium-Range Weather Forecasts (Hersbach et al., 2020). In this paper, we used ERA5 monthly total-sky direct solar radiation at the surface (SRS) data, with a spatial resolution of 0.25° × 0.25°, for the period 1961–2020. Specifically, these data are used to represent atmospheric forcing in the land surface model and thus have key applications in regional climate assessment, agriculture, and solar energy resources. Zhang et al. (2021) evaluated ERA5 surface-received solar radiation data on multiple spatio-temporal scales and demonstrated the suitability of this dataset for mainland China.
Methods
We applied linear least-squares regression to analyze trends in SRS variability, and the empirical orthogonal function (EOF) to evaluate SRS temporal and spatial variation characteristics. In addition, we used ensemble empirical model decomposition (EEMD) to decompose the SRS time series into specific oscillation components for various timescales (Wu and Huang, 2009) and the rotated empirical orthogonal function (REOF) to divide spatial distribution characteristics for China. Finally, the spatial distribution of the correlation between SRS and other meteorological variables affords a means for assessing the influence of each variable on SRS in different regions.
The EOF method is an effective tool for decomposing climatic variable fields into a space field and time period, and the EOF method has been widely used in climate diagnosis (Dommenget and Latif, 2002; Fan et al., 2011; Li and Xie, 2014; Zuo et al., 2018; Qiao et al., 2022). Building on EOF, REOF applies rotation technology to also realize the climate variable field. Rotation serves to reveal typical spatial structures that can reflect not only changes among different regions, but also the relevant distribution of those regions. REOF is a widely used method for investigating meteorological elements in different regions (Li et al., 1997; Zhang et al., 2016).
The EEMD method is a relatively new, self-adaptive time series analysis technique that is suitable for analyzing nonlinear and non-stationary datasets (e.g., climate data). Specifically, EEMD decomposes a complex time series into finite oscillation components on different time scales, thereby permitting the analysis of meteorological elements. The advantage of EEMD is that, rather than relying on other functions, time series decomposition is based on the adaptive filtering of the data themselves. By adding an appropriate degree of white noise to the original data to simulate multiple observation scenarios, and through multiple calculations, realistic results can be derived from the ensemble average (Qian et al., 2012). In recent years, the EEMD method has been applied widely in climate change research (Franzke 2010; Qian et al., 2011; Gao et al., 2015; Cornes et al., 2017; Zhang et al., 2018; Zuo et al., 2018; Thomas et al., 2020). In the current study, we employed EEMD to analyze SRS time series throughout China.
Results
SRS variation characteristics on multiple time scales
To explore the spatial distribution characteristics of SRS in China, we analyzed the climatic state of SRS (W/m2; Figure 1) for the period 1961–2020 from ERA5 monthly dataset. According to the annual-mean SRS (Figure 1A), the highest SRS values occur in western China, with a maximum over the southwest Tibetan Plateau, whereas the lowest values occur in the east and are centered on the northeastern Yunnan–Guizhou Plateau and in the Sichuan Basin. With an average elevation of >4,000 m, the Tibetan Plateau is the highest in the world. We note that maximum SRS values coincide with the highest parts of this plateau, where the thin, dry nature of the air column results in high atmospheric transparency and minimal scattering of incoming shortwave radiation. The Tibetan Plateau also experiences generally clear conditions, thereby enhancing the receipt of solar radiation. In contrast, the Yunnan–Guizhou Plateau and Sichuan Basin experience a monsoonal climate that, during the rainy season, results in high rainfall, cloudy days, and less direct sunshine, all of which serve to reduce surface insolation.
FIGURE 1
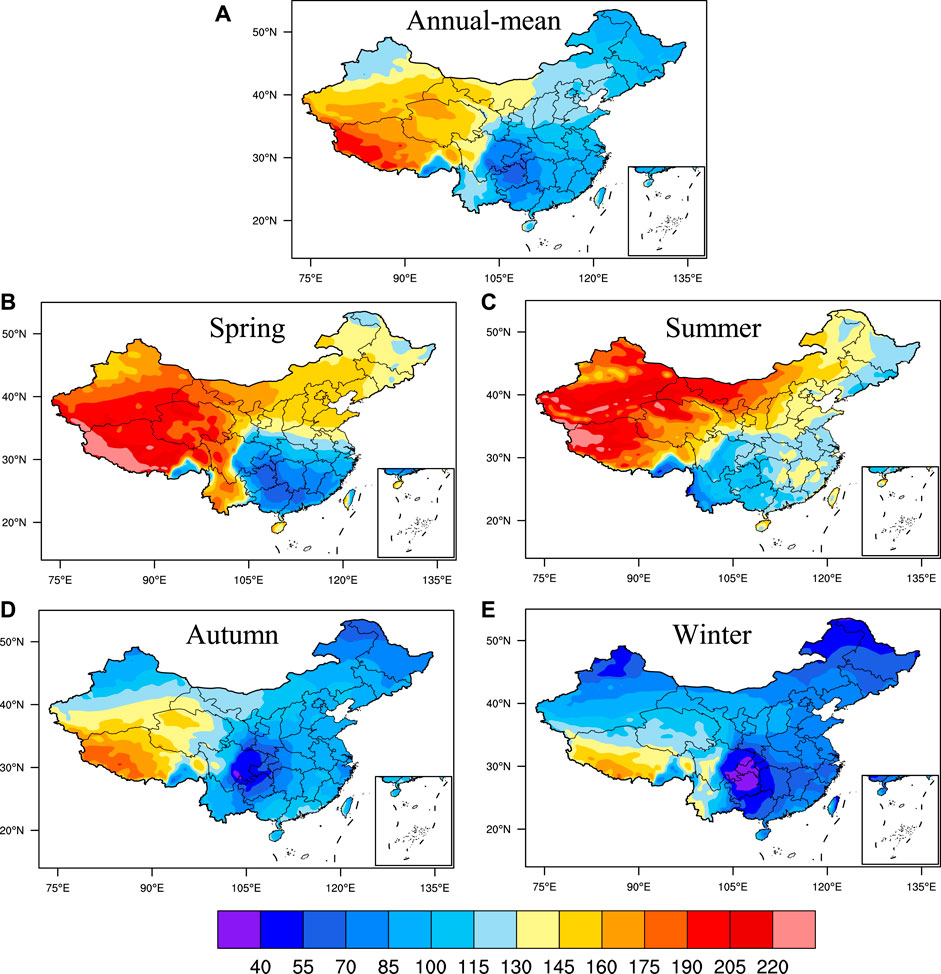
FIGURE 1. Spatial distribution of SRS (W/m2) climate states in China during the period 1961–2020. (A) is annual-mean, (B) is spring, (C) is summer, (D) is autumn, and (E) is winter.
To explore the spatial distribution of SRS characteristics further (Figures 1B–E), we next defined the mean value for December–February as winter, the mean March–May value as spring, the mean June–August value as summer, and the mean September–November value as autumn. Recognizing that the spatial distribution of SRS during different seasons is broadly similar to the annual-mean, there are nonetheless several clear differences among them. On the whole, summer exhibits the highest SRS value, followed by spring, autumn, and winter. This general pattern confirms that the receipt of solar radiation at the surface is greatest in summer and weakest in winter, reflecting China’s position in the Northern Hemisphere. We also note that during both spring and summer, SRS in northwest China increased considerably relative to the annual-mean. In summertime especially, the center of maximum values underwent a significant expansion and northward shift, a pattern that was accompanied by drought and generally clear sky over northwest China.
We used least-squares linear regression to analyze trends in SRS (W/m2/decade) between 1961 and 2020 (Figure 2). In terms of annual-mean SRS, positive trends occurred in Northeast China, North China, Southwest China, South China, and Xinjiang, with a high value center located in Yunnan. Conversely, the Tibetan Plateau exhibited a generally negative trend; the low value center is located in central Sichuan. SRS trends vary considerably by season. In spring, SRS increases over most parts of China except the Tibetan Plateau, with the highest values observed in North China, eastern Central China, and Eastern China. During summer, SRS declines throughout most regions, with the exception of northeast China, Hebei, northern Xinjiang, Yunnan, and South China. The lowest value centers during that season are located primarily on the northwest Tibetan Plateau and in East China. SRS trends in autumn and winter are weak, with the highest values centered on Yunnan. Overall, the degree of variability among SRS trends is greatest in spring and summer, with significant springtime increases in eastern China followed by decreasing trends in most areas during summer. We note that the Tibetan Plateau, with the highest overall SRS values, exhibits negative trends in both spring and summer. Meanwhile, SRS trends in Yunnan and Northeast China were positive in all four seasons.
FIGURE 2
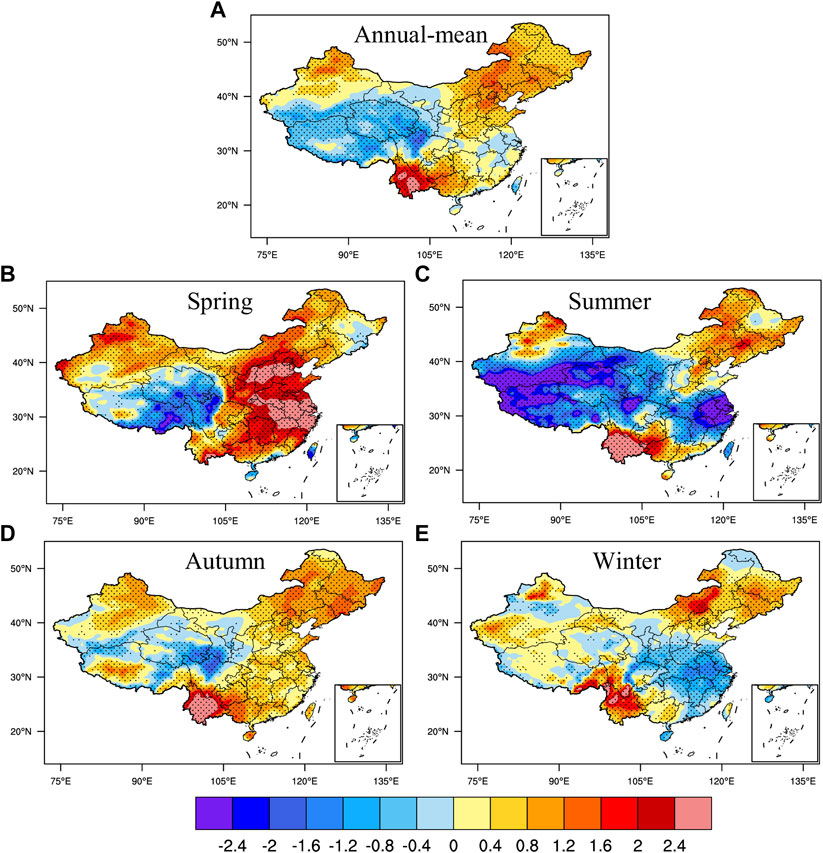
FIGURE 2. Same as in Figure 1, but for trends in SRS (W/m2/decade). (A) is annual-mean, (B) is spring, (C) is summer, (D) is autumn, and (E) is winter.
To investigate SRS stability between 1961 and 2020, we analyzed the spatial distribution of the SRS standard deviation (W/m2; Figure 3). Our results show that the annual-mean standard deviation decreases gradually from southeast to northwest, a pattern that is mirrored by all four seasonal trends. The center of maximum SRS standard deviation is located generally in Eastern China during spring and summer, but shifts towards Southern China during summer and autumn. This behavior indicates that SRS in Southeast China exhibits a greater degree of variability relative to SRS in northwest and northeast regions, a pattern that is consistent with the respective meteorologic and climatic characteristics of each regions. For instance, occupying a relatively interior position, Northwest China is largely unaffected by monsoon circulation and consequently experiences dry, sunny conditions and minor variability in the receipt of solar radiation. Southeast China, in contrast, is dominated by the East Asian monsoon, which brings heavy rainfall and results in a greater degree of insolation variability.
FIGURE 3
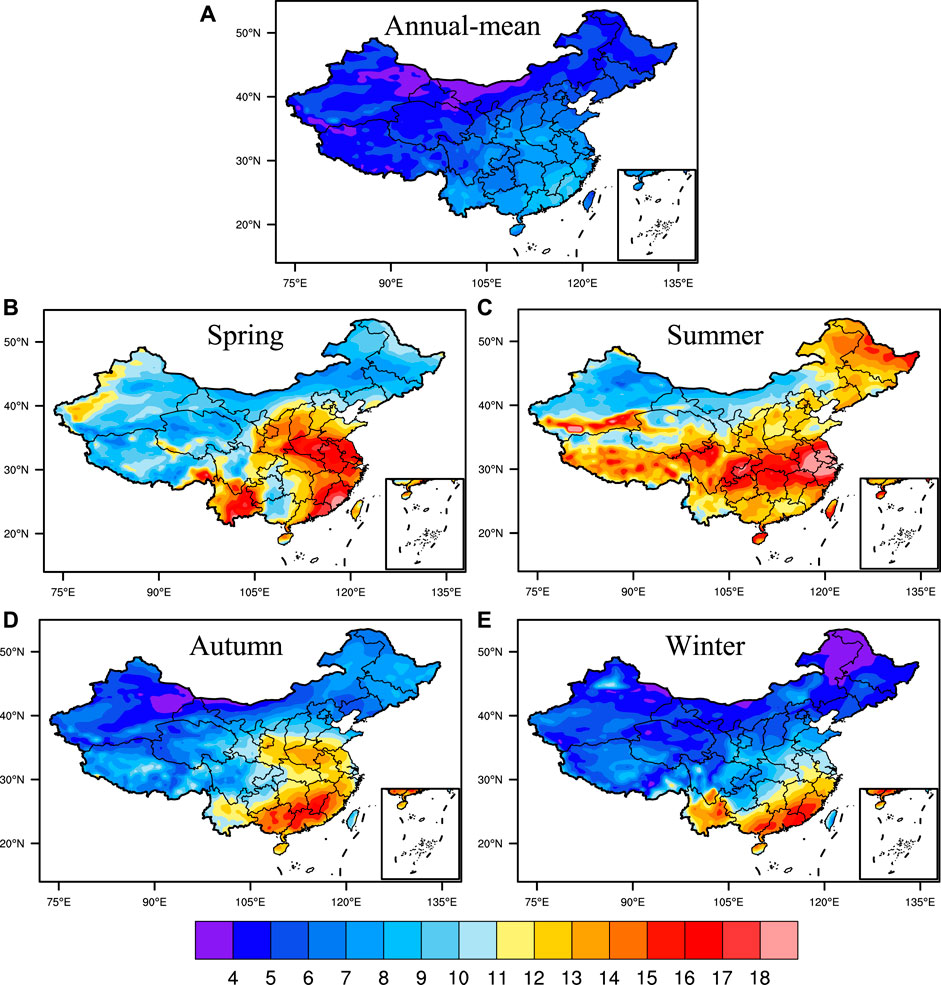
FIGURE 3. Same as in Figure 1, but for the standard deviation of SRS (W/m2). (A) is annual-mean, (B) is spring, (C) is summer, (D) is autumn, and (E) is winter.
Using EOF, we decomposed annual-mean and seasonal SRS values for the 1961–2020 study period to explore spatio-temporal variations throughout China, with a specific focus on the first two modes (Figure 4). For annual-mean SRS, the explained variances of the first and second modes are 26.4 and 11.9%, respectively. The spatial distribution of the first EOF mode exhibits a dipole pattern between the southern Tibetan Plateau and other regions, with the center of highest values located in Central China. Combined with the time period to the first mode, it can be seen that the first mode is mainly reflected in the interdecadal variation characteristics, and SRS in China showed an obvious interdecadal transition around year 2000, when the periodicity changed from its negative to positive phase. In other words, with the exception of the southern Tibetan Plateau, most of China was dominated by negative anomalies prior to 2000, after which the opposite pattern was established. The spatial distribution of the second EOF mode is bounded by 32°N, with the negative phase dominating the southeast region and positive phase elsewhere. This time series primarily reflects interannual variability.
FIGURE 4
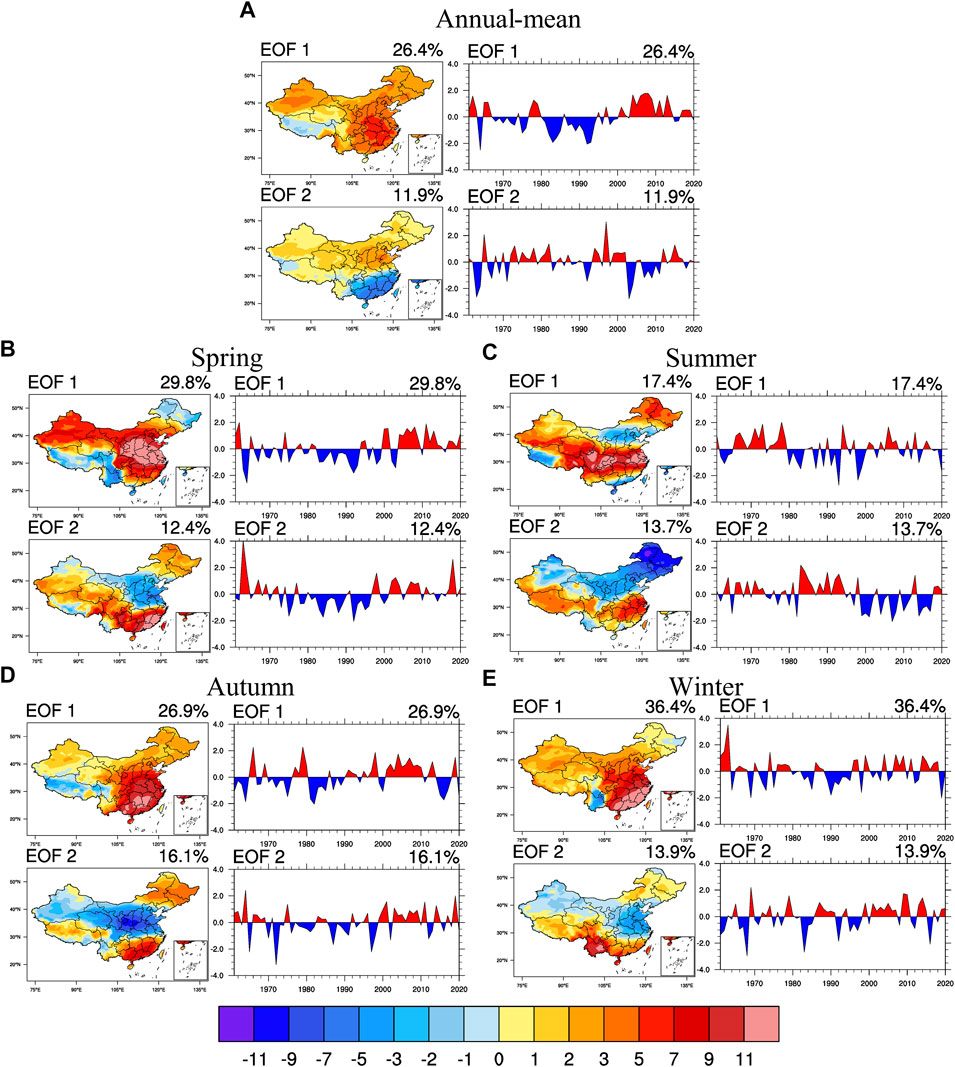
FIGURE 4. EOF decomposition of SRS in China from 1961 to 2020. (A) is annual-mean, (B) is spring, (C) is summer, (D) is autumn, and (E) is winter.
Figures 4B–E depicts the results of EOF analysis of SRS during different seasons. During spring, the explained variances of the first and second EOF modes are 29.8 and 12.4%, respectively. Moreover, the spatial distribution of first mode exhibits a “negative–positive–negative” tripole pattern extending from northeast to southwest, by which Northeast (Heilongjiang, Inner Mongolia) and Southwest China (Tibet, Sichuan, Yunnan) experience the negative phase, while other regions experience the positive phase. The corresponding high-value centers are expansive and include most of Central and Eastern China. During spring, the time period of the first mode exhibits an obvious interdecadal transition around the year 2000, when the negative phase was replaced by the positive phase. The spatial distribution of the second mode reveals a similar springtime tripole pattern but in reverse (“positive–negative–positive”). In this mode, the majority of North China, central and northern East China, central and northern Central China, and northern Northwest China experience the negative phase, while the remaining regions are largely positive. The time period of the second mode is similar to that of the first mode, including the marked transition around the year 2000.
During summer, the explained variances of the first and second EOF modes are 17.4 and 13.7%, respectively. These values are the smallest of the four seasons, indicating that the corresponding SRS mode is more complex and changeable in summer. As is evident from the spatial distribution of EOF1, the negative phase dominates in southwest Tibet, southeast coastal areas, and North China, whereas other regions are characterized by the positive phase. We also note that the time period of variability is interannual. The spatial distribution of summertime EOF2 exhibits a meridional dipole pattern, and the time period is mainly characterized by interdecadal variation. There was an obvious shift from the positive to negative phase occurred around 1998. During autumn, the explained variance of the first and second EOF modes are 26.9 and 16.1%, respectively. The spatial distribution of the first mode reveals that, with the notable exception of Tibet, China experiences a generally positive phase with positive centers located in Hunan and Jiangxi. The autumn time period in EOF1 is dominated by interannual variability. The spatial distribution of the second mode displays a northeast–southwest “positive–negative–positive” tripole pattern, and the time period is mainly interannual. The explained variances of the first and second EOF mode in winter are 36.4 and 13.9%, respectively, and are the highest values of the four seasons. Our results indicate that the spatial distribution of the first mode is largely positive phase, and the time period is interannual variation. The spatial distribution of the second mode exhibits a “negative–position–negative” tripole pattern from northeast to southwest, and the time period is primarily interannual.
The EEMD method is used to decompose the SRS time series into specific oscillation components on different time scales (Figure 5 and Table 1). Here, the annual-mean and seasonal time series can be decomposed into four intrinsic mode functions (IMFs) and a residual secular trend (ST). For both the annual-mean and seasonal IMF1, the periods are 2–3 years, and the variance contributions (33.0%–56.3%) that are greatest with other IMFs and ST. This outcome indicates that the Chinese SRS time series are dominated by a 2–3-years variability, and also that the amplitude of summertime IMF1 increased significantly after 1990. Both the annual-mean and four-season series exhibit similar periods in IMFs and ST, namely 5–15 years under IMF2, 10–15 years under IMF3, and 21–32 years under IMF4. Of these, the variance contribution of IMF4 accounts for the smallest proportion in all time scales. In terms of the interdecadal change characteristics, we note that the annual-mean, spring, summer, and autumn series all display phase changes from negative phase to positive phase during the period 1995–2000, consistent with the interdecadal EOF transition described above. Meanwhile, ST exhibits a long-term trend in both annual-mean and four-season time series, with relatively minor variance contributions. Both the annual-mean and autumn ST reveal a long-term increasing trend, whereas the summer ST is relatively weak. During spring and winter, ST exhibited an initial decrease and subsequent increase, with a clear phase transition from negative to positive in 2000. Finally, results of the EEMD method confirm that SRS time series for China display a predominantly interannual variability (at least between 1961-2020), consistent with the periodicity of the principal EOF mode.
FIGURE 5
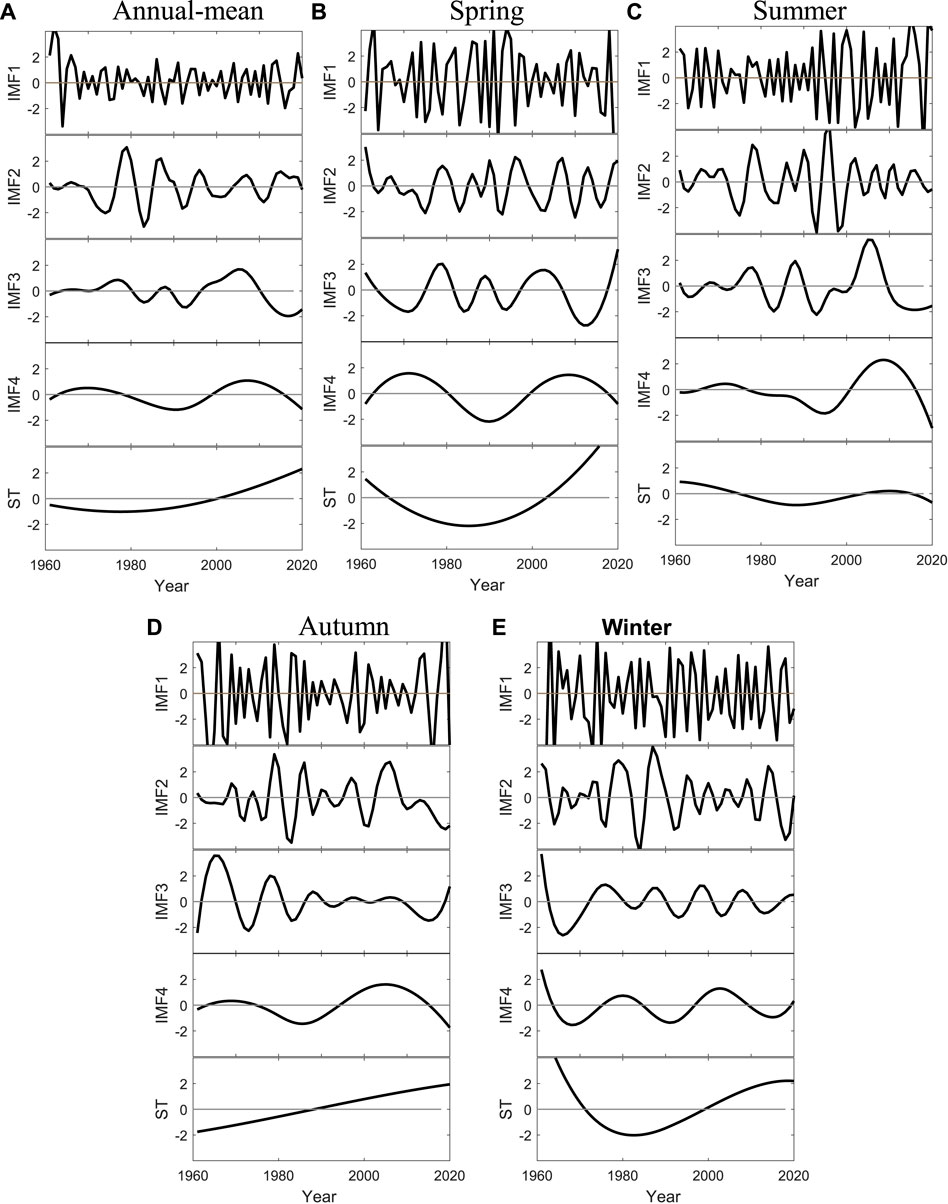
FIGURE 5. EEMD decomposition of SRS time series throughout China from 1961 to 2020. (A) is annual-mean, (B) is spring, (C) is summer, (D) is autumn, and (E) is winter.
TABLE 1
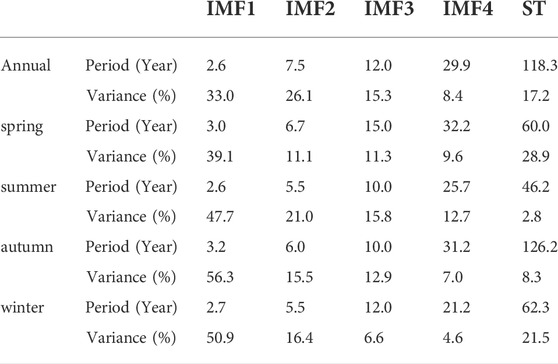
TABLE 1. Periods and variance contributions in different timescales for the annual-mean and four seasons through the EEMD decompositions.
Meteorological factors influencing SRS
Representing the total direct solar radiation received at Earth’s surface, SRS is impacted not only by seasonal insolation variability and solar activity but also by weather conditions (e.g., cloud cover and atmospheric transparency). Therefore, we conducted correlation analyses between annual-mean SRS and key meteorological factors, namely surface air temperature (SAT), surface air pressure, total precipitation, relative humidity, low cloud cover, total cloud cover, 10-m wind speed, and aerosol content, to establish which factors exert the strongest influence on SRS in various regions. Figure 6 displays the spatial distribution of correlation coefficients between annual mean SRS and each meteorological element. We note that, although solar radiation is directly impacted by aerosols, the ERA5 dataset does not include aerosol variables (e.g., aerosol optical thickness, atmospheric turbidity). To circumvent this limitation, we calculated the clear sky index:
FIGURE 6
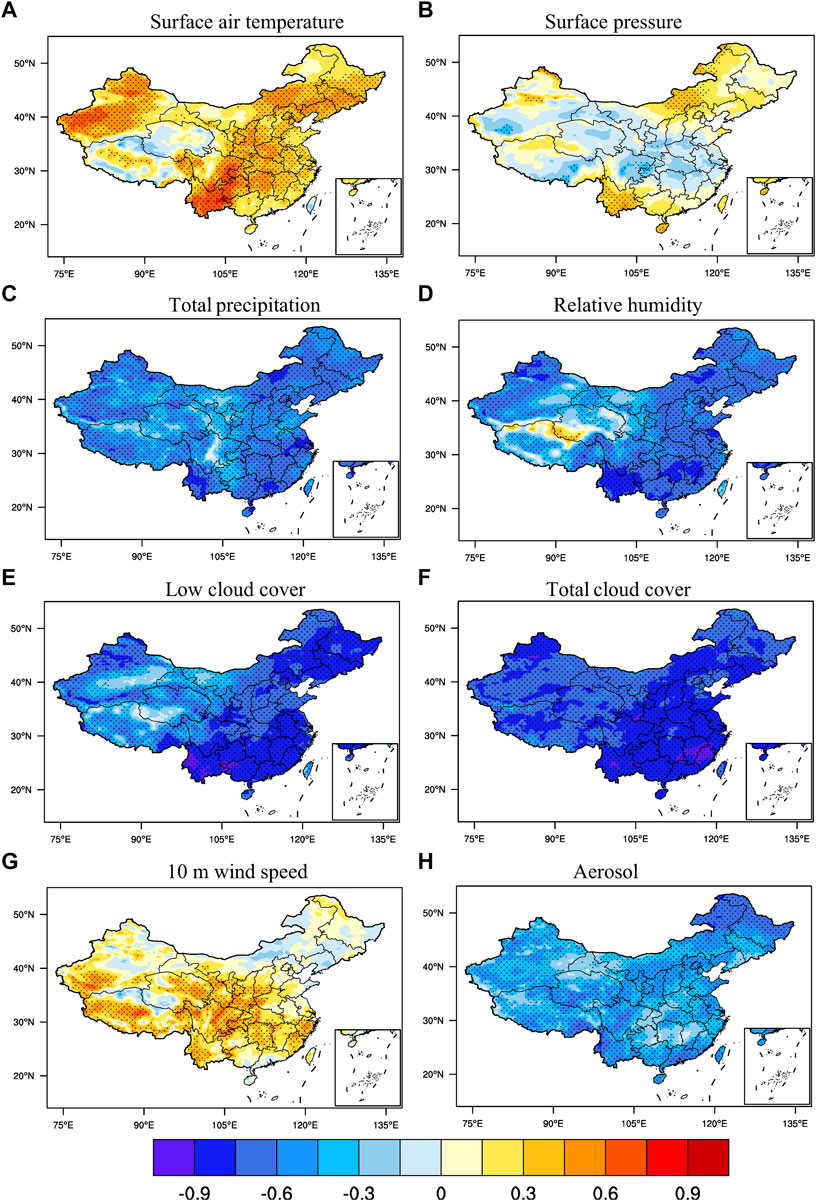
FIGURE 6. Spatial distributions of correlation coefficients between SRS and meteorological elements during the period 1961–2020. (A) is SAT, (B) is surface pressure, (C) is total precipitation, (D) is relative humidity, (E) is low cloud cover, (F) is total cloud cover, (G) is 10 m wind speed, and (H) is aerosol. Black dots indicate where a given area passes the 95% significance test.
To quantify the absorption and scattering of solar radiation by clouds and aerosols. To minimize the influence of clouds, we calculated the partial correlation between this ratio and SRS to eliminate total cloud cover, thereby obtaining the SRS-aerosol correlation distribution (Figure 6H).
As individual meteorological factors can exhibit considerable spatial heterogeneity, the impact of specific elements on SRS is regionally variable. For instance, although SAT and SRS are positively correlated in most regions, with the strongest correlation on the Yunnan–Guizhou Plateau and in Xinjiang, we also observed a weak (do not pass the 95% significance test.) negative correlation between the two over parts of the Tibetan Plateau. Consequently, we infer that SRS is highly sensitive to SAT on the Yunnan–Guizhou Plateau and in Xinjiang, but relatively insensitive to this factor on the Tibetan Plateau. For all regions, the correlation between surface pressure and SRS is weak; only minor areas (e.g., Yunnan and central Inner Mongolia) pass the 95% significance test, indicating that air pressure has little influence on SRS. In contrast, total precipitation, relative humidity, low cloud cover, and total cloud cover all exhibit significant negative correlations with SRS. These factors typically correspond to cloudier conditions with reduced atmospheric transparency, leading to an inverse relationship between SRS and these meteorological elements. Whereas the influence on SRS of total precipitation is broadly uniform throughout China, the relative humidity in Yunnan, low cloud cover in South and Northeast China, and total cloud cover in Central and Eastern China all result in strong negative correlations in those regions. With the exception of parts of Xinjiang, the Tibetan Plateau, and Northeast China, we observed a positive correlation between wind speed and SRS in most regions, potentially due to the higher atmospheric transparency that tends to accompany windy days. Finally, we note that SRS is negatively correlated (at 95% significance) with aerosols throughout China, confirming that air pollution reduces SRS. In order to explore the possible causes of the dipole pattern of annual-mean SRS EOF1 between the southern Tibetan Plateau and the rest of China (Figure 4A). The relevant meteorological element fields regressed upon the normalized time series corresponding to annual-mean SRS EOF1 are analyzed (Figure 7). The results show that the SAT, total precipitation, relative humidity, low cloud cover, and total cloud cover had a similar pattern to the regional pattern of annual-mean SRS EOF1, which means that the dipole pattern is strongly related to these elements.
FIGURE 7
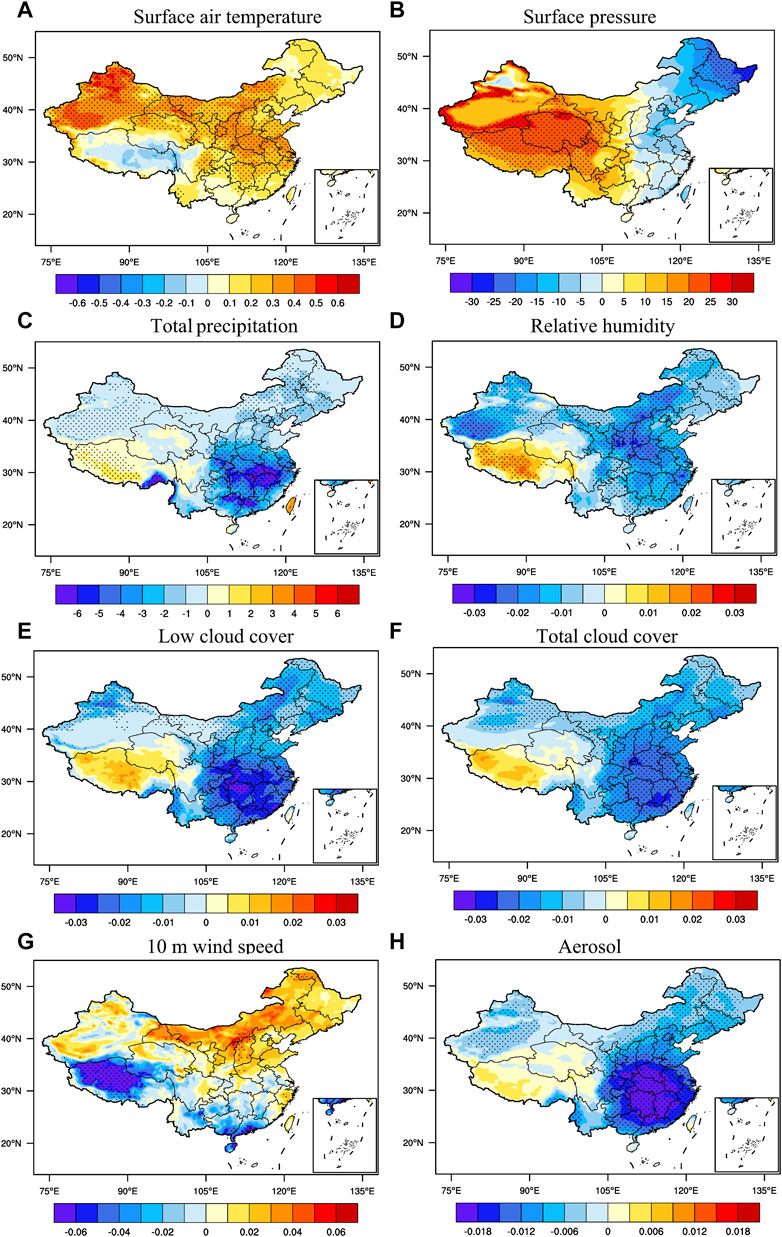
FIGURE 7. Meteorological elements regressed upon the normalized time series corresponding to EOF1 of annual-mean SRS. (A) is SAT (°C), (B) is surface pressure (Pa), (C) is total precipitation (mm), (D) is relative humidity (ratio), (E) is low cloud cover (ratio), (F) is total cloud cover (ratio), (G) is 10 m wind speed (m/s), and (H) is aerosol (ratio). Black dots indicate where a given area passes the 95% significance test.
On the basis of these analyses, we conclude that the spatial distribution of SRS throughout China exhibits considerable regional differences in climate state, trend, standard deviation, and spatial EOF mode. Consequently, we utilized REOF to examine the spatial distribution of SRS in more detail (Figure 8). According to the REOF variance contribution, the spatial distribution of Chinese SRS can be subdivided into 11 major radiation regions (see Figure 7M): northern Xinjiang (r1: 43°–49°N, 80°–92°E), western Northwest China (r2: 35°–42°N, 75°–97°E), western Tibetan Plateau (r3: 28.5°–33.5°N, 78°–90°E), eastern Tibetan Plateau (r4: 28.5°–33°N, 91°–102°E), Yunnan (r5: 21°–27.5°N, 97°–105°E), Loess Plateau (r6: 32°–38°N, 104°–110.5°E), Central China (r7: 24°–31°N, 106°–111°E), Northeast China (r8: 45°–51°N, 120°–133°E), North China (r9: 37°–42°N, 114.5°–123°E), East China (r10: 30.5°–35°N, 112°–120°E), and Southeast China (r11: 21°–29°N, 112°–120°E).
FIGURE 8
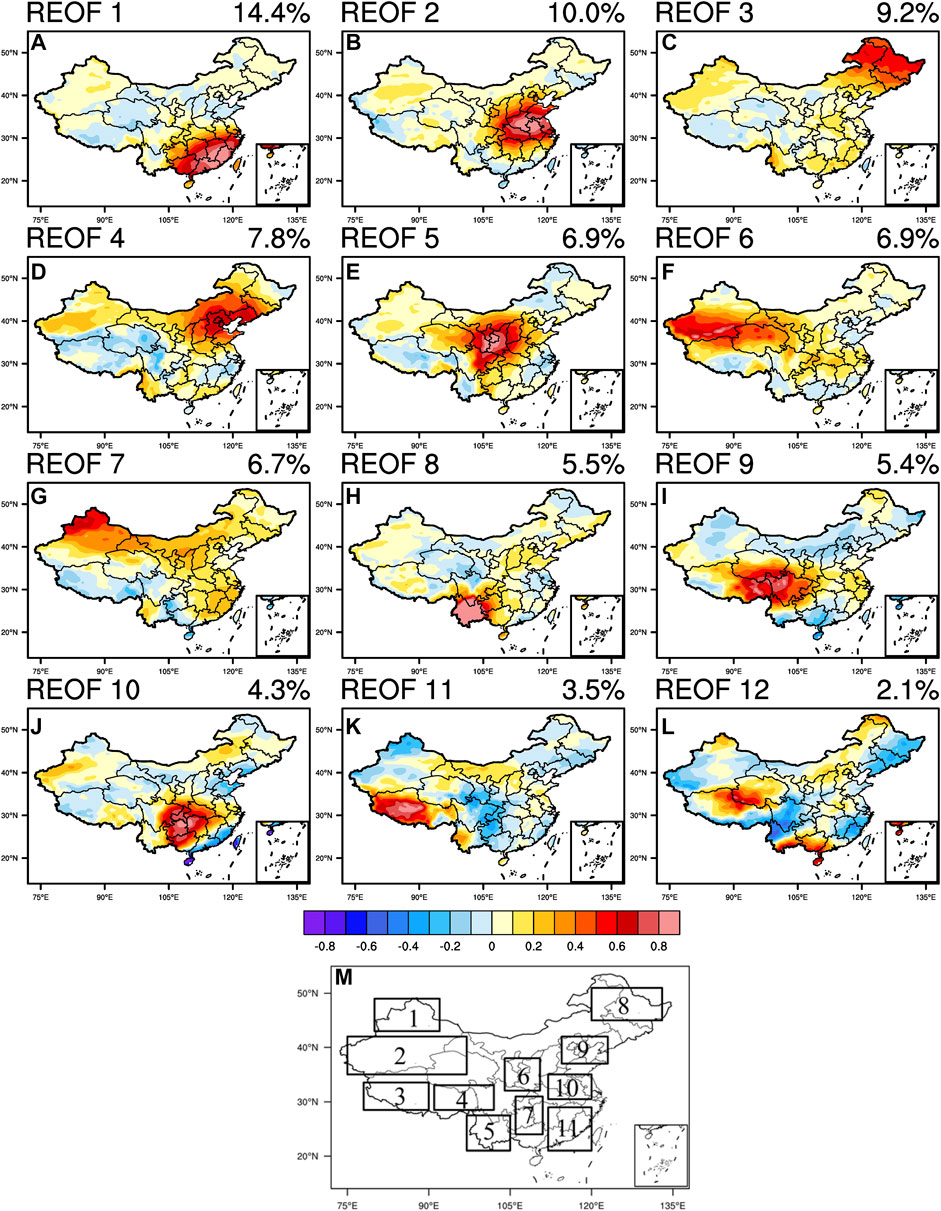
FIGURE 8. (A–L) Spatial distributions of the 12 eigenvector fields obtained from REOF decomposition of SRS between 1961 and 2020. Panel (M) represents the regional distribution of the first 11 eigenvector fields. Since the 12th eigenvector field is not significant, we determined the regional division from the first 11. The divided regions are as follows: northern Xinjiang (r1: 43°–49°N, 80°–92°E), western Northwest (r2: 35°–42°N, 75°–97°E), western Tibet Plateau (r3: 28.5°–33.5°N, 78°–90°E), eastern Tibet Plateau (r4: 28.5°–33°N, 91°–102°E), Yunnan (r5: 21°–27.5°N, 97°–105°E), Loess Plateau (r6: 32°–38°N, 104°–110.5°E), Central China (r7: 24°–31°N, 106°–111°E), Northeast China (r8: 45°–51°N, 120°–133°E), North China (r9: 37°–42°N, 114.5°–123°E), East China (r10: 30.5°–35°N, 112°–120°E), southeast China (r11: 21°–29°N, 112°–120°E).
Figure 9 compares the annual-mean and seasonal SRS values for the 11 regions delineated by REOF decomposition. For r1, r2, r6, r7, r10, and r11, maximum SRS values occur in summer; in r3, r4, r5, r8, and r9, peak SRS is attained in spring. With the exception of r5, minimum values for all regions occur in winter. Viewed as a whole, therefore, peak SRS in China (except for r5) coincides with the spring–summer warm season and minimum SRS with winter conditions, a pattern that generally reflects Northern Hemisphere insolation. Concurrently, we ranked the annual-mean SRS values for each region, from largest to smallest, as follows: r3, r2, r4, r1, r9, r5, r6, r10, r11, r8, r7. The higher the value, the greater the amount of solar radiation received at the surface, and vice versa.
FIGURE 9
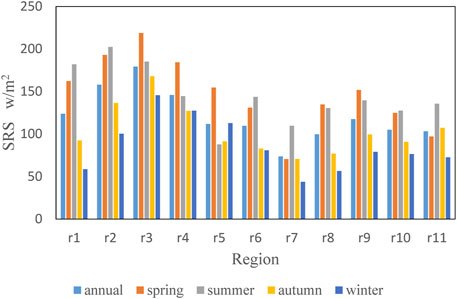
FIGURE 9. Annual-mean and seasonal SRS for 11 regions between 1961 and 2020. Regions r1–r11 are the same as in Figure 8.
To refine our understanding of how weather conditions impact SRS on a regional basis, we analyzed the correlations between SRS and various meteorological elements in each region (Table 2). We observed that, for all regions, precipitation, relative humidity, low cloud cover, total cloud cover, and aerosol all exhibit significant negative correlations, consistent with the findings shown in Figure 6. Correlations for both SAT and SRS are largely positive, with r1, r2, r5, r6, r7, r9, and r10 passing the 99% significance test. However, correlations for r3, r4, and r11 are relatively weak, indicating that SRS in those regions is less impacted by SAT. We observed no correlation between surface pressure and SRS in any region, with the exception of r5. Whereas significant positive correlations (at 99% significance) exist between wind speed and SRS in r3 and r6, this relationship returns only weak positive correlations in other regions, and even a weak negative correlation in r1. Therefore, although SAT and wind speed both influence SRS, wind speed only passes the significance test in r3 and r6 regions. Overall, among the eight meteorological influence factors which can enhance SRS are SAT and wind speed, but wind speed only passes the significance test in r3 and r6 regions. Meanwhile, cloud cover, precipitation, relative humidity, and aerosol are the main weakening influence factors.
TABLE 2
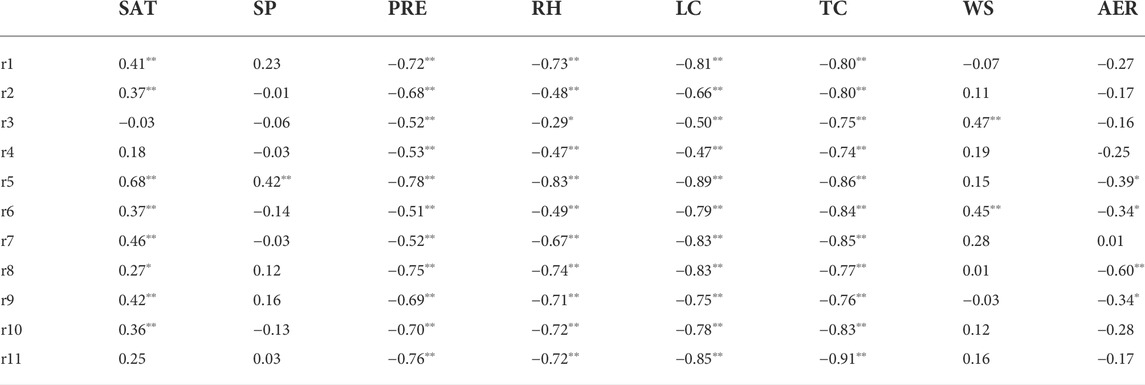
TABLE 2. Correlation coefficients between SRS and meteorological elements in 11 regions in China during 1961-2020. SAT is surface air temperature, SP is surface pressure, PRE is total precipitation, RH is relative humidity, LC is low cloud cover, TC is total cloud cover, WC is 10 m wind speed, AER is aerosol. The regions r1-r11 same as in Figure 8.
Conclusion
This paper used ERA5 reanalysis to investigate the spatial and temporal distributions of SRS throughout China for the period 1961–2020 and to evaluate correlations between SRS and meteorological factors. From this assessment, we draw the following conclusions:
1) SRS high value centers are located primarily on the southwest Tibetan Plateau, whereas the low value center occurs on the northeast Yunnan–Guizhou Plateau and in the Sichuan Basin. SRS values are highest in summer, followed by spring, autumn, and winter. The annual-mean of SRS is increasing in Northeast China, North China, Southwest China, South China, and Xinjiang, whereas the Tibetan Plateau is experiencing a declining trend. SRS trends vary significantly among the four seasons, being greatest in Eastern China and lowest in Western China.
2) The spatial distribution of the first mode of EOF indicates that, between 1961 and 2020, annual-mean SRS on the southern Tibetan Plateau was anti-phased with that of other regions. Combined with the time period, the SRS throughout China underwent a decadal transition around the year 2000, after which most parts of China experienced positive SRS anomalies. This pattern is mainly affected by SAT, total precipitation, relative humidity and cloud cover. Only the southern part of the Tibetan Plateau was dominated by negative anomalies. The spatial distribution of the second mode of EOF reveals a “positive north and negative south” pattern of annual-mean SRS, with a predominantly interannual variability. Using the EEMD method, we found that the temporal evolution of SRS is largely interannual.
3) By analyzing potential influencing factors, we observed that SAT and wind speed are both positively correlated with SRS. In contrast, precipitation, relative humidity, cloud cover, and aerosol are negatively correlated with SRS, suggesting that, although SAT and wind speed serve to enhance SRS, precipitation, relative humidity, cloud cover, and aerosol weaken SRS. We employed REOF to divide Chinese SRS into 11 specific regions. For each region, maximum SRS values occurred in the spring or summer (warm season), whereas minimum values largely coincide with winter. In terms of annual-mean SRS, the top five regions (from largest to smallest) are the western Tibetan Plateau, western Northwest China, the eastern Tibetan Plateau, northern Xinjiang, and North China.
Data availability statement
Publicly available datasets were analyzed in this study. This data can be found here: ERA5 reanalysis datasets during this study are openly available from the European Centre for Medium-Range Weather Forecasts at https://cds.climate.copernicus.eu/cdsapp#!/search?type=dataset.
Author contributions
LQ and HJ conceived and designed the research, SW and PY processed the data. HJ analysed the data and wrote the manuscript. LS and LZ reviewed the paper.
Funding
This work was supported by the Industry Support Project of University in Gansu Province (Grant Nos. 2020C‐34), the National Natural Science Foundation of China (Grant Nos. 42005056, 42005058), and the Meteorological scientific research project of Gansu Meteorological Bureau (grant no. ZcZd2022‐25).
Conflict of interest
The authors declare that the research was conducted in the absence of any commercial or financial relationships that could be construed as a potential conflict of interest.
Publisher’s note
All claims expressed in this article are solely those of the authors and do not necessarily represent those of their affiliated organizations, or those of the publisher, the editors and the reviewers. Any product that may be evaluated in this article, or claim that may be made by its manufacturer, is not guaranteed or endorsed by the publisher.
References
Blanka, B., Martin, W., Doris, F., Daniel, L., Sven, K., Christoph, S., et al. (2017). Projected changes in surface solar radiation in CMIP5 global climate models and in EURO-CORDEX regional climate models for Europe. Clim. Dyn. 49, 2665–2683. doi:10.1007/s00382-016-3471-2
Cornes, R. C., Jones, P. D., and Qian, C. (2017). Twentieth-Century trends in the annual cycle of temperature across the northern Hemisphere. J. Clim. 30, 5755–5773. doi:10.1175/JCLI-D-16-0315.1
Dickinson, W., and Cheremisinoff, P. (1980). Solar energy technology handbook. London: Butterworths.
Dommenget, D., and Latif, M. (2002). A cautionary note on the interpretation of EOFs. J. Clim. 15 (2), 216–225. doi:10.1175/1520-0442(2002)015<0216:acnoti>2.0.co;2
Fan, L., Liu, Z., and Liu, Q. (2011). Robust GEFA assessment of climate feedback to SST EOF modes. Adv. Atmos. Sci. 28, 907–912. doi:10.1007/s00376-010-0081-5
Franzke, C. (2010). Long-range dependence and climate noise characteristics of antarctic temperature data. J. Clim. 23, 6074–6081. doi:10.1175/2010JCLI3654.1
Gao, L. H., Yan, Z. W., and Quan, X. W. (2015). Observed and sst-forced multidecadal variability in global land surface air temperature. Clim. Dyn. 44 (12), 359–369. doi:10.1007/s00382-014-2121-9
Guan, J., Liang, C., Zhao, L., Cui, N., Wang, C., and Jiang, S. (2018). Characteristics of temporal-spatial solar radiation distribution in northwest China based on cloud model. Trans. Chin. Soc. Agric. Mach. 49 (12), 233–242. (in Chinese). doi:10.6041/j.issn.100-1298.2018.12.028
He, H., Yu, G., and Niu, D. (2003). Method of global solar radiation calculation on complex territories. Resour. Sci. 25 (1), 78–85. (in Chinese).
Hersbach, H., Bell, B., Berrisford, P., Hirahara, S., Horanyi, A., Munoz-Sabater, J., et al. (2020). The ERA5 global reanalysis. Q. J. R. Meteorol. Soc. 146 (730), 1999–2049. doi:10.1002/qj.3803
Huang, P., Zhao, W., and Li, A. (2017). Estimation of solar radiation and its spatio-temporal distribution characteristics in the mountainous area of western sichuan. Mt. Res. 35 (3), 420–428. (in Chinese). doi:10.16089/j.cnki.1008-2786.000238
Jin, C., Wang, B., Liu, J., Ning, L., and Yan, M. (2019). Decadal variability of northern Asian winter monsoon shaped by the 11-year solar cycle. Clim. Dyn. 53, 6559–6568. doi:10.1007/s00382-019-04945-4
Li, D., Xie, J., and Wang, W. (1997). A study of summer precipitation features and anomaly in northwest China. Sci. Atmos. Sin. 21 (3), 331–340. (in Chinese).
Li, G., and Xie, S. (2014). Tropical biases in CMIP5 multimodel ensemble: the excessive equatorial pacific cold tongue and double ITCZ problems. J. Clim. 27 (4), 1765–1780. doi:10.1175/jcli-d-13-00337.1
Meza, F., and Varas, E. (2000). Estimation of mean monthly solar global radiation as a function of temperature. Agric. For. Meteorology 100 (2), 231–241. doi:10.1016/s0168-1923(99)00090-8
Qi, Y., Fang, S., and Zhou, W. (2015). Correlative analysis between the changes of surface solar radiation and its relationship with air pollution, as well as meteorological factor in East and West China in recent 50 years. Acta Phys. Sin. 64 (8), 10. (in Chinese). doi:10.7498/aps.64.089201
Qi, Y., Fang, S., and Zhou, W. (2014). Variation and spatial distribution of surface solar radiation in China over recent 50 years. Acta Ecol. Sin. 34 (24), 7444–7453. (in Chinese). doi:10.5846/stxb201303130409
Qian, C., Fu, C., and Wu, Z. (2011). Changes in the amplitude of the temperature annual cycle in China and their implication for climate change research. J. Clim. 24, 5292–5302. doi:10.1175/JCLI-D-11-00006.1
Qian, C., Yan, Z. W., and Fu, C. B. (2012). Climatic changes in the twenty-four solar terms during 1960–2008. Chin. Sci. Bull. 57, 276–286. doi:10.1007/s11434-011-4724-4
Qiao, L., Zuo, Z., Xiao, D., Bu, L., and Zhang, K. (2022). Variations in Eurasian surface air temperature over multiple timescales and their possible causes. Int. J. Climatol. 1, 4788–4807. doi:10.1002/joc.7504
Shen, Y., and Wang, B. (2011). Effect of surface solar radiation variations on temperature in south—east China during recent 50 years. Chin. J. Geophys. 54 (6), 1457–1465. (in Chinese). doi:10.3969/j.issn.0001-5733.2011.06.005
Tao, S., Qi, Y., Shen, S., Li, Y., and Zhou, Y. (2016). The spatial and temporal variation of solar radiation over China from 1981 to 2014. J. Arid Land Resour. Environ. 30 (11), 143–147. (in Chinese). doi:10.13448/j.cnki.jalre.2016.362
Thomas, P., Rudy, C., Euphrasie, C., and France, N. (2020). Investigation of local correlations between particulate matter (PM10) and air temperature in the Caribbean basin using Ensemble Empirical Mode Decomposition. Atmos. Pllution Reserach 11 (10), 1692–1704. doi:10.1016/j.apr.2020.06.031
Wang, L. (2015). Regional variations of atmosphere radiation and its quantitative effects on the terrestrial ecosystem productivity. Wuhan: Wuhan University. (in Chinese).
Wen, X., Shang, K., Wang, S., Yang, D., and Fan, W. (2008). Primary study on regional characteristics of solar radiation in China during 1961-2000. J. Desert Res. 28 (3), 554–561. (in Chinese).
Winslow, J., Hunt, E., and Pipe, R. (2001). A globally applicable model of daily solar irradiance estimated from air temperature and precipitation data. Ecol. Model. 143 (3), 227–243. doi:10.1016/s0304-3800(01)00341-6
Wu, Y., Zhang, H., Tian, G., and Zhao, Y. (2009). Spatial and temporal distributions of potential solar radiation of complex terrain over shanxi plateau. Meteorol. Mon. 35 (5). (in Chinese).
Wu, Z., and Huang, N. (2009). Ensemble empirical mode decomposition: a noise-assisted data analysis method. Adv. Adapt. Data Anal. 1, 1–41. doi:10.1142/s1793536909000047
Xu, J., He, J., and Yan, F. (2010). Research on secular variation of solar radiation over northwest China from 1961 to 2007. Environ. Res. 15 (1), 89–96. (in Chinese). doi:10.3878/j.issn.1006-9585.2010.01.10
Yan, J., Zhang, D., An, W., Liu, Y., Wu, J., and Yang, P. (2014). Distribution characteristics and assessment of solar energy resource in shanxi. J. Arid Meteorology 32 (5), 712–718. (in Chinese). doi:10.11755/j.issn.1006-7639(2014)-05-0712
Yang, S., Wang, K., and Lv, S. (2007). Regional characteristics of global solar radiation evolution in China over recent 40 years. Acta Energiae Solaris Sin. 28 (3), 227–232. (in Chinese).
You, Q., Arturo, S., Martin, W., Doris, F., Klaus, F., Ren, G., et al. (2013). Decadal variation of surface solar radiation in the Tibetan Plateau from observations, reanalysis and model simulations. Clim. Dyn. 40, 2073–2086. doi:10.1007/s00382-012-1383-3
Zhang, H., Zhang, Q., Yue, P., Zhang, L., Liu, Q., Qiao, S., et al. (2016). Aridity over a semiarid zone in northern China and responses to the East Asian summer monsoon. J. Geophys. Res. Atmos. 121 (13), 13 901–913 918. doi:10.1002/2016JD025261
Zhang, J., Shen, R., Shi, C., Bai, L., Liu, J., and Sun, S. (2021). Evaluation and comparison of downward solar radiation from new generation atmospheric reanalysis ERA5 across mainland China. J. Geo-information Sci. 23 (12), 2261–2274. doi:10.12082/dqxxkx.2021.180357
Zhang, M., Wu, Z., and Qiao, F. (2018). Deep atlantic ocean warming facilitated by the deep western boundary current and equatorial kelvin waves. J. Clim. 31, 8541–8555. doi:10.1175/JCLI-D-18-0255.1
Zhang, Y., Tian, Y., Lin, J., Zhang, Q., and Tao, J. (2020). Temporal-spatial dynamic change characteristics of solar radiation in Beibu Gulf coastal zone during 1961-2017. Ecol. Sci. 39 (4), 145–155. (in Chinese). doi:10.14108/j.cnki.1008-8873.2020.04.019
Zhou, B., Yan, L., and Xiao, R. (2012). Temporal and spatial distribution in solar radiation and sunshine in the "Three-River-Source" region. Resour. Sci. 34 (11), 2074–2079. (in Chinese).
Keywords: solar radiation, China, temporal and spatial characteristics, influence factor, EEMD decomposition
Citation: Jin H, Wang S, Yan P, Qiao L, Sun L and Zhang L (2022) Spatial and temporal characteristics of surface solar radiation in China and its influencing factors. Front. Environ. Sci. 10:916748. doi: 10.3389/fenvs.2022.916748
Received: 10 April 2022; Accepted: 13 July 2022;
Published: 10 August 2022.
Edited by:
Yan Li, Beijing Normal University, ChinaReviewed by:
Rudy Calif, Université des Antilles, GuadeloupeKeyan Fang, Fujian Normal University, China
Copyright © 2022 Jin, Wang, Yan, Qiao, Sun and Zhang. This is an open-access article distributed under the terms of the Creative Commons Attribution License (CC BY). The use, distribution or reproduction in other forums is permitted, provided the original author(s) and the copyright owner(s) are credited and that the original publication in this journal is cited, in accordance with accepted academic practice. No use, distribution or reproduction is permitted which does not comply with these terms.
*Correspondence: Liang Qiao, 19113020001@fudan.edu.cn