 Chen Li
 Bao-Hui Men
 Shi-Yang Yin
- College of Water Resources and Hydropower Engineering, North China Electric Power University, Beijing, China
During the rapid urbanisation of Beijing in the past two decades, the original natural underlying surface has been changed, and the groundwater recharge and discharge processes had undergone great changes. Therefore, whether these natural and human factors affect the evolution of groundwater chemical composition, and how these influences evolve, need to be studied urgently. In this study, the Daxing District was taken as a typical area to understand the evolution rules of the chemical characteristics of shallow groundwater in the plain areas of Beijing. By collecting monitoring data on shallow groundwater from 2006 to 2016, the spatiotemporal evolution trends of the chemical characteristics and influencing factors of shallow groundwater in Daxing District were studied using the hydrochemical analysis methods and principal component analysis–partial connection number method. The results show the following: 1) The cations and anions of groundwater in the study area increased with time, indicating that the groundwater quality tends to deteriorate. 2) The hydrochemical type and anion and cation components changed accordingly with the change in NO3−, indicating the profound impact of NO3− on the evolution of groundwater components. 3) The groundwater has always been affected by human factors and natural factors. Natural factors have dominated, but the influence of human factors on hydrochemical components has been increasing. From the spatial distribution of the impact of human factors and natural factors on groundwater composition, regions with higher urbanisation degrees are highly affected by human factors and vice versa. This study can provide a theoretical and methodological reference for regional groundwater management and industrial layout.
1 Introduction
Rapid urbanisation and rapid economic development happened in China in recent years, but these also led to a series of environmental problems. For example, the rapid growth of the urban population and the continuous expansion of urban construction leads to the sharp increase in urban water supply demands, sewage discharge, domestic waste and so on (Wang and He, 2015; Li et al., 2020a). Beijing, the political, economic and cultural centre of China, is located in the northern part of the North China Plain. Because of the lack of surface water in the region, more than 70% of the water supply is mainly from groundwater (Ma et al., 2015). Long-term overexploitation of groundwater, coupled with the rapid development of cities, has led to the continuous decline of groundwater level (Zhou et al., 2016), deterioration of water quality (Li et al., 2020a) and surface subsidence (Zhou et al., 2015; Qin et al., 2018; Hu et al., 2019). Since the South-to-North water diversion into Beijing in December 2014, the continuous deterioration of the groundwater environment has been partially alleviated (Zhang et al., 2018a; Zhang et al., 2022), but groundwater supply still accounts for more than 40% of the city’s total water supply, and the status of groundwater as the main source of the water supply has not changed.
As the uppermost layer of groundwater, shallow groundwater is closely related to the external environment and is easily affected by external natural and human factors (Baojing et al., 2013; Li et al., 2013; Martín et al., 2014; Shang et al., 2016; Zhang et al., 2016), such as atmospheric precipitation, formation lithology, surface pollutant leakage and human activities. In particular, during the rapid urbanisation of Beijing in the past two decades, the original natural underlying surface has been changed, and the groundwater recharge and discharge processes had undergone great changes (Ji et al., 2021; Qin, 2021). Therefore, studying whether these natural and human factors affect the evolution of groundwater chemical composition and changing their influence degrees are urgent. Therefore, studying the dynamic evolution of groundwater chemical characteristics and influencing factors from the perspective of hydrochemistry is necessary to provide theoretical and data support for regional groundwater resource management and protection.
Hydrochemical methods play an important role in understanding the chemical characteristics and formation processes of regional groundwater (Sarkar et al., 2017; Li et al., 2020b). Many scholars have studied the regional hydrogeochemical processes, the main sources of anions and cations, the direction of development and utilisation and the potential risks of groundwater to human health using hydrochemical methods combined with multivariate statistical methods (Li et al., 2019), geostatistics methods (Yin et al., 2019), isotope methods (Li et al., 2016), water quality assessment (Zhai et al., 2015) and other methods (Adimalla and Qian, 2019; Ji et al., 2020; Podgorski and Berg, 2020). For example, to determine the pollution sources of groundwater, hydrochemistry and multivariate statistics are combined to consider human factors in the hydrogeochemical process (Busico et al., 2020). By combining hydrochemical methods with drinking water or irrigation water standards, the applicability of regional groundwater for living and irrigation purposes can be understood, and the impact of toxicity on human health can be further evaluated (Zhang et al., 2018b; Adimalla and Li, 2019; Liu et al., 2019). Hydrochemistry and stable isotope methods can be combined to analyse the hydrochemical evolution of an area to understand the influence of wastewater irrigation on the hydrochemical processes in the surrounding area (Li et al., 2016). Therefore, the hydrochemical method is the basic method used to realise the sustainable utilisation of groundwater. However, at present, there are few studies on the evolution of groundwater chemical components over time in the process of rapid regional urbanization (Zhai et al., 2015; Xiao et al., 2017; Diamantopoulou and Voudouris, 2008; Arunprakash et al., 2014; Rao et al., 2016; He et al., 2017; Jia et al., 2018). Many studies only analysed the hydrochemistry or individual years from individual components (Martín et al., 2014; Huang et al., 2013; Yang et al., 2020). Because of the close connection of various water quality indexes in groundwater, drawing scientific conclusions from the interaction and evolution of each component in groundwater is difficult. Moreover, identifying the controlling factors causing the evolution of groundwater components based on regional hydrogeological conditions and long-term water quality monitoring data and taking corresponding measures to better protect the underground environment are necessary to further reflect the evolution direction of the groundwater environment.
From 2003 to 2019, the areas of urban land in the east and south of Beijing expanded the most, especially those in the Tongzhou District and Daxing District (Huang et al., 2015; Wu et al., 2019). As the south gate of Beijing, Daxing District is a key area to undertake the population and estrangement functions of the central urban area (Shi et al., 2014). With the construction of the Beijing Daxing International Airport, Daxing District became one of the fastest-growing areas in Beijing. In order to understand the effects of natural and human factors on the chemical composition of groundwater in the process of rapid urbanization. In this paper, the Daxing District, a typical region in the plain area of Beijing, was selected as the research area. By collecting groundwater quality monitoring data from 2006 to 2016, the evolution direction of regional groundwater chemical types was analysed and the sources of main ions were traced using hydrochemical methods such as the Piper ternary diagram, Gibbs diagram and ion combination ratio analysis. The main factors affecting the evolution of the water chemical composition were identified using the principal component–partial relation method. Moreover, the influence degree of each main factor on the groundwater composition and the change rules in time and space were analysed. This study can provide a theoretical and methodological reference for regional groundwater management and industrial layout.
2 Study Area
The Daxing District is located in the southern suburbs of Beijing (Figure 1), with an area of 1,036 km2. Its geographical coordinates are 116°13′–116°43′E and 39°26′–39°51′N. There are 14 towns in the jurisdiction: the northern region includes Huangcun, Xihongmen, Jiugong, Yizhuang, and Yinghai; the central region includes Beizangcun, Panggezhuang, Weishanzhuang, and Qingyundian; and the southern region includes Yufa, Lixian, Anding, Changziying, and Caiyu. The region experiences a midlatitude warm temperate continental monsoon climate, with four distinct seasons and an average annual temperature of 11.7°C. The inter-annual variation of rainfall is large, and the annual rainfall is mainly concentrated in June to September. The area belongs to the alluvial plain of the Yongding River, with relatively flat terrain and a slope of 0.5–2.0‰. The study area is located in the northeast tectonic belt on the southeast side of the intersection of the Yanshan and Taihang Mountains, called the “Daxing uplift”. The thickness of the Quaternary unconsolidated layer is 200–300 m, and the aquifer is dominated by coarse medium sand and fine sand. Also, some areas have a certain thickness of sand and gravel layer distributions (Figure 2). Controlled by the uplift of the basement, the thickness of the Quaternary sediments varies greatly, from 50 m in the northwest to 300 m in the southeast. The thickness of the Quaternary deposits is 50–60 m in the northwest of study area, and 70–90 m in Huangcun, Jiugong, and Yizhuang in the east of study area. The thickness increases gradually in the south and reaches 300 m in Yufa and Kangying. Quaternary aquifer particles range from coarse to fine and water-rich from large to small.
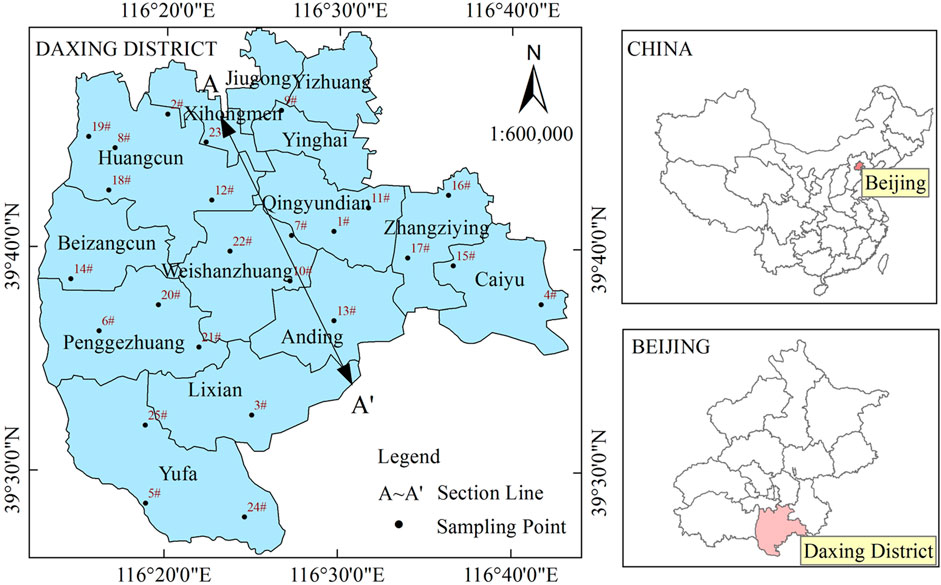
FIGURE 1. Geographic map of the study area.
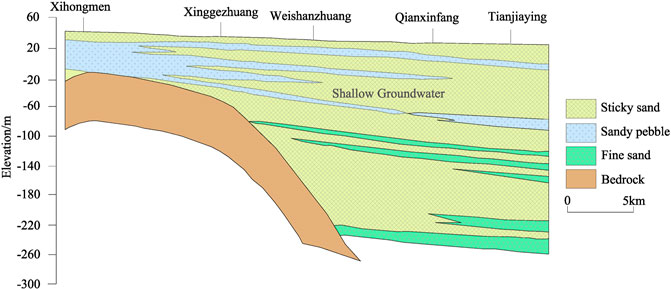
FIGURE 2. Section A–A′ of the study area.
3 Materials and Methods
3.1 Sample Collection and Testing
A total of 275 shallow groundwater samples were collected from the study area from 2006 to 2016 from 25 sampling points, as shown in Figure 1. During the sampling process, water was pumped until the parameters were stable and then sampled. The sampling bottles were 2.5-L PVC plastic bottles. The water samples were used for wetting and washing three times, and the original samples were sealed and preserved after sampling. Then, the samples were sent to the Daxing District Water Environment Monitoring Center in Beijing for testing within 48 h. The total dissolved solids (TDS) were determined using the gravimetric method (drying at 105°C). The total hardness (TH) was determined using ethylenediaminetetraacetic acid. Na+, K+, Ca2+ and Mg2+ were determined using inductively coupled plasma emission spectrometry. SO42−, Cl−, and NO3− were determined using ion chromatography. The CO32− and HCO3− contents were determined by titration. The ion balance errors of all samples were less than 5%.
3.2 Research Methods
This study was conducted to understand the temporal–spatial evolution of groundwater chemical characteristics and influencing factors in the study area and to provide theoretical support for regional groundwater protection and industrial layout. On the basis of the hydrochemical method, the changes in the main anion and cation components and hydrochemical types in groundwater from 2006 to 2010 and 2011 to 2016 and the main factors causing these changes were analysed. The natural sources of the main ions in the groundwater in the study area were determined using the Gibbs diagram and the ion combination ratio method. The main controlling factors affecting the evolution of groundwater components were extracted using the principal component–partial relation method to further analyse the temporal and spatial evolution trend of the dominant factors affecting the evolution of the groundwater chemistry in the study area. The dynamic evolution law of the main controlling factors was analysed, which provided the basis for the protection measures of regional groundwater resources and the industrial layout scheme.
3.2.1 Hydrochemical Analysis Methods
The chemical characteristics and formation of shallow groundwater were qualitatively and quantitatively analysed using the Piper three-line diagram, Gibbs diagram and ion combination ratio method. The mineral saturation index was calculated using the Phreeqc software.
3.2.2 Principal Component Analysis–Partial Connection Number Method
Principal component analysis is a statistical method that converts multiple variables into a few principal components using dimension reduction technology to reduce the number of predicted variables (Lianne et al., 2017; Maria et al., 2012). Partial connection number is the adjoint function of set pair analysis, which is mainly used to reflect the dynamic evolution between connection numbers (Yang and Zhao, 2019; Yang et al., 2021). At present, the first-order partial connection number is commonly used (Xiang et al., 2021). Since the first-order connection number only reflects the evolution between adjacent connection numbers, the mutual transformation between identity and opposition is not considered (Li et al., 2022). The second-order connection number not only considers the mutual transformation between identity, difference and opposition but also reflects the mutual transformation between identity and opposition. Therefore, this paper adopted principal component analysis–partial connection number to extract the main control factors affecting the evolution of the shallow groundwater components and analysed the dynamic evolution rules of the main control factors.
The specific model construction steps are as follows:
3.2.2.1 Eliminating the Xij Dimension of the Raw Data
In the formula,
3.2.2.2 Calculating the Correlation Coefficient Matrix and Corresponding Eigenvector
In the above formulas, R is the correlation coefficient matrix of the processed data, rij is the correlation coefficient, and
3.2.2.3 Determining Principal Components by Calculating the Principal Component Contribution Rate and the Cumulative Contribution Rate
In these formulas, Pt is the contribution rate of the main components, p is the cumulative contribution rate, and λt is the eigenvalue corresponding to the first m principal components when the cumulative contribution rate reaches the requirement.
3.2.2.4 Calculating the Score of the Groundwater Chemical Composition Evolution Factors
In the formula, x is the score of the factors affecting the evolution of the groundwater chemical composition and γtj is the principal component load, which is the tth component of the eigenvector rj.
3.2.2.5 Determining the Evaluation Level of Each Main Control Factor Score
The principal component scores of the two main factors affecting the groundwater chemical composition were evaluated. According to the data characteristics of the score values and referring to existing data, the evaluation grade standards of the score values of the impact factors were determined as follows:
In the formula, sgi represents the critical value of the evaluation level of each impact factor. g is the evaluation level (Levels 1–3) and j represents the jth influencing factor in sample i, representing natural and human factors, respectively.
In the formula, xij represents the score value of the jth index of the ith sample. i is the evaluation sample and n is the number of samples.
3.2.2.6 Calculating the Connection Number of Each Main Control Factor Score About Each Sample
The relationship between the principal component score of the jth index about the evaluation sample i and the index value of the evaluation standard was calculated.
If the indicator is a positive indicator xij ≤ s1j or a reverse indicator xij ≥ s1j,
If the indicator is a positive indicator s1j < xij ≤ s2j or a reverse indicator s1j > xij ≥ s2j,
If the indicator is a positive indicator s2j < xikj ≤ s3j or a reverse indicator s2j > xikj ≥ s3j,
In the above formulas, uij1, uij2, uij3 represent the number of index connections within each level for the jth index of sample i, respectively. s1j and s2j are the limit values of Grades 1 and 2 and Grades 2 and 3, respectively. s0j is the minimum value of Grade 1, and s3j is the maximum value of Grade 3.
The identity, difference and opposition of the jth principal component score index about sample i are transformed into relative membership. The calculation process is as follows:
In the above formulas, uij represents the degree of identity (
3.2.2.7 Calculating the Partial Linkages of Influencing Factors
The support degree of each grade was calculated using the second-order partial connection number. The calculation formulas are shown in (16)–(18):
In the above formulas, S1, S2, and S3 represent Level 1, Level 2, and Level 3 support, respectively.
By comparing the sizes of S1, S2, and S3, the depth evolution trend of the evaluation level of the research object can be determined. ∂+a and ∂2+a represent the positive evolution rates from b and c to a, respectively. ∂-b represents the negative evolution rate of a to b, and ∂+b represents the positive evolution rate of c to b. ∂2−c and ∂-c represent the negative evolution rates from a and b to c, respectively.
The calculation formulas of the evolution rate of the connection number are shown in Formulas (19)–(24):
4 Results and Discussion
4.1 Evolution of Groundwater Chemical Characteristics
4.1.1 Content and Evolution of Chemical Components in Water
The collected shallow groundwater samples were divided into two groups according to time: 2006–2010 and 2011–2016. The hydrochemical data of each group were averaged for each period. Overall, the total concentration of cations and anions in the shallow groundwater increased over time. From 2006 to 2010 and 2011 to 2016, the order of the average cation concentration was Ca2+ > Na+ > Mg2+ > K+, and Ca2+, Na+ and Mg2+ increased by 7.94, 20.88, and 2.69%, respectively. In contrast, K+ decreased by 2.56%. For the anions, the order of the anion average concentration in the two periods changed from HCO3− > Cl− > SO42− to HCO3− > SO42− > Cl−, which was mainly due to the decrease in the Cl− concentration from 95.75 to 88.77 mg/L and the increase in that of SO42− from 88.52 to 99.62 mg/L. Because of the increase in cation and anion concentrations, the TDS and TH increased. TDS increased from 760.96 to 786.36 mg/L, and TH increased from 489.73 to 509.84 mg/L. The NO3− concentration increased from 4.86 to 4.89 mg/L. Although the average concentration of NO3− in 2011–2016 only increased by 0.03 mg/L compared with that in 2006–2010, the number of water quality monitoring cases with NO3− concentrations over 10 mg/L increased from three to five, indicating that the range of the NO3− pollution of the groundwater tended to increase. The pH decreased slightly from 7.5 to 7.4, indicating an alkaline-to-acidic trend.
The variation coefficients of the main components from 2011 to 2016 were lower than those from 2006 to 2010, and the largest reduction was that of Cl−. From the average coefficient of the variation of each ion, the maximum coefficient of variation was that of NO3−, with an average variation coefficient of 1.48, indicating that NO3− is mainly affected by human factors (Zhai et al., 2015; Xiao et al., 2017; Yin et al., 2019). It is followed by Cl− and SO42−, with an average variation coefficient of about 0.5. The smaller coefficients of variation were those of HCO3−, TDS, TH, and Mg2+, and the average coefficient of variation was about 0.2. The smallest coefficient of variation was that of HCO3−, with an average of 0.19, indicating that HCO3− was mainly affected by natural factors (Zhai et al., 2015; Yin et al., 2019).
4.1.2 Evolution of Groundwater Chemical Types
The groundwater chemical types are affected by natural conditions and human activities. The Piper three-line diagram was used to analyse the hydrochemical types in 2006–2010 and 2011–2016 to analyse the evolution characteristics of the hydrochemical types in the two periods.
As shown in Figure 3, 2006–2010 is similar to 2011–2016. Most water quality monitoring sites were located in Area 1, indicating that alkaline earth metals (Ca2+ and Mg2+) exceeded alkaline metals (K+ and Na+) and weak acids (HCO3−) exceeded strong acids (Cl− and SO42−) in most water quality monitoring sites in the study area. Therefore, the water of this region is mainly HCO3–Ca-type water. In 2011–2016, compared with 2006–2010, part of the Cl–Mg·Ca-type water changed into HCO3–Ca-type water, whereas a small amount of HCO3–Ca-type water changed into HCO3–Na·Mg-type water. The change of Cl–Mg·Ca-type water into HCO3–Ca-type water may have been caused by the migration of Cl− to the deep groundwater and thus the decrease of the concentration of Cl− in the shallow groundwater. The conversion of HCO3–Ca to HCO3–Na·Mg may be related to the dissolution of silicate on the one hand. According to the monitoring data of the groundwater level in the study area, the average groundwater level decreased from 11.89 to 17.60 m from 2000 to 2016. The recharge path of groundwater was lengthened, which led to the increase in Na+ dissolution in silicate during the recharge process. This resulted in the transformation of HCO3–Ca into HCO3–Na·Mg. On the other hand, it may be related to human inputs of Na+.
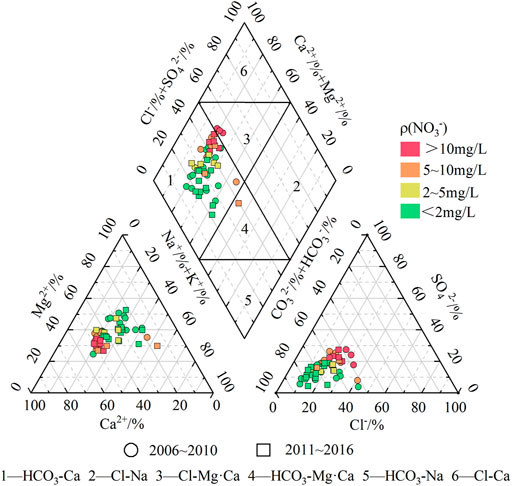
FIGURE 3. The Piper trilinear diagram of conventional ions of the shallow groundwater in different periods.
In addition, the Piper trilinear diagram (Figure 3) shows that with the increase in NO3− concentration, the main trend of the water chemistry type evolved from HCO3–Ca-type water to Cl–Mg·Ca-type water. At the same time, with the increase in NO3− concentration, the main cation and anion components also change accordingly. For the cations, with the increase in NO3− concentration, the ratio of Ca2+ and Na+ increased, whereas that of Mg2+ decreased. For the anions, with the increase in NO3− concentration, the proportions of Cl− and SO42− increased, whereas the proportion of HCO3− decreased. This indicates that the change in the NO3− concentration profoundly affected the component evolution of the groundwater. Table 1 shows that the variation coefficient of NO3− is very large compared with those of the other main ions. Thus, it can be considered that NO3− is mainly caused by human factors; that is, human factors have a great impact on groundwater components.
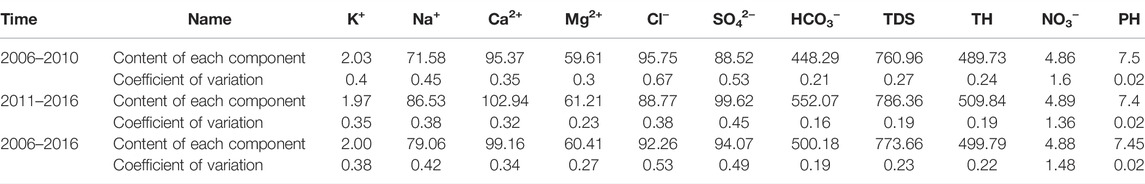
TABLE 1. Calculation results of the chemical components and coefficients of variation of the shallow groundwater in the study area (unit: mg/L).
4.2 Source Evolution of Groundwater Chemical Components
4.2.1 Evolution of Water–Rock Interaction
The Gibbs graphical method can be used to identify the sources of chemical components in natural water. The natural origin control mode of water chemical compositions can be divided into three types: evaporation–concentration type, rock weathering type and precipitation control type. The relationships between TDS and Na+/(Na+ + Ca2+), Cl−/(Cl− + HCO3−) in 2006–2010 and 2011–2016 were drawn using the Gibbs diagram method. Figure 4 shows that the natural origin control mode of the shallow groundwater chemical composition in the study area is mainly rock weathering type.
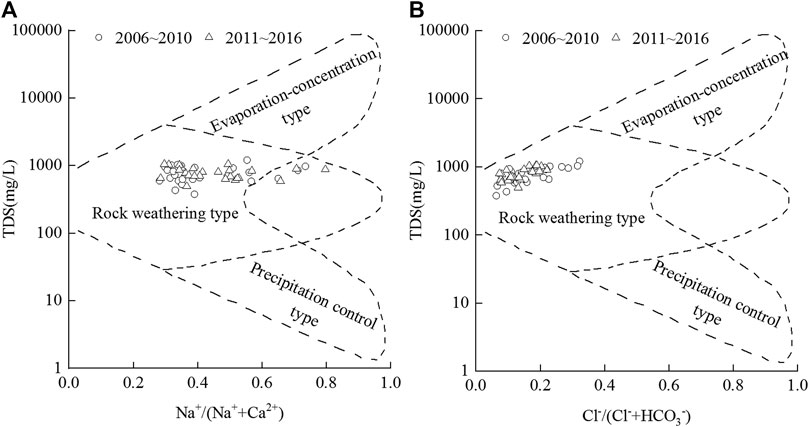
FIGURE 4. Gibbs diagram for different periods in the study area.
From 2006 to 2010, the average value of Na+/(Na+ + Ca2+) was 0.42, and the TDS was 760.96 mg/L. From 2011 to 2016, the average value of Na+/(Na+ + Ca2+) was 0.45, and the TDS was 786.36 mg/L. Both Na+/(Na++Ca2+) and the TDS increased. However, the TDS values of the two periods showed a stable trend with increasing Na+/(Na+ + Ca2+), indicating that the cation components were mainly controlled by rock weathering and that the other natural types had little effect on the cation components. At the same time, the Na+/(Na+ + Ca2+) values greater than 0.6 of some water quality monitoring points indicate that the cation components in these regions may have been affected by human factors.
The average value of Cl−/(Cl− + HCO3−) was 0.14, slightly lower than 0.18 in 2006–2010. The Cl−/(Cl− + HCO3−) ratio was less than 0.4 in both periods, indicating that water–rock interactions play a major role in the determination of the anion components. In addition, Figure 4B shows that the TDS value increased with increasing Cl−/(Cl− + HCO3−), indicating that, in addition to water–rock interactions, natural and human factors also affected the anion components and TDS.
4.2.2 Analysis Based on the ion Combination Ratio
The ion ratio relationship was used to reveal the source of the main ions to further analyse the chemical evolution of the groundwater. The Na+/Cl− ratio was used to reflect the sources of Na+ and Cl−. Figure 5 shows that the water quality monitoring points are scattered on both sides of the 1:1 line, and the points above the 1:1 line are significantly more than those below. Compared with that in 2006–2010, the average ratio of Na+/Cl− increased from 1.44 to 1.67 in 2011–2016, resulting in more points above the 1:1 line in 2011–2016 than those in 2006–2010. On the one hand, this indicates that the source of Na+ is not only rock salt dissolution but also silicate dissolution. On the other hand, the source of Na+ may also be related to ion exchange reactions or artificial inputs of Na+. According to the simulated value SI of the mineral saturation index (Supplementary Table S1), the values of rock salt mineral saturation in 2006–2010 and 2011–2016 were −6.70 and −6.73, respectively, which are less than 0. This indicates that the rock salt minerals were unsaturated and that part of Na+ came from rock salt. The dissolution formulas of rock salt and silicate minerals are shown in Eqs 25, 26, respectively:
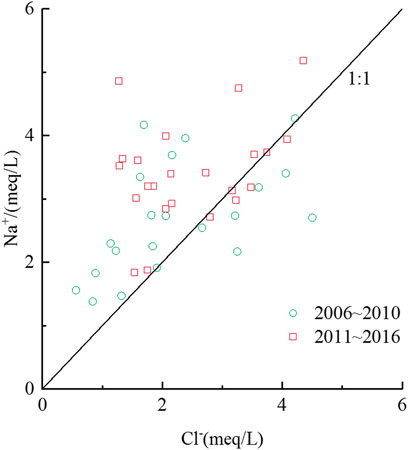
FIGURE 5. Ratio of Na+ to Cl−.
In addition, a small number of water quality monitoring points are located below 1:1, deviating from the 1:1 line, indicating that there may be an increase in the Cl− concentration caused by anthropogenic inputs of chloride.
In the analysis of the sources of Ca2+, the relationship between Ca2+ + Mg2+ and HCO3− + SO42− (Figure 6A) shows that the water quality monitoring points are located on both sides of the 1:1 line, indicating that the sources of Ca2+ and Mg2+ are mainly carbonate and sulphate. At the same time, in further tracing the sources of Ca2+ and Mg2+, it can be known from the ratio of Ca2+ + Mg2+ to HCO3− (Figure 6B) that most of the water quality monitoring points are above the 1:1 line. According to the simulation results in Supplementary Table S1, the mineral saturation values of calcite and dolomite in 2006–2010 and 2011–2016 were 0.14, 0.25 and 0.43, 0.62, respectively. These values are greater than 0, indicating that the two carbonate minerals are in a saturated state. Therefore, the sources of Ca2+ and Mg2+ are not carbonates. In further tracing the source of Ca2+, the relationship between Ca2+ and SO42− was plotted. Figure 6C shows that the ratio of Ca2+ to SO42− is basically greater than one. At the same time, according to the simulation results in Supplementary Table S1, the mineral saturation values of anhydrite and gypsum were −1.92 and −1.70 from 2006 to 2010 and −1.86 and −1.64 from 2011 to 2016, respectively. These values are all less than 0, indicating that sulphate dissolution was an important source of Ca2+. However, the Ca2+/SO42− ratio is higher than the 1:1 line, indicating that, in addition to sulphate, Ca2+ was derived from other exogenous inputs. The dissolution equations of anhydrite and gypsum are shown in Eqs 27, 28, respectively.
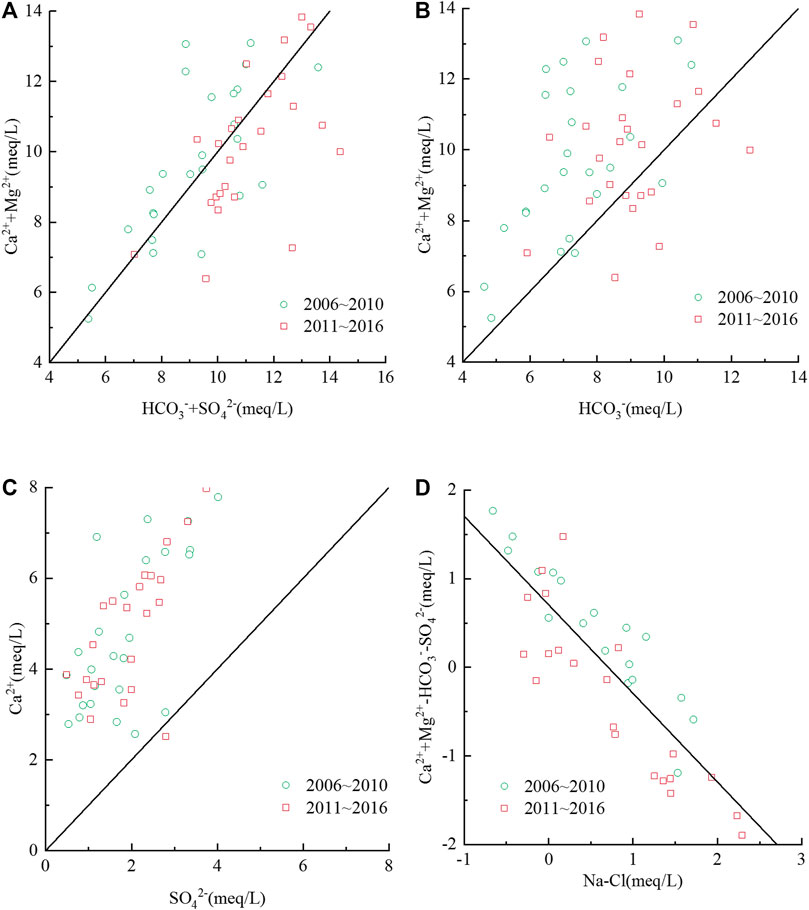
FIGURE 6. Ratio diagram of the ions in the water chemical components in the study area.
In exploring whether ion exchange reactions occurred between Na+ and Ca2+, Mg2+, the ratio of Ca2+ + Mg2+–HCO3−–SO42− to Na+–Cl− (Figure 6D) is around −1, indicating that ion exchange reactions occurred. Meanwhile, the relationship between Ca2+ + Mg2+ and HCO3− + SO42− shows that the average ratios of Ca2+ + Mg2+ and HCO3− + SO42− in 2006–2010 and 2011–2016 are 1.05 and 0.92, respectively. The water quality monitoring points have a downward trend to 1:1, indicating that the exchange reaction of Ca2+ and Mg2+ in 2011–2016 has an increasing trend compared with that in 2006–2010.
4.3 The Spatiotemporal Evolution Trend of the Influence Degrees
A principal component analysis of the shallow groundwater in the study area was conducted to further analyse the dominant factors of the water chemistry evolution in the study area. On the basis of Formulas (1)–(3), the correlation coefficient matrix of the shallow groundwater hydrochemical data was obtained using the SPSS software. As shown in Supplementary Table S2, Ca2+ and SO42− had high positive correlations with NO3−; the correlation coefficients were more than 0.6, indicating that the concentrations of NO3− and Ca2+, SO42− increased or decreased. The higher correlation with HCO3−, Na+, and Mg2+ featured correlation coefficients greater than 0.6, indicating that the NO3− and Ca2+, SO42−, HCO3−, and Na+, Mg2 concentrations increased or decreased.
The principal component analysis of the shallow groundwater in the study area was performed using Formulas (4)–(7). Two principal components (PC1 and PC2) with eigenvalues greater than one were extracted, and their contribution rates were 48.34 and 25.39%, respectively, and the cumulative contribution rate was 73.73%. The load of the principal component score factor is shown in Figure 7. The Piper plot (Figure 1) shows that the anions in the study area are mainly HCO3−, accounting for more than 70% of the anion concentration equivalent, and the minimum spatial variation coefficient is 0.19. Therefore, HCO3− can be used as the dominant factor for identifying natural factors. The spatial variation coefficient of NO3− was the largest relative to those of other indicators, reaching 1.48. With increasing NO3−, the groundwater hydrochemical type and anion and cation components also changed accordingly. So, NO3− can be used as the dominant factor in identifying human factors.
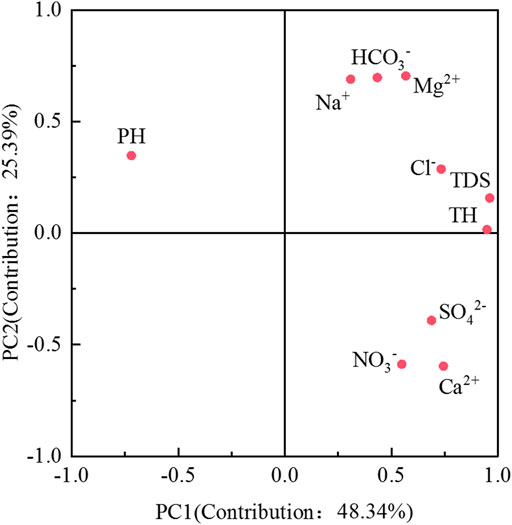
FIGURE 7. Load diagram of the principal component score factor of the water chemistry index in the study area.
According to the principal component score factor load diagram (Figure 7), the maximum positive load scores of PC1 are TDS, TH and Ca2+. Given the two indicators HCO3− and NO3−, the positive load score of PC1 can be used as a comprehensive index of natural and human factors. HCO3−, Mg2+, and Na+ with the highest score of the PC2 positive load chart can be used as the evaluation index for the influence degrees of natural factors. The maximum scores of the PC2 negative load diagram are NO3− and Ca2+, which can be used as evaluation indices for the influence degree of human factors.
According to the identification results of the influencing factors of the hydrochemical evolution, Formula (7) was used to calculate the scores of the human, natural and natural–human factors. The PC2 load was processed positively and the evolution process of the principal component scores with time under the guidance of such three factors was drawn (Figure 8) to facilitate the comparison of data. The score of the comprehensive effect was always greater than that of the natural and human factors, indicating that the evolution process of the water’s chemical components in the study area was always affected by human and natural factors. The scores of the natural and human influences were 2.56 and 1.34, respectively, indicating that the evolution of the groundwater components was always dominated by natural influences. At the same time, the score of the comprehensive effect increased from 3.73 in 2011 to 4.50 in 2016. From 2011 to 2016, the role of natural factors was basically stable. Moreover, the score always fluctuated around 2.80. The score under human influence rose from 1.16 in 2011 to 1.46 in 2016, indicating that the impact of human factors on groundwater chemical composition increased.
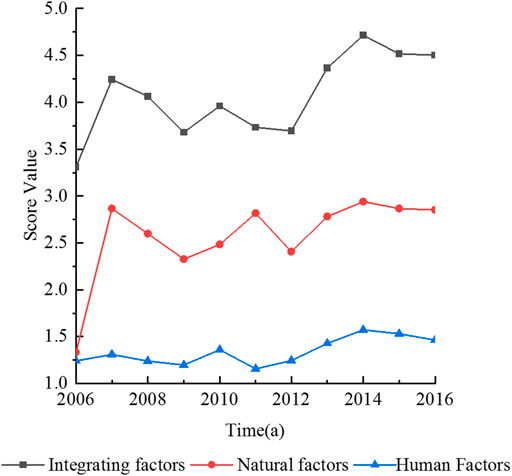
FIGURE 8. Evolution of the principal component scores with time affected by various factors.
The partial connection number method was used to calculate the support degree of the principal component scores of the natural and human factors for each grade to reflect the deep evolution trend of natural and human factors. The classification of the score evaluation grades is shown in Table 2.
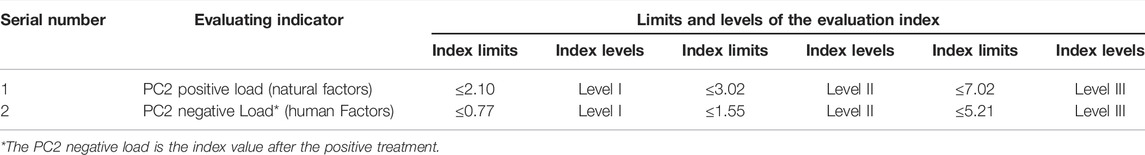
TABLE 2. Principal component score evaluation level under the guidance of various factors.
According to the anthropogenic impact on the spatial distribution of the human influence degree on groundwater chemical components (Figure 9), the northern region with greater influence is mainly located in the Huangcun–Xihongmen–Jiugong–Yizhuang–Yinghai area, which is close to the central urban area of Beijing. In addition, the study area had high degrees of urbanisation and a dense population (Zhai et al., 2015). Furthermore, regional sewage channels such as the Xinfeng River Liangshui River and other rivers in the northern region may have caused groundwater pollution. In contrast, the central and southern regions mainly involve agriculture, so they were relatively less affected by humans.
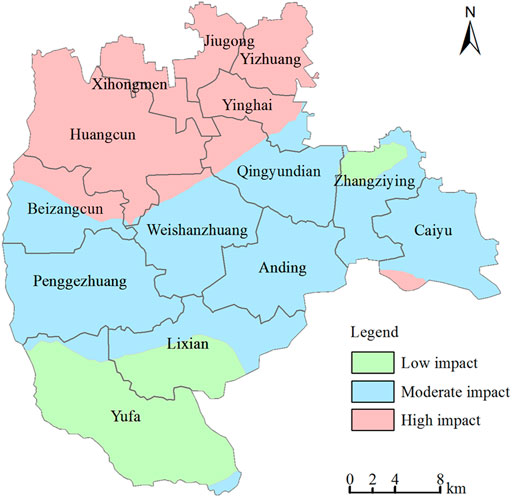
FIGURE 9. Spatial distribution of the influence degree of human factors on the groundwater chemical composition.
According to the calculations of the support degree of each grade under the influence of the partial connection number on human factors (Figure 10), the support degree of Grade 2 was always in a dominant position compared with Grades 1 and 3, indicating that the influence degree of human factors on the groundwater chemical components in the region was basically stable. Besides, the support of Grade 1 is higher than that of Grade 3, but the distance between the support curve of Grade 3 and that of Grade 1 had a decreasing trend since 2012, indicating that the degree of human influence may be further enhanced.
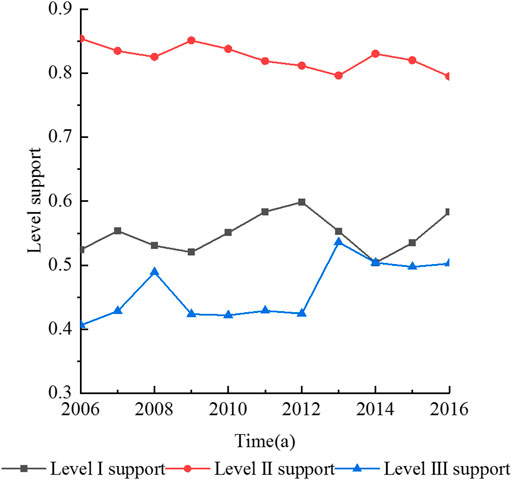
FIGURE 10. Evolution curve of each grade’s support degree under human influence.
From a spatial perspective (Figure 11), the influence of natural factors on the chemical composition of the groundwater in the Yufa, Lixian, Anding, and Caiyu areas in the southern region is greater than those in the northern region and part of the central region. According to the support degree of the partial connection number under the natural influence (Figure 12), the support degree of Grade 2 was much higher than those of Grades 1 and 3, indicating that the influence of natural factors is the same as that of human factors, and it is basically stable. From 2007 to 2012, the Grades 1 and 3 support were basically in a balanced state. Since 2012, the support degree of Grade 3 has been significantly greater than that of Grade 1, indicating that the natural impact has increased. It may have been caused by the continuous overexploitation of groundwater in the study area and the continuous decline of the water level, which has changed the regional groundwater environment. On the one hand, the longer supply path of atmospheric precipitation leads to mineral intensification leaching in the vadose zone. On the other hand, with the decline of the water level, some aquifers become aeration zones, and the redox environment in the strata changes greatly. Some insoluble substances become soluble substances because of the increase in oxygen content, which leads to the deterioration of the groundwater environment.
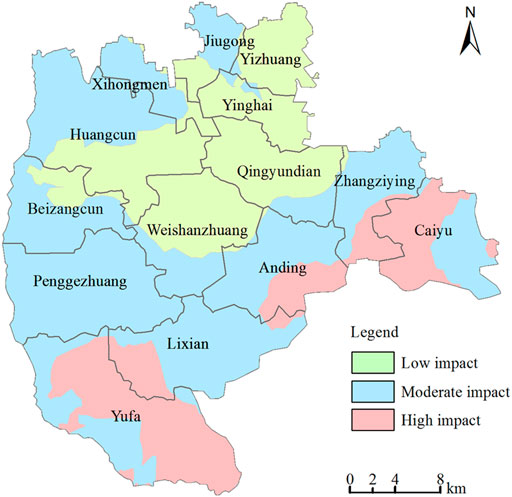
FIGURE 11. Spatial distribution of the natural factors’ influence degree on the groundwater chemical composition.
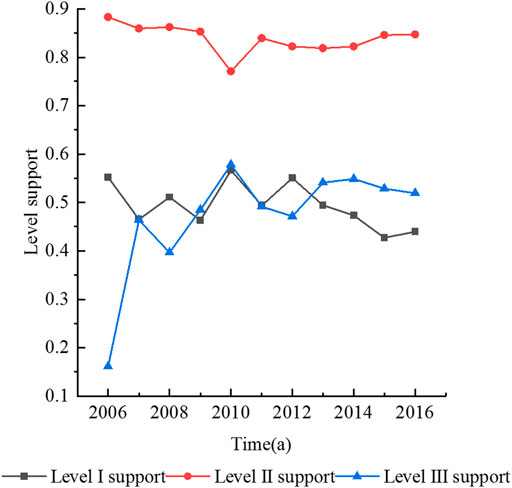
FIGURE 12. Evolution curve of the support degree under natural factors.
5 Conclusion
In order to understand the effects of natural and human factors on the chemical composition of groundwater in the process of rapid urbanization. The Daxing District, a typical area in the Beijing Plain, was taken as the research object in this paper. By collecting monitoring data on the shallow groundwater quality from 2006 to 2016, the spatiotemporal evolution trend of the groundwater’s chemical characteristics and influencing factors were studied using the Piper three-line diagram, Gibbs diagram, ion combination ratio method, variation coefficient method, principal component–partial correlation method and other methods. The main conclusions are as follows:
1) From 2006 to 2016, the total cation concentration, total anion concentration, TDS and TH of the shallow groundwater in the study area showed an upward trend over time. The average concentration of NO3− had a little change, but NO3− in the groundwater pollution range had an increasing trend. At the same time, according to the calculation results of each ion variation coefficient, the maximum coefficient of variation was that of NO3− (1.48), indicating that it was mainly affected by human factors. The variation coefficient of HCO3− was 0.19, which indicated that it was mainly affected by natural factors.
2) The water chemical types in the study area from 2006 to 2016 were still mainly HCO3–Ca water. However, with the increased NO3− concentrations, the main cation and anion components changed accordingly, showing an evolution trend from HCO3–Ca-type to Cl–Mg·Ca-type. The change in the NO3− concentration profoundly affected the component evolution of the groundwater.
3) The regions greatly affected by natural factors were those in the south, whereas the northern and central regions were relatively less affected by natural factors. The areas most affected by human factors were those in the north, mainly in areas with higher urbanisation, followed by the central and southern regions. The influence of human and natural factors on the groundwater chemical composition was highly correlated with regional urbanisation and industrial distribution. The southern region was mainly dominated by agricultural planting, whereas the northern region was relatively developed in industry and commerce with a high degree of urbanisation.
In the process of urbanisation, human factors greatly impact the groundwater environment, especially regarding the input of NO3− into shallow groundwater. This leads to the increase in NO3− concentrations in aquifers, which profoundly affects the evolution of water chemical components and types. Therefore, corresponding measures should be taken to ensure the safety of the regional water supply.
1) Aiming at areas with high regional permeability or shallow groundwater depth, engaging in polluting industries must be strictly forbidden. The regional municipal sewage drainage facilities should be further improved. For example, domestic sewage should be collected and treated. Meanwhile, the direct discharge of domestic sewage into surface water must be prohibited. Because of the lack of surface water in the southern plains of Beijing, the water in the existing rivers is basically from treated reclaimed water in the central urban area. The concentration of NO3− and salt in the reclaimed water is higher than that in natural water, which also affects the groundwater in the region (Xiao et al., 2017; Yin et al., 2019). Therefore, relevant departments must strictly follow relevant standards in treating urban sewage to reduce its impact on groundwater aquifers.
2) According to the spatial distribution of the main controlling factors affecting the evolution of the groundwater components, corresponding groundwater protection measures and industrial layout schemes should be formulated. The groundwater quality in the region is affected by both domestic sewage and industrial wastewater due to the high degree of urbanisation. Domestic pollution sources show an increasing trend with increasing population, but the main pollution source is still industrial pollution. Thus, heavy-groundwater-pollution industries and high-water-consumption industries should be gradually withdrawn to give way to the construction, expansion and technical transformation of industrial industries that meet the requirements for the prevention and control of groundwater pollution to prevent enterprises with serious groundwater pollution from moving to rural areas and control groundwater pollution from the source. On another note, agricultural planting is the main factor for regions where natural factors have great influence. Therefore, the efficient utilisation and recycling of agricultural resources such as chemical fertilisers, pesticides, straws and livestock manure should be comprehensively promoted to encourage cleaner agricultural production and reduce the impacts on groundwater quality.
Data Availability Statement
The original contributions presented in the study are included in the article/Supplementary Materials, further inquiries can be directed to the corresponding author.
Author Contributions
Conceptualization, S-YY and B-HM; methodology, CL; software, CL; validation, CL; for-mal analysis, CL; investigation, CL; resources, CL; data curation, CL; writing—original draft preparation, CL; writing—review and editing, CL; visualization, CL; supervision, B-HM and S-YY; project administration, S-YY and B-HM; funding acquisition, S-YY; All authors have read and agreed to the published version of the manuscript.
Funding
This work was supported by the Central University Fund of China (2019MS028) and the National Key Research and Development Program of China (2016YFC0401406).
Conflict of Interest
The authors declare that the research was conducted in the absence of any commercial or financial relationships that could be construed as a potential conflict of interest.
Publisher’s Note
All claims expressed in this article are solely those of the authors and do not necessarily represent those of their affiliated organizations, or those of the publisher, the editors and the reviewers. Any product that may be evaluated in this article, or claim that may be made by its manufacturer, is not guaranteed or endorsed by the publisher.
Acknowledgments
Thanks for the support of the above funding and the laboratory of College of water re-sources and hydropower engineering, North China Electric Power University.
Supplementary Material
The Supplementary Material for this article can be found online at: https://www.frontiersin.org/articles/10.3389/fenvs.2022.913542/full#supplementary-material
References
Adimalla, N., and Qian, H. (2019). Groundwater Quality Evaluation Using Water Quality Index (WQI) for Drinking Purposes and Human Health Risk (HHR) Assessment in an Agricultural Region of Nanganur, South India. Ecotoxicol. Environ. Saf. 176, 153–161. doi:10.1016/j.ecoenv.2019.03.066
Adimalla, N., and Li, P. (2019). Occurrence, Health Risks, and Geochemical Mechanisms of Fluoride and Nitrate in Groundwater of the Rock-Dominant Semi-arid Region, Telangana State, India. Hum. Ecol. Risk Assess. Int. J. 25 (1-2SI), 81–103. doi:10.1080/10807039.2018.1480353
Arunprakash, M., Giridharan, L., Krishnamurthy, R. R., and Jayaprakash, M. (2014). Impact of Urbanization in Groundwater of South Chennai City, Tamil Nadu, India. Environ. Earth Sci. 71 (2), 947–957. doi:10.1007/s12665-013-2496-7
Baojing, G., Ying, G., Scott, X. C., Weidong, L., and Jie, C. (2013). Nitrate in Groundwater of China: Sources and Driving Forces. Glob. Environ. Change 23 (5), 1112–1121. doi:10.1016/j.gloenvcha.2013.05.004
Busico, G., Kazakis, N., Cuoco, E., Colombani, N., Tedesco, D., Voudouris, K., et al. (2020). A Novel Hybrid Method of Specific Vulnerability to Anthropogenic Pollution Using Multivariate Statistical and Regression Analyses. Water Res. 171, 115386. doi:10.1016/j.watres.2019.115386
Diamantopoulou, P., and Voudouris, K. (2008). Optimization of Water Resources Management Using SWOT Analysis: the Case of Zakynthos Island, Ionian Sea, Greece. Environ. Geol. 54 (1), 197–211. doi:10.1007/s00254-007-0808-5
He, X., Qian, J., Liu, Z., Lu, Y., Ma, L., Zhao, W., et al. (2017). Temporal-spatial Evolution of Groundwater Nitrogen Pollution over Seven Years in a Highly Urbanized City in the Southern China. Bull. Environ. Contam. Toxicol. 99 (6), 753–759. doi:10.1007/s00128-017-2187-2
Hu, L., Dai, K., Xing, C., Li, Z., Tomás, R., Clark, B., et al. (2019). Land Subsidence in Beijing and its Relationship with Geological Faults Revealed by Sentinel-1 InSAR Observations. Int. J. Appl. Earth Obs. Geoinf. 82, 101886. doi:10.1016/j.jag.2019.05.019
Huang, G., Sun, J., Zhang, Y., Chen, Z., and Liu, F. (2013). Impact of Anthropogenic and Natural Processes on the Evolution of Groundwater Chemistry in a Rapidly Urbanized Coastal Area, South China. Sci. Total Environ. 463-464, 209–221. doi:10.1016/j.scitotenv.2013.05.078
Huang, Y., Nian, P., and Zhang, W. (2015). The Prediction of Interregional Land Use Differences in Beijing: A Markov Model. Environ. Earth Sci. 73 (8), 4077–4090. doi:10.1007/s12665-014-3693-8
Ji, Y., Wu, J., Wang, Y., Elumalai, V., and Subramani, T. (2020). Seasonal Variation of Drinking Water Quality and Human Health Risk Assessment in Hancheng City of Guanzhong Plain, China. Expo. Health 12 (3SI), 469–485. doi:10.1007/s12403-020-00357-6
Ji, Z., Cui, Y., Zhang, S., Chao, W., and Shao, J. (2021). Evaluation of the Impact of Ecological Water Supplement on Groundwater Restoration Based on Numerical Simulation: A Case Study in the Section of Yongding River, Beijing Plain. Water 13 (21), 3059. doi:10.3390/W13213059
Jia, Z., Bian, J., and Wang, Y. (2018). Impacts of Urban Land Use on the Spatial Distribution of Groundwater Pollution, Harbin City, Northeast China. J. Contam. Hydrol. 215, 29–38. doi:10.1016/j.jconhyd.2018.06.005
Li, J., Shi, Z., Wang, G., and Liu, F. (2020a). Evaluating Spatiotemporal Variations of Groundwater Quality in Northeast Beijing by Self-Organizing Map. Water 12 (5), 1382. doi:10.3390/w12051382
Li, J., Wang, Y., Zhu, C., Xue, X., Qian, K., Xie, X., et al. (2020b). Hydrogeochemical Processes Controlling the Mobilization and Enrichment of Fluoride in Groundwater of the North China Plain. Sci. Total Environ. 730, 138877. doi:10.1016/j.scitotenv.2020.138877
Li, M. Z., Zhai, Y. Z., Zhou, J., and Wang, J. S. (2013). Hydrochemical Characteristics and Water Quality Assessment of Groundwater in Daxing District of Beijing, China. Appl. Mech. Mater. 295-298, 696–700. doi:10.4028/www.scientific.net/AMM.295-298.696
Li, P., He, X., and Guo, W. (2019). Spatial Groundwater Quality and Potential Health Risks Due to Nitrate Ingestion through Drinking Water: A Case Study in Yan'an City on the Loess Plateau of Northwest China. Hum. Ecol. Risk Assess. 25 (1-2SI), 11–31. doi:10.1080/10807039.2018.1553612
Li, P., Wu, J., Qian, H., Zhang, Y., Yang, N., Jing, L., et al. (2016). Hydrogeochemical Characterization of Groundwater in and Around a Wastewater Irrigated Forest in the Southeastern Edge of the Tengger Desert, Northwest China. Expo. Health 8 (3), 331–348. doi:10.1007/s12403-016-0193-y
Li, Z., Jin, J., Cui, Y., Zhang, L., Wu, C., Ning, S., et al. (2022). Dynamic Evaluation of Regional Water Resources Carrying Capacity Based on Set Pair Analysis and Partial Connection Number. Water Supply 22 (3), 2407–2423. doi:10.2166/ws.2021.371
Lianne, M., Lalita, B., Tasha, E., Cheryl, L. W., and Yu-Pin, L. (2017). Use of Principal Components Analysis and Kriging to Predict Groundwater-Sourced Rural Drinking Water Quality in Saskatchewan. Int. J. Environ. Res. Public Health 14 (9), 1065. doi:10.3390/ijerph14091065
Liu, J., Jin, D., Wang, T., Gao, M., Yang, J., and Wang, Q. (2019). Hydrogeochemical Processes and Quality Assessment of Shallow Groundwater in Chenqi Coalfield, Inner Mongolia, China. Environ. Earth Sci. 78 (12), 347. doi:10.1007/s12665-019-8355-4
Ma, Z., Fang, Z., Xie, X., Chai, F., and Zhang, Q. (2015). Study on Feature Storage and Storage Capacity of Underground Reservoir Based on GMS in MHS Area of Beijing, China. Arab. J. Geosci. 8 (12), 10359–10369. doi:10.1007/s12517-015-1990-5
Maria, L. C., Eduardo, D. A. C., Aníbal, D. F. S., Rodrigo, D. A. C., and Marcos, D. F. M. S. (2012). Evaluation of the Influence of Natural and Antrhopogenic Processes on Water Quality in Karstic Region. Water Air Soil Pollut. 223 (5), 2157–2168. doi:10.1007/s11270-011-1012-5
Martín, D. C. M. A., Esteller, M. V., Expósito, J. L., and Hirata, R. (2014). Impacts of Urbanization on Groundwater Hydrodynamics and Hydrochemistry of the Toluca Valley Aquifer (Mexico). Environ. Monit. Assess. 186 (5), 2979–2999. doi:10.1007/s10661-013-3595-3
Podgorski, J., and Berg, M. (2020). Global Threat of Arsenic in Groundwater. Science 368 (6493), 845–850. doi:10.1126/science.aba1510
Qin, H., Andrews, C. B., Tian, F., Cao, G., Luo, Y., Liu, J., et al. (2018). Groundwater-pumping Optimization for Land-Subsidence Control in Beijing Plain, China. Hydrogeol. J. 26 (4), 1061–1081. doi:10.1007/s10040-017-1712-z
Qin, H. (2021). Numerical Groundwater Modeling and Scenario Analysis of Beijing Plain: Implications for Sustainable Groundwater Management in a Region with Intense Groundwater Depletion. Environ. Earth Sci. 80 (15), 499. doi:10.1007/s12665-021-09795-0
Rao, P. N., Prasad, K. M., Madhusudhan, B. J., Krishna, V., Anand, A., and Madhnure, P. (2016). Impact of Urbanization on Groundwater Quality in Vijayawada Urban Agglomeration, the New Capital Region of Andhra Pradesh, India–A Baseline Study. J. Geol. Soc. India 87 (5), 539–552. doi:10.1007/s12594-016-0428-3
Sarkar, A., Shekhar, S., and Rai, S. P. (2017). Assessment of the Spatial and Temporal Hydrochemical Facies Variation in the Flood Plains of North-West Delhi Using Integrated Approach. Environ. Earth Sci. 76 (19), 665. doi:10.1007/s12665-017-7019-5
Shang, F., Ren, S., Yang, P., Li, C., Xue, Y., and Huang, L. (2016). Modeling the Risk of the Salt for Polluting Groundwater Irrigation with Recycled Water and Ground Water Using HYDRUS-1 D. Water Air Soil Pollut. 227 (6), 189. doi:10.1007/s11270-016-2875-2
Shi, Y., Zheng, X. Q., Sun, Y. B., and Jia, Z. R. (2014). Intra-Urban Migration Patterns in the Perspective of Improved Radiation Model - A Case Study of Beijing. Adv. Mat. Res. 869-870, 110–116. doi:10.4028/www.scientific.net/AMR.869-870.110
Wang, L., and He, Q. (2015). The Evaluation of Groundwater Resources Value of Beijing Based on Emergy Theory. Adv. Mater. Sci. Eng. 2015, 1–9. doi:10.1155/2015/743136
Wu, H., Hu, L., Yang, S., Fan, W., Tian, D., Ren, H., et al. (2019). “Remote Sensing of the Immigration Community Variation in Daxing District, Beijing,” in IGARSS 2019 - 2019 IEEE International Geoscience and Remote Sensing Symposium, Yokohama, Japan, 28 July-2 Aug. 2019, 6352–6355. doi:10.1109/IGARSS.2019.8898878
Xiang, W.-Q., Yang, X.-H., and Li, Y.-Q. (2021). A Set Pair Analysis Model for Suitability Evaluation of Human Settlement Environment. Therm. Sci. 25 (3), 2109–2116. doi:10.2298/TSCI191001095X
Xiao, Y., Gu, X., Yin, S., Pan, X., Shao, J., and Cui, Y. (2017). Investigation of Geochemical Characteristics and Controlling Processes of Groundwater in a Typical Long-Term Reclaimed Water Use Area. Water 9 (10), 800. doi:10.3390/w9100800
Yang, H., and Zhao, K. (2019). The Calculation and Application of Partial Connection Numbers[J]. CAAI Trans. Intelligent Syst. 14 (05), 865–876. doi:10.11992/tis.201810022
Yang, P., Wang, Y., Wu, X., Chang, L., Ham, B., Song, L., et al. (2020). Nitrate Sources and Biogeochemical Processes in Karst Underground Rivers Impacted by Different Anthropogenic Input Characteristics. Environ. Pollut. 265, 114835. doi:10.1016/j.envpol.2020.114835
Yang, Y., Wang, H., Zhao, W., and Yan, J. (2021). Evaluation Model of W Ater Resources Carrying Capacity Based on Set Pair Potential and Partial Connection Number. Adv. Eng. Sci. 53 (03), 99–105. doi:10.15961/j.jsuese.202000629
Yin, S., Xiao, Y., Gu, X., Hao, Q., Liu, H., Hao, Z., et al. (2019). Geostatistical Analysis of Hydrochemical Variations and Nitrate Pollution Causes of Groundwater in an Alluvial Fan Plain. Acta Geophys. 67 (4), 1191–1203. doi:10.1007/s11600-019-00302-5
Zhai, Y., Lei, Y., Zhou, J., Li, M., Wang, J., and Teng, Y. (2015). The Spatial and Seasonal Variability of the Groundwater Chemistry and Quality in the Exploited Aquifer in the Daxing District, Beijing, China. Environ. Monit. Assess. 187 (2), 143. doi:10.1007/s10661-014-4249-9
Zhang, M., Hu, L., Yao, L., and Yin, W. (2018a). Numerical Studies on the Influences of the South-To-North Water Transfer Project on Groundwater Level Changes in the Beijing Plain, China. Hydrol. Process. 32 (12), 1858–1873. doi:10.1002/hyp.13125
Zhang, X., Sun, M., Wang, N., Huo, Z., and Huang, G. (2016). Risk Assessment of Shallow Groundwater Contamination under Irrigation and Fertilization Conditions. Environ. Earth Sci. 75 (7), 603. doi:10.1007/s12665-016-5379-x
Zhang, X., Wu, X., Zhao, R., Mu, W., and Wu, C. (2022). Identifying the Facts and Driving Factors of Deceleration of Groundwater Table Decline in Beijing during 1999-2018. J. Hydrol. 607, 127475. doi:10.1016/j.jhydrol.2022.127475
Zhang, Y., Wu, J., and Xu, B. (2018b). Human Health Risk Assessment of Groundwater Nitrogen Pollution in Jinghui Canal Irrigation Area of the Loess Region, Northwest China. Environ. Earth Sci. 77 (7), 273. doi:10.1007/s12665-018-7456-9
Zhou, L., Guo, J. M., and Li, X. (2015). “Monitoring and Analyzing Surface Subsidence Based on SBAS-InSAR in Beijing Region, China,” in International conference on Intelligent Earth Observing and Applications, Guilin, December 2015, 9808, 98081Y. doi:10.1117/12.2208803
Keywords: groundwater chemical characteristics, groundwater pollution, human factors, Southern Beijing plain, spatiotemporal evolution trend
Citation: Li C, Men B-H and Yin S-Y (2022) Analysis of Groundwater Chemical Characteristics and Spatiotemporal Evolution Trends of Influencing Factors in Southern Beijing Plain. Front. Environ. Sci. 10:913542. doi: 10.3389/fenvs.2022.913542
Received: 05 April 2022; Accepted: 27 April 2022;
Published: 24 May 2022.
Edited by:
Haiyan Liu, East China University of Technology, ChinaReviewed by:
Wei Zheng, China Institute of Water Resources and Hydropower Research, ChinaZhao Yanwei, Beijing Normal University, China
Hongyang Wang, Chinese Research Academy of Environmental Sciences, China
Copyright © 2022 Li, Men and Yin. This is an open-access article distributed under the terms of the Creative Commons Attribution License (CC BY). The use, distribution or reproduction in other forums is permitted, provided the original author(s) and the copyright owner(s) are credited and that the original publication in this journal is cited, in accordance with accepted academic practice. No use, distribution or reproduction is permitted which does not comply with these terms.
*Correspondence: Shi-Yang Yin, eWluc2hpeWFuZ0BuY2VwdS5lZHUuY24=