- School of Statistics and Mathematics, Zhongnan University of Economics and Law, Wuhan, China
Short-term load forecasting plays a significant role in the management of power plants. In this paper, we propose a multivariate adaptive step fruit fly optimization algorithm (MAFOA) to optimize the smoothing parameter of the generalized regression neural network (GRNN) in the short-term power load forecasting. In addition, due to the substantial impact of some external factors including temperature, weather types, and date types on the short-term power load, we take these factors into account and propose an efficient interval partition technique to handle the unstructured data. To verify the performance of MAFOA-GRNN, the power load data are used for empirical analysis in Wuhan City, China. The empirical results demonstrate that the forecasting accuracy of the MAFOA applied to the GRNN outperforms the benchmark methods.
Introduction
It is well known that the role of short-term power load forecasting is increasingly crucial in the management of power plants. Short-term power load forecasting mainly refers to electric load forecasting in the next few hours, 1 day to several days. Accurate short-term power load forecasting can reasonably arrange the operation of units, ensure the safety of operation of the power grids, and improve the economic benefits of power enterprises (Friedrich and Afshari, 2015; Dudek, 2016). On the contrary, inaccurate forecasts will produce unnecessary electricity and result in considerable electrical power system losses (Yang et al., 2017). Hobbs et al. (1999) pointed that the reduction of 1% in load forecasting error of 10,000 MW utility can save up to $1.6 million annually. So, it is of vital importance to achieve high accuracy for short-term power load forecasting nowadays.
With the development of computer technology, the theory of artificial neural networks (ANNs) has been applied in a wide range of fields such as power market, system engineering, and control system (Jiang et al., 2014; Liu et al., 2018; Du et al., 2019; Yang et al., 2022). The forecast of power load considers not only the load but also the factors that affect the load, so the use of ANNs has been highly concerned by researchers. For example, Xuan et al. (2021) combined the convolutional neural network (CNN) and bidirectional gated recurrent unit (Bi-GRU) to forecast the short-term load. In the meantime, the random forest was used to select features. The final result showed that this hybrid method had a higher accuracy. Wang et al. (2020) applied an extreme learning machine model to electricity price forecasting, as well as considering the influence of outliers. The Elman neural network (ENN) model was also used to forecast the electrical power system (Zhen Wang et al., 2018). Abedinia and Amjady (2016) presented a new stochastic search algorithm to find the optimum number of neurons for the hidden layer, and they used the proposed method to predict the power load. They compared the obtained results with those of several other recently published methods, and it confirmed the validity of the developed approach. Lu et al. (2016) used the weighted fuzzy C-means clustering algorithm based on principal component analysis to determine the basis function centers, and they used the gradient descent algorithm to train the output layer weights. The proposed model was implemented on real smart meter data, and simulation results showed that the proposed method had good forecasting accuracy. Ding et al. (2016) applied variable selection and model selection to power load forecast to ensure an optimal generalization capacity of the neural network model, and the results showed that the neural network–based models outperform the time series models.
The generalized regression neural network (GRNN) is a type of ANNs based on mathematical statistics, proposed by Specht (1991). Instead of listing the equations in advance, the network uses a probability density function to predict the output. Therefore, the GRNN has strong non-linear mapping capability and quick learning speed, which is better than the radial basis function neural network. In addition, even if the number of input training samples is small, its output can converge to the optimal value, which is very suitable for solving the problem of non-linearity (Jiang and Chen, 2016; Zhu et al., 2018). It has been applied in a wide range of fields such as prediction of wind speed (Kumar and Malik, 2016), two-dimensional spectral images (Jianzhou Wang et al., 2018), automated emotion detection systems (Talele et al., 2016), short-term load forecasting (Hu et al., 2017), mineral resource estimation (Das Goswami et al., 2017), and the estimation of peak outflow (Sammen et al., 2017). The optimization of smoothing parameter is a crucial step in the application of GRNN. There are a few ways to estimate its value. For example, Agarkar et al. (2016) applied particle swarm optimization (PSO) to the smoothing parameter of GRNN, which reduced the time complexity and produced more accurate results than random selection of spread factor. Gao and Chen (2015) presented an improved GRNN algorithm, using phase space reconstruction to strike GRNN training samples, applying adaptive PSO algorithm to optimize the smoothing parameter. Zhao et al. (2020) applied PSO-GRNN for risk prediction of urban logistics and found that the model can handle the high-frequency influencing factors well. The result showed that PSO-GRNN can better improve the accuracy of prediction than others.
Recently, Pan (2012) proposed a fruit fly optimization algorithm (FOA) to optimize the financial distress model, which was based on the foraging behavior of fruit flies. This algorithm has been effectively applied in a few fields including the dual-resource constrained flexible job-shop scheduling problem (Zheng and Wang, 2016), monthly electricity consumption forecasting (Jiang et al., 2020), multidimensional knapsack problem (Meng and Pan, 2017), seasonal electricity consumption forecasting (Cao and Wu, 2016), joint replenishment problems (Wang et al., 2015), steelmaking casting problem (Li et al., 2018), and optimization of support vector regression (Samadianfard et al., 2019; Zhang and Hong, 2019; Sattari et al., 2021). With the extensive applications of FOA, more and more scholars studied the optimization of this algorithm. Hu et al. (2017) changed the step length of the fruit fly from a constant to a decrement sequence to improve the optimization abilities of FOA, and the empirical results showed that the performance of the proposed algorithm was improved. Pan et al. (2014) introduced a new control parameter that adaptively adjusted the range of search space around the location of the cluster, and the accuracy and convergence speed were improved.
In this paper, we propose a multivariate adaptive step fruit fly optimization algorithm (MAFOA) to optimize the smoothing parameter of GRNN for short-term load forecasting. We make three contributions as follows. Firstly, we consider factors that affect the power load as much as possible, such as temperature, weather type, and date type. Secondly, we propose an efficient interval partition technique to handle the structured and unstructured data. Finally, we improve the selection of step size, which has a multivariate adaptive step and can achieve high adaptability.
The remainder of this paper is organized as follows. FOA and its improvement are presented in The Improvement of Fruit Fly Optimization Algorithm. Improvement of Generalized Regression Neural Network shows the MAFOA-optimized GRNN for short-term load forecasting. We carry out the empirical analysis and compare the proposed model with other models in Empirical Analysis. Finally, the summary of this study is drawn in Conclusion.
The Improvement of Fruit Fly Optimization Algorithm
Considering the problems of local optimum in the ordinary FOA, we propose the MAFOA to optimize the smoothing parameter of GRNN. In this section, we first briefly introduce the ordinary FOA in Fruit Fly Optimization Algorithm, and then we propose the MAFOA in Multivariate Adaptive Step Fruit Fly Algorithm.
Fruit Fly Optimization Algorithm
Fruit fly is a kind of flying insect, which is very sensitive to the external environment because of its superior olfactory and vision. Firstly, the olfactory organ is used to obtain the odor floating in the air. Then, it will distinguish the general direction of the food source and fly to the source of food. Finally, the fruit fly can discover the position of food by its keen vision, and then fly to the position. The process of searching food for the fruit flies can be simulated as follows (Mitić et al., 2015):
1) Randomly initialize the population size, maximal number of iterations, and position coordinates
2) Choose the search radius of the fruit fly. Then, determine the new position coordinates
where
3) Estimate the distance
4) Calculate the smell concentration
5) Find out the best smell concentration
where
6) Determine whether the smell concentration is better than the previous one. If yes, implement step 7; otherwise, repeat the process from step 2 to step 6.
7) Retain the best smell concentration value
8) Determine whether the end condition is reached. If yes, find out the location of the best smell concentration value; otherwise, return to step 2.
Multivariate Adaptive Step Fruit Fly Algorithm
In the ordinary FOA, the individual fruit fly seeks the food source with the pre-set step size. Obviously, if the step size is too small, the search space will be limited, and it will cause the problem of local optimum. On the contrary, if the step size is too large, its local search ability will become weaker, and the convergence rate will slow down. To deal with these issues, the setting of step size should adhere to the following principles. In the initial phase of iterations, the step size should be large to ensure global optimization performance. On the contrary, in the later stage, the step size should be small to ensure local search performance.
Therefore, there are a few successful algorithms for the improvement of step size of fruit flies, such as the decreasing step fruit fly optimization algorithm (DSFOA) (Hu et al., 2017), self-adaptive step fruit fly optimization algorithm (FFOA) (Yu et al., 2016), and improved fruit fly optimization algorithm (IFFO) (Pan et al., 2014). In the DSFOA and IFFO, the step size decreased quickly in the initial phase of iteration, which cannot guarantee the global optimization performance of the algorithm. In this paper, we propose the multivariate adaptive step size, which can be demonstrated as follows:
where
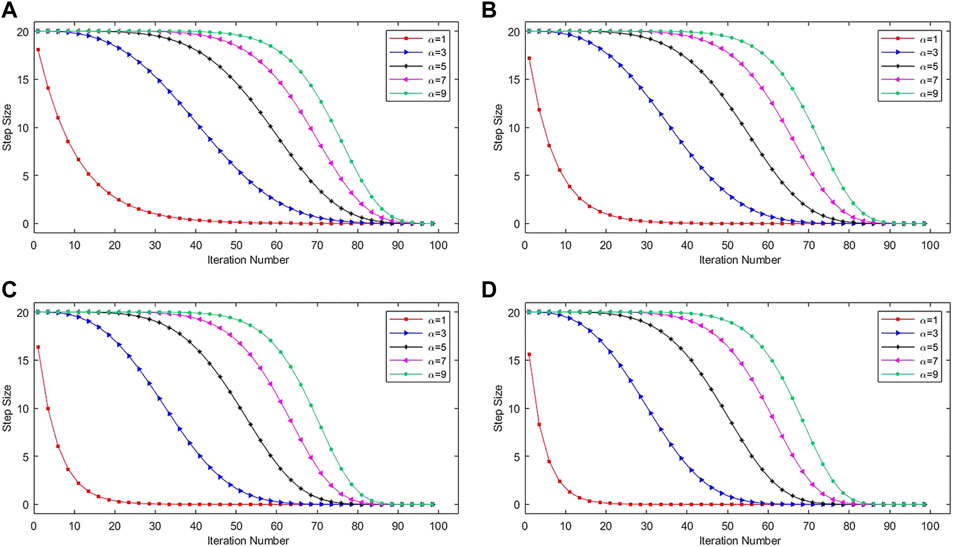
FIGURE 1. Multivariate adaptive step size corresponding to different values of N and
As shown in Figure 1, the step size decreases gradually from 20 to 0 with the increasing iteration number and different values of
Besides, from the subfigures in Figure 1, the step size changes relatively symmetrical when
Improvement of Generalized Regression Neural Network
Generalized Regression Neural Network
The GRNN is a kind of neural network using the radial basis function and has been very popular in applications in recent years. It can establish the implicit mapping relationship according to the sample data, so that the output can converge the optimal regression surface. Once the sample is determined, the only goal is the determination of smoothing parameter in the kernel function (Ozturk and Turan, 2012; Kumar and Malik, 2016).
Assuming that
Based on the Parzen non-parametric estimation, the density function
where
Substituting Eq. 10 into Eq. 9 yields
Note that
The predicted value in Eq. 14 is the weighted sum of the observations of the dependent variable, and the weights are
Optimization of Generalized Regression Neural Network Based on Multivariate Adaptive Step Fruit Fly Optimization Algorithm
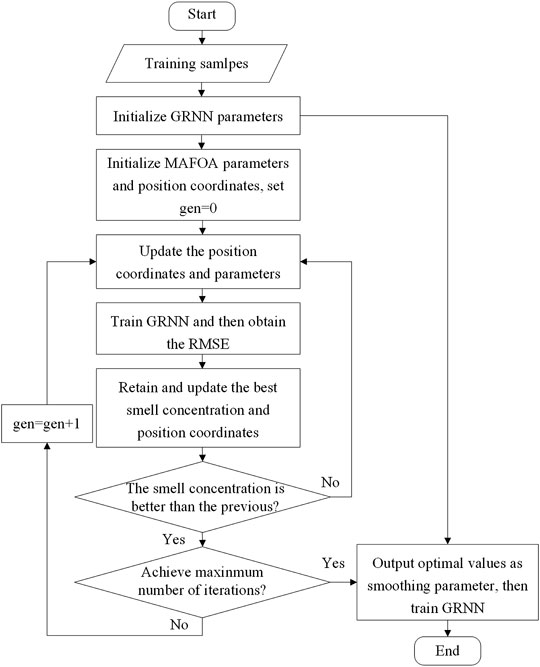
In this paper, the MAFOA is applied to optimize the smoothing parameters in the GRNN. The MAFOA-GRNN takes the root mean square error (RMSE) of GRNN as the fitness function of MAFOA, so as to calculate the smell concentration in each iteration. Part of the training data are used in the MAFOA to select the best parameters for the GRNN. When the algorithm reaches the maximum number of iterations, the location of the fruit fly with best smell concentration is obtained. Then, these optimal parameters will be used in the GRNN to get the optimal prediction model. The flowchart of the MAFOA-GRNN model is shown in Figure 2.
Empirical Analysis
In this section, the power load data in Wuhan are used to test the performance of MAFOA-GRNN. The data description is introduced in Data Description. Then, Data Processing is discussed. The evaluation criteria and empirical results are further discussed in Evaluation Criteria and Experimental Analysis.
Data Description
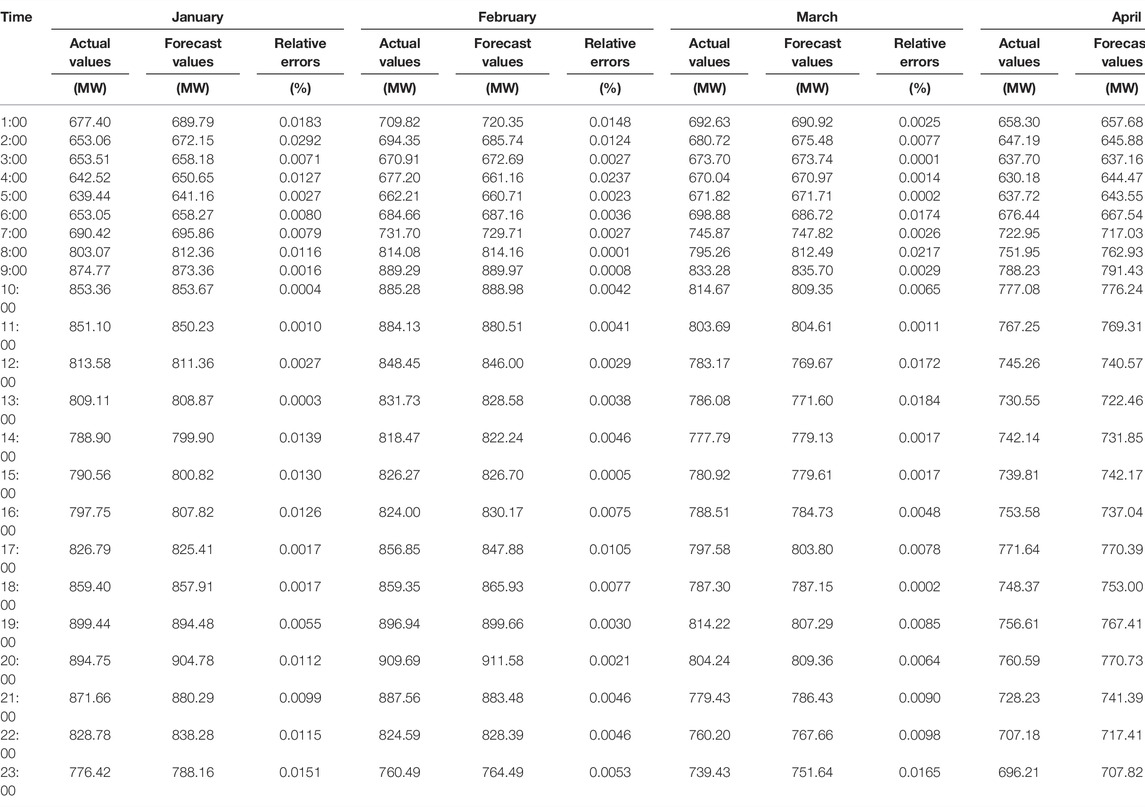
The power load data used in this paper are hourly and obtained from a power grid in Wuhan with 2,880 observations ranging from January 1, 2014, to April 30, 2014, which are shown in Figure 3. In this section, we predict the power load of the last day of each month. The in-sample data are power load data of each month except the last day, and the out-of-sample data are the power load data of the last day of each month.
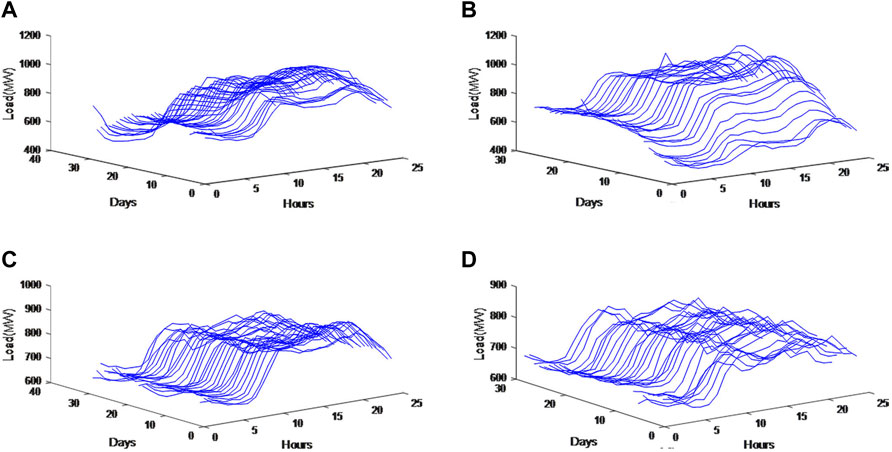
FIGURE 3. Historical power load curve: (A) January 2014, (B) February 2014, (C) March 2014, and (D) April 2014.
As shown in Figure 3, the short-term power load has obvious periodicity. Therefore, historical load data are an important reference for forecasting. In order to accurately predict the power load, the factors influencing the power load should be considered as much as possible. The factors related to load forecasting include date classification (weekday, weekend, holiday), daily temperature (maximum, minimum, average temperature), and weather condition.
Combining the influence factor, the improved GRNN adopts a three-layer network structure. The input variables of the GRNN are shown in Table 1, and the corresponding output vector is the power load value at
Data Processing
The original load data are normalized to eliminate the impact of the dimensions between indicators. In addition, the input variables of GRNN in Table 1 should be numerical data, so we quantify the above weather factors and date type factors. Meanwhile, we propose an efficient interval partition technique to handle temperature and weather types:
1) Normalization of load data. All load data are normalized by using the linear transformation method, given by
where
2) Quantization of temperature. In the previous studies, temperature is standardized by direct standardization (Hu et al., 2017). When the temperature changes in a suitable range, the effect of the load is small. However, when the temperature increases or decreases to a certain extent, the effect on the load will be larger gradually. Therefore, standardization may not be an appropriate choice. In this work, we propose an efficient interval partition technique. The temperature is partitioned by intervals, and different quantitative values are taken according to the situation. For example, when the temperature is 0°C, the temperature is coded as 1; when the temperature is 5°C, the temperature is coded as 0.8. The specific code value can be adjusted within a small range according to the previous prediction result. Therefore, the temperature is partitioned by intervals, as shown in Table 2.
3) Quantization of weather types. The weather types can be divided into six categories, as shown in Table 2, which can affect the power load by influencing the use of lighting equipment and other household appliances. Their corresponding quantized values are also shown in Table 2.
4) Quantization of date types. As a result of the social production modules, the electricity consumption generally shows the alternation of work and rest. The date types can be divided into three categories: weekday (Monday to Friday), weekend (Saturday to Sunday), and holiday (holiday or major event day). On holiday, people often go out to relax or take a rest, which has a substantial impact on the changes in power load. According to the degree of influence on power load, the date type is coded as three categories: weekday is coded as 0, weekend is coded as 0.5, and holiday is coded as 1.
Evaluation Criteria
This paper uses the normalized root mean square error (NRMSE), mean absolute error (MAE), and mean absolute percentage error (MAPE) as the evaluation criteria, given by
where
Although the NRMSE, MAE, and MAPE can be used as criteria to obtain model predicted loss values, it cannot be verified whether the comparison result is statistically significant. To solve this problem, Diebold and Mariano (1994) proposed the Diebold–Mariano (DM) test to test the statistical significance of different prediction models. Assume that model B and model T do the forecasting task in period t at the same time, and we wonder if there are significant differences in the performance between the two models. The original hypothesis is that the forecast accuracy for two models is the same, which is equivalent to the mean value of relative loss function of 0. The DM statistics is defined as follows:
where
is the sample mean loss differential, in which
is the relative loss function, where
Note that, in this paper, the mean-squared prediction error (MSPE) is used as the loss function:
where
is the spectral density of relative loss function at frequency zero.
is the autocovariance of
If the
Experimental Analysis
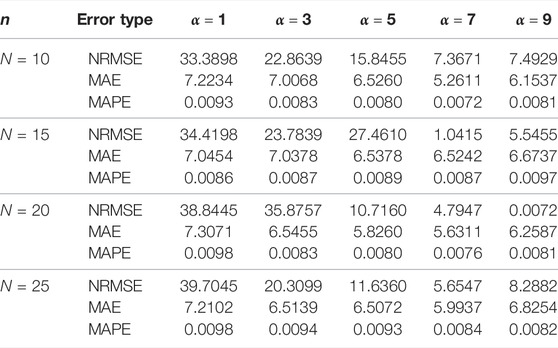
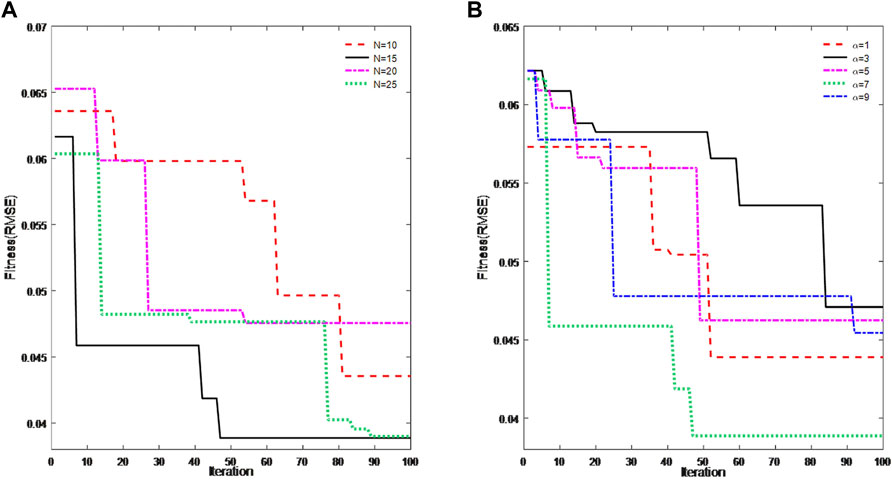
To determine the values of parameters
Table 3 shows the prediction errors for different
Figure 4 provides the fitness variation with the increase of iteration number. Figure 4A shows the convergence situation of different
After choosing
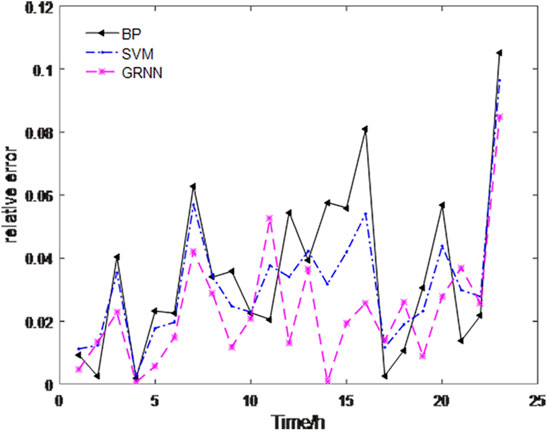
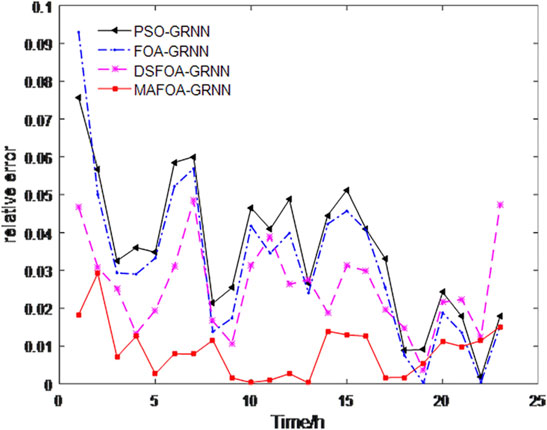
In order to test the forecasting performance of the proposed model, the backpropagation (BP) neural network, support vector machine (SVM), GRNN, PSO-GRNN, FOA-GRNN, and DSFOA-GRNN are regarded as benchmark models to be compared with MAFOA-GRNN in short-term power load forecasting. The PSO was proposed by Kennedy and Eberhart in 1995, which was inspired by the swarm behavior of birds. The FOA proposed by Pan in 2012 was also used in this work. Since PSO and FOA are both classical optimization algorithms that have been widely utilized in research, we have chosen PSO-GRNN and FOA-GRNN as benchmark models. The DSFOA proposed by Hu et al. in 2017 is an improvement algorithm of FOA. With the decreasing step size in mind, the DSFOA performed well in optimizing the spread parameter of GRNN. The flight distance is updated referring to the sigmoid function. So, DSFOA-GRNN has also been compared with our proposed model. Besides, some other basic prediction models are also taken into account, such as the BP neural network and SVM. Figure 5 shows the relative error curves of the single models on January 31. Figure 6 shows the relative error curves of the hybrid models on January 31.
It can be seen from Figure 5 that, in the commonly applied forecasting methods, the GRNN has the best prediction ability. Figure 6 shows that the proposed method can accurately predict the overall trend of power load, and the fitting effect is very good. From the relative error curves, it can be seen that MAFOA-GRNN can offer a better predicting performance and higher precision than DSFOA-GRNN, FOA-GRNN, and GRNN. In addition, the relative errors of MAFOA-GRNN are more stable, and the majority are below 0.02, which demonstrates that the improved FOA is perceived as an ideal method in optimizing model parameters during GRNN training.
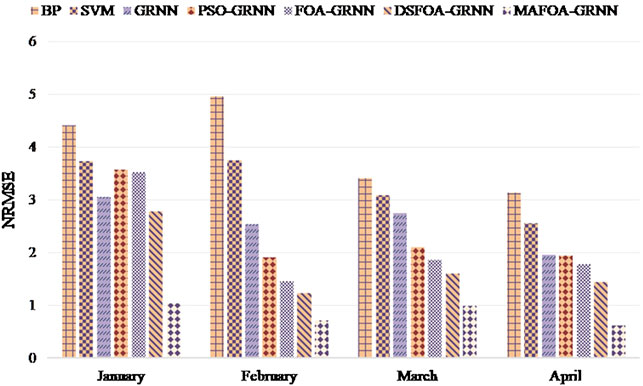
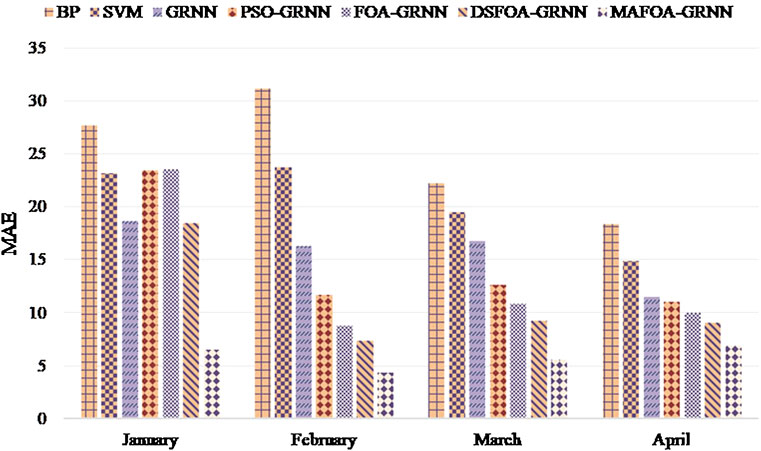
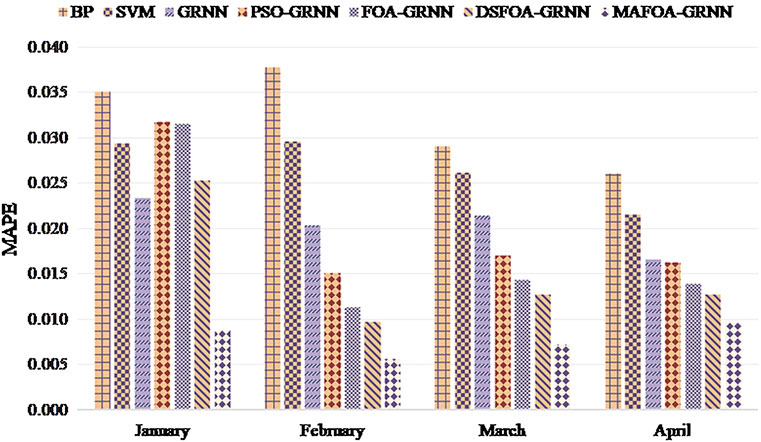
Then, the anti-normalization processing is carried out, and the comparison results of NRMSE, MAE, and MAPE evaluation criteria are shown in Figures 7–9. Table 5 shows the error analysis of the training set and test set.
Obviously, MAFOA-GRNN has the smallest NRMSE, MAE, and MAPE, followed by FOA-GRNN, but the BP neural network has the worst performance. Besides, the prediction error of the training set and test set has no obvious difference, which indicates that MAFOA-GRNN has high generalization performance. According to the comparison results, it can be concluded that MAFOA-GRNN outperforms other models in both accuracy and stability. Table 5 demonstrates the same conclusions as above.
Although the NRMSE, MAE, and MAPE can be used as criteria to obtain model-predicted loss values, it cannot be verified whether the comparison result is statistically significant. To statistically compare the differences between the prediction accuracy of different models, the DM statistics test is carried out in this paper, and the results are shown in Table 6. For all the benchmark models, the values of the MAFOA-GRNN model proposed in this paper are below 0.05, which indicates that the predictive ability of the MAFOA-GRNN model is better than that of DSFOA-GRNN, DSFOA-GRNN, GRNN, SVM, and BP neural network under the confidence interval of 95%.
According to the above comparisons, the following three main conclusions can be summarized:
1) The proposed MAFOA-GRNN outperforms the GRNN, which indicates that the MAFOA can optimize the smoothing parameter of GRNN effectively.
2) The performance of MAFOA-GRNN is better than that of FOA-GRNN, which shows that the multivariate adaptive step can effectively improve the optimization ability of FOA.
3) From January to April 2014, MAFOA-GRNN has reached high prediction accuracy, which shows that the proposed algorithm is a stable and effective forecasting framework.
Conclusion
In this paper, we have proposed MAFOA-GRNN and applied it to short-term load forecasting. Firstly, we discussed a number of external factors including weather types and date types as input variables of the GRNN, in order to optimize the structure of NNs. Then, we propose an efficient interval segmentation technique for temperature types and weather types. Finally, we use the MAFOA to obtain the optimal GRNN model instead of the ordinary FOA, which solves the problem of local optimum in the implementation of FOA. The hybrid model proposed in this paper has a higher accuracy than the BP neural network, SVM, GRNN, PSO-GRNN, FOA-GRNN, and DSFOA-GRNN, and the majority of relative errors are below 0.02.
The proposed models can accurately predict the load of the power system, especially in short-term load forecasting. Electric energy cannot be stored in large quantities, and its generation and consumption are almost completed at the same time. Therefore, in order to arrange the work of power plants economically and reasonably, short-term load forecasting is indispensable. Furthermore, the proposed model can also predict other time series by adjusting the input vector and parameters.
In addition to short-term load forecasting, the proposed MAFOA-GRNN can be applied to solve other complex multivariable problems, including solar radiation forecasting, crude oil price forecasting, and wind load forecasting. Furthermore, the factors considered in this article are limited, and the forecasting performance may be better if other valuable factors are taken into consideration. Finally, further research may improve the performance of proposed model such as training the data of weekdays and holidays separately.
Data Availability Statement
The raw data supporting the conclusion of this article will be made available by the authors, without undue reservation.
Author Contributions
FJ contributed to conception and design of the study. WZ and ZP conducted the data analysis, wrote the original draft, and edited the paper. All authors have read and agreed to the published version of the manuscript.
Funding
This work was supported by the National Natural Science Foundation of China, under grant number 61773401.
Conflict of Interest
The authors declare that the research was conducted in the absence of any commercial or financial relationships that could be construed as a potential conflict of interest.
Publisher’s Note
All claims expressed in this article are solely those of the authors and do not necessarily represent those of their affiliated organizations, or those of the publisher, the editors, and the reviewers. Any product that may be evaluated in this article, or claim that may be made by its manufacturer, is not guaranteed or endorsed by the publisher.
Acknowledgments
The authors are grateful to the reviewers and the editor for their constructive comments and suggestions for this paper.
References
Abedinia, O., and Amjady, N. (2016). Short-term Load Forecast of Electrical Power System by Radial Basis Function Neural Network and New Stochastic Search Algorithm. Int. Trans. Electr. Energ. Syst. 26 (7), 1511–1525. doi:10.1002/etep.2160
Agarkar, P., Hajare, P., and Bawane, N. (2016). “Optimization of Generalized Regression Neural Networks Using PSO and GA for Non-performer Particles,” in Proceeding of the 2016 IEEE International Conference on Recent Trends in Electronics, Information & Communication Technology (RTEICT), Bangalore, India, May 2016 (IEEE), 103–107. doi:10.1109/rteict.2016.7807792
Cao, G., and Wu, L. (2016). Support Vector Regression with Fruit Fly Optimization Algorithm for Seasonal Electricity Consumption Forecasting. Energy 115, 734–745. doi:10.1016/j.energy.2016.09.065
Das Goswami, A., Mishra, M., and Patra, D. (2017). Investigation of General Regression Neural Network Architecture for Grade Estimation of an Indian Iron Ore deposit. Arab J. Geosci. 10 (4) 80. doi:10.1007/s12517-017-2868-5
Diebold, F., and Mariano, R. (1994). Comparing Predictive Accuracy. J. Business Econ. Stat. 20 (1), 134–144. doi:10.3386/t0169
Ding, N., Benoit, C., Foggia, G., Bésanger, Y., and Wurtz, F. (2016). Neural Network-Based Model Design for Short-Term Load Forecast in Distribution Systems. IEEE Trans. Power Syst. 31 (1), 72–81. doi:10.1109/TPWRS.2015.2390132
Du, P., Wang, J., Yang, W., and Niu, T. (2019). A Novel Hybrid Model for Short-Term Wind Power Forecasting. Appl. Soft Comput. 80, 93–106. doi:10.1016/j.asoc.2019.03.035
Dudek, G. (2016). Pattern-based Local Linear Regression Models for Short-Term Load Forecasting. Electric Power Syst. Res. 130, 139–147. doi:10.1016/j.epsr.2015.09.001
Friedrich, L., and Afshari, A. (2015). Short-term Forecasting of the Abu Dhabi Electricity Load Using Multiple Weather Variables. Energ. Proced. 75, 3014–3026. doi:10.1016/j.egypro.2015.07.616
Gao, Z., and Chen, L. (2015). “Sea Clutter Sequences Regression Prediction Based on PSO-GRNN Method,” in Proceeding of the 2015 8th International Symposium on Computational Intelligence and Design (ISCID), Hangzhou, China, Dec. 2015 (IEEE), 72–75. doi:10.1109/iscid.2015.249
Hobbs, B. F., Jitprapaikulsarn, S., Konda, S., Chankong, V., Loparo, K. A., and Maratukulam, D. J. (1999). Analysis of the Value for Unit Commitment of Improved Load Forecasts. IEEE Trans. Power Syst. 14 (4), 1342–1348. doi:10.1109/59.801894
Hu, R., Wen, S., Zeng, Z., and Huang, T. (2017). A Short-Term Power Load Forecasting Model Based on the Generalized Regression Neural Network with Decreasing Step Fruit Fly Optimization Algorithm. Neurocomputing 221, 24–31. doi:10.1016/j.neucom.2016.09.027
Jiang, F., Yang, H., and Shen, Y. (2014). On the Robustness of Global Exponential Stability for Hybrid Neural Networks with Noise and Delay Perturbations. Neural Comput. Applic 24 (7), 1497–1504. doi:10.1007/s00521-013-1374-2
Jiang, P., and Chen, J. (2016). Displacement Prediction of Landslide Based on Generalized Regression Neural Networks with K-fold Cross-Validation. Neurocomputing 198, 40–47. doi:10.1016/j.neucom.2015.08.118
Jiang, W., Wu, X., Gong, Y., Yu, W., and Zhong, X. (2020). Holt-Winters Smoothing Enhanced by Fruit Fly Optimization Algorithm to Forecast Monthly Electricity Consumption. Energy 193, 116779. doi:10.1016/j.energy.2019.116779
Jianzhou Wang, J., Yang, W., Du, P., and Li, Y. (2018). Research and Application of a Hybrid Forecasting Framework Based on Multi-Objective Optimization for Electrical Power System. Energy 148, 59–78. doi:10.1016/j.energy.2018.01.112
Kumar, G., and Malik, H. (2016). Generalized Regression Neural Network Based Wind Speed Prediction Model for Western Region of India. Proced. Comp. Sci. 93, 26–32. doi:10.1016/j.procs.2016.07.177
Li, J., Duan, P., Sang, H., Wang, S., Liu, Z., and Duan, P. (2018). An Efficient Optimization Algorithm for Resource-Constrained Steelmaking Scheduling Problems. IEEE Access 6, 33883–33894. doi:10.1109/ACCESS.2018.2840512
Liu, D., Zhu, S., and Sun, K. (2019). Global Anti-synchronization of Complex-Valued Memristive Neural Networks with Time Delays. IEEE Trans. Cybern. 49 (5), 1735–1747. doi:10.1109/TCYB.2018.2812708
Lu, Y., Zhang, T., Zeng, Z., and Loo, J. (2016). “An Improved RBF Neural Network for Short-Term Load Forecast in Smart Grids,” in Proceeding of the 2016 IEEE International Conference on Communication Systems (ICCS), Shenzhen, China, Dec. 2016 (IEEE), 1–6. doi:10.1109/iccs.2016.7833643
Meng, T., and Pan, Q.-K. (2017). An Improved Fruit Fly Optimization Algorithm for Solving the Multidimensional Knapsack Problem. Appl. Soft Comput. 50, 79–93. doi:10.1016/j.asoc.2016.11.023
Mitić, M., Vuković, N., Petrović, M., and Miljković, Z. (2015). Chaotic Fruit Fly Optimization Algorithm. Knowledge-Based Syst. 89, 446–458. doi:10.1016/j.knosys.2015.08.010
Ozturk, A. U., and Turan, M. E. (2012). Prediction of Effects of Microstructural Phases Using Generalized Regression Neural Network. Construction Building Mater. 29, 279–283. doi:10.1016/j.conbuildmat.2011.10.015
Pan, Q.-K., Sang, H.-Y., Duan, J.-H., and Gao, L. (2014). An Improved Fruit Fly Optimization Algorithm for Continuous Function Optimization Problems. Knowledge-Based Syst. 62, 69–83. doi:10.1016/j.knosys.2014.02.021
Pan, W.-T. (2012). A New Fruit Fly Optimization Algorithm: Taking the Financial Distress Model as an Example. Knowledge-Based Syst. 26, 69–74. doi:10.1016/j.knosys.2011.07.001
Samadianfard, S., Jarhan, S., Salwana, E., Mosavi, A., Shamshirband, S., and Akib, S. (2019). Support Vector Regression Integrated with Fruit Fly Optimization Algorithm for River Flow Forecasting in Lake Urmia Basin. Water 11 (9), 1934. doi:10.3390/w11091934
Sammen, S. S., Mohamed, T. A., Ghazali, A. H., El-Shafie, A. H., and Sidek, L. M. (2017). Generalized Regression Neural Network for Prediction of Peak Outflow from Dam Breach. Water Resour. Manage. 31 (1), 549–562. doi:10.1007/s11269-016-1547-8
Specht, D. F. (1991). A General Regression Neural Network. IEEE Trans. Neural Netw. 2 (6), 568–576. doi:10.1109/72.97934
Taghi Sattari, M., Feizi, H., Samadianfard, S., Falsafian, K., and Salwana, E. (2021). Estimation of Monthly and Seasonal Precipitation: A Comparative Study Using Data-Driven Methods versus Hybrid Approach. Measurement 173, 108512. doi:10.1016/j.measurement.2020.108512
Talele, K., Shirsat, A., Uplenchwar, T., and Tuckley, K. (2016). “Facial Expression Recognition Using General Regression Neural Network,” in Proceeding of the 2016 IEEE Bombay Section Symposium (IBSS), Baramati, India, Dec. 2016 (IEEE), 1–6. doi:10.1109/ibss.2016.7940203
Wang, L., Shi, Y., and Liu, S. (2015). An Improved Fruit Fly Optimization Algorithm and its Application to Joint Replenishment Problems. Expert Syst. Appl. 42 (9), 4310–4323. doi:10.1016/j.eswa.2015.01.048
Wang, J., Yang, W., Du, P., and Niu, T. (2020). Outlier-robust Hybrid Electricity price Forecasting Model for Electricity Market Management. J. Clean. Prod. 249, 119318. doi:10.1016/j.jclepro.2019.119318
Xuan, Y., Si, W., Zhu, J., Sun, Z., Zhao, J., Xu, M., et al. (2021). Multi-Model Fusion Short-Term Load Forecasting Based on Random Forest Feature Selection and Hybrid Neural Network. Ieee Access 9, 69002–69009. doi:10.1109/access.2021.3051337
Yang, W., Wang, J., and Wang, R. (2017). Research and Application of a Novel Hybrid Model Based on Data Selection and Artificial Intelligence Algorithm for Short Term Load Forecasting. Entropy 19 (2), 52. doi:10.3390/e19020052
Yang, W., Sun, S., Hao, Y., and Wang, S. (2022). A Novel Machine Learning-Based Electricity price Forecasting Model Based on Optimal Model Selection Strategy. Energy 238, 121989. doi:10.1016/j.energy.2021.121989
Yu, Y., Li, Y., Li, J., and Gu, X. (2016). Self-adaptive Step Fruit Fly Algorithm Optimized Support Vector Regression Model for Dynamic Response Prediction of Magnetorheological Elastomer Base Isolator. Neurocomputing 211, 41–52. doi:10.1016/j.neucom.2016.02.074
Zhang, Z., and Hong, W.-C. (2019). Electric Load Forecasting by Complete Ensemble Empirical Mode Decomposition Adaptive Noise and Support Vector Regression with Quantum-Based Dragonfly Algorithm. Nonlinear Dyn. 98 (2), 1107–1136. doi:10.1007/s11071-019-05252-7
Zhao, M., Ji, S., and Wei, Z. (2020). Risk Prediction and Risk Factor Analysis of Urban Logistics to Public Security Based on PSO-GRNN Algorithm. Plos One 15 (10), e0238443. doi:10.1371/journal.pone.0238443
Zhen Wang, Z., Yin, Q., Guo, P., and Zheng, X. (2018). “Flux Extraction Based on General Regression Neural Network for Two-Dimensional Spectral Image,” in International Conference on Human-Computer Interaction (Springer), 219–226. doi:10.1007/978-3-319-92270-6_30
Zheng, X.-l., and Wang, L. (2016). A Knowledge-Guided Fruit Fly Optimization Algorithm for Dual Resource Constrained Flexible Job-Shop Scheduling Problem. Int. J. Prod. Res. 54 (18), 5554–5566. doi:10.1080/00207543.2016.1170226
Keywords: power load, multivariate adaptive step, fruit fly optimization algorithm, generalized regression neural network, forecasting
Citation: Jiang F, Zhang W and Peng Z (2022) Multivariate Adaptive Step Fruit Fly Optimization Algorithm Optimized Generalized Regression Neural Network for Short-Term Power Load Forecasting. Front. Environ. Sci. 10:873939. doi: 10.3389/fenvs.2022.873939
Received: 11 February 2022; Accepted: 07 March 2022;
Published: 25 March 2022.
Edited by:
Wendong Yang, Shandong University of Finance and Economics, ChinaReviewed by:
Shiping Wen, University of Technology Sydney, AustraliaHuabin Chen, Nanchang University, China
Copyright © 2022 Jiang, Zhang and Peng. This is an open-access article distributed under the terms of the Creative Commons Attribution License (CC BY). The use, distribution or reproduction in other forums is permitted, provided the original author(s) and the copyright owner(s) are credited and that the original publication in this journal is cited, in accordance with accepted academic practice. No use, distribution or reproduction is permitted which does not comply with these terms.
*Correspondence: Feng Jiang, ZmppYW5nQHp1ZWwuZWR1LmNu
 Feng Jiang
 Wenya Zhang